Article

Damaging Hydrogeological Events: A Procedure for the Assessment of Severity Levels and an Application to Calabria (Southern Italy)

by
Tommaso Caloiero
1,
Angela Aurora Pasqua
2 and
Olga Petrucci
2,*
1
Institute for Agricultural and Forest Systems in Mediterranean (CNR-ISAFOM), National Research Council, Via Cavour 4/6, Rende (Cs) 87036, Italy
2
Research Institute for Geo-Hydrological Protection (CNR-IRPI), National Research Council, Via Cavour 4/6, Rende (Cs) 87036, Italy
*
Author to whom correspondence should be addressed.
Water 2014, 6(12), 3652-3670; https://doi.org/10.3390/w6123652
Submission received: 14 October 2014 / Revised: 10 November 2014 / Accepted: 24 November 2014 / Published: 27 November 2014

Abstract

:
A damaging hydrogeological event (DHE) is characterized by two components: a rainfall event and a subsequent damage event, which is the result of floods and landslides triggered by rainfall. The characteristics of both events depend on climatic, geomorphological and anthropogenic factors. In this paper, a methodology to classify the severity of DHEs is presented. A chart which considers indicators of both the damage (Dscore) and the daily rainfall (Rscore) values recorded in the study area is proposed. According to the chart, the events are classified into four types: ordinary events, with low Dscore and Rscore values; extraordinary events, with high Rscore values but low Dscore values; catastrophic events, characterized by non-exceptional rainfall (low Rscore) and severe damage (high Dscore); major catastrophic events, obtained by both high Dscore and Rscore values. Using this approach, the 2013 DHE that occurred in Calabria (Italy) was classified as an ordinary event, when compared to the previous ones, even though the widespread diffusion of damage data induced the perception of high severity damage. The rainfall that triggered this event confirms the negative trend of heavy daily precipitation detected in Calabria, and the damage can be ascribed more to sub-daily than daily rainfall affecting urbanized flood-prone areas.

1. Introduction

Damaging hydrogeological events (DHEs) are defined as the occurrence of phenomena triggered by rainfall, such as landslides and floods, which cause damage to people and property [1,2,3]. These events can have catastrophic effects [4] or produce more or less severe damage, according to both the socioeconomic context of the affected areas [5,6] and human behaviors.
In some countries, such as Italy, there has been an increase in both the recurrence and the severity of damage caused by rainfall over the last few years. Conventionally, during the past century, DHEs were identified following the year of occurrence (e.g., the flood of 1966); nowadays, the event is identified by means of both the year and the month of occurrence, given that a region can be affected by more than one event per year. Moreover, due to the influence of the mass media, people are inclined to think that current events are triggered by increasingly exceptional rainfall. For example, in Italy, the media have introduced the term bombe d’acqua (literally: water bombs), to label heavy rainfall, and they often tend to amplify the qualitative description of the downpours, even though neither quantitative rainfall data nor a comparison with past events are considered. Nevertheless, it is biased to describe an event as exceptional without any comparison with past ones. One may be reminded of what Rudyard Kipling wrote in [7]: In August was the Jackal born; The Rain fell in September; “Now such a fearful flood as this,” Says he, “I can’t remember!”
Despite the misinformation and the average low awareness on these topics, scientific literature has widely analyzed both rainfall and damage characterizing DHEs.
For example, several studies on rainfall variability have been undertaken using various approaches and obtaining different results. Research carried out in the USA [8,9], Australia [10], New Zealand [11], South Africa [12], the United Kingdom [13], and the Mediterranean Basin [14] has highlighted an increase in both daily rainfall intensity and frequency of extreme rainfall events. Some authors have detected a decrease in total annual rainfall [15,16,17,18,19], although an increase in extreme rainfall has also been evidenced [14]. By contrast, other authors [20,21,22] have detected no significant trends in either the number of extreme rainfall events or in rainfall values. In Calabria (southern Italy), some authors (e.g., [23]), considering an observation period of 100 years, have shown a negative trend in the heavy precipitation events, and an opposite trend in the low precipitation events. Generally, daily precipitation is studied using approaches based on indices, percentiles, thresholds, and extreme values [21,24,25,26]. Two approaches are available when focusing on changes in extreme rainfall. The first considers changes in the daily rainfall distribution tail, namely the magnitude of a fixed percentile or the percentage of seasonal precipitation falling on days with rainfall greater than a fixed percentile [27]. The second one is based on the evaluation of changes in the number of days over a threshold associated with different rainfall categories [28,29]. Several authors (e.g., [30]) have proposed an extreme value approach based on the Gumbel probabilistic model [31], which can be useful to assess the values of the daily rainfall return period.
In order to determine whether damage is currently more frequent/widespread than in the past, one should take into account the effects that intense urbanization, especially in developed countries, has on risk levels, as more and more elements become vulnerable to floods and landslides. There is evidence today that social change and economic development are the main factors responsible for increasing losses from natural disasters [32,33,34]. Risk modifications are quite common on floodplains, especially where people built and/or raise levees to reduce the frequency of flooding. In fact, due to the reduction of flooding frequency, people feel safer, and more intense economic development occurs close to rivers. Human settlements close to rivers become vulnerable to high-consequence and low-probability events [35,36]. Similarly, even landslide risk has increased as a result of urban expansion. In fact, especially in regions with a rugged morphology, the demand of new spaces for urbanization can lead to building houses and infrastructures along unstable slopes, where landslides can occur during/after heavy rainfall [37]. Fortunately, social development increases disaster prevention, which partly reduces the number of casualties and losses: both the total death toll and the number of casualties per event tend to decrease [38]. Nevertheless, the increasing wealth causes relatively greater losses in high-income nations [39]. Higher incomes increase private demand for safety; higher incomes enable individuals (and countries) to respond to risk by employing additional and costly precautionary measures [40]. However, in those countries where concentration of properties is larger than the installation of disaster countermeasures, the relationship between income and vulnerability could even be inverted, especially for disasters whose exposure is related to individual choices, such as floods and landslides. In countries with a GDP per capita below $4,500–$5,500, the death toll resulting from natural disasters appears to increase with income, but it starts to decrease once the GDP of these countries increases above that GDP threshold [41]. Moreover, the incessant flow of virtual real-time information and the media coverage of an event tend to bias our perception of the intensity of that event and to overestimate the amount of damage caused by recent rather than older events. For example, whereas in the past century it would take 24 h for newspapers—the most frequently used damage data sources [42,43,44,45]—to report an event, technological progress has allowed an extremely rapid relay of information from the site of a disaster. Furthermore, in the past, only major events received media coverage and were therefore reported. Data concerning less severe events, instead, were primarily available for the most important towns alone, where local reporters were headquartered. By contrast, today, thanks to the internet and social media, every individual can report an event by posting personal photos, videos, and comments—regardless of the intensity of the event and damage caused.
This paper presents a methodology to assess the severity levels of DHEs, based on both rainfall and damage intensities of the past events that occurred in the study area. Particularly, an application of the methodology to a region of Calabria, Italy is presented, and the assessment of the severity of the DHE that occurred on 19 November 2013 is performed.

2. Materials and Methods

Each DHE is characterized by two components: a rainfall event (RE) and a damage event (DE) resulting from rainfall-triggered phenomena. To assess the relative exceptionality of a DHE, these two components must be investigated, and some indicators of the events’ severity must be introduced in order to compare current events to those already occurred in the area during the past. Currently, a chart obtained by comparing damage/rainfall indicators has been created, which allows easy assessment of the severity of current events by comparing them to those that formerly affected the study area. The main limitation of this approach is that the chart is representative of a specific area, based on its climatic, geological, geomorphological, and anthropogenic characteristics. Nevertheless, this methodology can be applied to every area for which the kind of data described in the following sections are available.

2.1. Damage Data Gathering and Analysis

Information about the damage caused by DHEs is not directly available and it must be specifically collected, as described in previous papers [1,5]. Data sources change according to both the country and the epoch in which the events occurred. For older cases, typical sources are historical archives, newspapers and technical reports. When dealing with printed documents, data gathering requires a careful analysis of huge amounts of documents, and the long-lasting transcription of the outcomes. On the contrary, for the current cases, data are immediately available on the internet and this significantly reduces data acquisition time. Online newspapers and websites dealing with meteorology are among the easiest to consult. Technical agencies publish reports on their websites, and social networks publicize a large amount of pictures and comments about damage events.
Generally, data concern the direct damage, which includes physical effects such as the destruction and the modifications that reduce the functionality of structures, in addition to damage to people (death/injury), buildings and their contents, and vehicles, and all subsequent clean-up and disposal costs. On the contrary, indirect and intangible damages are usually unavailable. Specifically, for past events, the economic figures of direct damage are unavailable or incomplete. By contrast, for current events, media publish loss estimates directly after the event, even if these figures are unreliable due to: (a) assessments being overstated in the hope of mobilizing further emergency aid; (b) the initial evaluation no longer being valid because the loss figures develop as the event evolves [46].
In the proposed methodology, following [47], data mined from the different sources are transcribed in a damage database, in which each record contains the text describing the damage affecting a municipality on a certain date, and this information is then split in a series of fields (event identification, time, damaging phenomena, and damaged elements). These data are then elaborated, aiming at producing four outputs: the first three (a, b, and c) are damage indicators, while the last (d) leads to the identification of the rainfall event that triggered damage:
a)
The index of damaged area (IDA) is an assessment of the percentage of regional area damaged. It is the sum of the area of damaged municipalities divided by the area of the region. It is a proxy of the extent of the effects, because exact delimitations of affected areas are not available;
b)
The damage index (DI) is a relative assessment of direct damage. The damageable elements are sorted into nine types (roads; railways; houses; public buildings; services; productive activities; tourist and sport resorts; hydraulic works; people), and their values ranges from 1 to 10, on an arbitrary scale, while the levels of loss is set as 1 = high, 0.5 = medium and 0.25 = low [47]. The sum of the products of damaged elements by the respective levels of loss is the DI value. For people, the value has been set as 100, and the levels of loss have been set as L1 = more than 10 victims; L2 = 5–10 victims; L3 = less than 5 victims;
c)
The number of victims (NoV) is used as a further indicator of damage severity;
d)
The duration of damage event (dDE) is the number of days between the first and the last day during which, throughout the region, some damage related to rainfall occurred.
The values of IDA and DI have been grouped into four classes, individuated by dividing in four equal intervals the difference between the maximum and the minimum observed values. Concerning the number of victims, the four classes have been set as follows: (1) 0–10 victims; (2) 11–20 victims; (3) 21–50; (4) >50 victims.

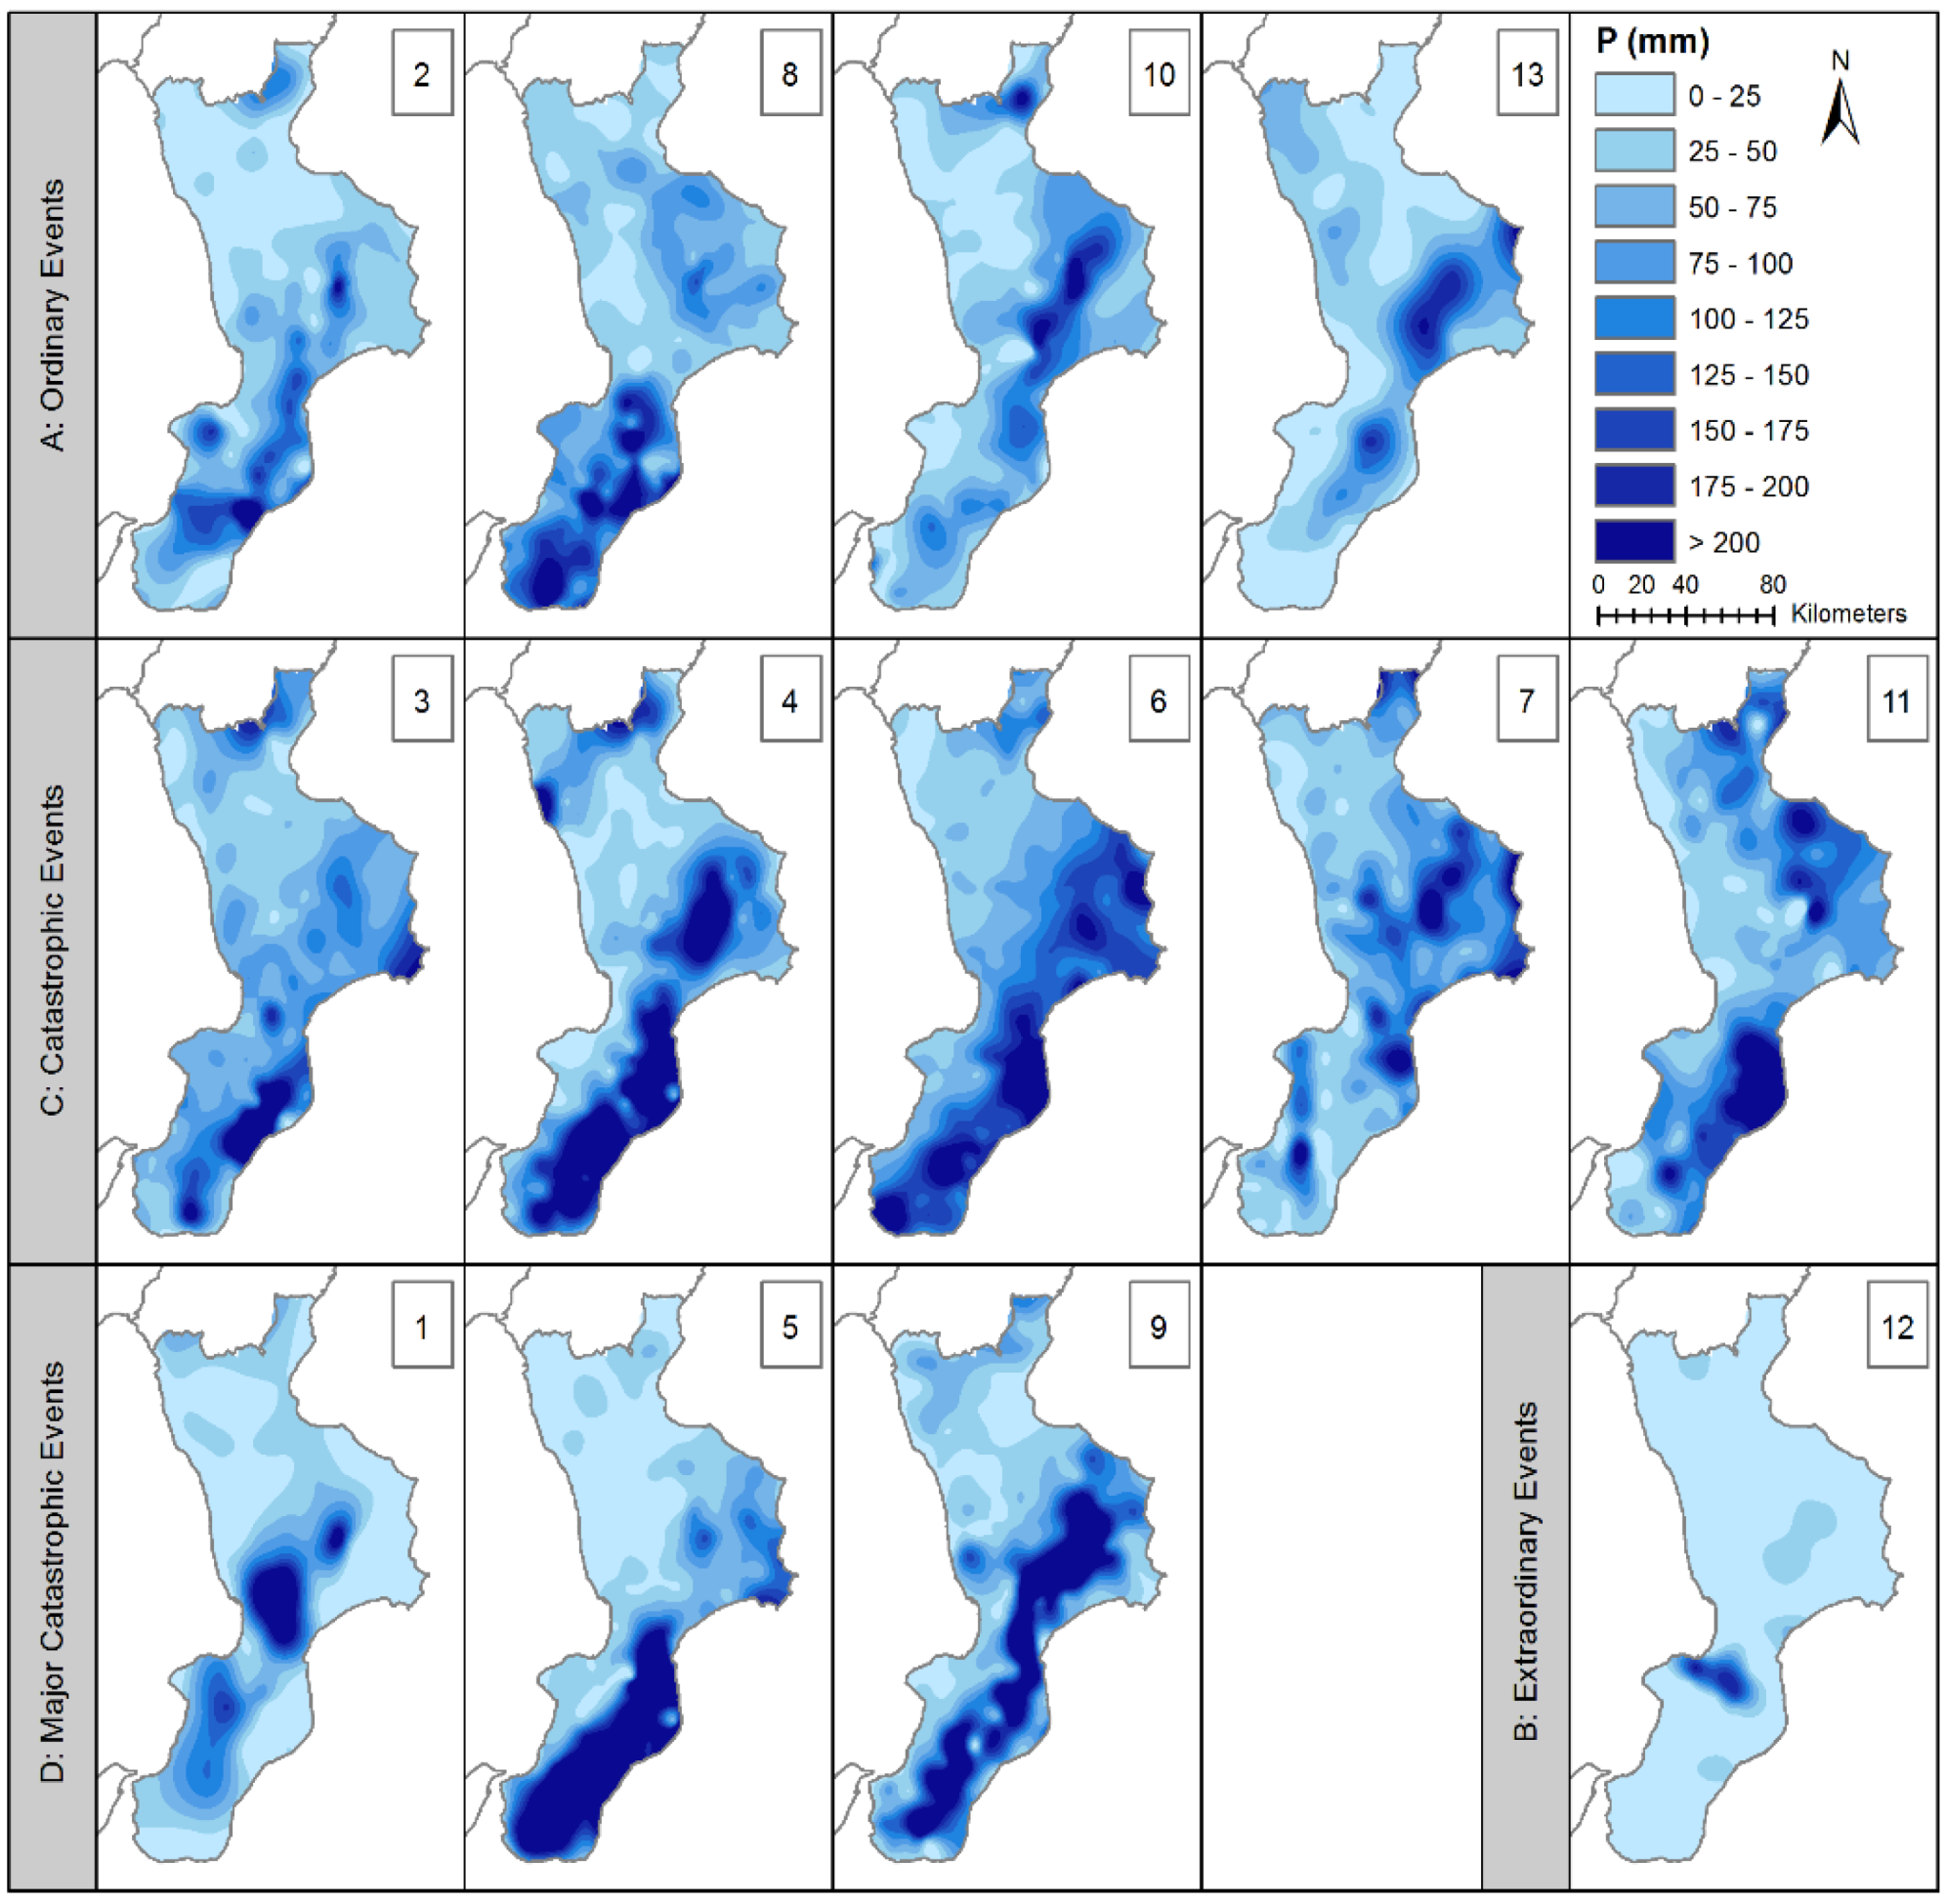
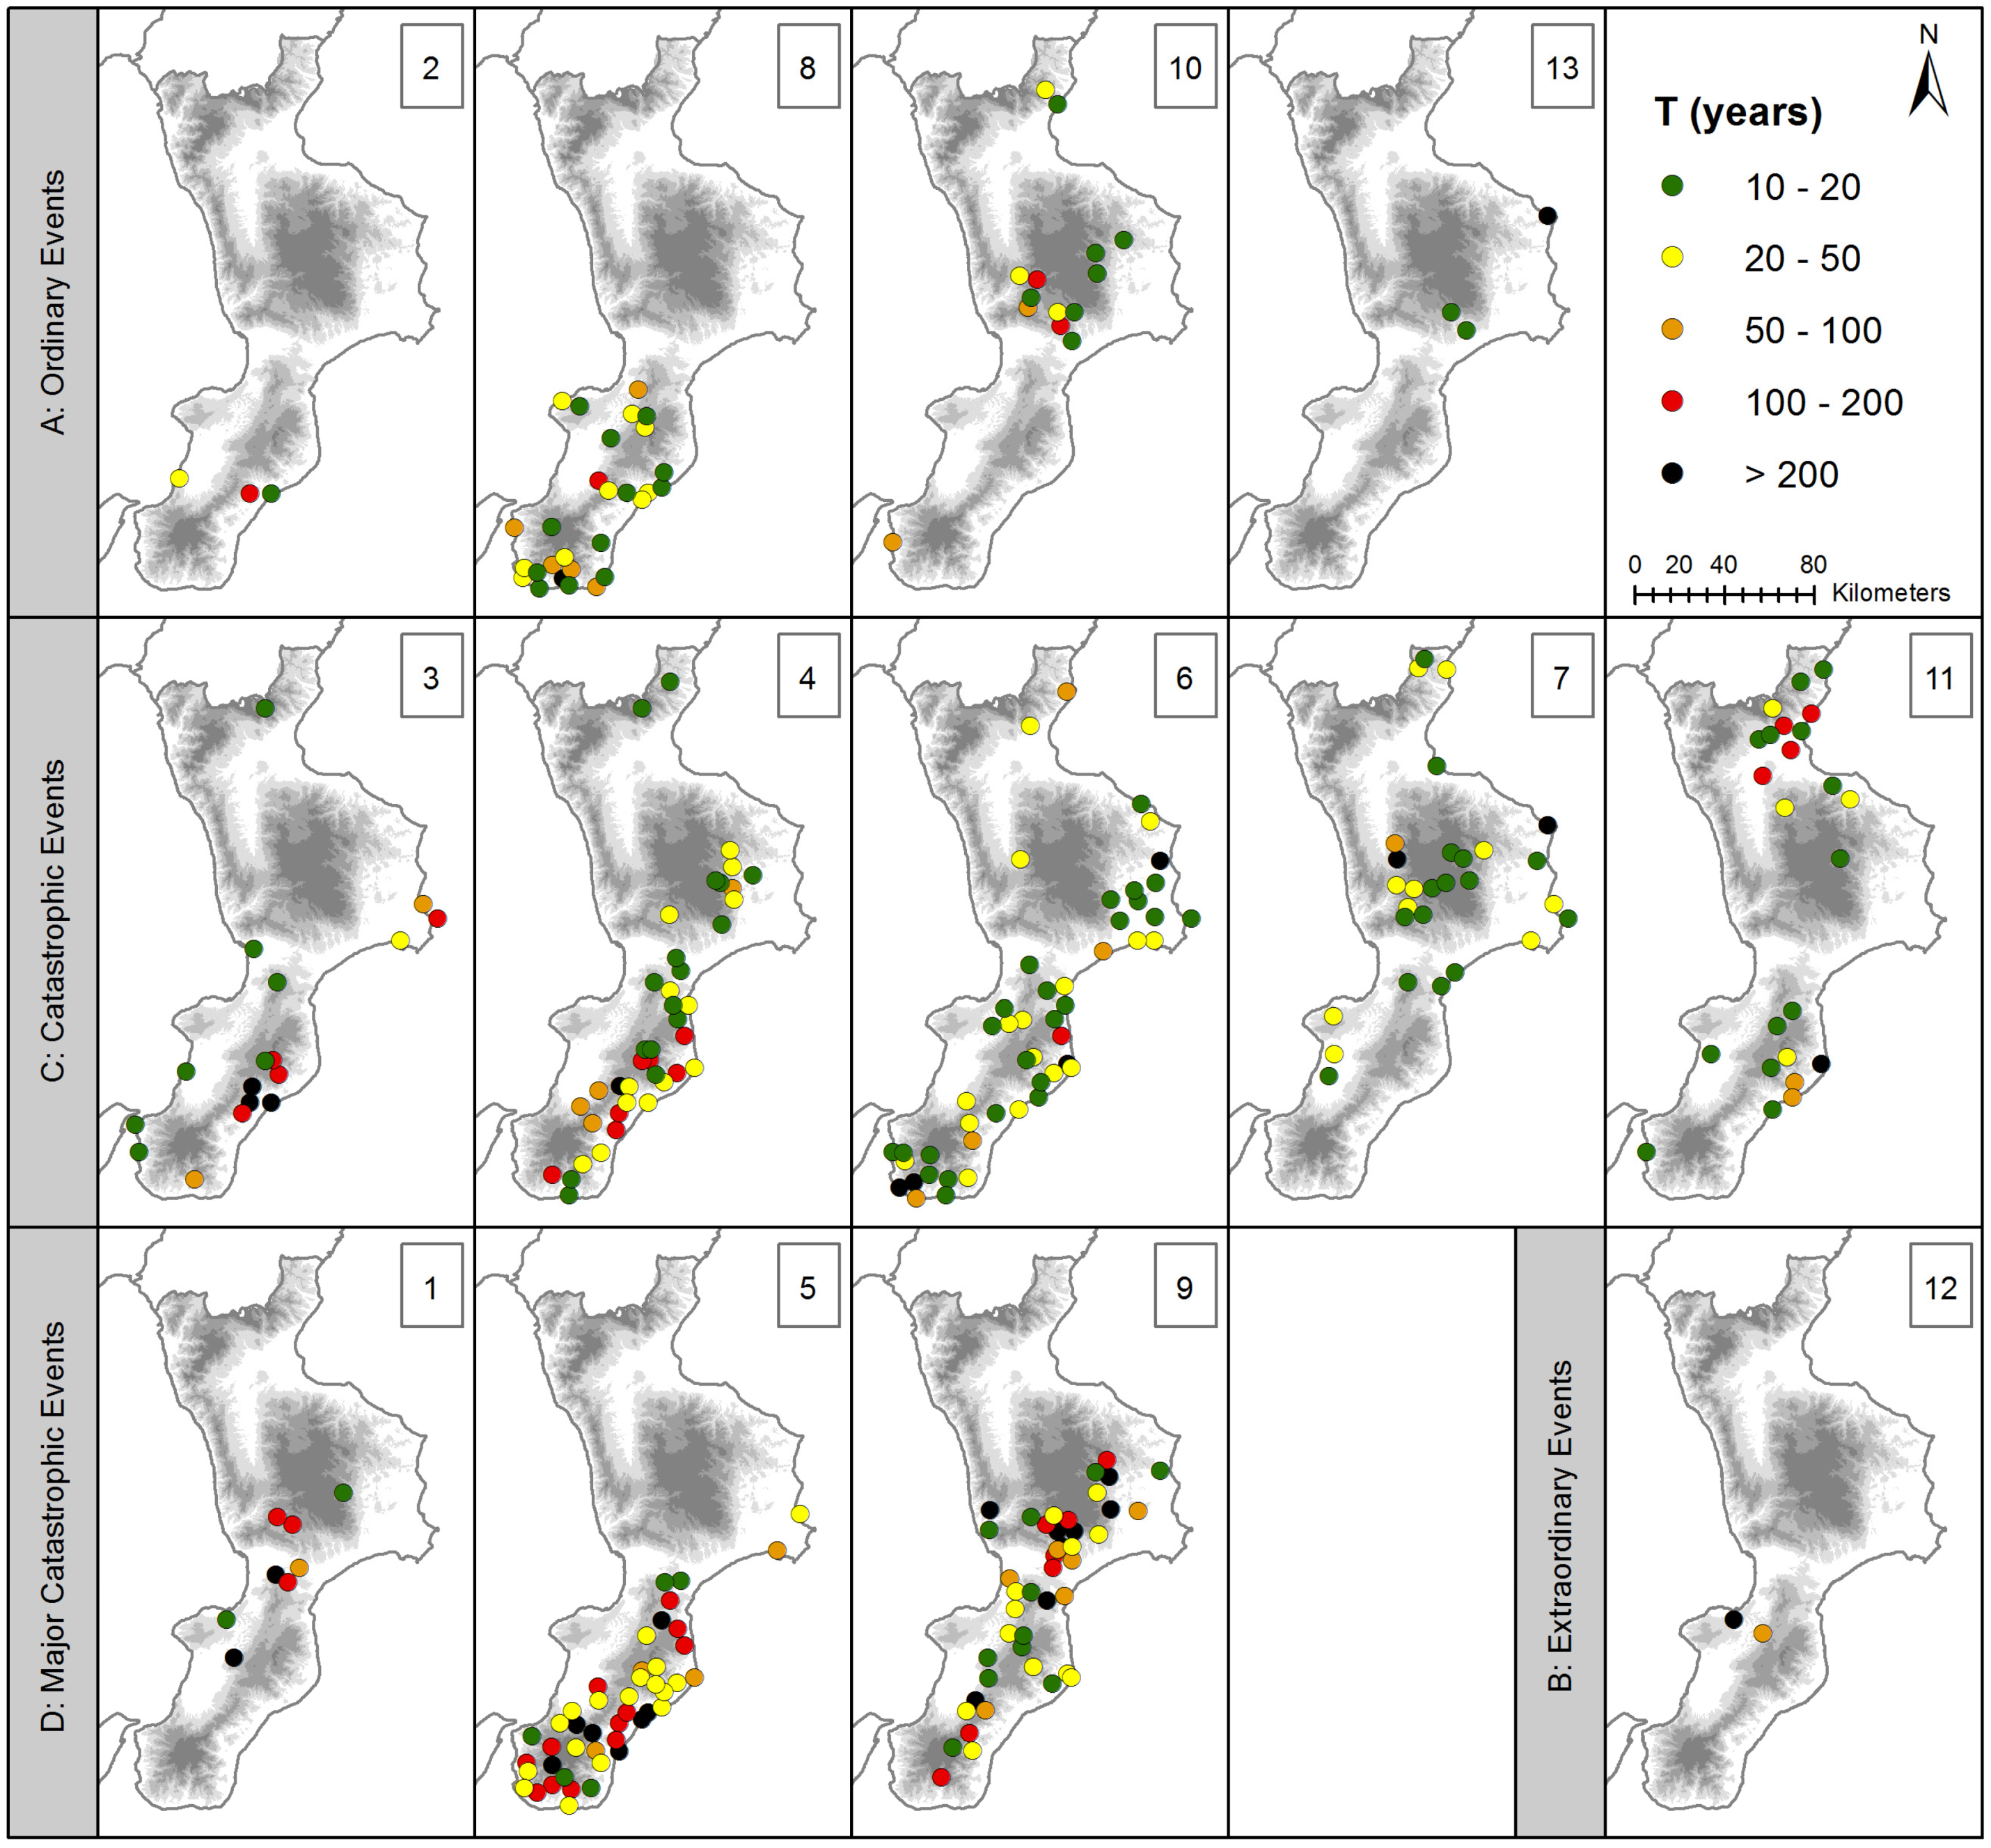
2.2. Rainfall Data Gathering and Analysis

To outline the duration of the triggering RE, an appropriate spatial/temporal resolution is required. From a spatial point of view, with the aim of having a complete description of the event, all the regional rain gauges that were working at the time of each event must be analyzed. Concerning the temporal resolution, rainy days (days with precipitation greater than or equal to 1 mm) occurred during the damage event and in a buffer before and after it (i.e., ten days before and ten after) must be investigated. Thus, for each event, a matrix having a number of columns corresponding to the number of gauges, and a number of rows made by the damage event duration plus the buffering can be obtained. For each gauge, the local rainfall event is defined as the continuous sequence of rainy days either included in, or intersecting, the DE. Then, at a regional scale, the duration of rainfall event (DRE) is the envelope of all the local rainfall events recorded by the available gauges. Actually, it is the number of days between the early beginning and the latest end of rainy days among all the affected gauges [48]. As a measure of the magnitude of rainfall events, in the proposed methodology, the return period (T) of the daily rainfall recorded during the event has been evaluated. To assess T using the Gumbel probabilistic model [31], the series of annual maxima of daily rainfall recorded during the hydrological years for a period long enough to allow statistical analyses (no less than 30 years), is required. The Gumbel distribution, also known as the Extreme Value Type I distribution, has the following cumulative distribution function:
F X ( x ) = exp ( exp ( z ) )
where z = (x − μ)/σ; μ is the location parameter; and σ is the scale parameter (σ > 0). In extreme-value studies, the probability of exceedance of a certain value is usually expressed in terms of the return period T that is defined as follows:
T = 1 / [ 1 F X ( x ) ]

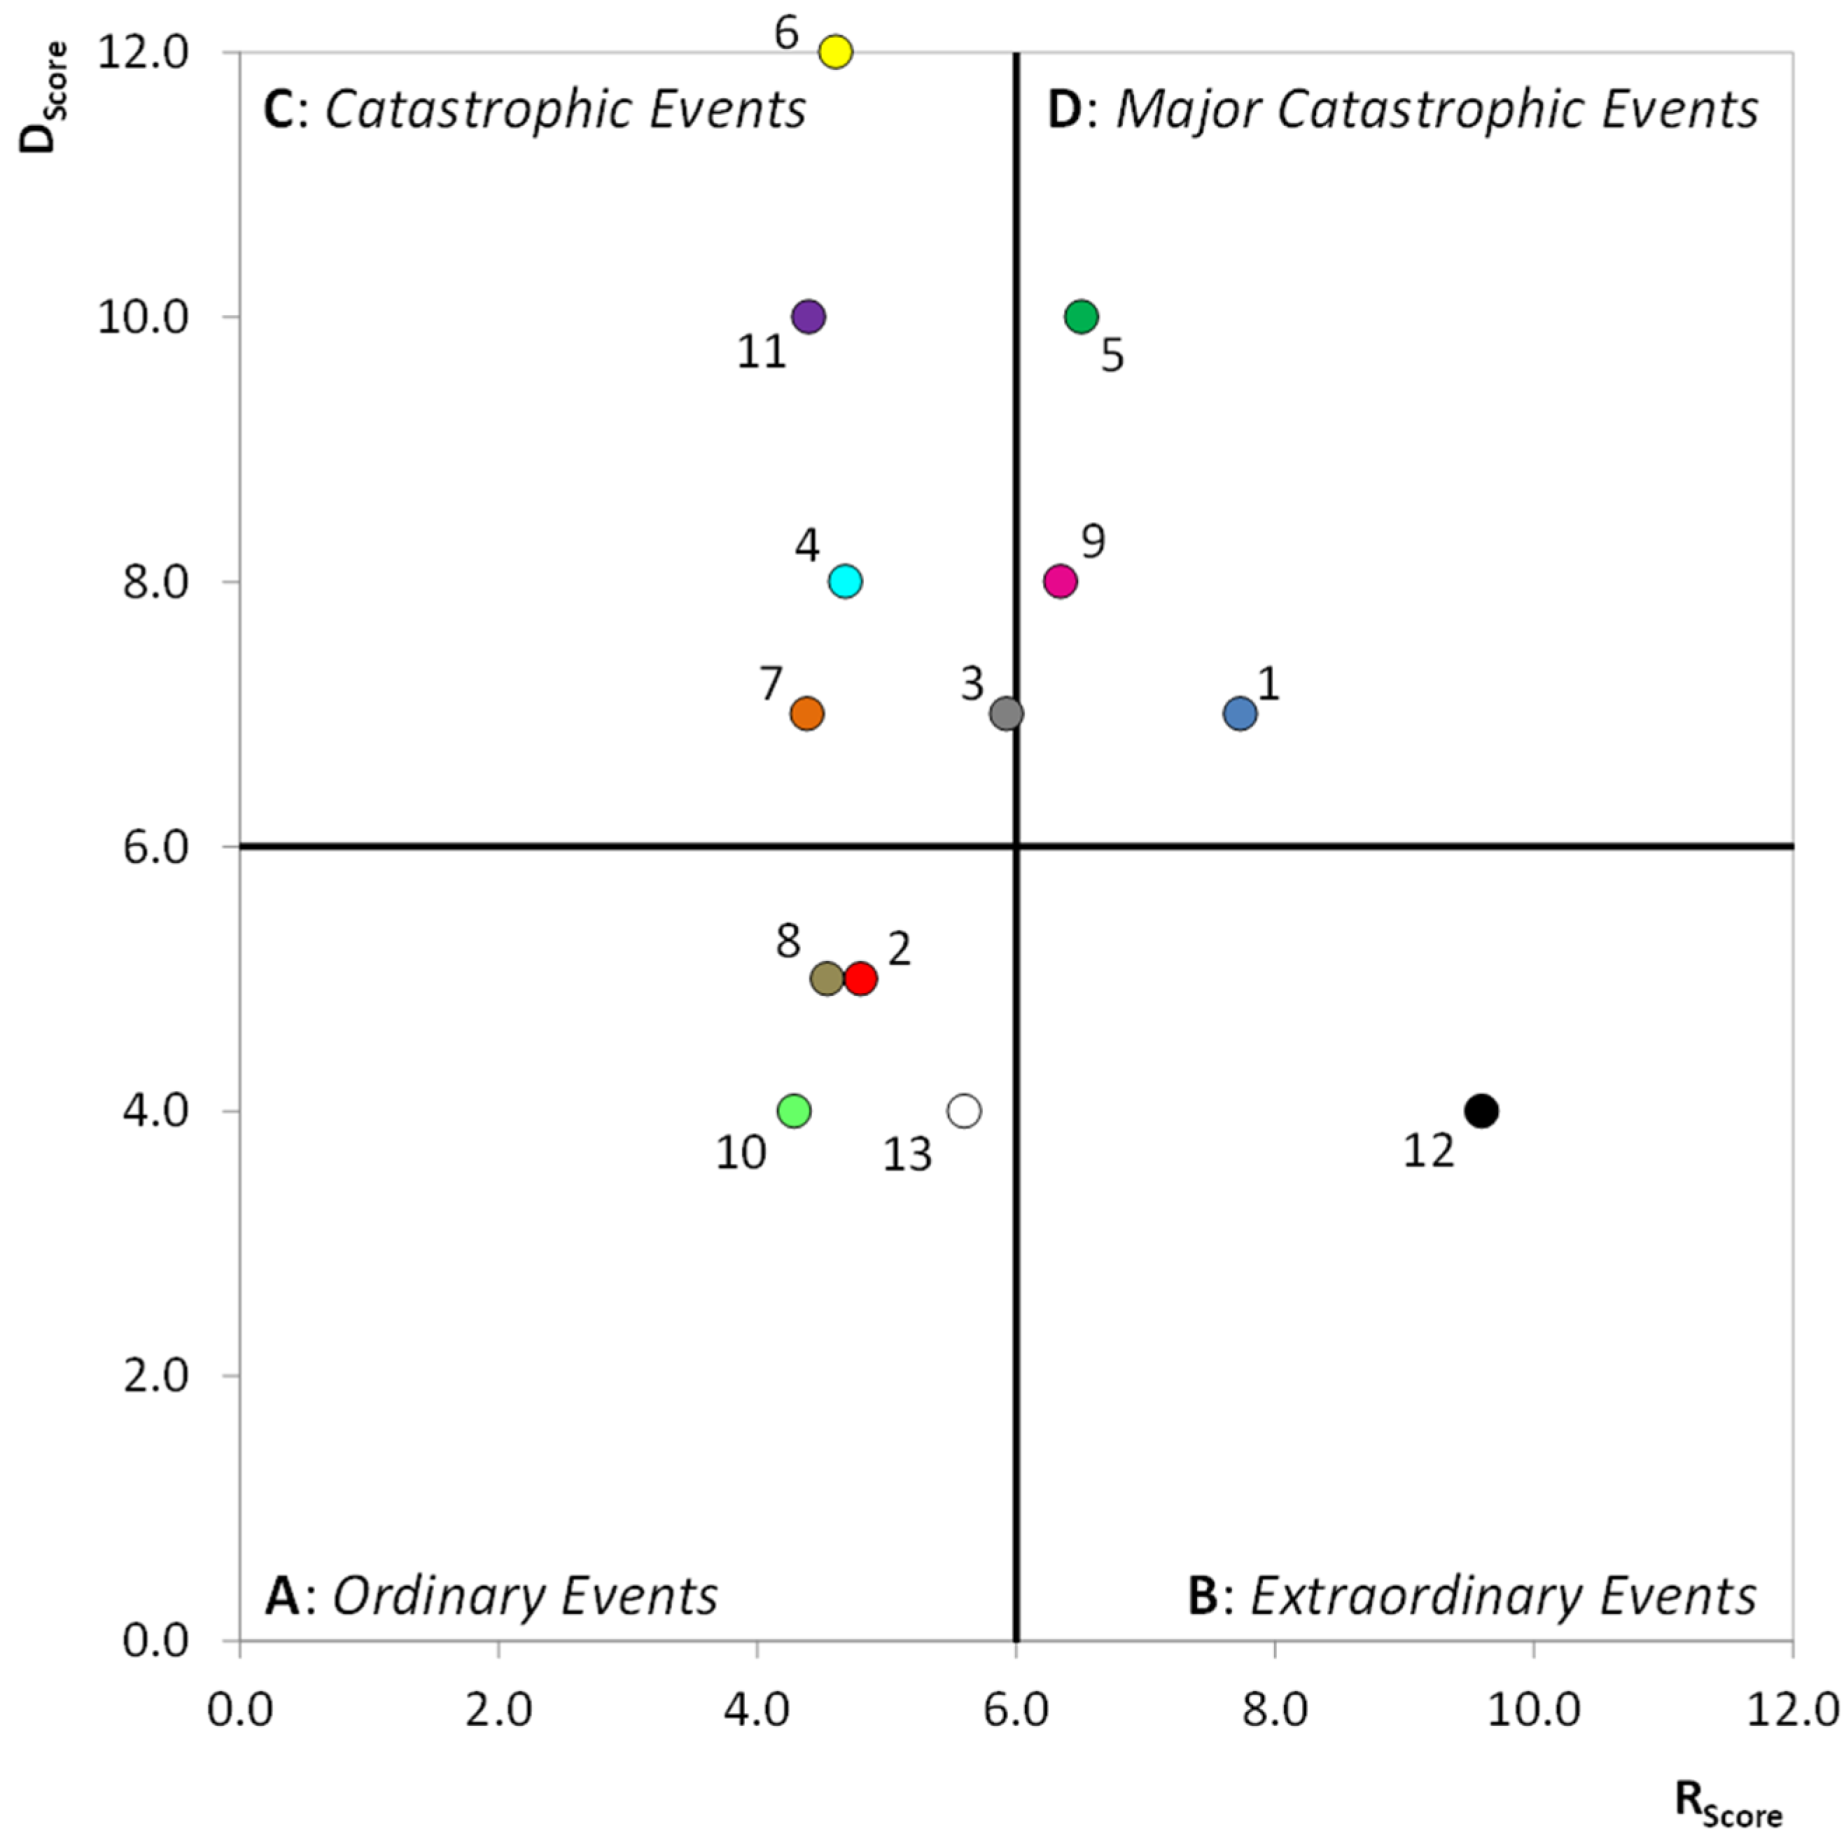
2.3. Rainfall and Damage Analysis

To summarize the severity of a DHE, two indices are proposed: the damage score (Dscore) and the rainfall score (Rscore).
For each DHE, Dscore is the sum of damage indicators obtained from the damage data analysis:
D score = I D A + D I + N o V
where IDA is the index of damaged area; DI is the damage index and NoV is the number of victims.
Rscore is based on the return period of the daily rainfall, sorted in a series of classes. It considers the percentage of gauges falling within each return period class, using a weight factor that accounts for the importance of the higher values of the return period.
R score = c 0 i = 1 n i P ( T ) i i = 1 n P ( T ) i
In Equation (4), n is the number classes of return periods; i is a return period class; P(T)i is the percentage of rainfall gauges falling within each i return period class, and c0 is a graphic scale factor.
The different return period classes have been chosen according to the institution responsible for monitoring the hydrogeological risk in the Calabria region, the Basin Authority, which has used several return period classes in its Hydrogeological Structure Plan (Piano di Assetto Idrogeologico or PAI), as required by Italian law.
By plotting these two indices in a chart, four sectors corresponding to four severity levels can be recognized. The name of the sectors are similar to those introduced in [49]. Sector A groups less severe cases, which are identified as ordinary events, having low Dscore and Rscore values. Sector B includes extraordinary events, characterized by very high rainfall severity and moderately low damage levels. Sector C includes catastrophic events, showing severe damage caused by not-so-extraordinary rainfall. Finally, Sector D includes major catastrophic events, showing high damage and triggering rainfall values. The realization and the use of this chart by using the data of an Italian case study is explained in the following sections.

3. A Case Study in Calabria

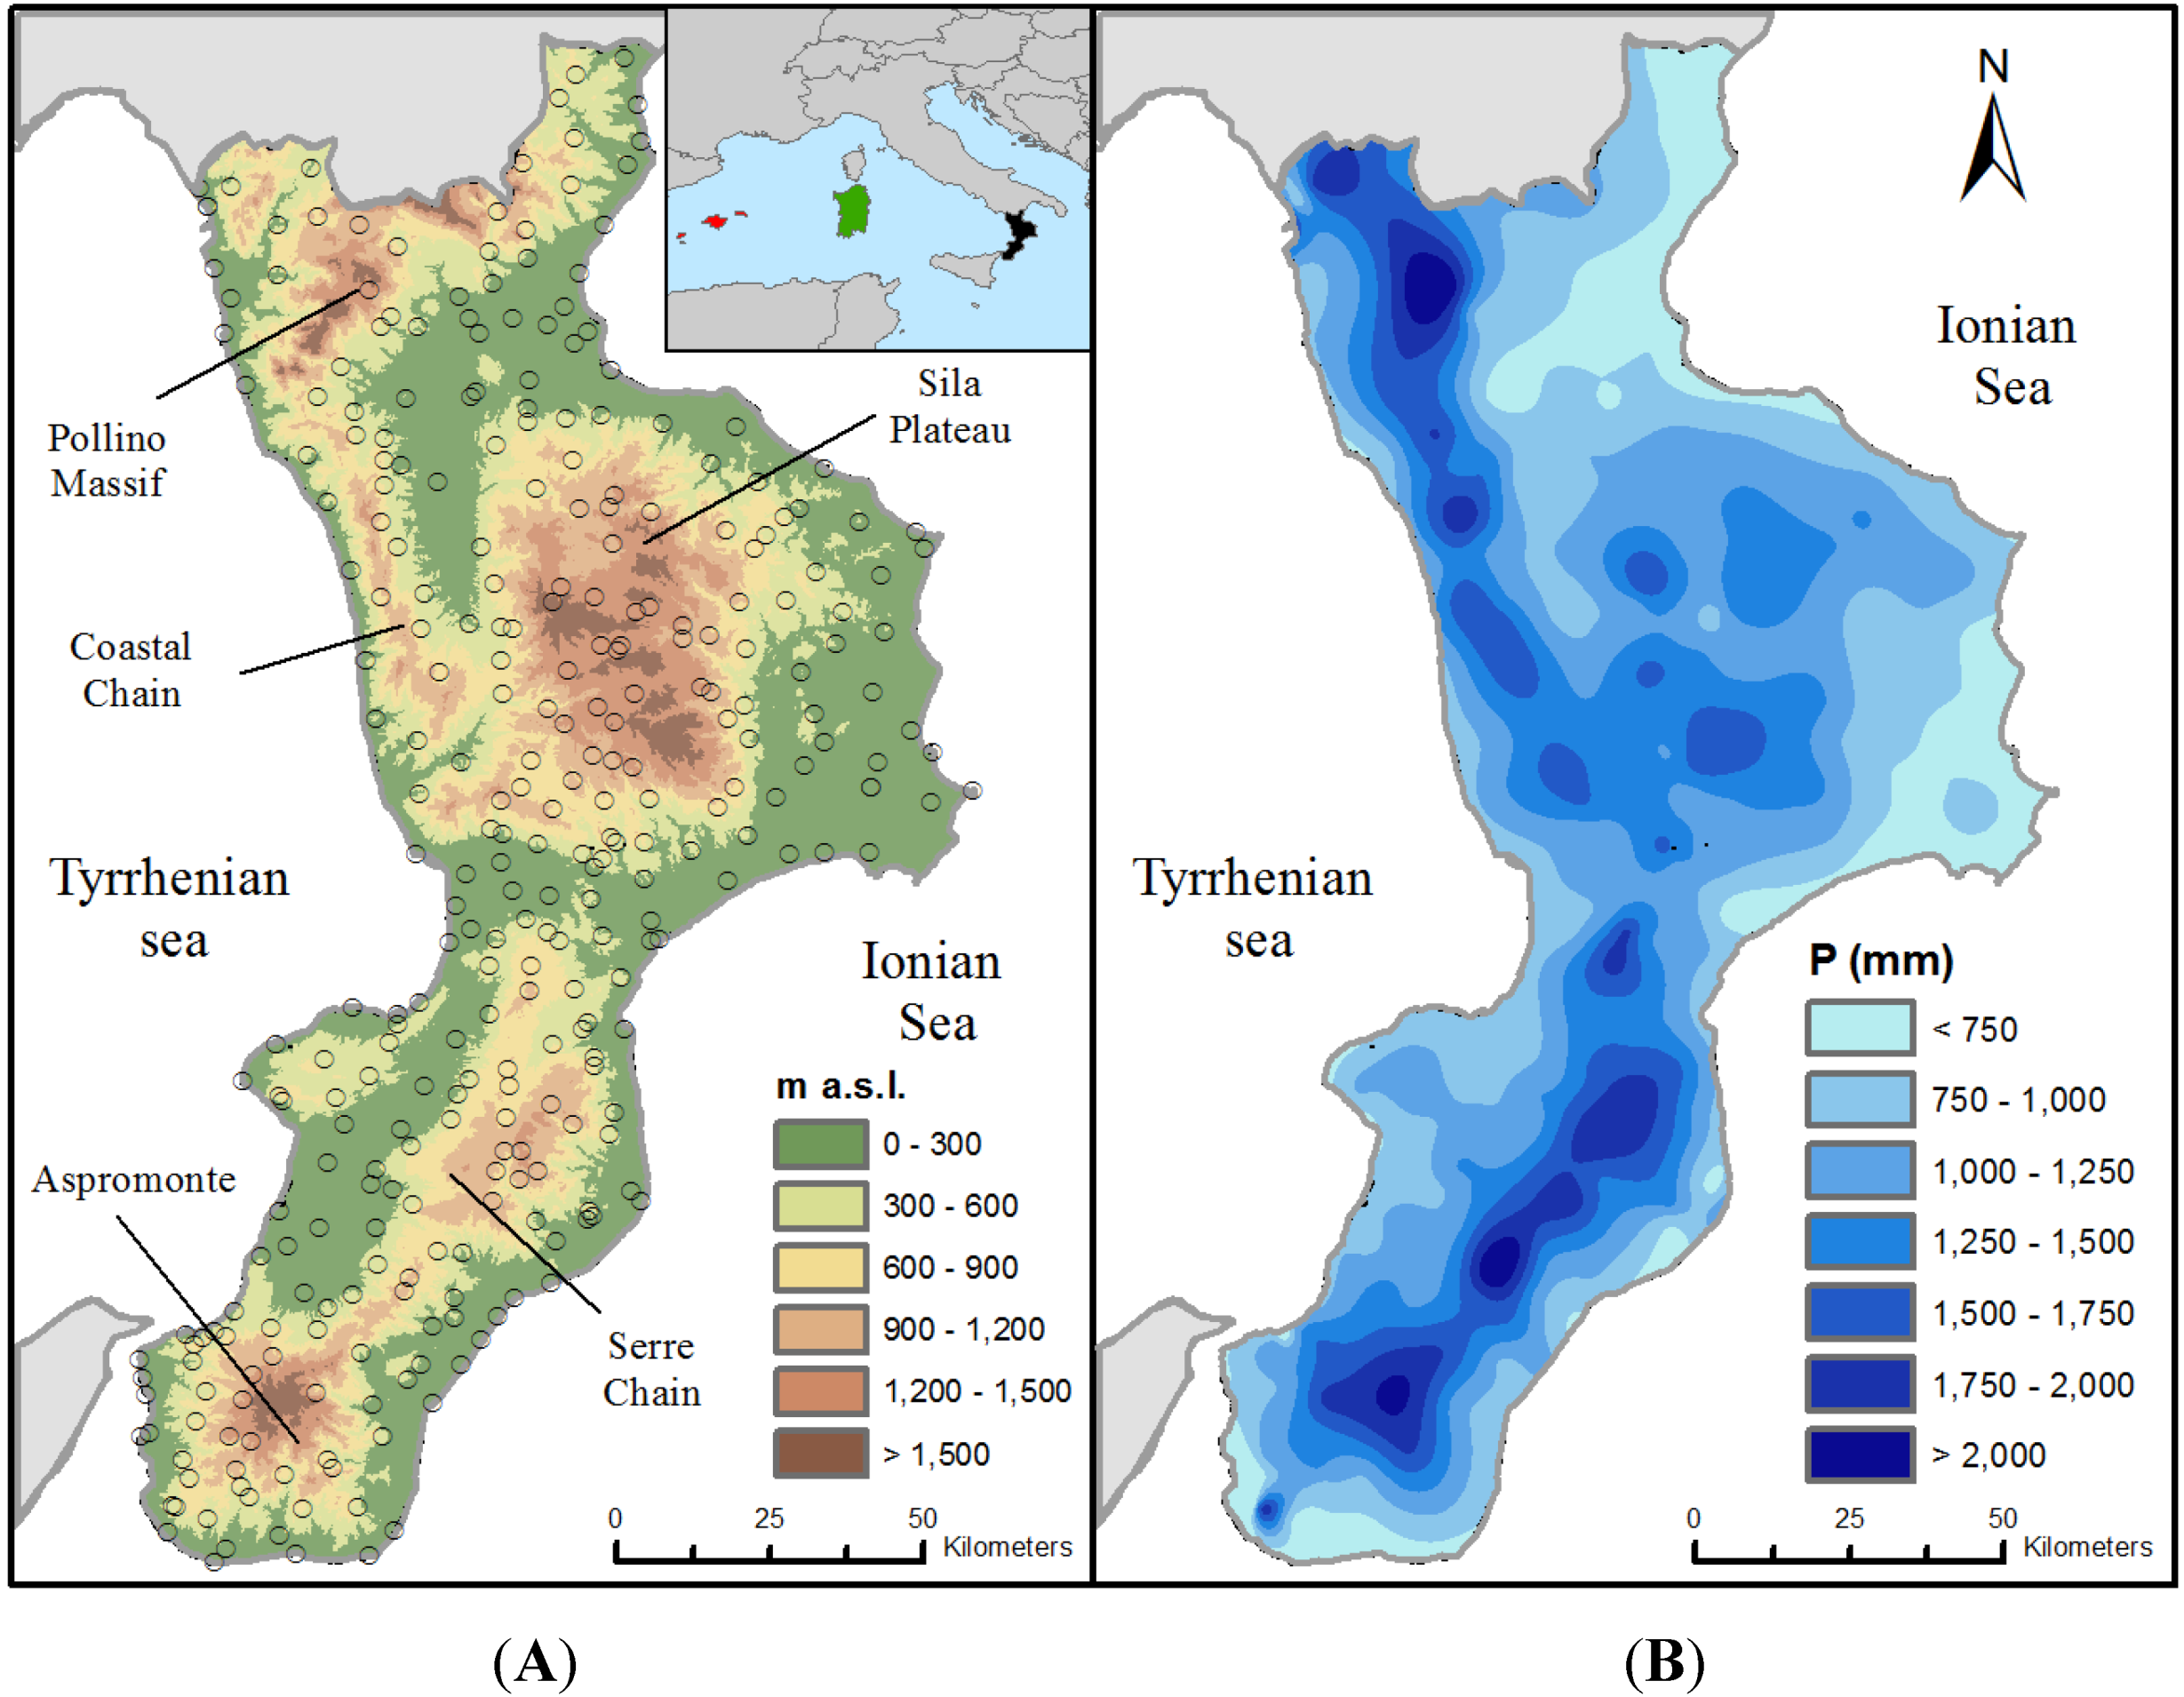
3.1. The Study Area: Calabria Region

Calabria (southern Italy) has an area of 15,080 km2; its mean altitude is 597 m and the maximum is 2266 m. Although Calabria does not have many high summits, it is one of the most mountainous regions in Italy (Figure 1): 42% of the land is mountainous (elevation greater than 500 m a.s.l.), 49% hilly (elevation between 50 and 500 m a.s.l.) and only 9% is flat (elevation lower than 50 m a.s.l.).
The climate is Mediterranean: during the summer, precipitation is less frequent, while in the winter, rainfall and snow occur. Warm currents coming from Africa affect the east side, causing high temperatures with short and heavy precipitation. By contrast, western air currents affect the west side, producing milder temperatures and frequent rainfall. The inland zones show colder winters, with snow and fresher summers [50,51]. Numerous DHEs have caused damages and created victims for several centuries in the region [52,53,54,55,56,57], especially along the east side.
Figure 1. (A): digital elevation model of Calabria and rainfall gauges (circles); (B): regional distribution of the average annual rainfall (P). Small box: localization of the Calabria region (in black) in the Mediterranean Basin with the identification of the Sardinia region (in green) and of the Balearic Islands (in red).
Water 06 03652 g001

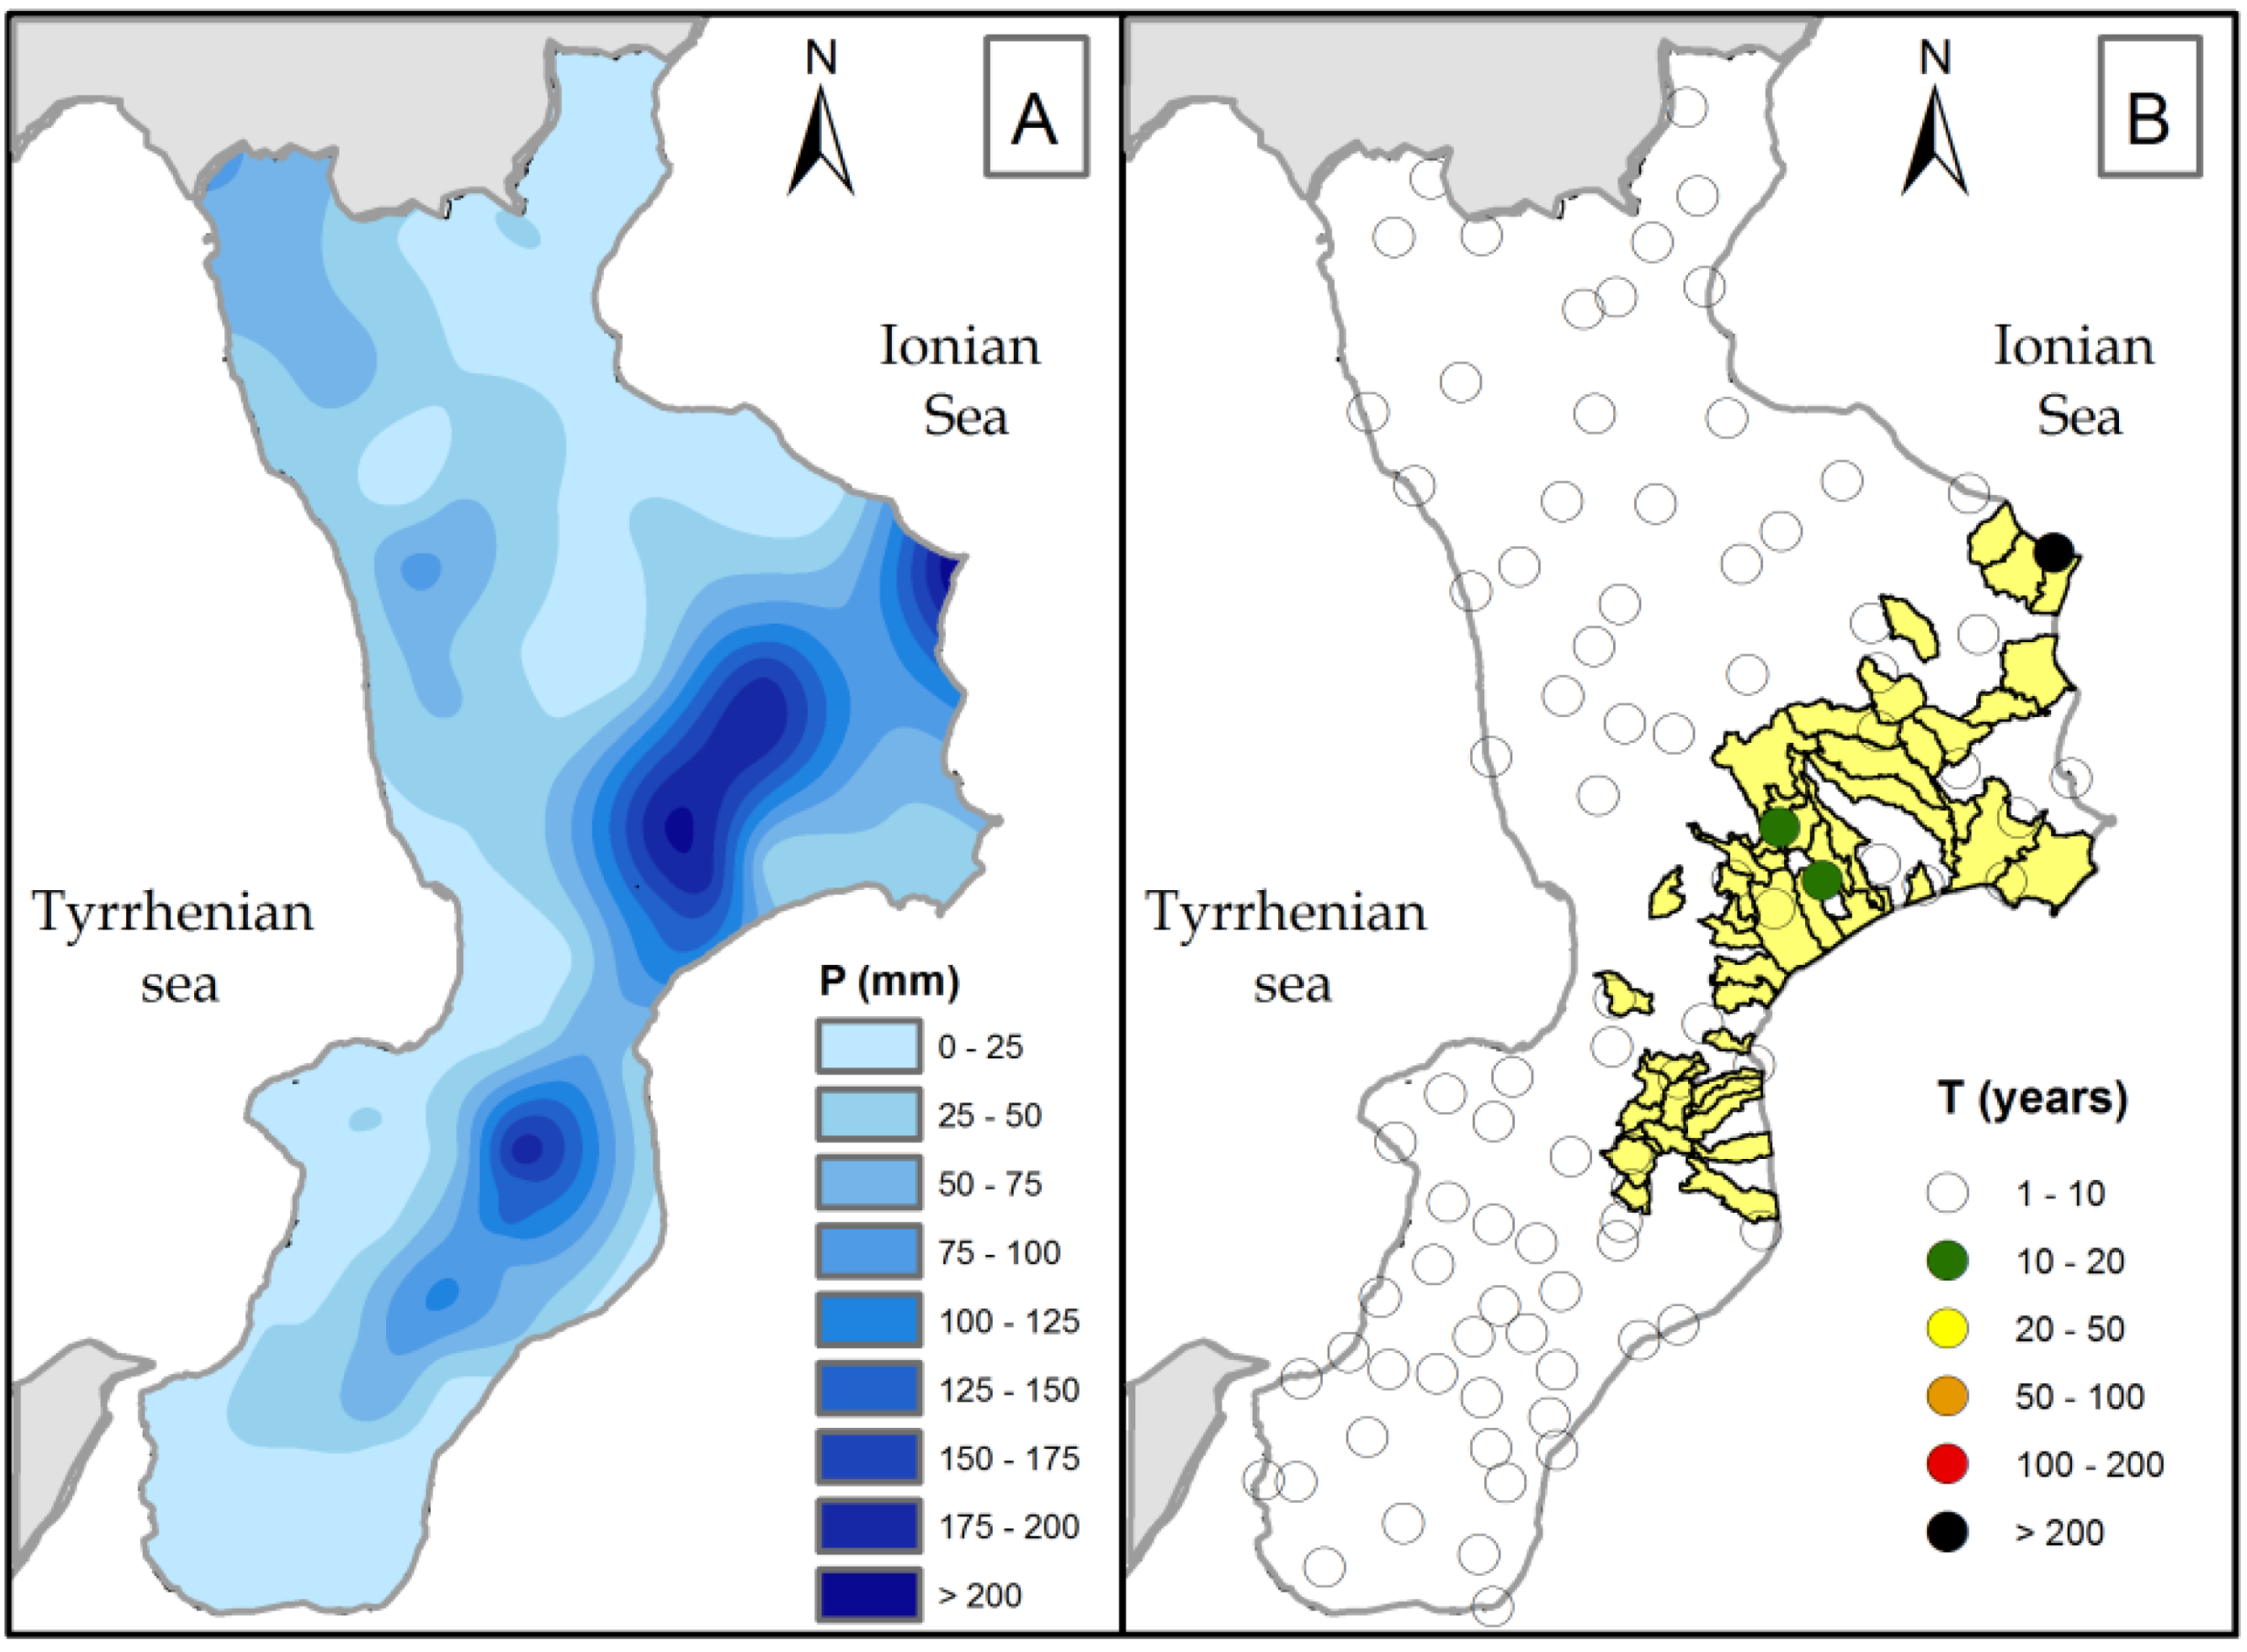
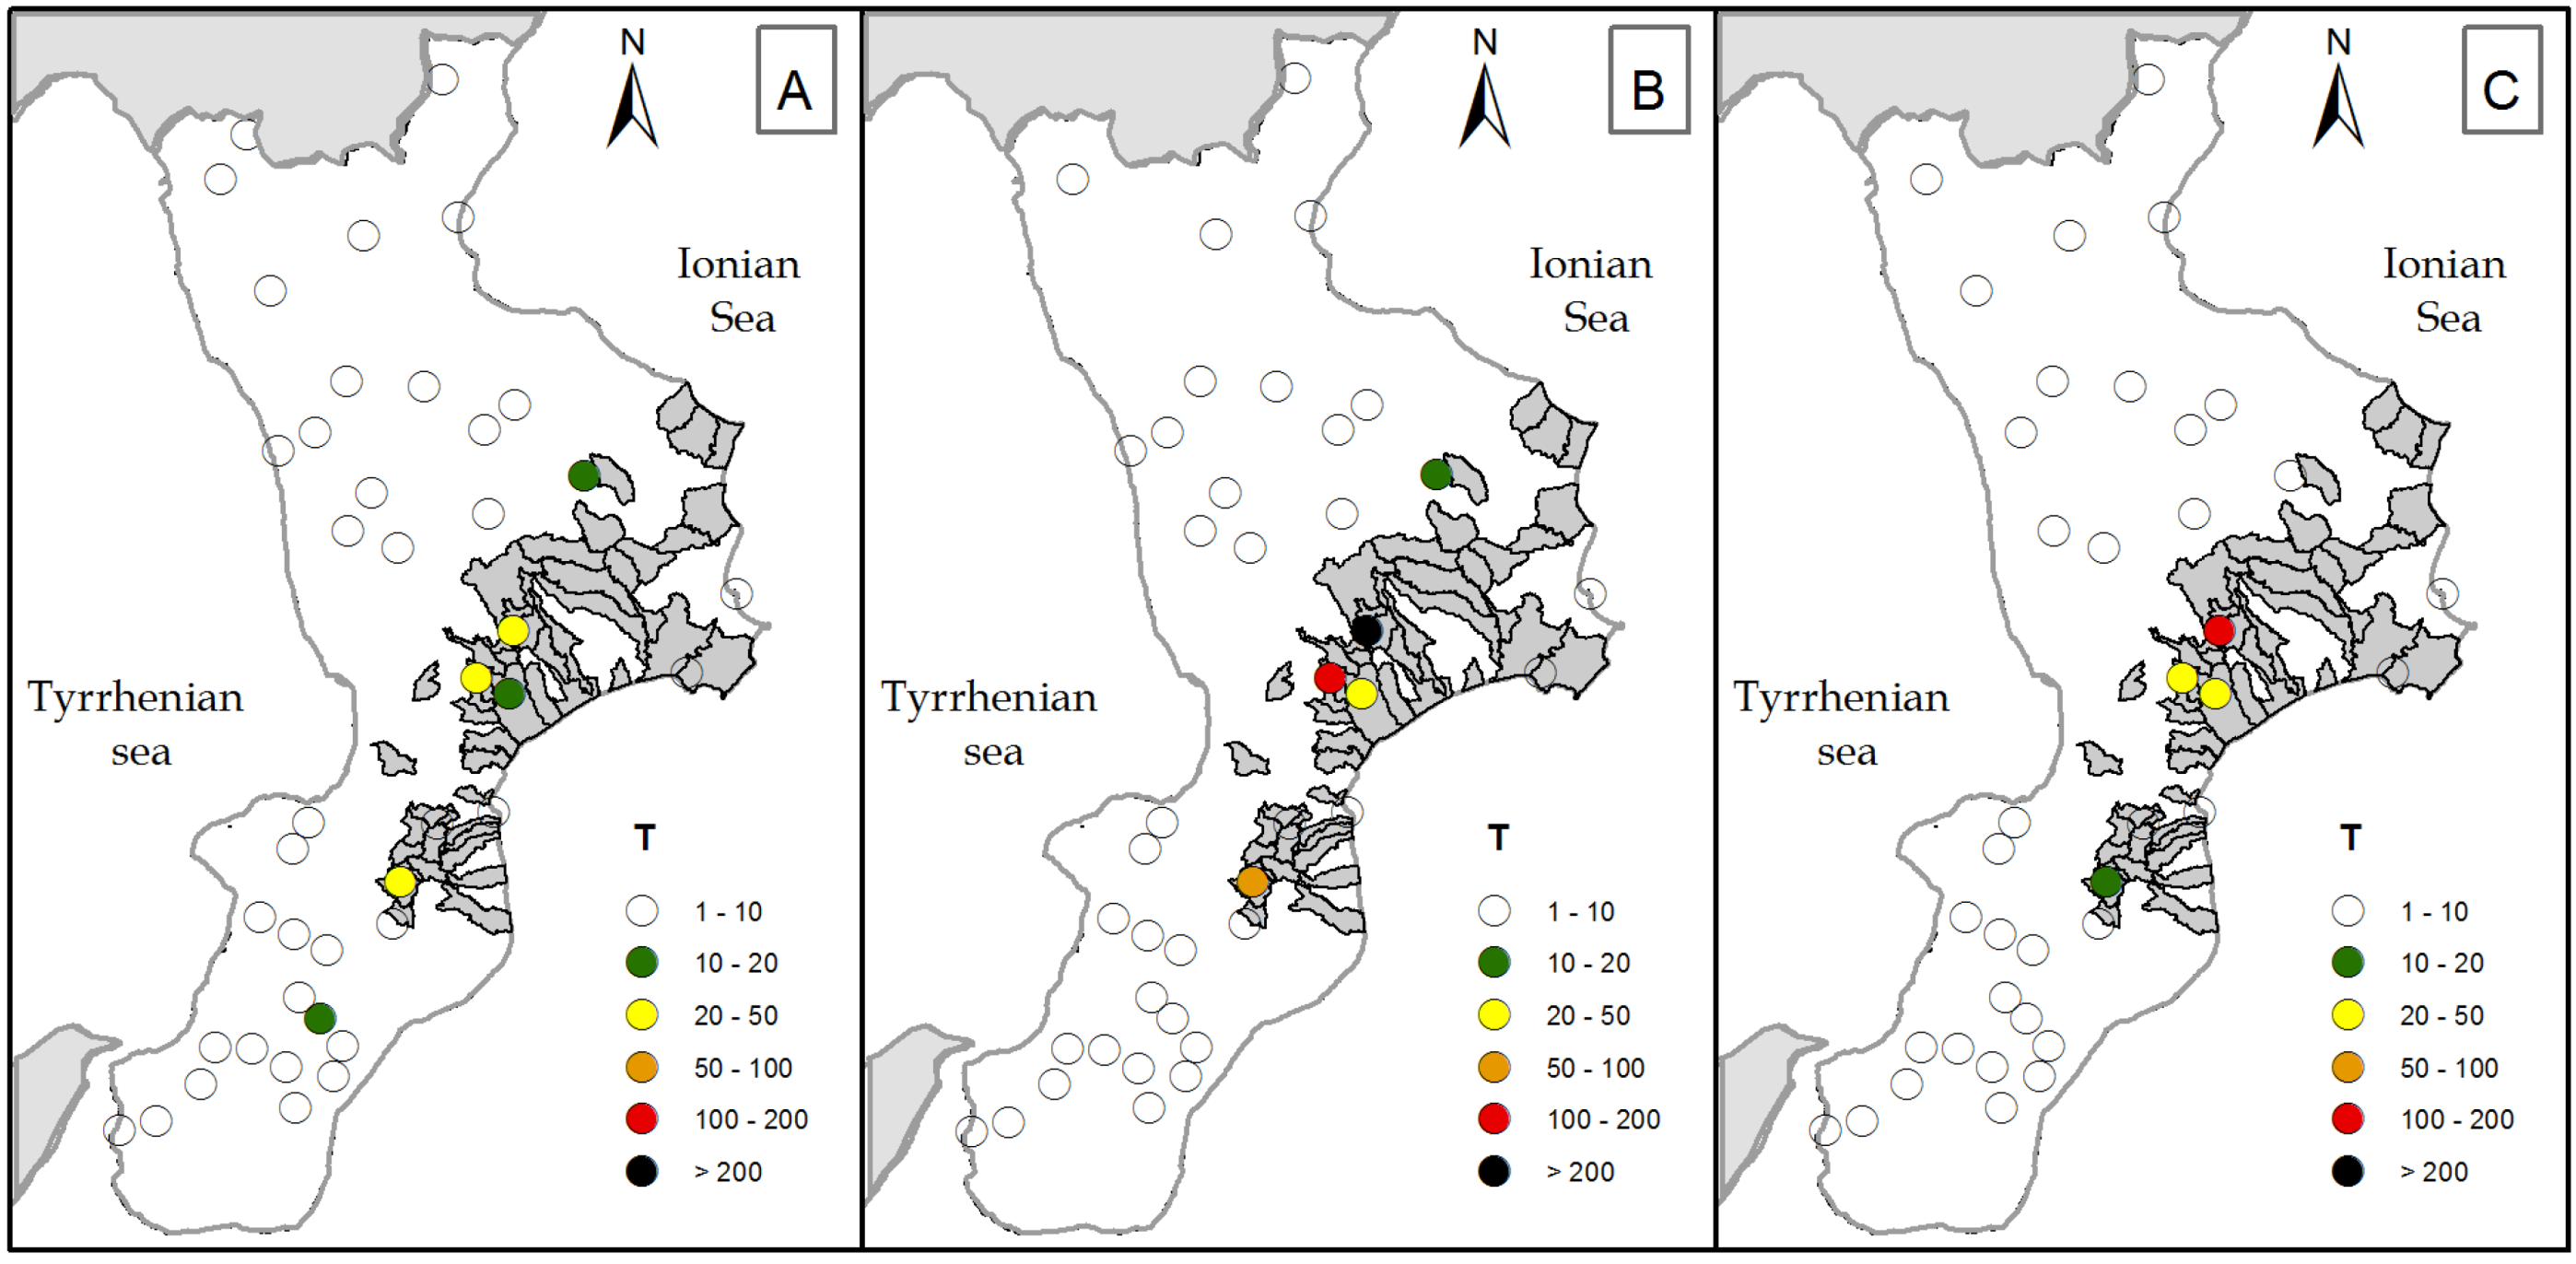
3.2. The 2013 Damaging Hydrogeological Event
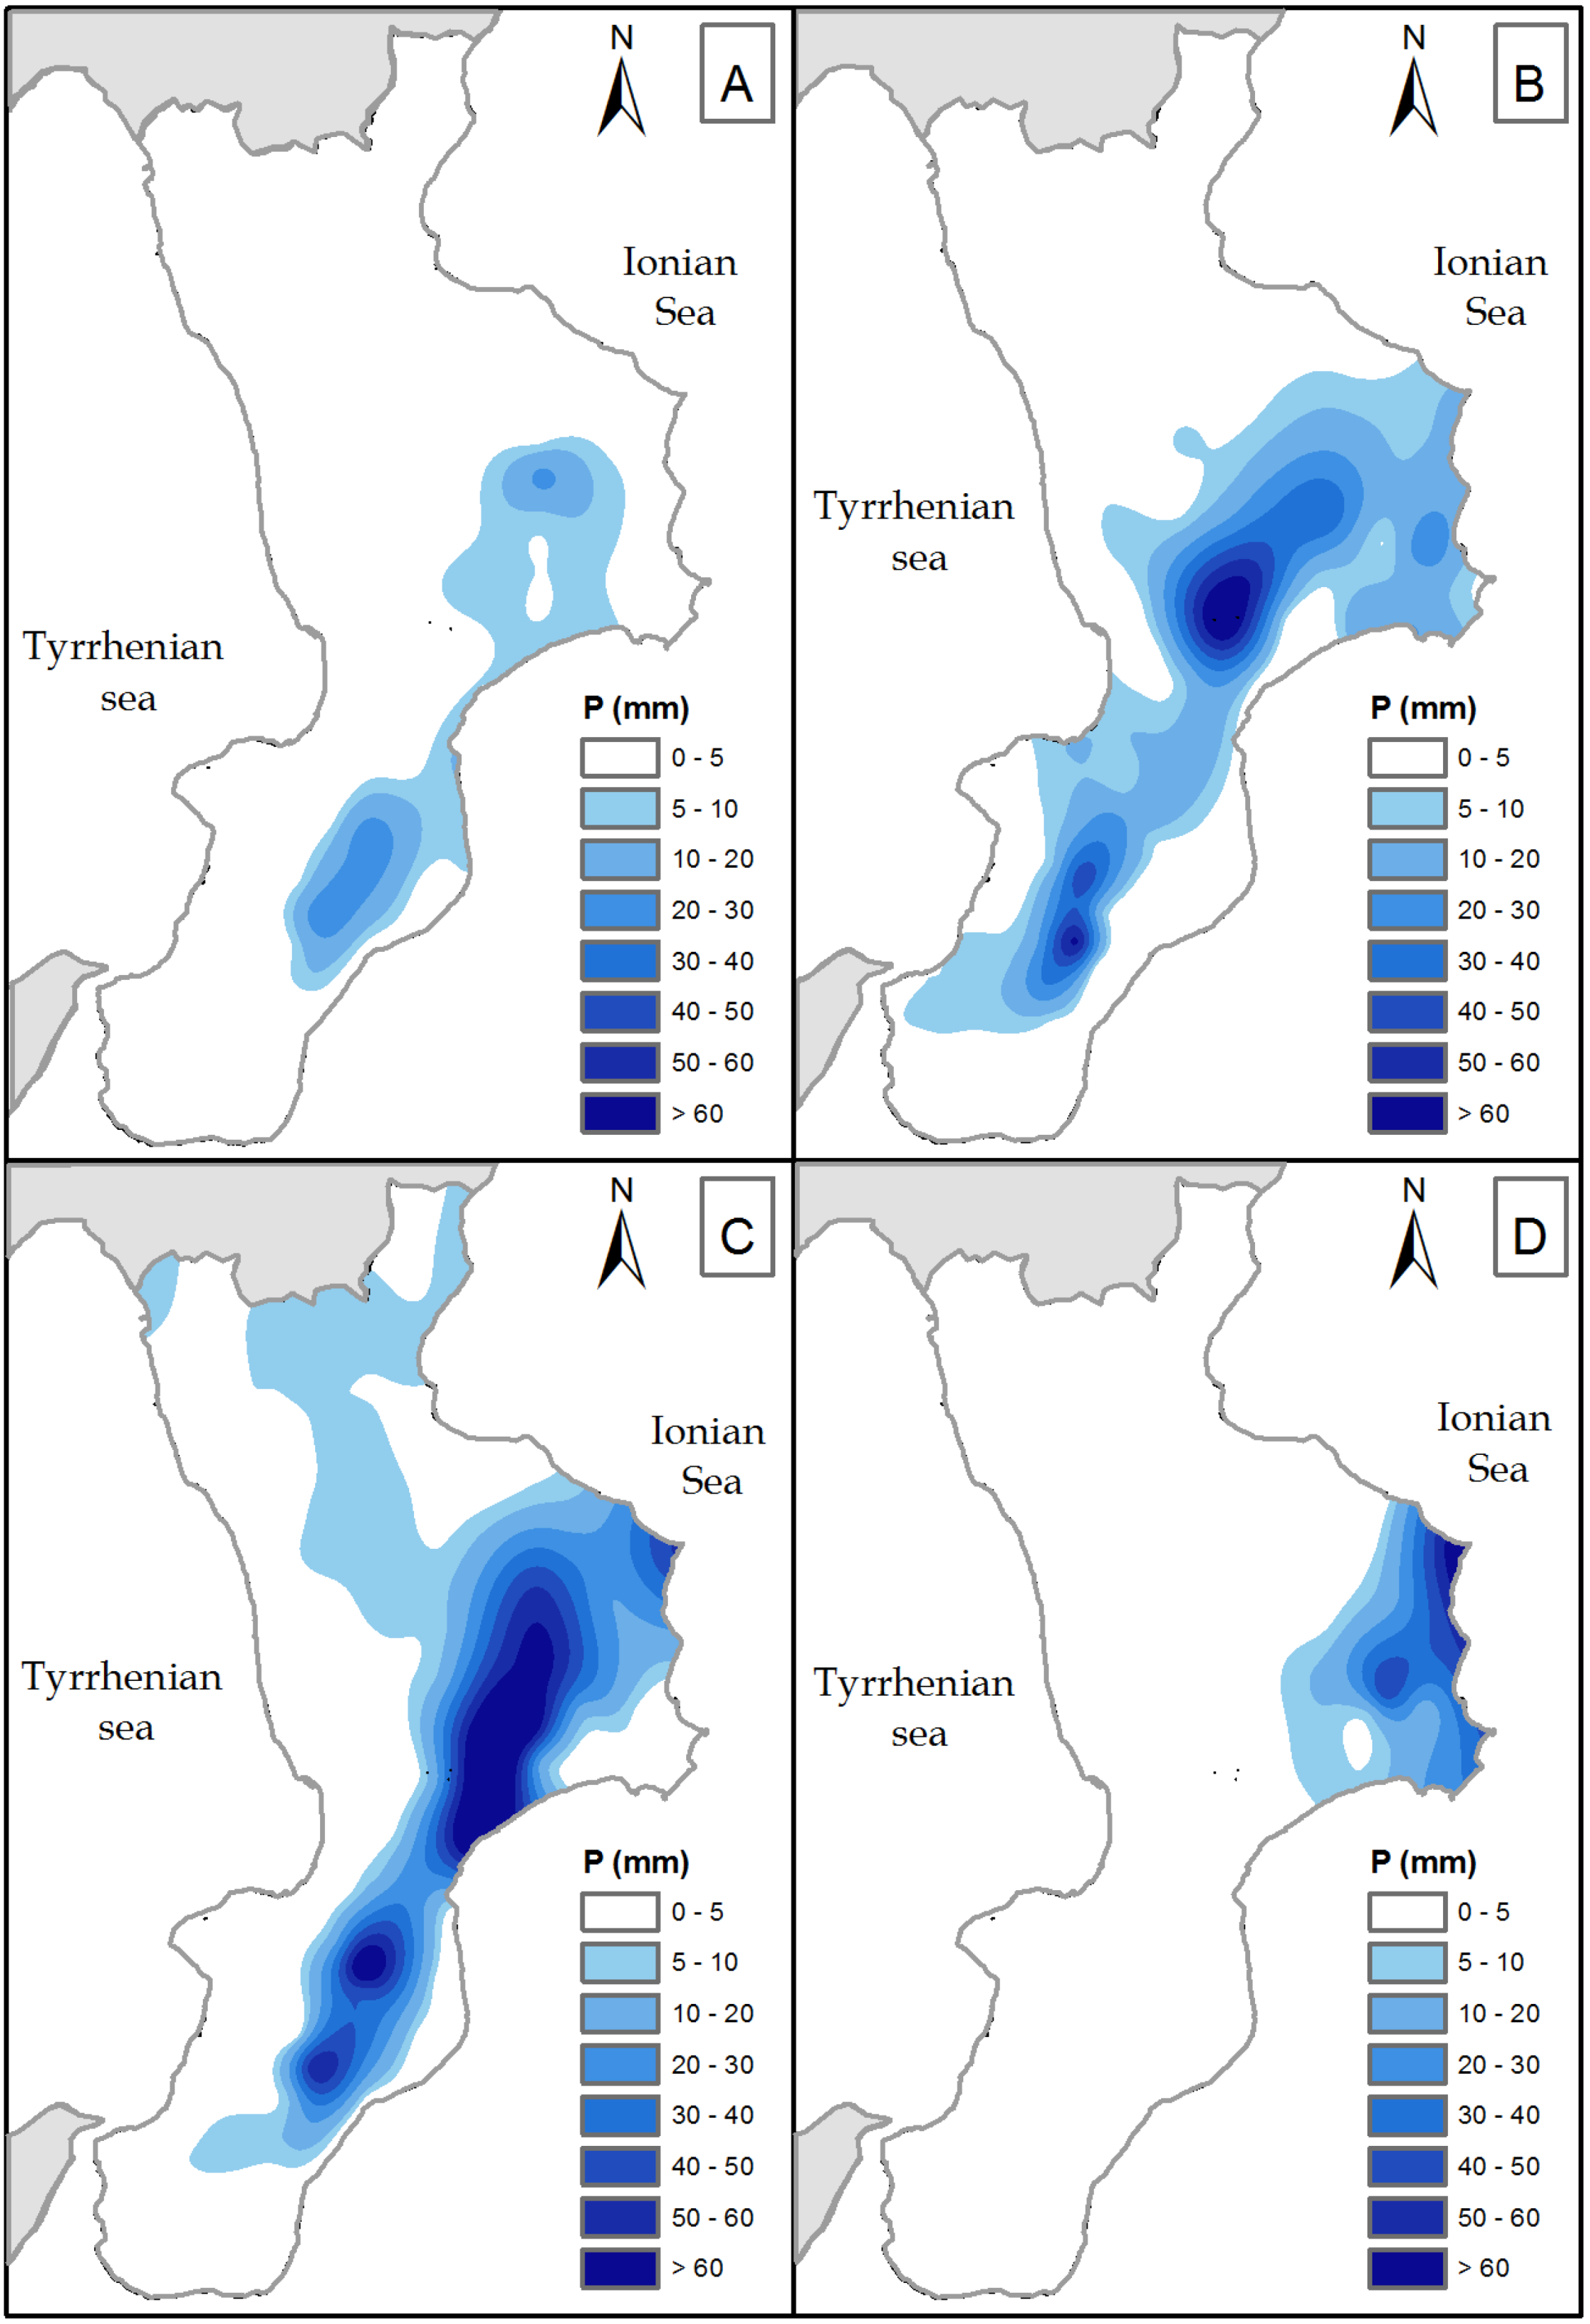
On 18 November 2013, a low-pressure area on the Balearic Islands channeled hot-humid air from the southwest that merged with both colder high-flying air and water vapor raising from the sea, thus originating the Cleopatra cyclone. Sirocco gusts (Sirocco, also called Leveche in other parts of the Mediterranean area, is a Mediterranean wind that comes from the Sahara and reaches hurricane speeds in North Africa and Southern Europe.) with speed up to 95 km/h hit Sardinia (Italy), where daily rainfall exceeded 400 mm (60% of the annual regional average). As a result, flash floods and landslides damaged 61 municipalities and killed 18 people.
Sirocco gusts also affected the east side of Calabria, with peak velocities ranging between 20 and 100 km/h and averages between 14 and 26 km/h, causing sea waves that reached 9 m in height. Then, between the night of 18th and the morning of 19th, Cleopatra moved towards Calabria. Daily rainfall was not extraordinary: only a gauge on the northeast sector recorded a return period greater than 200 years (Figure 2).
Figure 2. 19 November 2013: (A) daily rainfall map; (B) return period of daily rainfall (T) at the gauges (circles with different colors according to the legend), and damaged municipalities (yellow areas).
Water 06 03652 g002
Rainfall started in the early morning and lasted until 11:00 a.m.:
1)
From midnight to 3:00 a.m.: the rainfall occurred over the middle and southeast side, with a maximum intensity of 26 mm/1 h (Figure 3A).
2)
From 3:00 to 6:00 a.m.: rainfall affected a larger area, involving the western sector, and its intensity increased up to 70 mm/1 h (Figure 3B).
3)
From 6:00 to 9:00 a.m.: the event extended over the north and mid-east sector, with intensities around 50 mm/1 h, and greater than 150 mm/3 h (Figure 3C).
4)
From 9:00 to 11:00 a.m.: precipitation progressively decreased all over the region (Figure 3D).
The simultaneous occurrence of rainfall and sea storms had a cascading effect: waves obstructed the outlet of floods toward the sea, pushing water upstream. Floods suddenly affected east-side rivers: in 51% of the reported cases, waters overstepped both natural and artificial embankments. Numerous cars were submerged, and some people abandoned their houses just before the latter were flooded.
Figure 3. Hourly rainfall registered on 19 November 2013. (A) 0:00–3:00 a.m.; (B) 3:00–6:00 a.m.; (C) 6:00–9:00 a.m.; and (D) 9:00–11:00 a.m.
Water 06 03652 g003
Despite the flood’s level exceeding one meter (Figure 4), there were no casualties; two people were slightly injured and some others suffered panic attacks due to flooding. According to the available data, no dangerous behaviors were reported. It is likely that the television broadcasting of the dramatic event that affected Sardinia the day before induced people to behave more cautiously than usual [5].
Figure 4. Catanzaro town on 19 November 2014. Cars partially submerged by the floodwaters that overflowed from local rivers.
Water 06 03652 g004
Newspapers (Il Quotidiano della Calabria and La Gazzetta del Sud), news agencies, news websites, weather forecast websites and the social network pages of people living in the affected areas diffused damage data. The event damaged 12.6% of the regional surface, affecting 49 municipalities (12% of the total), located in the provinces of Catanzaro (57%), Crotone (31%) and Vibo Valentia (12%). In 59% of the cases, even landslides caused some damage, and in 12%, wind also produced economic losses. In 90% of the affected municipalities, the road network was the most damaged element (Figure 4), followed by houses (33%); in two municipalities, 166 people were evacuated as a precautionary measure. Traffic, electricity and water supply were interrupted or difficult. Catanzaro, the administrative center of Calabria, was the most affected place: following the aqueduct breakdown, water service was interrupted for eight days, and water distribution for about 70,000 people had to be organized using tank trucks. Shops and houses were flooded; the university, the hospital, and the courthouse were flooded as well, and their activities had to be restricted for some days. Floods caused the loss of cultivated products and garbage dragged by rivers damaged fishing.

3.3. The Historical Series of Damaging Hydrogeological Events in Calabria

From the historical database of the Damaging Hydrogeological Events in Calabria (Rainfall measurements started in Calabria in 1920s), twelve of the most severe events which occurred in the region since the 1920s (Table 1) have been selected.
For each event, both the daily rainfall (Figure 5) and the return period of daily rainfall (Figure 6) were mapped, while, for the 2013 event, the same features are shown in Figure 2. For all these DHEs, both Dscore and Rscore (using the same T classes as in Figure 6) were assessed, and the chart of the severity of Calabrian DHEs was created (Figure 7).
Table 1. Severe DHEs that have occurred in Calabria since the 1920s, chronologically sorted. N: identification number; DE Start–end: start–end of damage event; IDA (%): index of damaged area; DI: damage index; NoV: number of victims; dDE (days): duration of damage event; RE Start–end: start–end of rainfall event; dRE (days): duration of rainfall event; AdRE (days): average duration of rainfall event; mDR (mm): maximum daily rainfall of the event; ADR (mm): average daily rainfall of the event. (modified from: [58]).
NDE Start–EndIDADINoVdDERE Start–EnddREAdREmDRADR
125/10/1921–26/10/19216.06136.531223/10/1921–31/10/192162.8639834.8
227/11/1927–30/11/19277.24105.56426/11/1927–03/12/192773.3380.138.3
313/11/1932–14/11/19326.00142.034209/11/1932–18/11/1932107.12400.133.1
430/11/1933–03/12/193318.4399.518423/11/1933–12/12/19332014.5438125.6
515/10/1951–20/10/195112.89158.0101512/10/1951–21/10/195196.38534.638.0
621/10/1953–28/10/195327.84189.080717/10/1953–29/10/19531210.29362.133.0
723/11/1959–26/11/195917.84129.08320/11/195–27/11/195986.28280.426.7
826/09/1971–02/10/197111.6363.03626/09/1971–06/10/197195.74274.124.5
929/12/1972–12/01/197324.95105.571421/12/1972–17/01/19732815.39433.426.2
1025/12/1990–28/12/199012.13482306/12/1990–01/01/19912716.55270.118.3
1110/09/2000–10/09/200024.9117313107/09/2000–12/09/200063.89301.647.0
1202/07/2006–04/07/20062.8384.53301/07/2006–04/07/200641.33202.610.7
1319/11/2013–19/11/201314.55.250118/11/2013–27/11/2013108.02214.812.5
Figure 5. Maps of the daily rainfall recorded during the events. Numbers from 1 to 12 are the same as in Table 1.
Water 06 03652 g005
Figure 6. Calabria shadow relief and maximum return period (T) of daily rainfall recorded during each event at the gauges (circles colored according to the legend). Numbers from 1 to 12 are the same as in Table 1.
Water 06 03652 g006
In particular, in order to evaluate the Dscore, the values of IDA and DI have been classified in four classes. As regards the IDA, respectively a minimum and a maximum value of 2.83 and 27.84 have been observed. The difference between these values has been divided in four equal intervals and the following four classes have been detected: (1) 0–9.08; (2) 9.08–15.34; (3) 15.34–21.59; (4) >21.59. As to what concerns the DI, a minimum and a maximum value of 5.3 and 189 have been respectively evaluated. The difference between these values has been divided in four equal intervals and the following four classes have been detected: (1) 0–51.19; (2) 51.19–97.13; (3) 97.13–189.00; (4) >189.00.
Figure 7. Chart of the severity of Calabrian DHEs. For the explanation of damage score (Dscore) and rainfall score (Rscore) see Section 2.3. Each circle represents one of the event listed in Table 1. (A) Ordinary events; (B) extraordinary events; (C) catastrophic events; (D) major catastrophic events.
Water 06 03652 g007
Ordinary events represent 25% of the cases and show low values of NoV, which, when combined with the value of both IDA and DI, supplies Dscore values less than six. In regard to the Rscore values, these events show both long and short duration but the return periods are less than 200 years, with the exception of a gauge in the event No.8. In these events, rainfall mostly affect the central sector and the southeastern area of the region, from the Sila Plateau to the Aspromonte.
Among the extraordinary events, only a single concentrated summer event has been identified, characterized by very high return period rainfall (>200 years) which strongly damaged (DI = 84) a small sector of Calabria (IDA = 2.83%). In fact, rainfall mainly affected the city of Vibo Valentia and, partially, the regional plain and hilly sectors located between the Sila Plateau and the Serre Chain.
Catastrophic events represent 42% of the total, and high damage and relatively low Rscore (<6) characterize them. In this class, cases affecting either small (No.3) and large (No.6) regional sectors cause numerous victims and DI values usually over 100. Rainfall generally affects almost the entire region, particularly the east side in the central plain and hilly sectors between Sila Plateau and the Ionian Sea, and the area from the Aspromonte and Serre Chain to the Ionian Sea.
The Major catastrophic events present high values of both Rscore and Dscore. Nevertheless, the events of this group are heterogeneous, because they reach similar Dscore values due to the weight of the different damage indicators. Event No.1, for instance, affected a small sector with high DI and high NoV; No.5 affected a medium-sized sector, but caused the highest number of victims; No.9 caused a relatively low NoV and damage to a large percentage of the regional area. In general, rainfall mainly affects the east regional side, from Aspromonte to Serre Chain and the hilly areas of the Sila Plateau.
The 2013 event falls within the field of ordinary events. It presents both low Rscore and Dscore values because no casualties were recorded and the event affected a relatively restricted regional sector, with rainfall lasting less than one day. This case confirms the negative trend of heavy daily precipitation detected in Calabria [23]. Despite the damage affecting the east side of the region, daily rainfall was not extraordinary: the highest T value was 20 years. On the contrary, high values of T were assessed for rainfall lasting 1, 3 and 6 h (Figure 8), equal to 50, more than 200 and more than 100 years, respectively.
Figure 8. Return period (T) of maximum hourly rainfalls with duration of (A) 1; (B) 3; and (C) 6 h registered on 19 November 2013 overlapping the map of the damaged municipalities. Different colors indicate different ranges of T, according to the legend.
Water 06 03652 g008
The impressive flood that affected Catanzaro (Figure 4) in part depends on the intense urbanization of those areas near the rivers. This process started in the 1950s, when population growth caused an increase in the demand for housing. Two maps of the town depicting both 1940 and 1990 configurations show the differences in the urbanized sectors near the rivers.
The S. Maria and Catanzaro Lido neighborhoods show the stronger modifications, with an urbanized area that increased almost tenfold in 50 years (Figure 9). During this period, weirs were built along the rivers, leading to a greater concentration of vulnerable elements in flood-prone areas.
Figure 9. Evolution of urbanized areas (striped areas) in the Catanzaro, from (A) 1940 to (B) 1990 (IGM maps 1940 and 1990). Black and blue lines are roads and rivers, respectively.
Water 06 03652 g009

4. Conclusions

The paper analyzed damaging hydrogeological events, defined as rainfall events able to trigger floods and landslides, thereby causing damage events. The characteristics of both triggering rainfall events and the consequent damage events strictly depend on climatic, geological, geomorphological and anthropogenic factors, which vary from region to region.
A methodology to classify severity of DHEs, based on both rainfall and damage indicators, was presented. A chart expressing the overall severity of the events was created using the values obtained from the indicators of damage and rainfall severity during past events. The scale of the chart is set depending on the values of Dscore and Rscore recorded in the study area. The chart is divided into four sectors: ordinary events, with the lowest values of both Dscore and Rscore; extraordinary events, with high values of Rscore but low values of Dscore; catastrophic events, during which even after non-exceptional rainfall (Rscore low) severe damage occurs (Dscore high); and major catastrophic events, characterized by the highest values of both Dscore and Rscore.
A practical application carried out on Calabria (Italy) highlighted the characteristics of regional events. According to this approach, the event that hit the region in 2013 has been classified as an ordinary event, when compared to the previous ones. The rainfall that triggered this event confirms the negative trend of heavy daily precipitation detected in Calabria, and the damage can be ascribed more to sub-daily than to daily rainfall affecting urbanized flood-prone areas.
This chart has been built using past events. However, the aim is not the analysis of past events. Rather, the objective is to produce a chart that will enable an objective classification of the severity of future events which media accounts and first or second-hand personal accounts fail to provide.
The restriction of the proposed approach is that the chart is representative of a specific area. However, using the proposed approach, when the climatic, geological, geomorphological and anthropogenic characteristics of another study area are available, the characteristic chart of that area can be built.

Acknowledgments

This paper has been undertaken within the framework of the HYMEX (HYdrological cycle in the Mediterranean EXperiment) project.

Author Contributions

The text of this article was written by Tommaso Caloiero and Olga Petrucci. Angela Aurora Pasqua collected all the information about damage caused by DHEs and transcribed these information on the damage database. Olga Petrucci provided the analyses of the DHEs. Tommaso Caloiero provided the hydrological studies.

Conflicts of Interest

The authors declare no conflict of interest.

References

  1. Petrucci, O.; Pasqua, A.A. The study of past Damaging hydrogeological events for damage susceptibility zonation. Nat. Hazards Earth Syst. Sci. 2008, 8, 881–892. [Google Scholar] [CrossRef]
  2. Petrucci, O. Assessment of the Impact Caused by Natural Disasters: Simplified Procedures and Open Problems. In Managing Disasters, Assessing Hazards, Emergencies and Disaster Impacts; Tiefenbacher, J.P., Ed.; InTech Publisher: Rijeka, Croatia, 2012; pp. 109–132. [Google Scholar]
  3. Petrucci, O. Brief communication: The assessment of damage caused by historical landslide events. Nat. Hazards Earth Syst. Sci. 2013, 13, 755–761. [Google Scholar] [CrossRef]
  4. Llasat, M.C.; Llasat-Botija, M.; Petrucci, O.; Pasqua, A.A.; Rosselló, J.; Vinet, F.; Boissier, L. Towards a database on societal impact of Mediterranean floods in the framework of the HYMEX project. Nat. Hazards Earth Syst. Sci. 2013, 13, 1337–1350. [Google Scholar] [CrossRef]
  5. Petrucci, O.; Pasqua, A.A. Damaging events along roads during bad weather periods: A case study in Calabria (Italy). Nat. Hazards Earth Syst. Sci. 2012, 12, 365–378. [Google Scholar] [CrossRef]
  6. Petrucci, O.; Pasqua, A.A. Rainfall-Related Phenomena along a Road Sector in Calabria (Southern Italy). In Landslides, Science and Practice: Social and Economic Impact and Policies; Margottini, C., Canuti, P., Sassa, K., Eds.; Springer: Berlin, Germany, 2013; pp. 145–151. [Google Scholar]
  7. Kipling, R. The Second Jungle Book; Macmillan: London, UK, 1895. [Google Scholar]
  8. Kunkel, K.E.; Andsager, K.; Easterling, D.R. Long-term trends in extreme precipitation events over the conterminous United States and Canada. J. Clim. 1999, 12, 2515–2527. [Google Scholar] [CrossRef]
  9. Villarini, G.; Smith, J.A.; Baeck, M.L.; Vitolo, R.; Stephenson, D.B.; Krajewski, W.F. On the frequency of heavy rainfall for the Midwest of the United States. J. Hydrol. 2011, 400, 103–120. [Google Scholar]
  10. Plummer, N.; Salinger, M.J.; Nicholls, N.; Ramasamy, S.; Hennessy, K.J.; Leighton, R.M.; Trewin, B.; Page, C.M.; Lough, J.M. Changes in climate extremes over the Australian region and New Zealand during the twentieth century. Clim. Chang. 1999, 42, 183–202. [Google Scholar] [CrossRef]
  11. Caloiero, T. Analysis of daily rainfall concentration in New Zealand. Nat. Hazards 2014, 72, 389–404. [Google Scholar] [CrossRef]
  12. Mason, S.J.; Waylen, P.R.; Mimmack, G.M.; Rajaratnam, B.; Harrison, J.M. Changes in extreme rainfall events in South Africa. Clim. Chang. 1999, 41, 249–257. [Google Scholar] [CrossRef]
  13. Osborn, T.J.; Hulme, M.; Jones, P.D.; Basnett, T.A. Observed trends in the daily intensity of United Kingdom precipitation. Int. J. Climatol. 2002, 20, 347–364. [Google Scholar] [CrossRef]
  14. Alpert, P.; Ben-Gai, T.; Baharad, A.; Benjamini, Y.; Yekutieli, D.; Colacino, M.; Diodato, L.; Ramis, C.; Homar, V.; Romero, R.; et al. The paradoxical increase of Mediterranean extreme daily rainfall in spite of decrease in total values. Geophys. Res. Lett. 2002, 29, 1–31. [Google Scholar]
  15. Gonzalez-Hidalgo, J.C.; de Luis, M.; Raventós, J.; Sanchez, J.R. Daily rainfall trend in the Valencia Region of Spain. Theor. Appl. Climatol. 2003, 75, 117–130. [Google Scholar]
  16. Costa, A.C.; Soares, A. Trends in extreme precipitation indices derived from a daily rainfall database for the South of Portugal. Int. J. Climatol. 2009, 29, 1956–1975. [Google Scholar] [CrossRef]
  17. Buttafuoco, G.; Caloiero, T.; Coscarelli, R. Spatial and temporal patterns of the mean annual precipitation at decadal time scale in southern Italy (Calabria region). Theor. Appl. Climatol. 2001, 105, 431–444. [Google Scholar] [CrossRef]
  18. Ferrari, E.; Caloiero, T.; Coscarelli, R. Influence of the North Atlantic Oscillation on winter rainfall in Calabria (southern Italy). Theor. Appl. Climatol. 2013, 114, 479–494. [Google Scholar] [CrossRef]
  19. Caloiero, T.; Buttafuoco, G.; Coscarelli, R.; Ferrari, E. Spatial and temporal characterization of climate at regional scale using homogeneous monthly precipitation and air temperature data: An application in Calabria (southern Italy). Hydrol. Res. 2014. [Google Scholar] [CrossRef]
  20. Rodrigo, F.S.; Trigo, R.M. Trends in daily rainfall in the Iberian Peninsula from 1951 to 2002. Int. J. Climatol. 2007, 27, 513–529. [Google Scholar] [CrossRef]
  21. Toreti, A.; Xoplaki, E.; Maraun, D.; Kuglitsch, F.G.; Wanner, H.; Luterbacher, J. Characterisation of extreme winter precipitation in Mediterranean coastal sites and associated anomalous atmospheric circulation patterns. Nat. Hazards Earth Syst. Sci. 2010, 10, 1037–1050. [Google Scholar] [CrossRef] [Green Version]
  22. Brugnara, Y.; Brunetti, M.; Maugeri, M.; Nanni, T.; Simolo, C. High-resolution analysis of daily precipitation trends in the central Alps over the last century. Int. J. Climatol. 2012, 32, 1406–1422. [Google Scholar] [CrossRef]
  23. Brunetti, M.; Caloiero, T.; Coscarelli, R.; Gullà, G.; Nanni, T.; Simolo, C. Precipitation variability and change in the Calabria region (Italy) from a high resolution daily dataset. Int. J. Climatol. 2012, 32, 57–73. [Google Scholar] [CrossRef]
  24. Groisman, P.Y.; Knight, R.W.; Easterling, D.R.; Karl, T.R.; Hegerl, G.C.; Razuvaev, V.N. Trends in intense precipitation in the climate record. J. Clim. 2005, 18, 1326–1350. [Google Scholar] [CrossRef]
  25. Reiser, H.M.; Kutiel, H. Rainfall uncertainty in the Mediterranean: Time series, uncertainty, and extremes. Theor. Appl. Climatol. 2010, 104, 357–375. [Google Scholar] [CrossRef]
  26. Durao, R.M.; Pereira, M.J.; Costa, A.; Delgado, J.; del Barrio, G.; Soares, A. Spatial-temporal dynamics of precipitation extremes in southern Portugal: A geostatistical assessment study. Int. J. Climatol. 2010, 30, 1526–1537. [Google Scholar]
  27. Karl, T.R. Overview. Clim. Chang. 1999, 42, 1–2. [Google Scholar] [CrossRef]
  28. Alexander, L.V.; Zhang, X.; Peterson, T.C.; Caesar, J.; Gleason, B.; Klein Tank, A.M.G.; Haylock, M.; Collins, D.; Trewin, B.; Rahimzadeh, F.; et al. Global observed changes in daily climate extremes of temperature and precipitation. J. Geophys. Res. 2006, 111. [Google Scholar] [CrossRef]
  29. Moberg, A.; Jones, P.D.; Lister, D.; Walther, A.; Brunet, M.; Jacobeit, J.; Alexander, L.V.; Della-Marta, P.M.; Luterbacher, J.; Yiou, P.; et al. Indices for daily temperature and precipitation extremes in Europe analyzed for the period 1901–2000. J. Geophys. Res. 2006, 111. [Google Scholar] [CrossRef] [Green Version]
  30. Papalexiou, S.M.; Koutsoyiannis, D. Battle of extreme value distributions: A global survey on extreme daily rainfall. Water Resour. Res. 2013, 49, 187–201. [Google Scholar] [CrossRef]
  31. Gumbel, E.J. The return period of flood flows. Ann. Math. Stat. 1941, 12, 163–190. [Google Scholar] [CrossRef]
  32. Pielke, R.A.; Gratz, J.; Landsea, C.W.; Collins, D.; Saunders, M.A.; Musulin, R. Normalized hurricane damage in the United States: 1900–2005. Nat. Hazards Rev. 2008, 9, 29–42. [Google Scholar] [CrossRef]
  33. Barredo, J.I. No upward trend in normalised windstorm losses in Europe: 1970–2008. Nat. Hazards Earth Syst. Sci. 2010, 10, 97–104. [Google Scholar] [CrossRef]
  34. Barredo, J.I. Normalised flood losses in Europe: 1970–2006. Nat. Hazards Earth Syst.Sci. 2009, 9, 97–104. [Google Scholar] [CrossRef]
  35. Di Baldassarre, G.; Castellarin, A.; Brath, A. Analysis on the effects of levee heightening on flood propagation: Some thoughts on the River Po. Hydrol. Sci. J. 2009, 54, 1007–1017. [Google Scholar] [CrossRef]
  36. Di Baldassarre, G.; Viglione, A.; Carr, G.; Kuil, L.; Salinas, J.L.; Blöschl, G. Socio-hydrology: Conceptualising human-flood interactions. Hydrol. Earth Syst. Sci. 2013, 17, 3295–3303. [Google Scholar] [CrossRef]
  37. Antronico, L.; Borrelli, L.; Coscarelli, R.; Pasqua, A.A.; Petrucci, O.; Gullà, G. Slope movements induced by rainfalls damaging an urban area: The Catanzaro case study (Calabria, southern Italy). Landslides 2013, 10, 801–814. [Google Scholar] [CrossRef]
  38. Chen, S.; Luo, Z.; Pan, X. Natural disasters in China: 1900–2011. Nat. Hazards 2013, 69, 1597–1605. [Google Scholar] [CrossRef]
  39. Raschky, P.A. Institutions and the losses from natural disasters. Nat. Hazards Earth Syst. Sci. 2008, 8, 627–634. [Google Scholar] [CrossRef]
  40. Toya, H.; Skidmore, M. Economic development and the impacts of natural disasters. Econ. Lett. 2007, 94, 20–25. [Google Scholar] [CrossRef]
  41. Kellenberg, D.K.; Mobarak, A.M. Does rising income increase or decrease damage risk from natural disasters? J. Urban Econ. 2008, 63, 788–802. [Google Scholar] [CrossRef]
  42. Llasat, M.C.; Llasat-Botija, M.; Barnolas, M.; Lopez, L.; Altava-Ortiz, V. An analysis of the evolution of hydrometeorological extremes in newspapers: The case of Catalonia, 1982–2006. Nat. Hazards Earth Syst. Sci. 2009, 9, 1201–1212. [Google Scholar] [CrossRef]
  43. Papagiannaki, K.; Lagouvardos, K.; Kotroni, V. A database of high-impact weather events in Greece: A descriptive impact analysis for the period 2001–2011. Nat. Hazards Earth Syst. Sci. 2013, 13, 727–736. [Google Scholar] [CrossRef]
  44. Garcia-Urquia, E.; Axelsson, K. The use of press data in the development of a database for rainfall-induced landslides in Tegucigalpa, Honduras, 1980–2005. Nat. Hazards 2013, 73, 237–258. [Google Scholar] [CrossRef]
  45. Pereira, S.; Zêzere, J.L.; Quaresma, I.D.; Bateira, C. Landslide incidence in the North of Portugal: Analysis of a historical landslide database based on press releases and technical reports. Geomorphology 2014, 214, 514–525. [Google Scholar] [CrossRef]
  46. Wirtz, A.; Kron, W.; Löw, P.; Steuer, M. The need for data: Natural disasters and the challenges of database management. Nat. Hazards 2014, 70, 135–157. [Google Scholar] [CrossRef]
  47. Petrucci, O.; Polemio, M.; Pasqua, A.A. Analysis of damaging hydrogeological events: The case of the Calabria Region (Southern Italy). Environ. Manag. 2009, 43, 483–495. [Google Scholar] [CrossRef] [Green Version]
  48. Aceto, L.; Petrucci, O. Identification of rainfall triggering damaging hydrogeological events: A methodological approach applied to Calabria (Italy). In Proceedings of ICWRS2014, Bologna, Italy, 4–6 June 2014; Volume 364, pp. 153–158.
  49. Llasat, M.C.; Petrucci, O.; Gilabert, J.; Pasqua, A.A.; Llasat-Botija, M.; Marcos, R.; Turco, M.; Quintana-Segui, P.; Rosselló, J. A bottom-up approach to historical floods characterization. In Proceedings of the 8th HyMeX Workshop, La Valletta, Malta, 15–18 September 2014.
  50. Buttafuoco, G.; Caloiero, T. Drought events at different timescales in southern Italy (Calabria). J. Maps 2014, 10, 529–537. [Google Scholar] [CrossRef]
  51. Pellicone, G.; Caloiero, T.; Coletta, V.; Veltri, A. Phytoclimatic map of Calabria (Southern Italy). J. Maps 2014, 10, 109–113. [Google Scholar] [CrossRef]
  52. Petrucci, O.; Versace, P. Frane e Alluvioni in Provincia di Cosenza Agli Inizi del ‘900: Ricerche Storiche nella Documentazione del Genio Civile. In I Quaderno dell’Osservatorio di Documentazione Ambientale (Dip. Difesa del Suolo, UNICAL); Editoriale Bios: Rende, Italy, 2005. (In Italian) [Google Scholar]
  53. Petrucci, O.; Versace, P. Frane e Alluvioni in Provincia di Cosenza tra il 1930 e il 1950: Ricerche Storiche nella Documentazione del Genio Civile. In II Quaderno dell’Osservatorio di Documentazione Ambientale (Dip. Difesa del Suolo, UNICAL); Editoriale Bios: Rende, Italy, 2007. (In Italian) [Google Scholar]
  54. Petrucci, O.; Versace, P.; Pasqua, A.A. Frane e Alluvioni in Provincia di Cosenza fra il 1951 ed il 1960: Ricerche Storiche nella Documentazione del Genio Civile. In III Quaderno dell’Osservatorio di Documentazione Ambientale (Dip. Difesa del Suolo, UNICAL); Rubbettino: Soveria Mannelli, Italy, 2009. (In Italian) [Google Scholar]
  55. Palmieri, W.; Petrucci, O.; Versace, P. La Difesa del Suolo nell’Ottocento nel Mezzogiorno d'Italia. In IV Quaderno dell’Osservatorio di Documentazione Ambientale (Dip. Difesa del Suolo, UNICAL); Rubbettino: Soveria Mannelli, Italy, 2011. (In Italian) [Google Scholar]
  56. Gullà, G.; Caloiero, T.; Coscarelli, R.; Petrucci, O. A proposal for a methodological approach to the characterization of widespread landslide events: An application to Southern Italy. Nat. Hazards Earth Syst. Sci. 2012, 12, 165–173. [Google Scholar] [CrossRef] [Green Version]
  57. Petrucci, O.; Pasqua, A.A.; Polemio, M. Impact of Damaging Geo-Hydrological Events and Population Development in Calabria, Southern Italy. Water 2013, 5, 1780–1796. [Google Scholar] [CrossRef]
  58. Petrucci, O.; Polemio, M. The role of meteorological and climatic conditions in the occurrence of damaging hydro-geologic events in Southern Italy. Nat. Hazards Earth Syst. Sci. 2009, 9, 105–118. [Google Scholar] [CrossRef]

