Article

Impact of Meadow Degradations on the Probabilistic Distribution Patterns of Physical and Mechanical Indices of Rooted Soil in the Upper Regions of the Yellow River, China

1
Academy of Agriculture and Forestry Sciences, Qinghai University, Xining 810016, China
2
School of Geological Engineering, Qinghai University, Xining 810016, China
3
School of Agriculture and Animal Husbandry, Qinghai University, Xining 810016, China
*
Author to whom correspondence should be addressed.
Water 2024, 16(9), 1205; https://doi.org/10.3390/w16091205
Submission received: 31 August 2023 / Revised: 26 November 2023 / Accepted: 14 December 2023 / Published: 24 April 2024

Abstract

:
The shear strength (particularly soil cohesion) of rooted soil is an important parameter that reflects the true erodibility of meadows, particularly in meadows experiencing different degrees of degradation, ranging from undegraded (UD) through to lightly degraded (LD) and from moderately degraded (MD) to heavily degraded (HD). The cohesion of rooted soil is controlled not only by the soil moisture content and its natural density, but also by roots (including not only their density, spatial distribution, and diameters, but also their tensile strength). This study aimed to improve the current understanding of the erosion resistance of rooted soil and elucidate the impact of meadow degradation on the physical–mechanical indices of rooted soil. Based on this discussion, a one-way analysis of variance was performed at significance levels of 0.05 and 0.01 to test the impact of degradation on the physical–mechanical indices of rooted soil across degradation. Furthermore, the probabilistic distributions of the physical–mechanical indices were described using normal, gamma, Weibull, and generalized extreme values (GEV). The Kolmogorov–Smirnov (KS) test was used to identify the optimal distribution based on p-values and the Pearson correlation coefficient was used to quantify the correlation between the cohesion of rooted soil and other indices. The one-way ANOVA indicated that the soil’s natural density and soil moisture content decreased firstly, followed by an increase, the root amount and cohesion decreased, the root content experienced an initial increasing and then decreasing trend, and the internal friction angle exhibited a stepwise increasing trend. The four distributions sufficiently described the actual distribution of data on the physical–mechanical indices of rooted soil, except for the internal friction angle in UD and MD soils and the soil moisture content in MD soil. Additionally, the KS tests showed that the optimal distribution depended on both the physical–mechanical indices themselves and the degree of degradation. The Pearson correlation analysis showed that the correlation between cohesion and the other physical–mechanical indices varied considerably depending on the degree of degradation.

1. Introduction

Meadow degradation is a global environmental issue because it leads to the destruction of soil, a reduction in vegetation cover, and the loss of stored soil organic carbon and other soil nutrients or fertilities, thus, causing the retrogression of the vegetation’s composition and the deterioration of the meadow’s ecological system owing to irrational human activities, pika infections, and global climate change [1,2,3]. Shear strength indices (particularly soil cohesion) have attracted increasing attention in recent years because they reflect the degree of meadow degradation and the capacity of meadow soil to withstand erosion triggered by wind, overland flow, and freeze–thawing cycles [4,5,6,7]. Several factors influence the shear strength of meadow soil in the upper layer (0~20 cm), which have been identified by many authors [8,9,10]. For example, Liu et al. (2020) [11] found that meadow degradation led to a variation in the shear strength, moisture content, and natural density of rooted soil, and the shear strength in an undegraded meadow had higher values than in a degraded meadow. Vegetation roots in soil also exert a noticeable effect on its shear strength, and the magnitude of this effect is dependent on the root amount or root content (root mass in rooted soil). Fu et al. (2016, 2019) [12,13] and Wang et al. (2021) [4] found that soil cohesion was positively correlated with the soil root content. Thus, the shear strength (cohesion) of meadow soils containing a large amount of plant roots is the result of the combined effects of several physical–mechanical properties of soils (e.g., the biomechanical properties of roots, soil microstructure, soil density, soil moisture content, and root content [4,14,15,16]), and it, therefore, exhibits considerable variability [17]. Therefore, understanding the variability of these indices and identifying the correlation between the shear strength (cohesion) of meadow soil and its physical–mechanical indices would facilitate the accurate evaluation of the quality and erosion resistance of the soil. Owing to the great variability led by its complex components, it is hard to determine an appropriate quantitative assessment on the physical–mechanical indices of rooted soil.
A method based on the probability theory, in which the variation in the indices is described using a distributional function to predict/quantify their values, is a feasible alternative and, therefore, has been taken into practice for decades [18,19]. All of these studies provided sufficient inferences for us to completely determine a rational and accurate assessment on the actual values of soil or rock properties. However, nearly no such investigations had been conducted to study the variability and uncertainty of pasture soils. The shear strength of soil devoid of roots is typically controlled by its type, structure, particle size composition, water content, density, chemical composition, and formation conditions. Unlike soil devoid of roots, rooted soil (namely, meadow soil that consists of roots of herbs and the surrounding soil, forming a special composite named rooted soil) in meadows exhibits certain intrinsic characteristics in terms of its physical–mechanical properties, including its shear strength. Therefore, the shear strength of rooted soil is controlled not only by the aforementioned indices, but also by the number of roots, root distribution, biomechanical properties of roots, and vegetation root litter [4,9,20]. All these indices increase the difficulties of using the probability theory to predict the values of the shear strength indices of rooted soil.
In recent years, under the influence of global climate warming, unsustainable exploration activity, overgrazing, and disturbance due to pikas (e.g., Ochotona curzoniae), alpine meadows in the Qinghai–Tibet Plateau (QTP) have experienced considerable degradation [1,2,3,21,22,23,24], which has led to a reduction in vegetation cover, meadow biodiversity, and soil organic matter, and the loss of nutrient and water content; this, in turn, has aggravated meadow degradation, decreased soil shear strength, and, hence, increased soil erodibility. Thus, a better understanding of the variability and the probability distribution of the physical–mechanical indices of rooted soil in meadows would facilitate the rational assessment of the actual condition of meadow soil. Moreover, the shear strength of rooted soils in meadows exhibiting different degrees of degradation may differ because of their differences in their root content, moisture content, and root composition. However, the current understanding of the impact of meadow degradation on the physical–mechanical properties and on the probabilistic distribution of the physical–mechanical indices is far from sufficient. It is unknown whether physical–mechanical indices (shear strength indices, soil moisture content, soil natural density, root content, and root amount) of meadow soils experiencing different degrees of degradation follow the same probabilistic distribution. In addition, it is unclear whether the correlation between the shear strength and physical–mechanical indices of meadow soil remains constant regardless of the degree of meadow degradation. Furthermore, the specific indices that strongly influence the shear strength of rooted soil have not been identified. This gap in the understanding of the probabilistic distribution of the physical–mechanical indices of rooted soil caused a difficulty in estimating the erosion resistance of meadow soils.
The objective of this study was to investigate: (1) the impact of meadow degradation on the physical–mechanical properties of rooted soil; (2) the probabilistic distribution trend of the physical–mechanical indices of rooted soil for meadows experiencing different degrees of degradation; and (3) the correlation of cohesion with these physical–mechanical indices, which impact the shear strength of rooted soil.

2. Study Area

The study area (101°28′ E and 34°51′ N) is located in Henan county, Huangnan Tibetan Autonomous Prefecture, in the eastern part of the source region of the Yellow River, Qinghai, China (Figure 1). The terrain is high in the northeast and low in the southwest. It is also characterized by high mountains and deep valleys in the south and flat pains in the north. The highest elevation is 4539 m above sea level (a.s.l.) and the lowest is 3168 m a.s.l.; most of the area is located above 3600 m a.s.l. The climate condition is a plateau continental climate characterized by strong solar radiation, short cool summers, but long cold winters, with a mean temperature of −1.3 to −1.6 °C, sparse precipitation, but strong evaporation, with an annual precipitation of 615.5 mm and evaporation of 1592 mm [25]. The precipitation is generally concentrated between summer and autumn, accounting for nearly 80% of the total annual precipitation. The soil type in this region is sandy soil and mainly composed of alpine meadow soil characterized by high levels of potassium and nitrogen ions, but lower levels of phosphonium ions.
The study area is generally covered by a high-altitude alpine meadow. It was selected because it is a typical high-altitude alpine meadow and is subjected to severe soil erosion triggered by meadow degradation due to overgrazing, irrational anthropogenic engineering activities, burrowing by pikas, and freeze–thaw cycles [7,10,25,26]. According to the vegetation coverage (vegetation coverage ≥ 90% for undegraded (UD) meadow, 70% ≤ vegetation coverage ≤ 90% for lightly degraded meadow (LD) [26], 20% ≤ vegetation coverage ≤ 70% for moderately degraded meadow (MD), and vegetation coverage ≤ 20% for heavily degraded meadow (HD)) and the succession stages of vegetation phytosociological composition, the study area was categorized into four categories.
Plant communities in UD were dominated by Kobresia humilis Serg., Poa annua L., Stipa purpurea Griseb., and Elymus nutans Griseb. Plant communities in LD were dominated by Carex moorcroftii Falc., Elymus nutans Griseb., Gentiana straminea Maxim., and Leontopodium leontopodioides (Willd.). The predominant vegetation in both UD and LD belong to the Cyperaceae or Gramineae families, whose roots are generally characterized by numerous developed fibrous roots that generate a glue-like effect, bonding soil particles together, and, therefore, increasing the additional cohesion of the soil and, thus, are more efficient in reducing soil erosion. In MD, the predominant species were Potentilla anserina L., Lancea tibetica Hook.f. et Thoms, Ajuga lupulina Maxim., and Ajania tenuifolia (Jacq.) Tzvel, and in HD, the predominant species were Elsholtzia densa Benth. and Stellaria alaschanica Y.Z. Zhao., all of which generally have long main taproots with shorter lateral and secondary roots. The study area is prone to erosion because of strong erosive forces (overstock, irrational human activities, and global warming), steep terrain, and weak soil type, and a considerable percentage of the study area experiences degradation in different degrees. In recent decades, some ecological measures have been adapted to restore the local ecosystem, such as grazing prohibition, land utilization-type changes, controlling the livestock and plateau pika population, and artificial revegetation [8,27,28,29].

3. Materials and Methods

3.1. Rooted Soil Sampling and Its Physical–Mechanical Properties Analysis

Four sampling sites were chosen according to the degree of meadow degradation in the study area. To ensure the representativeness of the sampling data, the sampling localities were determined by randomly throwing a 50 cm × 50 cm sample box. After the sampling localities were determined, the aboveground parts of the plants in the sample boxes were cut off with scissors. Owing to most vegetation in UD and LD in the study area belonging to the Gramineae and Cyperaceae families with their roots extending to depths of no more than 30 cm, and surface soil erosion (mainly caused by overgrazing, runoff, repeated cycles of freezing and thawing, and excavation activities of pikas) generally occurring in the depth of 30 cm, the sampling depth of rooted soil was set at a depth of 20 cm below the surface. Rooted soil was collected with ring knives to determine its shear strength, soil natural density, root content (the mass of roots in unit volume of rooted soil, its unit being mg/cm3), and root quantities (number of roots in unit volume of rooted soil, its unit being roots/cm3). The shear strength (cohesion and internal friction angle, herein cohesion covers the cohesion of soil devoid of roots and additional cohesion due to the presence of roots in soil and, hence, named root reinforcement [11,12,29] of rooted soil was determined using a strain-controlled direct shear apparatus. After a direct shear test, the soil’s natural density was measured using an electronic balance with its precision reaching 0.01 g. After that, rooted soil was placed into a sieve, running water was used to wash the rooted soil to removed soil particles attached to roots, hence, leaving only roots in the sieve, and, subsequently, the root weight was measured using an electronic balance with its resolution of 0.01 g. Thus, the root content was obtained by dividing the mass of the roots in one rooted soil sample by its weight (weight of the corresponding rooted soil sample). The root amount was obtained through the following ways: for fine roots, 20 roots (roots for the Gramineae and Cyperaceae families are numerous fine roots and it is hard to obtain their amount by counting) were randomly selected to measure their weight that was divided by 20 to obtain the weight for one root because roots in rooted soil are generally identical to 20 mm, and the total weight of fine roots in one rooted soil sample was divided by the weight of one root to obtain the number of fine roots indirectly. However, for coarse roots (roots for P. anserina, L. tibetica, A. lupulina, A. tenuifolia, E. densa, and S. alaschanica), the number was directly counted. Aluminum boxes were used to collect soil samples to determine the soil moisture content.

3.2. Statistical Analysis

First, a one-way analysis of variance (ANOVA) and a least significant difference (p < 0.05 and p < 0.01) analysis were performed to detect spatial variations in the physical–mechanical indices (soil natural density, soil moisture content, cohesion, internal friction angle, root content, and root amount) of rooted soil for meadows exhibiting different degrees of degradation. According to the references by Fu et al. (2020) [13] and Su et al. (2001) [30], we discovered that the soil’s natural density, root content, cohesion, and internal friction angle of rooted soil generally followed the normal, Weibull, gamma, and general extreme value (GEV) distributions. Thus, in this study, the normal, gamma, Weibull, and GEV distributions were selected as the candidate distribution functions to describe the actual distribution of the physical–mechanical indices (namely, the natural density, moisture content, cohesion, internal friction angle, root content, and root amount) of rooted soil. Subsequently, the Kolmogorov–Smirnov (KS) test was performed according to the method described by Fu et al. (2020) [13] to quantitatively identify the best-fit functions (optimal distribution) for the six physical–mechanical indices of rooted soil among the four probabilistic distribution functions. Finally, to quantitatively determine the correlations between the cohesion of rooted soil and its physical–mechanical indices, an analysis of the Pearson correlation coefficient at a significance level of p < 0.05 was carried out. All statistical analyses and drawings were performed using the R 4.1.4 software package.

4. Test Results and Analysis

4.1. Response of the Physical–Mechanical Indices to Degradation

The soil’s natural density (Figure 2A) initially decreased from UD (1.30 g/cm3) to LD (1.20 g/cm3) and then increased to HD (1.33 g/cm3) with nearly no extreme significant difference (p < 0.01) through all the degradation level treatments (from UD to HD) except for LD; the soil moisture content (Figure 2B) showed an abrupt drop from UD (42.58%) to LD (28.29%), but a slight increase from MD (24.87%) to HD (28.80%), with no significant difference among the degradations, except for UD; in terms of root amounts (Figure 2C), it decreased from 1.60 roots/cm3 in UD to 0.46 roots/cm3 in HD with no extreme significant difference occurring among the degradations (p < 0.01) except for HD; the root content initially increased from UD to LD, and then decreased till HD, with no significant difference occurring among the degradations, except for HD (p < 0.01 and p < 0.05, Figure 2D); additionally, the mean values of the root content in both UD and LD were several orders of magnitudes of that in MD and HD, indicating a large variability across the entire degradations. Cohesion exhibited a gradually decreasing trend from approximating 20 kPa in UD to merely 8 kPa in HD (a decrease of nearly 80%, see Figure 2E), with no significant difference observed across treatments (p < 0.01 and p < 0.05), except for HD. Additionally, the value in both UD and LD was over several orders of magnitude of that in MD and HD, indicating the high efficiency of roots in both the UD and LD in providing additional cohesion. The internal friction angle experienced a monotonic increase of 7.11%, from 22.94° in UD to 24.57° in HD, and an extreme significant difference (p < 0.01 and p < 0.05, see Figure 2F) was observed between the treatments, indicating their narrow variation.

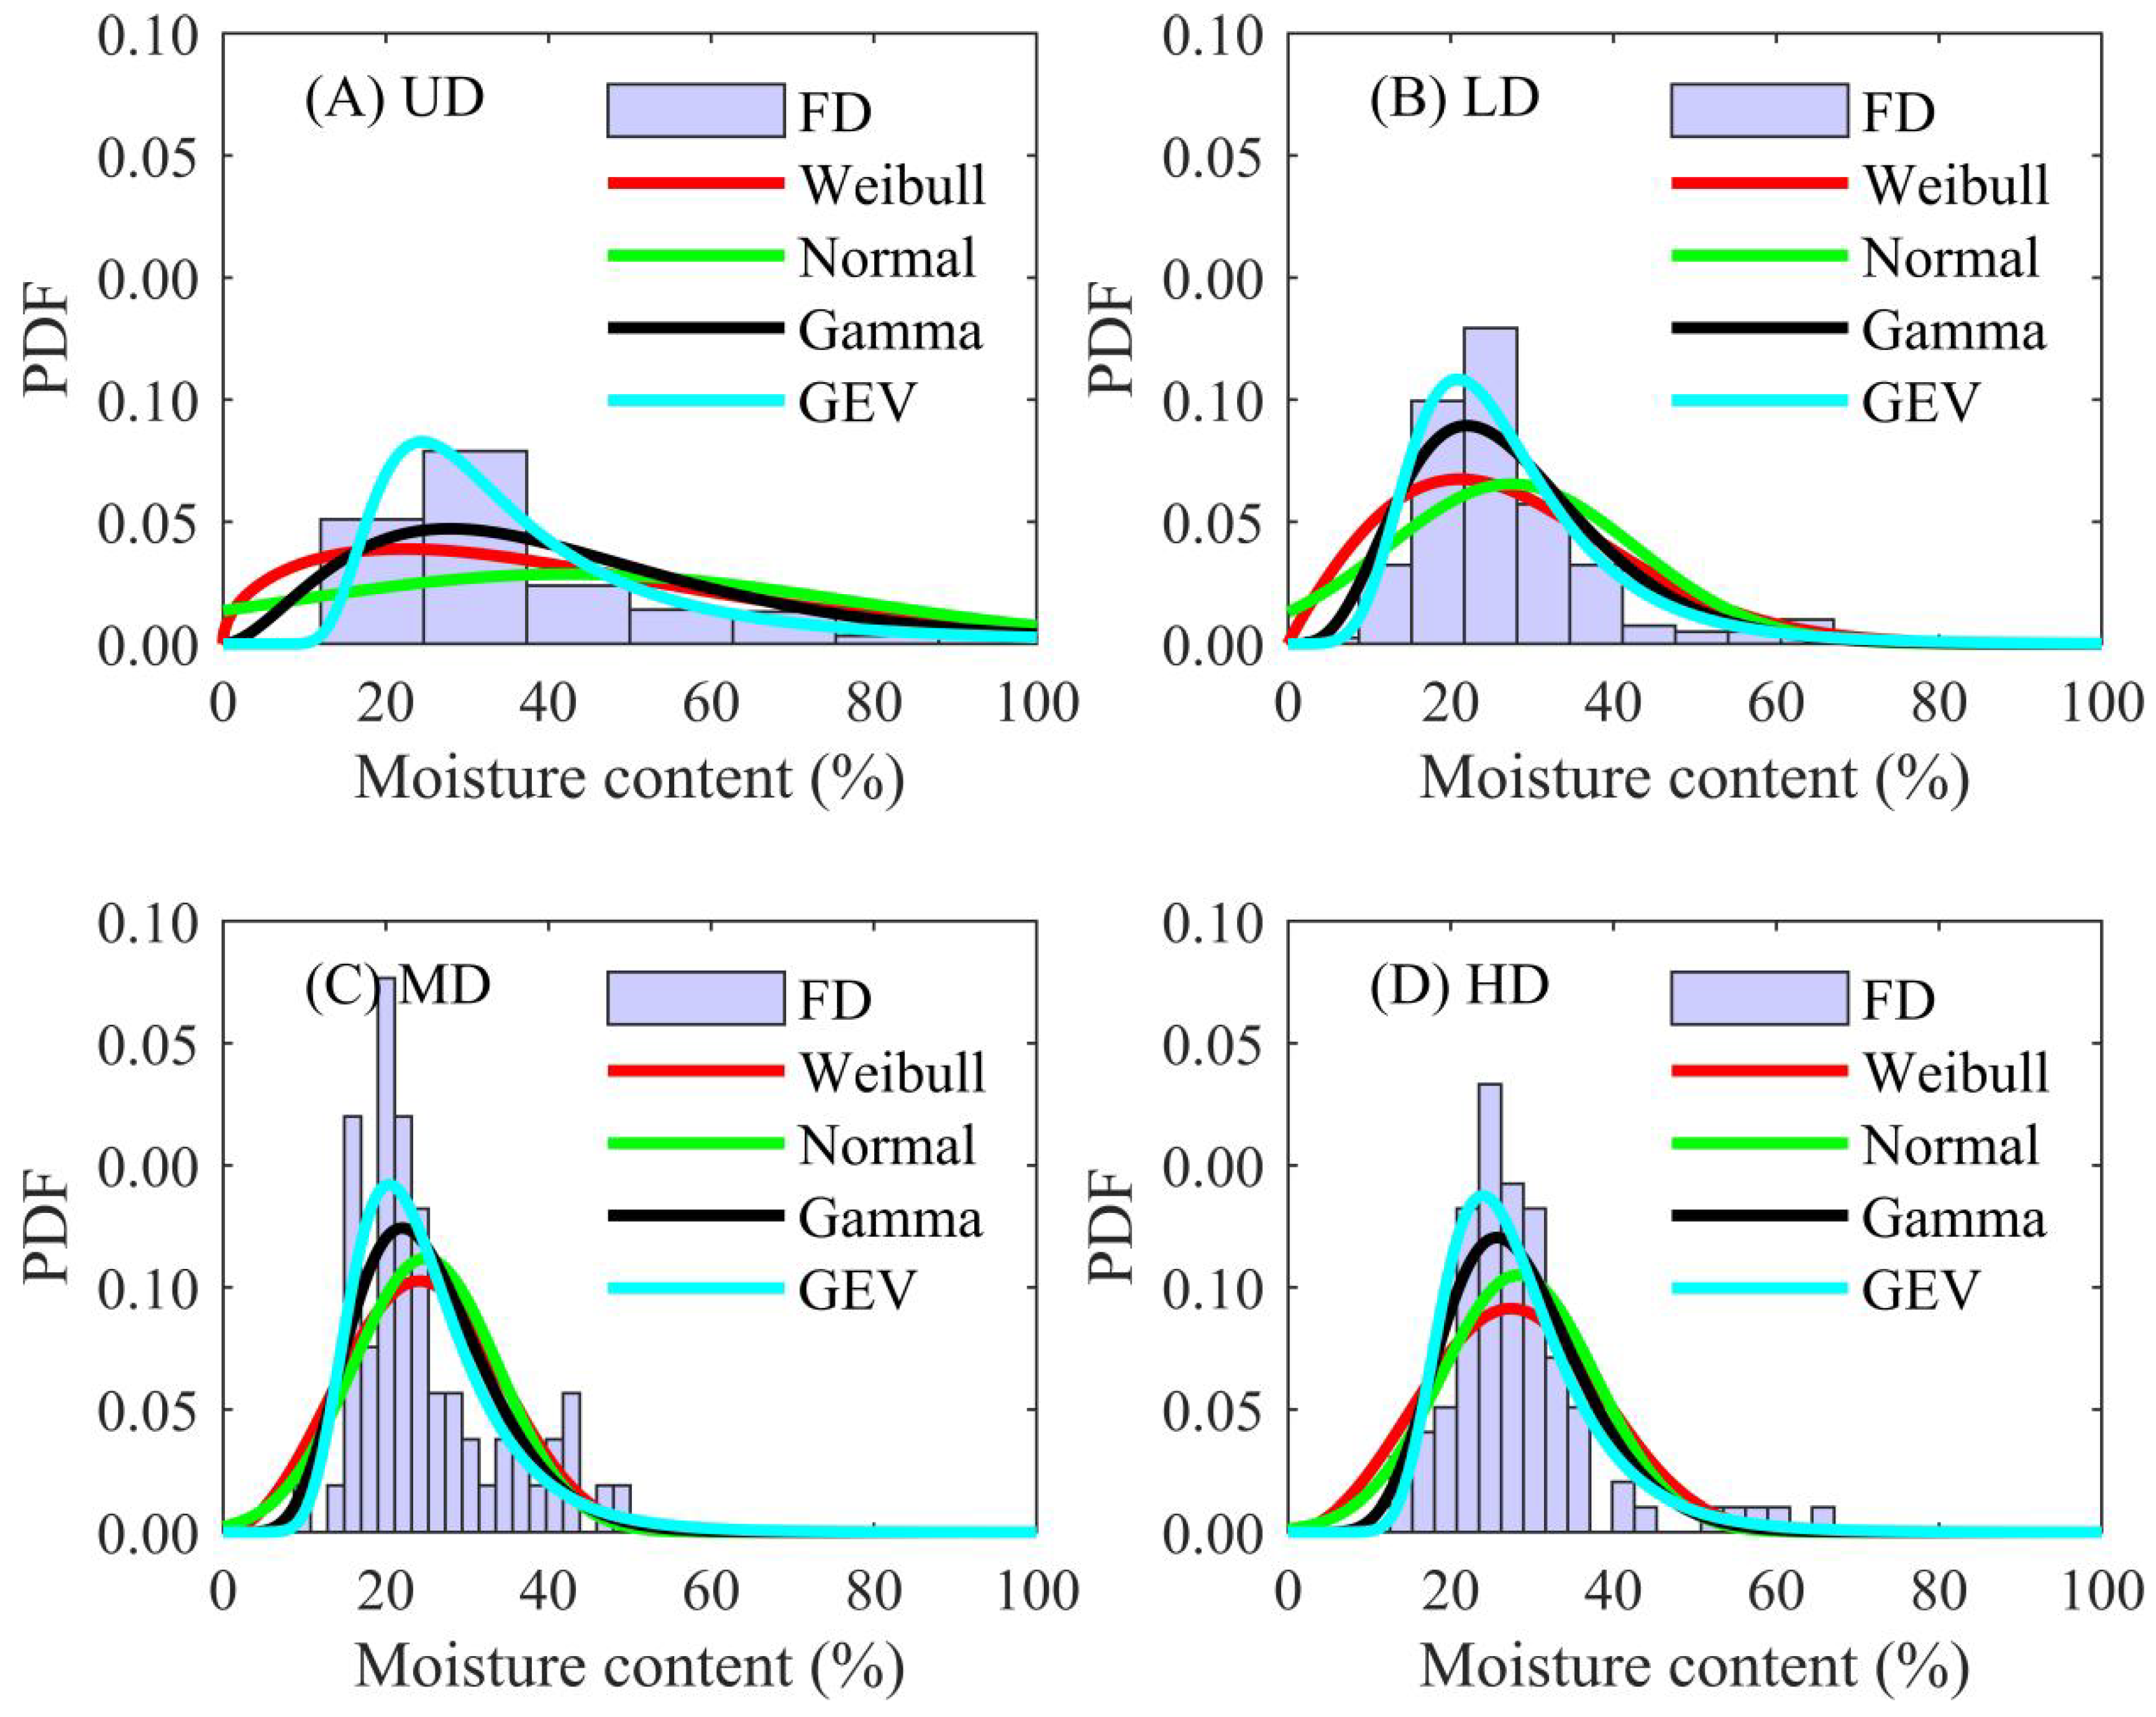
4.2. Probabilistic Distribution of Physical–Mechanical Indices

To qualitatively investigate the impact of meadow degradation on the probabilistic distribution of the physical–mechanical indices of rooted soil, the similarities between the distribution frequency (DF) of each physical–mechanical index and its corresponding distribution probability density function (PDF) were compared; the greater the similarity between the shape of the PDF curve and that of the DF, the more suitable this distribution function was to describe the distribution of this index. DFs and their corresponding PDF (Weibull, normal, gamma, and general extreme value) curves for the physical–mechanical indices are presented in Figure 3, Figure 4, Figure 5, Figure 6, Figure 7 and Figure 8.
The DFs and their corresponding PDF curves for the soil natural density of rooted soil across the degradations exhibited different shape characteristics (Figure 3). The DF of UD showed a gradual transition from a lower height at its left and right ends to a higher height in the center (Figure 3A); its skewness of −0.0553 and kurtosis of 2.6284 indicated its left-skewed distribution (Table 1). The shapes of the corresponding four PDF curves of UD were similar to that of the DF, indicating that the PDFs of the four distributions could effectively simulate the actual distribution of the soil natural density of rooted soil in UD. The DF of LD had a skewness of 0.2838 and a kurtosis of 2.4720, indicating its right-skewed distribution. Like UD, the shapes of the PDF curves for the soil natural density in LD were similar to that of its DF (Figure 3B), indicating that the four distributions were capable of describing the actual distribution of the soil natural density in LD. Unlike UD and LD, the shape of the DF for soil natural density in MD resembled a podium (i.e., its variation was simple, not complex; Figure 3C); its skewness of 6.5136 and kurtosis of 48.9796 indicated its right-skewed distribution. The shapes of the four PDF curves differed significantly from that of the DF, indicating that the four distributions were not suitable for simulating the actual distribution of the soil natural density in MD. For HD, the skewness was 0.2647 and the kurtosis was 3.0953, indicating a right-skewed distribution. The shape of the DF for HD resembled a bell, as was the case for UD (Figure 3D). However, the DF for UD increased gradually from both ends toward the center, whereas that for HD increased sharply from both ends toward the center, indicating that HD showed a lower discreteness in natural soil density than UD. The shapes of the PDF curves were similar to that of the DF, indicating that the four distributions were suitable for describing the actual distribution of the soil natural density of HD.
As the degree of degradation increased from UD to HD, the range of the DFs for the soil moisture content along the x-axis narrowed gradually, whereas that along the y-axis (i.e., the height) increased gradually, indicating that the discreteness of the soil moisture content decreased, but its concentration increased in a stepwise manner (Figure 4). In addition, as the degree of degradation increased, the maximum values in DF values decreased from more than 30% to more than 20%, indicating a decreasing trend in the soil moisture content from UD to HD. Furthermore, under all four degrees of degradation, the shape of only the GEV curve was most close to that of the corresponding DF, followed by normal, gamma, or Weibull, meaning that all of the four distributions, particularly the GEV distribution, were suitable for describing the actual distribution of the soil moisture content, regardless of the degree of degradation.
As illustrated in Figure 5, it can be seen that the shape of the DF of the root content across the degradation, particularly in UD, exhibited a declining trend with the root content, indicating their right-skewed distributional properties (skewness value of 2.6199 and 2.4767, and 0.8655 and 1.7444, respectively) and, thus, most of their values were distributed in the left parts of the x-axis. In addition, for UD and LD, among the four PDFs, their GEV shapes were most close to that of the corresponding DFs, followed by the Weibull, gamma, and normal distributions, indicating that the GEV was among the most suitable candidates for describing the actual distribution of root content in UD and LD. As for MD, the shape of the normal curve was most close to that of the corresponding DF, followed by the gamma, Weibull, and GEV distributions, indicating that all of the four distributions (particularly the normal distribution) were suitable for describing the distribution of the root content for MD. Similar to MD, in HD, almost all of the four distributions could be adapted to simulate the distribution of the root content in HD.
Figure 6A,B can be considered as one group, and Figure 6C,D can be considered as another group. As the degree of degradation increased, the DFs in UD and LD were broad and tall in shape, and they exhibited a wide x-axis range (0~5 roots/cm3) with an abrupt initial increase followed by a gradual decrease. In contrast, as the degree of degradation increased, the DFs in MD and HD were narrow and tall in shape, and they exhibited a narrow x-axis range (0~2 roots/cm3) with a sharp decreasing trending. This indicated a large discreteness in the root amount in both UD and LD and a small discreteness in the root amount in MD and HD. The shapes of the PDF curves were similar to those of the corresponding DFs under all four degrees of degradation, indicating that nearly all distributions were suitable for describing the distribution of the root amounts for meadows experiencing different degrees of degradation.
As the degree of degradation increased from UD to HD, the shapes of the DFs for the cohesion of rooted soil exhibited a transition from broad and short to narrow and tall, indicating a large discreteness in cohesion in UD and LD, but a small discreteness in cohesion in MD and HD (Figure 7). Additionally, the maximum DF values decreased from approximately 20 kPa in UD and LD to approximately 10 kPa in MD and HD, indicating that the cohesion of rooted soil decreased considerably as the degree of meadow degradation increased. Meanwhile, the shapes of the PDF curves of the distribution of the cohesion of rooted soil were similar to the shapes of their corresponding DFs under all degrees of degradation, meaning that nearly all distributions were suitable for simulating the actual distribution of the cohesion of rooted soil in meadows experiencing different degrees of degradation.
The shapes of the DFs of the internal friction angles of rooted soil under all four degrees of meadow degradation resembled a bell (Figure 8); the skewness values of UD, LD, MD, and HD were −1.2402, 0.3128, 1.0240, and −0.3574, respectively, indicating that the distribution of internal friction angles in UD and HD was left-skewed, while in LD and MD, it was right-skewed. Moreover, the shapes of the four distribution functions were similar to those of the corresponding DFs across the entire degradation, indicating that the four distributions were suitable for describing the actual distribution of the internal friction angle of rooted soil regardless of their degradation.

4.3. KS Tests

To quantitatively investigate the influence of meadow degradation on the distribution pattern of the physical–mechanical indices in the test area, the goodness of fit for the aforementioned indices was tested via KS tests at a significance level of 0.01 (Table 2). The p-value derived from the KS test reflects the closeness of the actual distribution of each index to its corresponding theoretical distribution. As long as the p-value of a certain index for a certain distribution is greater than 0.01, that distribution is suitable for describing the actual distribution of the index. Additionally, the larger the p-value, the closer the distribution of the index is to its corresponding theoretical distribution, which means that the distribution with the highest p-value for a certain index is the optimal distribution for that index. For example, although all distribution functions were suitable for simulating the distribution of the soil natural density in UD because the p-values for all of the PDF were greater than 0.01, the optimal distribution function was the Weibull distribution function (p-value of 0.7494 greater than any other values). It is important to note also that although all four distributions could be adopted to simulate the distributions of almost all targeted physical–mechanical indices and the optimal distribution function for these indices was also identified based on their P-values, there were some indices whose distributions were not described well using the four functions. For example, for the internal friction angle, the gamma, Weibull, and GEV distributions, except for the normal distribution, failed to describing its probabilistic distribution, so the only appropriate distribution (and also the optimal distribution) for the internal friction angle was the normal function, albeit with low p-values.

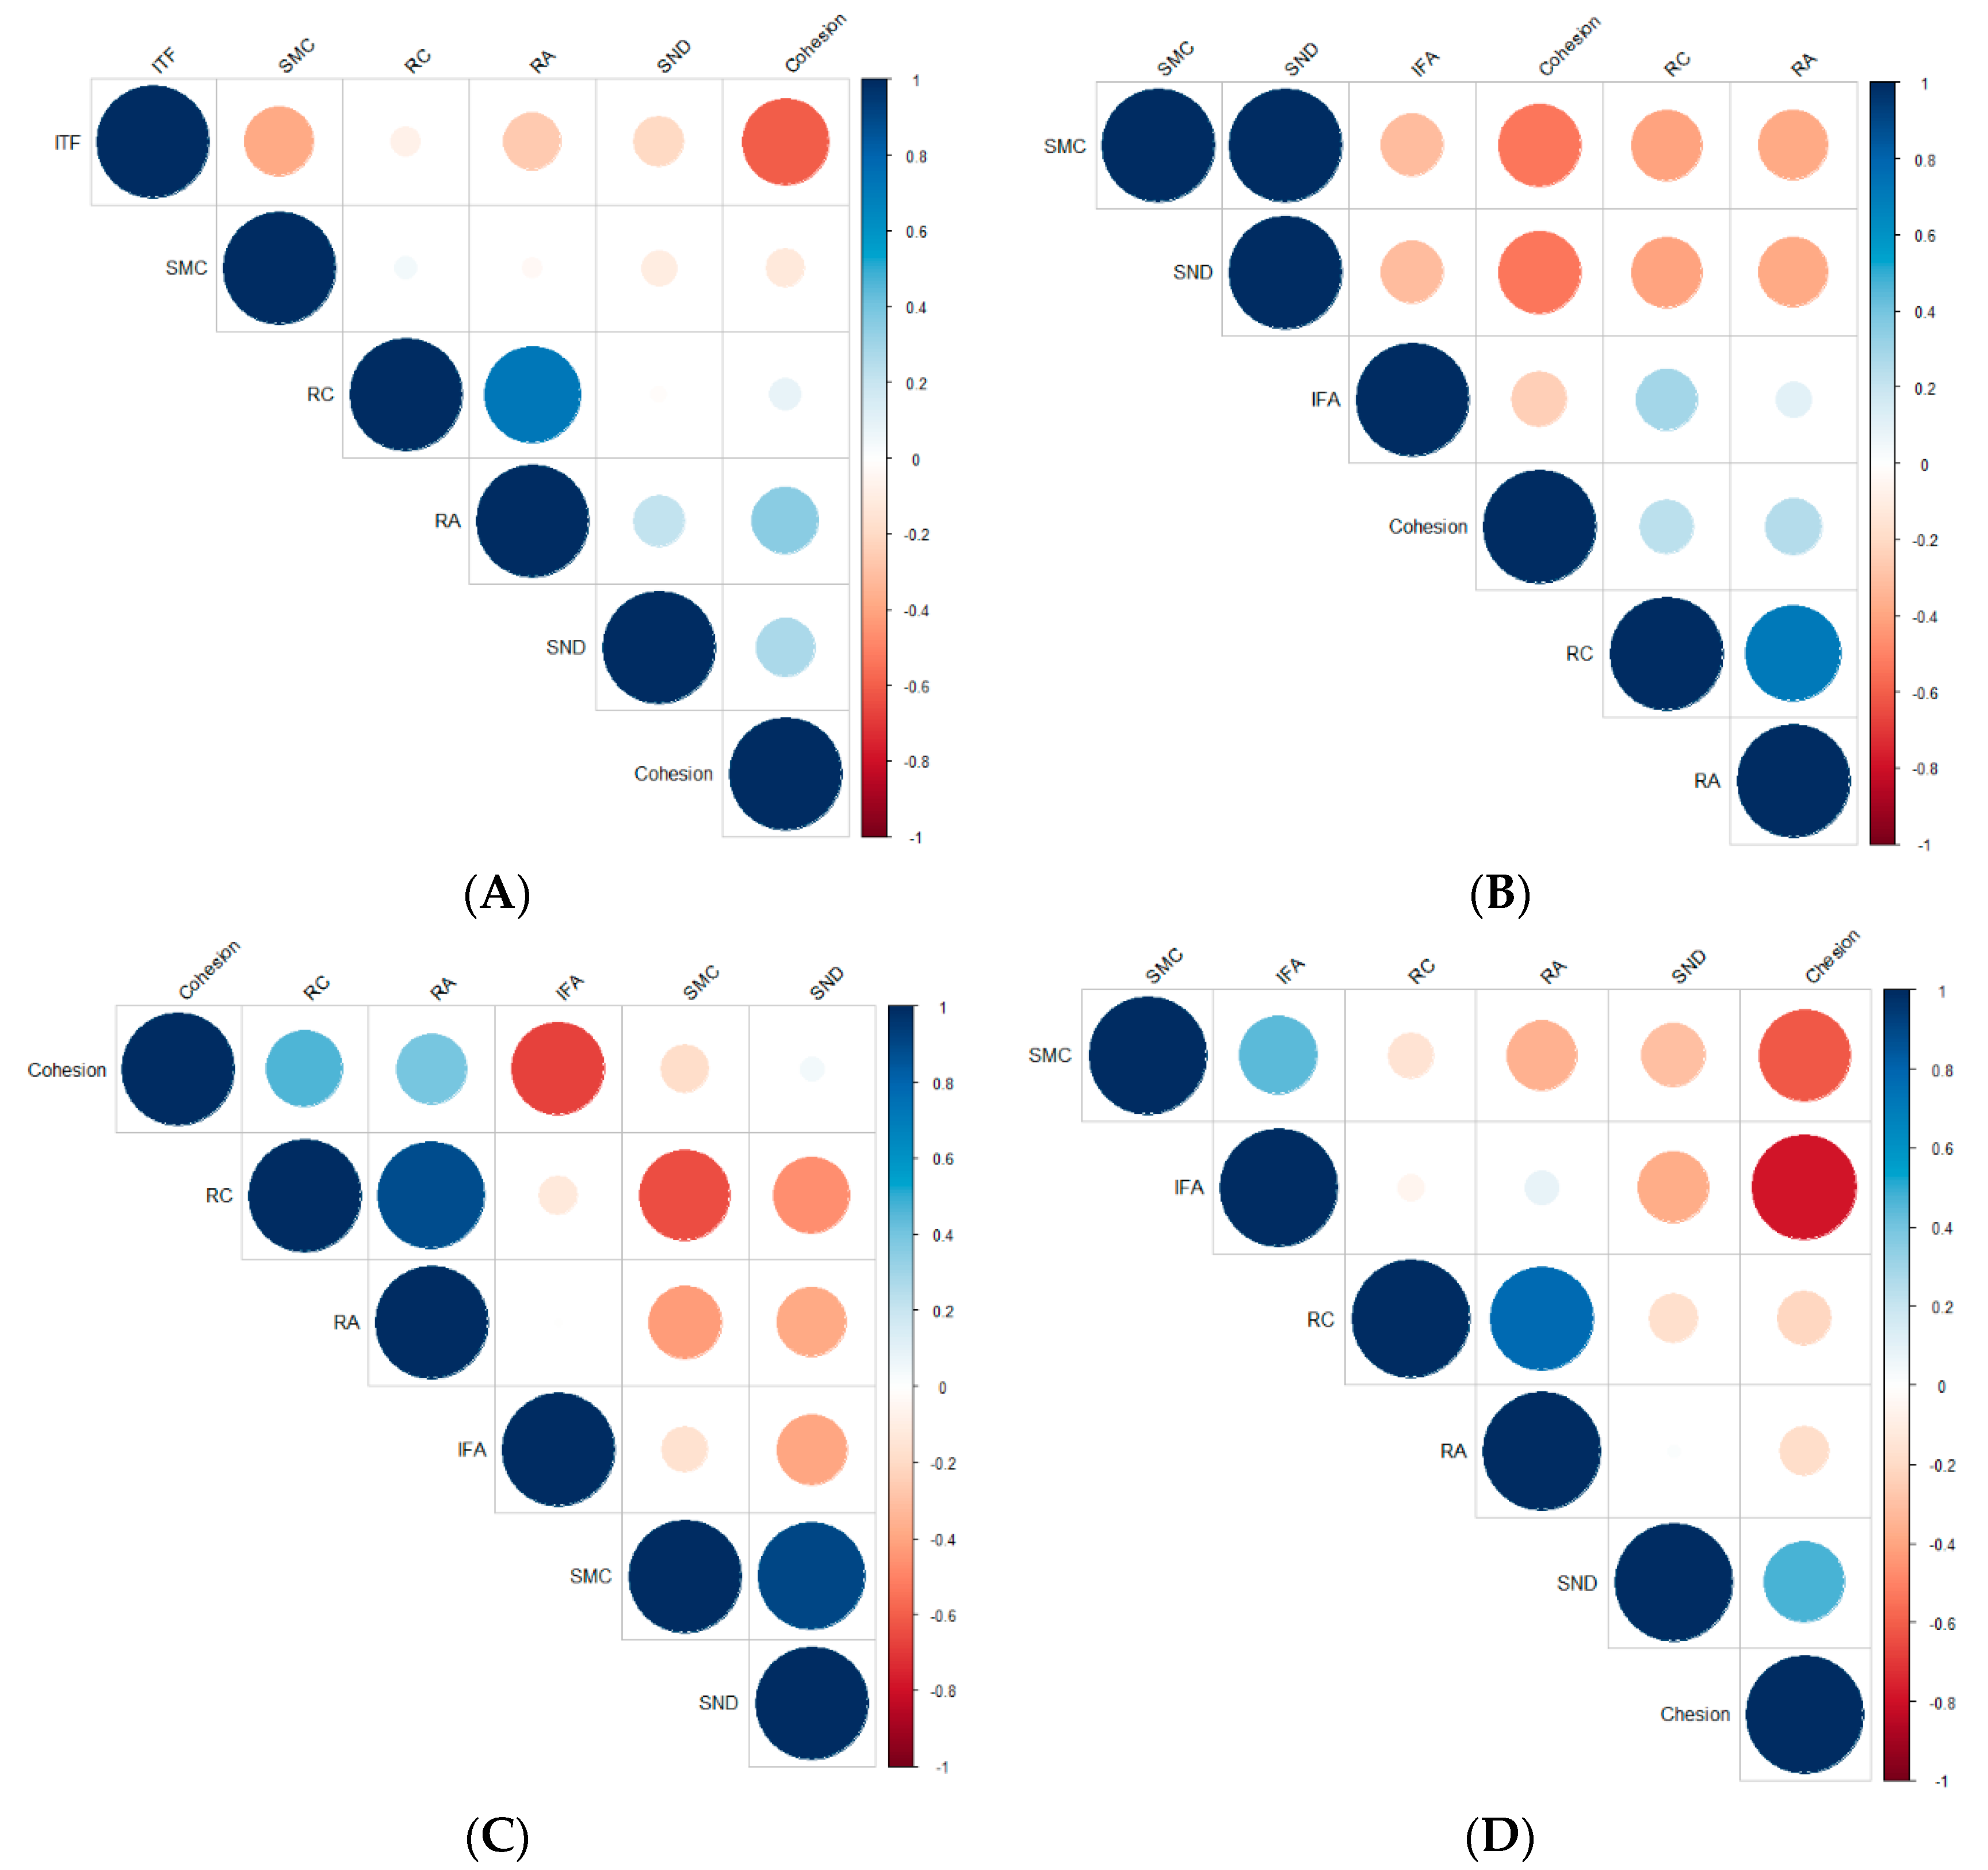
4.4. Factors Influencing Cohesion of Rooted Soil

Correlations between the cohesion of rooted soil and other physical–mechanical indices (soil natural density, soil moisture content, root content, root amounts, and internal friction angle) were established using the Pearson correlation coefficient (Figure 9). The correlations between cohesion and other indices differed significantly depending on the degree of meadow degradation. For example, the cohesion of rooted soil in UD was negatively correlated with the soil moisture content (−0.12), internal friction angle (−0.60), and soil natural density (−0.10), but positively correlated with the root content (0.08) and root amount (0.36), albeit lower correlation coefficients for all the physical–mechanical indices with cohesion, except for the root amount (Figure 9A). Conversely, In LD, cohesion was positively correlated with the root content (0.24), root amount (0.26), and soil natural density (0.15), but negatively correlated with the moisture content (−0.53), as illustrated in Figure 9B. Similarly, in MD, cohesion was positively correlated with the root content (0.46), root amount (0.40), and soil natural density (0.90), but negatively with the soil moisture content (0.18, Figure 9C). In HD, cohesion was positively correlated with the soil natural density (0.47), but negatively correlated with the soil moisture content (−0.61), root amount (−0.18), and root content (−0.22, Figure 9D).

5. Discussion

5.1. Impact of Degradation on the Physical–Mechanical Properties of Rooted Soil

On the basis of the analysis of the physical–mechanical properties of rooted soil across degradations, it could be seen that both MD and HD could result in a relatively higher soil natural density than both UD and LD (Figure 2A). This conclusion differed from the findings of Li et al. (2020b) [10], who concluded that meadow degradation led to a decrease in the soil natural density. Although the target area of both the present study and that of Li et al. (2020b) [10] was the same, these contrasting conclusions may be attributed to differences in the sampling sites of rooted soil. In our study, the sampling sites were located in pasture areas, which are generally trampled by livestock, leading to a compaction effect on the soil and, thus, increasing the soil natural density; in the study by Li et al. (2020b) [10], the sampling sites were pika burrow sites, where the burrowing and ground activities of pikas led to soil loosening and, thus, a reduction in the soil natural density. Additionally, a similar result was also reported by Yuan et al. (2019) [31], who compared the soil bulk density of UD (in their paper, undegraded grassland was named as COV90 with a vegetation coverage ranging 90% ± 6.6%) and degraded grassland (COV70 with a corresponding coverage of 70% ± 8.3% and COV45 with a coverage of 45% ± 8.7%, respectively) and discovered that degraded grassland had a higher soil bulk density than undegraded grassland, but, in his study, the variation in soil bulk density with degradation was slightly different from ours. Different criterions categorizing the degrees of degradation in our study and in Yuan et al. (2019) [31] may be a rational explanation for these discrepancies.
The soil moisture content is a significant index that reflects meadow health. We found that rooted soil in UD had the highest soil moisture content, which agreed with the findings of Liu et al. (2019) [32], who found that the restoration of a degraded meadow could lead to an increase in the soil moisture content; in other words, healthy meadow soil has a high soil moisture content. We found that rooted soil in UD had the highest soil moisture content, followed by HD, LD, and MD. Additionally, this variation in the soil moisture content with degradation was different from previous findings, which found that degradation could lead to a drop in the soil moisture content [33,34]. Although there existed the same agreement between ours and these previous studies that degradation could lead to a decline in the soil moisture content, there were also differences, that is, the soil moisture content increased from LD to HD in our study, whereas in these previous findings, the soil water content decreased from UD to HD. This phenomenon in our study may have been attributive to a different soil penetration rate, which may have been influenced by the root distribution, root diameter, soil texture, vegetation composition, the trample effect by livestock [35], and even SOM content [22], with a similar phenomenon being observed with slight differences that surficial (0–20 cm) soil in HD had a higher water content, followed by UD, LD, and MD. In addition, Sun et al. (2021) [36] investigated the physical–mechanical properties of meadow soil in the Maqin region in the QTP, and found that the soil moisture content in UD, LD, MD, and HD was 40.9%, 42.8%, 41.1%, and 38.7%, respectively. These findings were partly in agreement with ours, because we found a soil moisture content of 42.49% in UD. The value determined by Shen et al. (2021) [37] and our value was comparable (both were less than 43%, but greater than 40%). However, in our study, the soil moisture content in LD, MD, and HD was lower than 30%, but greater than 20%. This difference may have been mainly attributed to differences in vegetation species or coverage, soil evaporation, differences in the criteria used to define the degree of meadow degradation, and differences in meadow management and utilization.
Several studies have demonstrated that vegetation roots in soil are the main contributors to the soil shear strength [10,12,35,38,39]. Meadow degradation generally leads to a decrease in coverage and causes a retrogressive succession in vegetation species or a decline in vegetation biodiversity [23,24,40,41], which leads to a reduction in the underground biomass (another expression of the root amount and root content [3,41]). This process further reduces the soil cohesion and increases its erosivity, which, in turn, leads to a loss in soil fertility [3,41,42]. The loss in soil fertility leads to a reduction in vegetation biodiversity, vegetation amount, and vegetation coverage [43,44], causing a decline in the root amount and root content in the soil, eventually leading to a decline in soil cohesion and an increase in soil erosivity. In our study, we found that the soil moisture content in UD was significantly higher than that in LD, MD, and HD, indicating that a higher moisture content is beneficial to vegetation development and increased the root amount, and, consequently, the soil cohesion in UD. Similarly, a lower content and amounts of roots in MD and HD may have been attributable to a shortage of soil fertility, which limited vegetation development, leading to a drop in root amount, and, consequently, a reduction in soil cohesion and an increase in soil erosivity. A variation in the root content with degradation was not identical to that of the root amount, which was attributed to different measuring methods, in which the root content was obtained using weighing, while the root amount was obtained using indirect weighing for fine roots and counting for coarse roots.
In our study, the cohesion of rooted soil exhibited a declining trend as the degree of meadow degradation increased; the highest soil cohesion value was observed in UD. Additionally, the highest soil cohesion value corresponded to the highest root amount, but not to the highest root content, and rather to the second highest root content. This phenomenon may be attributable to the following aspects: first, the composition of the vegetation communities, and second, the process of the rooted soil sampling. For the former, in both UD and LD, the predominant species generally belonged to the Cyperaceae and Gramineae families, which have a heart root system with numerous roots; however, a slight retrogressive succession occurred in LD vegetation, with the occurrence of species such as G. straminea and L. leontopodioides, which generally have a taproot with some secondary roots, unlike the Cyperaceae and Gramineae families. The amount of per root in unit mass for G. straminea and L. leontopodioides is many orders of magnitudes lower than that of the Cyperaceae and Gramineae families. Consequently, the amount of unit mass for the Cyperaceae and Gramineae families is generally larger than those of the G. straminea and L. leontopodioides. For the latter, during the process of the rooted soil sampling, roots had to be separated from the soil matrix before they could be counted and weighed. Rooted soil in UD had high cohesion, which made it difficult to separate the roots from the soil. Therefore, a hammer was used to smash the rooted soil and loosen it; this caused damage to some roots, and led to the segmentation of roots, which were then prone to washing away during the following step of root washing. Although the vegetation coverage of LD was similar to that of UD, the cohesion of the rooted soil was not as high as that of UD, so it was easier to separate the roots from the rooted soil. Therefore, the roots were not damaged and roots were not washed away during the subsequent root-washing step. Thus, the roots in UD weighed less than the roots in LD.
The internal friction angle is an index reflecting the roughness of soil particles. In contrast with previous findings [17], that the higher the root content in the soil the higher the internal friction angle of rooted soil, we found that UD and LD had a higher root content or root amount but a lower internal friction angle, whereas MD and HD had a lower root content or root amount but a higher internal friction angle. Our finding was different from these findings [17]. This phenomenon may have been due to the following two facts. The first fact was the difference in the soil particle size distribution. Generally speaking, HD had the highest percentage of sand particles and lowest percentage of silt, followed by MD, LD, and UD, respectively [22]. Soil with a higher content of sand and lower content of silt, therefore, had a higher internal friction angle, whereas soil with more content of silt and less content of sand generally had a lower internal friction angle value. The other fact was that the impact of the root content on the soil internal friction angle was maybe counteracted by the role of the soil particle size distribution. That was because the root content in UD, LD, and HD was approximately 10%, whereas it did not exceed 1% in HD. In UD, LD, and HD, roots played a primary role, forming the structure of rooted soil, and causing a reduction in the internal friction angle as rooted soil underwent shearing. In HD, roots in rooted soil played a secondary role, whereas the friction among soil particles played a primary role as rooted soil underwent shearing, leading to an increase in its internal friction angle.

5.2. Impact of Degradation on Probability Distribution of Physical–Mechanical Indices

Although substantial progress has been achieved in recent decades in exploring the probabilistic distribution of the physical–mechanical indices of soils, no such studies have investigated rooted soil, whose physical–mechanical properties are more complex because of the presence of vegetation roots, by quantifying the impact of the amounts, physical morphology, and tensile strength of roots on these physical–mechanical indices. Values of soil natural density, soil moisture content, cohesion, and internal friction angle of rooted soil were stochastic, perhaps depending on the occurrence conditions of soil, parent material of soil, vegetation composition, root content, root diameter, etc., thus, resulting in it being hard to obtain their precisely predicted values. As for the mechanical properties of soil, many methods based on the probabilistic theory had been proposed to predict their values with a higher precision. For example, Wang et al. (2015) [45] summarized that indices of soils (including silt clay sand and sand clay), such as the undrained shear strength, cone resistance, normalized undrained shear strength, plastic/liquid limit/index, void ratio, porosity, initial void ratio, and overconsolidation ratio, generally followed normal or lognormal distribution. Additionally, Wang et al. (2015) [45] pointed out that a normal or lognormal distribution in these studies might have just been a result of the central limit theorem, which indicates that lumping data from many different sources (i.e., different sites in this case) tends to result in a normal or lognormal distribution, meaning that not all of the physical–mechanical indices of soil followed a normal or lognormal distribution and that they may have followed other probabilistic distributional functions. Due to their different physical compositions compared to general soil, the probabilistic distribution of physical–mechanical indices of rooted soil did not always follow the same distributional function and, in our study, we also discovered that all of the distributions could be used to describe the actual probabilistic distribution of these indices. Additionally, we also discovered that although the four probability distribution functions could be adopted to describe the actual distribution of the physical–mechanical indices under all four degrees of meadow degradation (except for certain cases, which had lower P-values, such as the soil moisture content in UD and LD and the internal friction angle in UD and MD), there was only one optimal distribution that best described or simulated the distribution of these indices. Moreover, the optimal distribution for the same index varied for different degrees of meadow degradation. For example, the optimal distribution for the soil natural density in UD and MD was the GEV distribution, but in LD and HD, it was the gamma distribution. This finding was in agreement with those of Chen et al. (2005) [46], who found that the same index of soils simultaneously followed multiple distribution functions.
No distribution function could be used to describe the distribution of the soil natural density in MD, as well as the internal friction angle of rooted soil in both UD and MD because of their low P-value, which could be ignored. Therefore, better and more adaptable functions need to be introduced. Finally, we also found that all of the targeted indices in this study showed a high dispersion and variability in UD, a low dispersion and variability in HD, and a transition from high to low dispersion and variability in both LD and MD. This indicated that as the degree of meadow degradation increased, the distribution of these indices exhibited a trend of concentration. This could be attributed to the sampling depth of rooted soil and the degree of meadow degradation. In our study, the sampling depth of rooted soil was 20 cm below the ground surface. In UD, the root amount, root content, cohesion, and soil moisture content in the surface layer (0~10 cm) were relatively higher than those in the deeper layer (10~20 cm; at this depth, the root content, root amount, soil natural density, and moisture content were generally higher than or similar to those in MD and HD, irrespective of the sampling depth). However, in this work, the data for these indices were taken together to conduct a statistical analysis, regardless of the sampling depth. Thus, the data for the indices in UD were a combination of the data of rooted soil in UD, LD, MD, and HD. This led to a large variation or dispersion in the data. In contrast, in MD and HD, only a small fraction of roots was present in soil, so rooted soil in MD, and particularly in HD, could be considered as nonrooted soil. Therefore, the physical–mechanical properties of rooted soil in MD and HD were generally the same, regardless of their sampling depths. Consequently, the physical–mechanical properties of surface soil were nearly identical to those of deeper soil in MD and HD, which led to a narrow dispersion in the physical–mechanical indices and yielded a concentrated distribution.

5.3. Factors Influencing Soil Cohesion

Even though several factors, such as the soil natural density, soil moisture content, soil parent material, root content, root morphology, and root biomechanical properties, exert a pivotal influence on the cohesion of rooted soil, in this work, the correlation between the cohesion of rooted soil and other physical–mechanical indices varied depending on the degree of meadow degradation. For example, in both UD and HD for soil natural density, there was a negative correlation between soil natural density and cohesion, but in LD and MD, there was a positive correlation. The explanation leading to such results could be attributed to the following two reasons. First, the three-dimensional net-type structure formed by the roots perhaps suppressed the contribution of the root amount or root content to the cohesion of rooted soil in UD; second, the sampling activity damaged the three-dimensional net-type structure of the roots, rendering the contribution of roots to soil cohesion insignificant. In the former case, in UD, the predominant species generally belonged to the Cyperaceae or Gramineae family, their roots characterized by numerous fine roots intermingled with one another and bound soil particles together, forming a three-dimensional net-type structure and producing a glue-liking effect [35]. In this structure, the net-type structure overrode the roots’ role as the reinforcing structure in soil and became the primary factor influencing the physical–mechanical properties of the rooted soil. The soil natural density, soil moisture content, and even root amount or root content served as secondary factors that exerted a smaller impact on the cohesion of the rooted soil, in contrast to the three-dimensional net-type structure. In other words, in UD, the net-type structure was the dominant factor influencing the physical–mechanical properties of rooted soil. However, in LD (even though LD had a comparable root content and root amount as UD, their predominant vegetation composition changed and, therefore, considerable taproots with thick diameters occurred, which did not generate such a glue-like effect), MD, or HD, no such three-dimensional net-type structure formed, so the root content or root amount were still among the main factors impacting the physical–mechanical properties of the rooted soil. As long as the root content did not exceed a certain threshold value, the roots were highly effective in increasing the cohesion of rooted soil, but if the root content exceeded this threshold value, the effectiveness of the roots in increasing the cohesion of rooted soil diminished because of the excessive root content in the soil [17]. In the latter case, in UD, the three-dimensional net-type structure caused the soil to be tightly compacted with a high shear strength, making it difficult to obtain samples of rooted soil using a cutting ring. Thus, during the sampling process, the cutting ring was hammered into the rooted soil, which damaged the three-dimension net-type structure of the soil. As a result, the cohesion measured via direct shear tests was lower than the actual cohesion, and this, consequently, caused a reduction in the cohesion of rooted soil in UD. This, in turn, reduced the correlation of cohesion with the root amount or root content. In LD, MD, and HD, damage rarely occurred to rooted soil during the sampling process, so the measured cohesion was the actual cohesion of the rooted soil. This enhanced the correlation of cohesion with the root amount and root content.

5.4. Outlook

The alpine meadow is an essential part of meadow ecosystems, and the health of soil in this region exerts a considerable influence on the safety of the geoecological environment in the southwestern and northwestern regions of China. In recent years, under the effects of global climate change, unsustainable local meadow management, and damage due to pika activity, alpine meadows on the QTP have undergone considerable degradation, which poses a major challenge and is a threat to the implementation of China’s geoecological environment security strategy [1,2,3,21,22,23,24,25,47]. To date, research on alpine meadows has primarily focused on the classification of degraded alpine meadows, the identification of factors influencing degradation, ecological restoration of meadows, and cycling and migration of soil nutrients. Studies on the response and correlation of the physical–mechanical properties of soil (especially soil cohesion) are lacking, which greatly limits our understanding of the process of alpine meadow degradation. Gaps in our understanding of the correlation between soil cohesion and its physical–mechanical indices has led to an insufficient understanding of soil physical–mechanical behavior and incorrect evaluations of soil erodibility. Thus, this study selected a meadow experiencing different degrees of degradation as the study area. Based on measurements of the soil moisture content, soil natural density, root content, root amount, cohesion, and internal friction angle of rooted soil for the meadow experiencing different degrees of degradations, the statistical theory using probabilistic distributions was introduced to simulate the distribution of the indices, which provided an essential foundation to determine accurate assessments of the physical–mechanical properties of rooted soil. This was the novelty of this study. This study qualitatively explored the correlation of cohesion with other physical–mechanical indices, but did not establish a fitting relationship between soil cohesion and the other physical–mechanical indices; this should be considered in future studies. Furthermore, the sampling process of rooted soil disturbed and even damaged the root structure in the soil, particular in UD, which could have led to an alteration in the actual contribution of the roots to the shear strength measurements. Therefore, the sampling method should be optimized in subsequent studies to avoid damage to the rooted soil.

6. Conclusions

(1) The variation in the physical–mechanical indices of rooted soil across the degradations depended on degradations. As the degree of degradation increased from UD to HD, the soil natural density and soil moisture content experienced a first decreasing and then increasing trend; the root amount and cohesion exhibited a declining trend, particularly in MD and HD; the root content exhibited an initial increase followed by a decrease; conversely, the internal friction angle gradually increased.
(2) Nearly all of the probabilistic functions could be used to describe the actual distribution of the physical–mechanical indices of rooted soil across the degradations, except for the soil moisture content and internal friction angle in both UD and MD. The optimal distribution for the physical–mechanical indices differed depending on the indices themselves and the degree of degradation.
(3) The correlation of the cohesion of rooted soil with its other physical–mechanical indices was not constant, but changed depending on the degree of meadow degradation. Generally, the cohesion of rooted soil was positively correlated with the soil natural density, root content, and root amount, but negatively correlated with the soil moisture content. The correlation of cohesion with its other physical–mechanical indices in both UD and LD was relatively weak, whereas in MD and HD, the correlation of the cohesion of rooted soil with other indices was strong.

Author Contributions

J.-T.F. constructed and wrote the manuscript; X.-S.H. provided the references for the manuscript; X.-L.L. provided the testing fields; J.-M.Z. and G.-Y.X. drew the pictures; C.-Y.L. provided the raw data. All authors have read and agreed to the published version of the manuscript.

Funding

The project was financially supported by the National Natural Science Foundation of China (grant no. 42041006), and Discipline Innovation and Introducing Talents Program of Higher Education Institutions, the 111 Project of China (D18013).

Data Availability Statement

Data are contained within the article.

Conflicts of Interest

The authors declare no conflict of interest.

References

  1. Zhang, X.; Liu, X.Q.; Zhang, L.F.; Chen, Q.G.; Zhao, L.; Li, Q.; Chen, D.D.; Gu, S. Comparison of energy partitioning between artificial pasture and degraded meadow in Three-river Source Region on the Qinghai-Tibetan Plateau: A case study. Agric. For. Meteorol. 2019, 271, 251–263. [Google Scholar] [CrossRef]
  2. Wang, D.J.; Zhou, H.K.; Yao, B.Q.; Wang, W.Y.; Dong, S.K.; Shang, Z.H.; She, Y.D.; Ma, L.; Huang, X.T.; Zhang, Z.H.; et al. Effects of nutrient addition on degraded alpine grasslands of the Qinghai-Tibetan Plateau: A meta-analysis. Agric. Ecosyst. Environ. 2020, 301, 106970. [Google Scholar] [CrossRef]
  3. Teng, Y.M.; Zhan, J.Y.; Agyemang, F.B.; Sun, Y.X. The effects of degradation on alpine grassland resilience: A study based on Meta-analysis data. Glob. Ecol. Conserv. 2020, 24, e01336. [Google Scholar] [CrossRef]
  4. Wang, H.; Wang, J.; Zhang, G.H. Impact of landscape positions on soil erodibility indices in typical vegetation-restored slope-gully systems on the Loess Plateau of China. Catena 2021, 201, 105235. [Google Scholar] [CrossRef]
  5. Cheng, H.; Liu, C.C.; Zou, X.Y.; Li, H.R.; Kang, L.Q.; Liu, B.; Li, J.F. Wind erosion rate for vegetated soil cover: A prediction model based on surface shear strength. Catena 2020, 187, 104398. [Google Scholar] [CrossRef]
  6. Xiao, H.; Guo, P.; Zhang, Q.H.; Hu, H.; Hong, H.; Zhang, L.; Yang, Y.S.; Xia, Z.Y.; Li, M.Y.; Kang, H.L.; et al. Variation in soil properties and its influence on the dynamic change of soil erosion resistance to overland flow in the water-level fluctuation zone of the Three Gorges Reservoir, China. Catena 2022, 213, 106141. [Google Scholar] [CrossRef]
  7. Liu, J.J.; Zhang, K.D.; Shi, W.B.; Liu, L.J.; Lu, C. Effects of freeze-thaw on soil detachment capacity in the black soil region of Northeastern China. Soil Tillage Res. 2024, 236, 105946. [Google Scholar] [CrossRef]
  8. Dong, L.; Wang, J.; Li, J.R.; Wu, Y.T.; Zheng, Y.; Zhang, J.H.; Li, Z.Y.; Yin, R.P.; Liang, C.Z. Assessing the impact of grazing management on wind erosion risk in grasslands: A case study on how grazing affects aboveground biomass and soil particle composition in Inner Mongolia. Glob. Ecol. Conserv. 2022, 40, e02344. [Google Scholar] [CrossRef]
  9. Wang, X.; Hong, M.M.; Huang, Z.; Hao, Y.F.; Ou, Y.S.; Jia, H.X.; Li, J. Biomechanical properties of plant root systems and their ability to stabilize slopes in geohazard-prone regions. Soil Tillage Res. 2019, 189, 148–157. [Google Scholar] [CrossRef]
  10. Li, G.R.; Li, X.L.; Chen, W.T.; Li, J.F.; Zhu, H.L.; Hu, X.S.; Zhou, H.K.; Sun, H.Q. Effects of degradation severity on the physical, chemical and mechanical properties of topsoil in alpine meadow on the Qinghai-Tibet Plateau, West China. Catena 2020, 187, 104370. [Google Scholar] [CrossRef]
  11. Liu, C.Y.; Dou, Z.N.; Hu, X.S.; Xu, Z.W.; Zhou, L.H.; Li, X.L.; Zhu, H.L.; Li, Y.T. Relationship between shear strength of root-soil composite systems of alpine grassland and distribution of soil nutrient elements in the source region of the Yellow River, China. Mt. Res. 2020, 38, 349–359, (In Chinese with English abstract). [Google Scholar]
  12. Fu, J.T.; Hu, X.S.; Brierley, G.; Qiao, N.; Yu, Q.Q.; Lu, H.J.; Li, G.R.; Zhu, H.L. The influence of plant root system architectural properties upon the stability of loess slopes, Northeast Qinghai, China. J. Mt. Sci. 2016, 13, 785–801. [Google Scholar] [CrossRef]
  13. Fu, J.T.; Yu, D.M.; Li, X.K.; Liu, C.Y.; Hu, X.S. Statistical probability analysis of the physical index of rooted soil in Qiadam basin. Chin. J. Rock Mech. Eng. 2020, 39, 1696–1709, (In Chinese with English abstract). [Google Scholar] [CrossRef]
  14. Maïga-Yaleu, S.B.; Guiguemde, I.; Yacouba, H.; Karambiri, H.; Ribolzi, O.; Bary, A.; Ouedraogo, R.; Chaplot, V. Soil crusting impact on soil organic carbon losses by water erosion. Catena 2013, 107, 26–34. [Google Scholar] [CrossRef]
  15. Maïga-Yaleu, S.B.; Chivenge, P.; Yacouba, H.; Guiguemde, I.; Karambiri, H.; Ribolzi, O.; Bary, A.; Chaplot, V. Impact of sheet erosion mechanisms on organic carbon losses from crusted soils in the Sahel. Catena 2015, 126, 60–67. [Google Scholar] [CrossRef]
  16. Cui, Z.Q.; Kang, H.L.; Wang, W.L.; Guo, W.Z.; Guo, M.M.; Chen, Z.X. Vegetation restoration restricts rill development on dump slopes in coalfields. Sci. Total Environ. 2022, 820, 153203. [Google Scholar] [CrossRef]
  17. Zhang, D.B.; Zhang, Y.; Cheng, T. Measurement of grass root reinforcement for copper slag mixed soil using improved shear test apparatus and calculating formula. Measurement 2018, 118, 14–22. [Google Scholar] [CrossRef]
  18. Lumb, P. Safety factors and the probability distribution of soil strength. Can. Geotech. J. 1970, 7, 225–241. [Google Scholar] [CrossRef]
  19. Hoeksema, R.J.; Kitanidis, P.K. Analysis of the spatial structure of properties of selected aquifers. Water Resour. Res. 1985, 21, 563–572. [Google Scholar] [CrossRef]
  20. Wang, J.F.; Yang, Y.F.; Liu, G.B.; Wang, B.; Zhang, F.B.; Fang, N.F. Investigating the effects of herbaceous root systems on the soil detachment process at the species level. Sci. Total Environ. 2023, 859 Pt 1, 160196. [Google Scholar] [CrossRef]
  21. Dai, L.C.; Guo, X.W.; Ke, X.; Zhang, F.W.; Li, Y.K.; Peng, C.J.; Shu, K.; Li, Q.; Lin, L.; Cao, M.M.; et al. Moderate grazing promotes the root biomass in Kobresia meadow on the northern Qinghai-Tibet plateau. Ecol. Evol. 2019, 9, 9395–9406. [Google Scholar] [CrossRef] [PubMed]
  22. Dai, L.C.; Yuan, Y.M.; Guo, X.W.; Du, Y.G.; Ke, X.; Zhang, F.W.; Li, Y.K.; Li, Q.; Lin, L.; Zhou, H.K.; et al. Soil water retention in alpine meadows under different degradation stages on the northeastern Qinghai-Tibet Plateau. J. Hydrol. 2020, 590, 125397. [Google Scholar] [CrossRef]
  23. Dai, L.C.; Fu, R.Y.; Guo, X.W.; Ke, X.; Du, Y.G.; Zhang, F.W.; Cao, G.M. Effect of grazing management strategies on alpine grassland on the northeastern Qinghai-Tibet Plateau. Ecol. Eng. 2021, 173, 106418. [Google Scholar] [CrossRef]
  24. Dai, L.C.; Guo, X.W.; Ke, X.; Du, Y.G.; Zhang, F.W.; Cao, G.M. The variation in soil water retention of alpine shrub meadow under different degrees of degradation on northeastern Qinghai-Tibetan plateau. Plant Soil 2021, 458, 231–244. [Google Scholar] [CrossRef]
  25. Li, X.L.; Perry, G.L.W.; Brierley, G.J. A spatial simulation model to assess controls upon grassland degradation on the Qinghai-Tibet Plateau, China. Appl. Geogr. 2018, 98, 166–176. [Google Scholar] [CrossRef]
  26. Li, J.; Zhang, F.W.; Lin, L.; Li, H.Q.; Du, Y.G.; Li, Y.K.; Cao, G.M. Response of the plant community and soil water status to alpine Kobresia meadow degradation gradients on the Qinghai-Tibetan Plateau, China. Ecol. Res. 2015, 30, 589–596. [Google Scholar] [CrossRef]
  27. Li, M.Q.; Liu, S.L.; Wang, F.F.; Liu, H.; Liu, Y.X.; Wang, Q.B. Cost-benefit analysis of ecological restoration based on land use scenario simulation and ecosystem service on the Qinghai-Tibet Plateau. Glob. Ecol. Conserv. 2022, 34, e02006. [Google Scholar] [CrossRef]
  28. Liu, Y.X.; Liu, S.L.; Sun, Y.X.; Sun, J.; Wang, F.F.; Li, M.Q. Effect of grazing exclusion on ecosystem services dynamics, trade-offs and synergies in Northern Tibet. Ecol. Eng. 2022, 179, 106638. [Google Scholar] [CrossRef]
  29. Vergani, C.; Giadrossich, F.; Buckley, P.; Conedera, M.; Pividori, M.; Salbitano, F.; Rauch, H.S.; Lovreglio, R.; Schwarz, M. Root reinforcement dynamics of European coppice woodlands and their effect on shallow landslides: A review. Earth-Sci. Rev. 2017, 167, 88–102. [Google Scholar] [CrossRef]
  30. Su, Y.H.; He, M.M.; Sun, X.M. Approach on asymptotic approximations of polynomials for probability density function of geotechnics random parameters. Chin. J. Geotech. Eng. 2001, 23, 117–119, (In Chinese with English abstract). [Google Scholar]
  31. Yuan, Z.A.; Jiang, X.J.; Liu, G.J.; Jin, H.J.; Chen, J.; Wu, Q.B. Responses of soil organic carbon and nutrient stocks to human-induced grassland degradation in a Tibetan alpine meadow. Catena 2019, 178, 40–48. [Google Scholar] [CrossRef]
  32. Liu, C.Y.; Dou, Z.N.; Hu, X.S.; Xu, Z.W.; Zhou, L.H.; Li, X.L.; Zhu, H.L.; Li, Y.T. Research on the Effect of plant combination types on the shear strength of the root-soil composite system of alpine grassland in the Source Region of the Yellow River. Acta Agrestia Sin. 2019, 27, 42–52, (In Chinese with English abstract). [Google Scholar]
  33. Yi, X.S.; Li, G.S.; Yin, Y.Y. The impacts of grassland vegetation degradation on soil hydrological and ecological effects in the source region of the Yellow River-a case study in Junmuchang region of Maqin country. Procedia Environ. Sci. 2012, 13, 967–981. [Google Scholar] [CrossRef]
  34. Zeng, C.; Zhang, F.; Wang, Q.J.; Chen, Y.Y.; Joswiak, D.R. Impact of alpine meadow degradation on soil hydraulic properties over the Qinghai-Tibetan plateau. J. Hydrol. 2013, 478, 148–156. [Google Scholar] [CrossRef]
  35. Cislaghi, A.; Giupponi, L.; Tamburini, A.; Giorgi, A.; Bischetti, G.B. The effects of mountain grazing abandonment on plant community, forage value and soil properties: Observations and field measurements in an alpine area. Catena 2019, 181, 104086. [Google Scholar] [CrossRef]
  36. Sun, J.J.; Wang, P.B.; Wang, H.B.; Yu, X.J. Changes in plant communities, soil characteristics, and microbial communities in alpine meadows degraded to different degrees by pika on the Qinghai-Tibetan Plateau. Glob. Ecol. Conserv. 2021, 27, e01621. [Google Scholar] [CrossRef]
  37. Shen, Z.Y.; Liu, C.Y.; Hu, X.S.; Zhou, L.H.; Xu, T.; Li, X.L.; Li, G.R. Relationships between the physical and chemical properties of soil and the shear strength of root-soil composite systems at different soil depths in alpine grassland in the source region of the Yellow River. Arid. Zone Res. 2021, 38, 392–401, (In Chinese with English abstract). [Google Scholar] [CrossRef]
  38. Cislaghi, A. Exploring the variability in elastic properties of roots in Alpine tree species. J. For. Sci. 2021, 67, 338–356. [Google Scholar] [CrossRef]
  39. Cislaghi, A.; Alterio, E.; Fogliata, P.; Rizzi, A.; Lingua, E.; Vacchiano, G.; Bischetti, G.B.; Sitzia, T. Effects of tree spacing and thinning on root reinforcement in mountain forests of the European Southern Alps. For. Ecol. Manag. 2021, 482, 118873. [Google Scholar] [CrossRef]
  40. Ma, X.P.; Asano, M.; Tamura, K.; Zhao, R.N.; Nakatsuka, H.; Wu, Y.N.; Wang, T. Physicochemical properties and micromorphology of degraded alpine meadow soils in the Eastern Qinghai-Tibet Plateau. Catena 2020, 194, 104649. [Google Scholar] [CrossRef]
  41. Peng, F.; Xue, X.; Li, C.Y.; Lai, C.M.; Sun, J.; Tsubo, M.; Tsunekawa, A.; Wang, T. Plant community of alpine steppe shows stronger association with soil properties than alpine meadow alongside degradation. Sci. Total Environ. 2020, 733, 139048. [Google Scholar] [CrossRef]
  42. Bastola, S.; Dialynas, Y.G.; Bras, R.L.; Noto, L.V.; Istanbulluoglu, E. The role of vegetation on gully erosion stabilization at a severely degraded landscape: A case study from Calhoun experimental critical zone observatory. Geomorphology 2018, 308, 25–39. [Google Scholar] [CrossRef]
  43. Yan, Y.; Lu, X.Y. Are, N, P, and N:P stoichiometry limiting grazing exclusion effects on vegetation biomass and biodiversity in alpine grassland? Glob. Ecol. Conserv. 2020, 24, e01315. [Google Scholar] [CrossRef]
  44. Ghiloufi, W.; Chaieb, M. Environmental factors controlling vegetation attributes, soil nutrients and hydrolases in South Medi-terranean arid grasslands. Ecol. Eng. 2021, 161, 106155. [Google Scholar] [CrossRef]
  45. Wang, Y.; Zhao, T.Y.; Cao, Z.J. Site-specific probability distribution of geotechnical properties. Comput. Geotech. 2015, 70, 159–168. [Google Scholar] [CrossRef]
  46. Chen, L.H.; Chen, Z.Y.; Liu, J.M. Probability distribution of soil strength. Rock Soil Mech. 2005, 26, 37–40, (In Chinese with English abstract). [Google Scholar] [CrossRef]
  47. Léonard, J.; Richard, G. Estimation of runoff critical shear stress for soil erosion from soil shear strength. Catena 2004, 57, 233–249. [Google Scholar] [CrossRef]
Figure 1. Locality of the study area.
Water 16 01205 g001
Figure 2. Variation in physical–mechanical indices of rooted soil in different degradation. Notes: IFA is an abbreviation of internal friction angle. Error bars represent standard deviation. Different lower letters on the error bars indicate significant differences (p < 0.05) and different upper letters on the error bars indicate significant differences (p < 0.01) for different degradation in the testing area.
Water 16 01205 g002
Figure 3. DF and the corresponding PDFs of soil natural density for rooted soil in different levels of degradation.
Water 16 01205 g003
Figure 4. DF and the corresponding PDFs of soil moisture content for rooted soil in different levels of degradation.
Water 16 01205 g004
Figure 5. DF and the corresponding PDFs of root content for rooted soil in different levels of degradation.
Water 16 01205 g005
Figure 6. DF and the corresponding PDFs of root amount for rooted soil in different levels of degradation.
Water 16 01205 g006
Figure 7. DF and the corresponding PDFs of cohesion for rooted soil in different levels of degradation.
Water 16 01205 g007
Figure 8. DF and the corresponding PDFs of internal friction angle for rooted soil in different levels of degradation.
Water 16 01205 g008
Figure 9. Correlation between the physical–mechanical indices based on Pearson correlation analysis. Notes: RC is root content, RA is root amount, IFA is internal friction angle, SMC is soil moisture content, and SND is soil natural density. (A) UD, (B) LD, (C) MD, and (D) HD.
Water 16 01205 g009
Table 1. Kurtosis and skewness of the physical and mechanical indices of rooted soil suffering degradation.
Degradation LevelsItemsSoil Physical–Mechanical Indices
Natural DensityMoisture ContentRoot ContentRoot AmountIFACohesion
UDKurtosis2.628418.95959.82345.703910.562612.8765
Skewness−0.05533.54992.61991.4930−1.24022.1406
LDKurtosis2.472022.67478.73732.48674.75253.3296
Skewness0.28383.69112.47670.86010.31280.8253
MDKurtosis48.97963.37292.93611.687310.66113.1922
Skewness6.51361.03710.86550.36371.02400.8174
HDKurtosis3.09537.35835.97351.51383.577610.7620
Skewness0.26471.80191.74440.2873−0.35742.3372
Note: IFA denotes internal friction angle.
Table 2. KS test for the physical–mechanical indices of rooted soil for meadow experiencing different degrees of degradation.
Degradation LevelsSoil Physical–Mechanical Indices
PDFNatural DensityMoisture ContentRoot ContentRoot Amount IFACohesion
UDNormal0.5483<0.010.07720.46810.00460.0121
Gamma0.4291<0.010.84510.9617<0.010.4995
Weibull0.7494<0.010.90420.8802<0.010.2524
GEV0.75410.14610.96750.9694<0.010.8735
LDNormal0.6223<0.010.03630.42640.72820.0383
Gamma0.94870.02900.59680.51040.64060.8513
Weibull0.5864<0.010.79210.53010.10090.5935
GEV0.94230.29030.94280.36050.39300.9602
MDNormal<0.010.03760.71520.42560.03360.0828
Gamma0.01260.21580.70780.75080.02180.6113
Weibull<0.010.06490.67790.8337<0.010.5043
GEV0.07550.61300.59270.6363<0.010.6669
HDNormal0.88080.02300.47760.69250.5296<0.01
Gamma0.96300.18980.92520.83790.41680.6275
Weibull0.52250.01360.77610.80840.73860.4177
GEV0.94910.48440.88680.80340.42100.9838
Note: p-values > 0.01 indicates that the original hypothesis was accepted; otherwise, the hypothesis was rejected. Values in bold denote optimal values; IFA indicates internal friction angle.
Disclaimer/Publisher’s Note: The statements, opinions and data contained in all publications are solely those of the individual author(s) and contributor(s) and not of MDPI and/or the editor(s). MDPI and/or the editor(s) disclaim responsibility for any injury to people or property resulting from any ideas, methods, instructions or products referred to in the content.

