1. Introduction
Cascades are commonly used fluid mechanical devices in the fields of hydropower generation, pumping stations, and water treatment. The most common form is a single-row cascade with a simple structure and good flow characteristics; however, at high-speed water flows, they may cause significant energy loss and flow instability. Zhao et al. [
1] analyzed the instantaneous vortex system and time-averaged physical-quantity distribution in the cascade channel at different Reynolds numbers to explain the mechanism of vortex generation in the shear layer of the NACA0065 cascade surface as well as the vortex core characteristics at strong and weak shear zones. Tan [
2] employed the Latin-hypercube sampling method to conduct a comprehensive analysis of the flow field by sampling multiple geometric parameters of the cascade. The findings revealed that the total pressure loss of the cascade is primarily influenced by the gap height and groove depth. Li et al. [
3] performed numerical simulations on hydrogen, investigating both the internal flow characteristics and secondary flow energy-loss mechanisms within the cascade. The results indicated that energy loss at the leading edge was minimal, while significant energy losses were observed at both the throat and trailing edge regions. Additionally, a concentration phenomenon in fluid flow was identified on the suction surface of the cascade, accompanied by a wake-vortex formation at its trailing edge. Zhang [
4] conducted RANS numerical simulations to analyze complex three-dimensional flows and external heat transfer near turbine-cascade end walls. The study demonstrated that employing low Reynolds-number functions near wall boundaries combined with SST turbulence models yielded calculation results closest to experimental values. Xu [
5] investigated the compressor-plane cascade test piece as the research subject and strategically positioned vortex generators near the suction leading edge of the broken wall to enhance the aerodynamic performance of the compressor stator and regulate corner separation flow. The impact of vortex generators with varying heights, lengths, and pitch positions on separation flow and aerodynamic performance in the corner region was examined through numerical simulation. Wang [
6] selected a double-arc compressor cascade as the research object to analyze the aerodynamic factors contributing to compressor performance degradation caused by roughness. A multi-control point blade-profile alteration method was employed to simulate rough blade surfaces in two-dimensional cascades. The study revealed that when completely roughened, wake loss values were 33% higher compared with smooth cascades, with roughness at 20% of the leading edge on the blade back exerting the maximum influence on cascade performance. Tian et al. [
7] A numerical study was carried out on the water droplet capturing ability of the separation stage dehumidification vane, and the effects of vane geometry and air velocity on the droplet capturing ability of the vane were investigated by using the single particle dynamics (SPD) model, which led to the principles that should be followed in the design of the separation stage dehumidification vane. Qiao [
8] used two data-driven methods to predict unsteady cascade flows in a T106 low-pressure turbine with periodic incoming turbulence under unknown conditions and at unknown moments, respectively, providing a promising approach for turbomachinery design and study of the underlying mechanisms. Zhang [
9] study analysed more than 1500 cross-sweep cascade data using the reduced dimensional force balance method. The results confirm that the circumferential fluctuation term is responsible for the radial migration of the airflow field at the inlet of the cross-swept blades, which leads to changes in the angle of incidence, and consequently to changes in the characteristics of the cross-swept blades. Wang [
10] used a hybrid unsteady Reynolds-averaged Navier-Stokes/Large Eddy Simulation (URANS/LES) turbulence model for aerodynamic, tip leakage vortex (TLV), and main flow interactions, and found that there is a correlation between POD mode time coefficients and blade aerodynamics. Shen [
11] investigated the shock-boundary layer interaction mechanism of transonic compressor profiles at different Reynolds numbers (Re) through three-dimensional Reynolds-averaged Navier-Stokes simulations. The reason for the deterioration of transonic blade performance at low Reynolds numbers is revealed. Lopes G [
12] investigated the aerodynamic characteristics of a high-speed low-pressure turbine (LPT) cascade in steady and unsteady inlet flows. The results show that unsteady turbulence has a phase-averaged effect on the secondary flow structure in an open test case high-speed LPT geometry. Václav V [
13] investigated the effect of elastic deformation of blades on the flow field through experiments and numerical simulations, and found that the distortion of the flow field due to elastic deformation of blades is very weak. Idalia J [
14] A RANS-based transition model reproduces the correct isentropic Mach number profile of the blade surface but under-predicts turbulent mixing in the wake.
In order to enhance the performance of single-row cascades, a design scheme proposing tandem cascades has been introduced. The tandem cascade connects two cascades in series to form a more intricate cascade structure. Compared with single-row cascades, the tandem cascade exhibits superior flow control and energy-loss management capabilities. Due to the series arrangement of the cascades, the fluid’s flow path becomes more complex, resulting in a more uniform distribution of the fluid energy loss and a reduction in the overall energy dissipation. Moreover, the tandem cascade demonstrates excellent directivity by effectively controlling the fluid-flow direction and velocity distribution, thereby mitigating flow instability issues. Currently, numerous studies are focusing on the aerodynamics analysis of tandem cascades. McGlumphy J et al. [
15] investigated the computational fluid dynamics for two-dimensional tandem cascades while evaluating overall performance based on the relative positioning function between front and rear airfoils using Lieblein loss and load correlation. Liu [
16,
17] employed numerical simulation methods to determine the primary sources of loss in tandem cascades, quantitatively analyzed the proportion of different loss sources in the overall loss, and established a comprehensive loss model for tandem cascades. In 2021, theoretical analysis was conducted to assess the load-advantage range of tandem cascades compared to conventional cascades, followed by comparative testing using a low-speed large-scale compressor test bench. The results demonstrated that relative to conventional schemes, the pressure ratio of tandem cascades was significantly improved within the common speed range, along with notable enhancements in the blocking flow rate and isentropic efficiency at medium and low speeds. Luo et al. [
18] primarily investigated the influence of the D-factor and PP on the flow structure of tandem cascades and observed an increase in the loss coefficient with an increasing D-factor, while it decreased with increasing PP values. Konrath et al. [
19] on their part, analyzed how tip clearance affects the flow field within an engine-core compressor’s tandem-cascade configuration; their study revealed that tip-clearance vortex breakdown occurred in the front cascade while no such effect was observed in the rear cascade. Zhang [
20] introduced three suction schemes with different axial positions to control the boundary-layer separation on the suction surface of the front blade in the compressor tandem cascade at high incidence angles and investigated their impact on cascade-performance improvement and separation-flow control. It was observed that these suction schemes exhibited effective flow control across a wide operating range, thereby expanding the incidence-angle range of the tandem cascade. Yang [
21] analysed the effects of IBL thickness and skewed IBL on the aerodynamic performance of the original and tandem impeller based on numerical methods, and found that the skewed IBL was able to inhibit the break-arm cross-flow to improve the aerodynamic performance effectively, but the increase of the IBL thickness inhibited this advantage. Lv [
22] applied the aerodynamic theory of blade mechanical flow control and presented the comprehensive performance test curves of the first developed GKJ double-row impeller fan. It is proved that the use of double-row impeller, which is a special form of blade, can promote the reorganisation of the airflow structure inside the working wheel and achieve the intended goal of flow control. Fan [
23] introduced the successful design of a double-row cascade diffuser using boundary layer control technology. Its performance is better than that of single row diffuser, which can effectively improve the performance of centrifugal compressor. It proves that double row cascade diffuser is more suitable for high pressure ratio supercharger. Zhou [
24] conducted an experimental study on the wake characteristics of cascade, and the study shows that the average wake velocity of cascade satisfies the similarity law just as that of single cascade. The average wake velocity and turbulent pulsation velocity of cascade change more gently along the frontal direction than that of single cascade.
In order to mitigate the corner-separation phenomenon in a high-load tandem-compressor cascade, Cao [
25] devised various vortex-generator schemes and conducted numerical investigations on them. It was observed that a severe corner-separation phenomenon occurred at the leading-blade channel of the tandem cascade. The utilization of inflow vortex-turnover separation interaction as a flow control method can effectively alleviate the corner-separation phenomenon. To address the challenge of designing a high-load stator with supersonic inflow and a large rotation angle, Li [
26] proposed a tandem-cascade configuration. The front cascade operates at supersonic velocities, while the rear cascade operates at subsonic velocities. The experimental results indicate that at an inflow Mach number of 1.25 and a rotation angle of 52°, the tandem cascade exhibits a total pressure-loss coefficient of 0.106 and a diffusion coefficient of 0.745. Xu [
27] employed the CFX software to simulate corrugated diffuser cascades with non-uniform amplitude leading-edge bulges, demonstrating that various forms of corrugated cascades can enhance flow separation and reduce losses at high angles of attack by modifying the amplitude distribution of specific leading-edge bulges.
Currently, tandem cascades have been extensively applied in the aerodynamic field with significant achievements. However, there is a lack of research on the hydrodynamic performance of tandem cascades. Martin et al. [
28,
29] investigated the impact of tandem cascades on the head and efficiency of centrifugal pumps and found that selecting an appropriate cascade angle and circumferential relative position can increase the pressure rise while keeping the efficiency unchanged. They also compared simulation values and experimental data for traditional impeller suction surfaces with those for tandem impeller cascades, demonstrating that flow separation on suction surfaces can be prevented by using a tandem cascade. Currently, the hydrodynamic performance advantage and range of advantage for tandem cascades compared to single-row cascades remain unclear. To address these issues, this study aims to conduct hydrodynamic simulations to compare the differences between single-row cascades and tandem cascades in terms of wake loss, secondary flow loss, friction loss, and shock loss. Additionally, the external load characteristics will be analyzed to verify the performance advantages of tandem cascades in water environments. By comparing the flow-field distribution, velocity changes, and hydrodynamic energy consumption between the two types of cascades under different operating conditions, a more accurate evaluation can be made, which will provide valuable insights for optimizing the cascade design and enhancing hydrodynamic performance.
3. Analysis of Tandem-Cascade Loss
The hydrodynamic distribution of tandem cascades reveals that the presence of two rows of blades before and after significantly influences the layout and magnitude of losses. Subsequently, a comparison was made between the different losses in tandem cascades and single-row cascades.
The aforementioned four types of losses represent the primary sources of cascades’ hydrodynamic losses, which can be considered an approximation of the total loss in cascades.
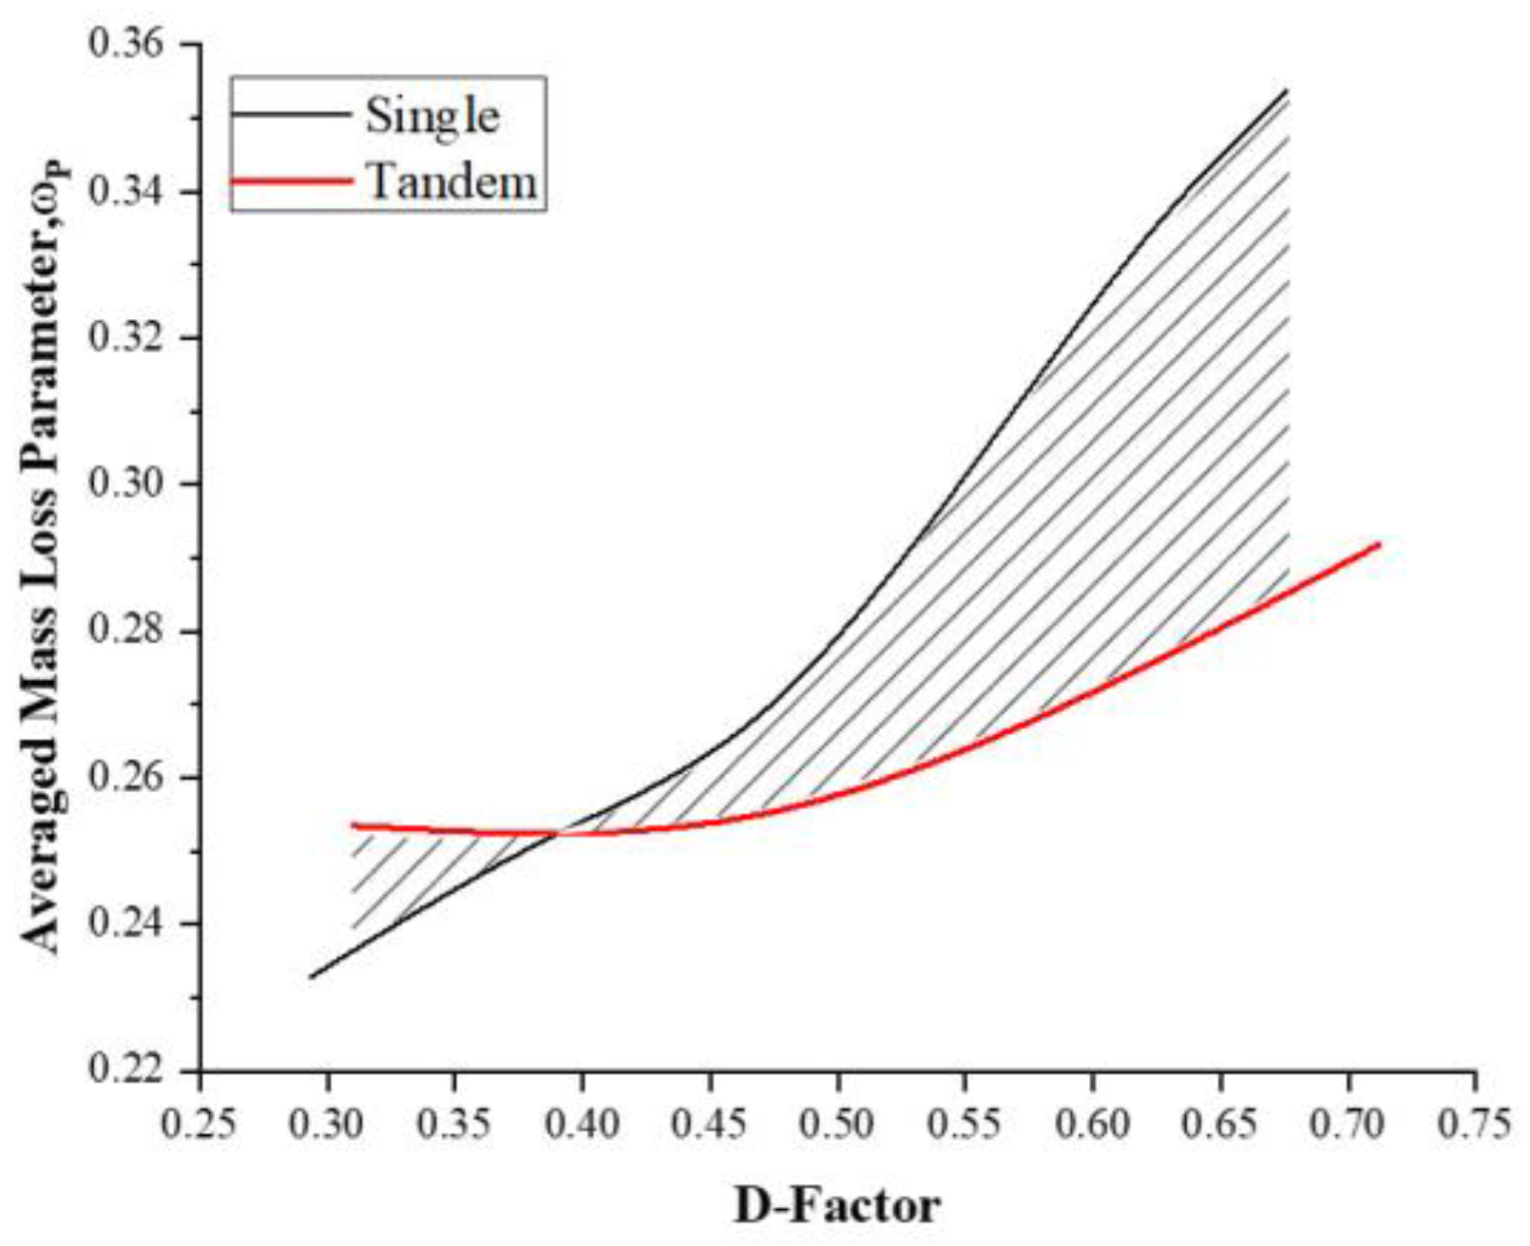
Figure 5 reveals that tandem cascades exhibit significantly lower total losses compared with single-row cascades across different D-factors, while both types demonstrate similar trends in hydrodynamic losses. Notably, when the D-factor is approximately 0.45, both single-row and tandem cascades experience minimal total losses (this finding is in line with the research of McGlumphy J et al. 2009). Analyzing the loss-distribution map for tandem configurations indicated that wake loss constitutes the predominant form of loss in two-dimensional tandem cascades, followed by secondary flow loss. Therefore, it is crucial to emphasize these two forms of loss during a cascade analysis.
Figure 6 demonstrates that as the D-factor increases, the proportion of wake loss to total loss initially rises before declining again; moreover, this proportion remains above 60%, surpassing other forms of losses by a significant margin. Therefore, wake loss is a crucial source of energy dissipation. The variation in the D-factor influences the secondary flow loss, which initially decreases and then increases, mirroring the trend observed in the total loss. This suggests that changes in the D-factor have a significant impact on the sensitivity of secondary flow loss. Subsequent analysis will delve into distinct losses and internal flow characteristics.
3.1. Friction Loss
Friction loss refers to the dissipation of energy resulting from the resistance encountered when two surfaces come into contact and move relative to each other. When there is rubbing between the surfaces of two objects, friction impedes their motion and generates thermal energy. This conversion of mechanical energy into heat is known as friction loss. Friction loss can lead to reduced efficiency in mechanical systems, wastage of energy, and potential equipment damage.
In the study by Xu [
30], the calculation method of friction loss is introduced in detail:
where
λ is the frictional-resistance coefficient, which is a function of the Reynolds number (
Re) and relative roughness,
Re is Reynolds number, the calculation formula is expressed as .
The friction loss of the tandem cascade between D-factors of 0.35 and 0.6 is observed to be smaller than that of the single-row cascade, as depicted in
Figure 7, suggesting that increasing the rear cascade can effectively reduce friction loss in most cases. Notably, when the D-factor is 0.4, the friction loss reaches its minimum value with a significant gap compared with the single-row configuration; however, beyond 0.45, there is a sharp increase in friction loss due to reduced spacing between the front and rear cascades. This narrowing gap causes an abrupt acceleration of the water-flow velocity, leading to progressively larger energy losses and, consequently, higher friction losses.
3.2. Secondary Flow Loss
Secondary flow loss, also known as vortex loss, is the energy loss caused by flow discontinuity in pipelines or other flow equipment. The calculation formula of secondary flow loss is obtained by referring to Xu [
30]:
The magnitude and direction of the secondary flow velocity primarily govern the extent of secondary flow losses, which are intricately linked to the pressure differential between the upstream and downstream regions. Notably, there exists a discernible correlation between
and fluid velocity, thereby enabling the derivation of this relationship.
and represent the velocities at the wheel cover and wheel rim in three-dimensional space, whereas in a two-dimensional blade cascade, they denote the velocities on the upper and lower surfaces of the blade cascade.
Based on
Figure 7, it is evident that for D-factors exceeding 0.45, the tandem cascade demonstrates reduced secondary flow losses compared with the single-row cascade, indicating that optimal blade-placement angles can effectively mitigate such losses. In a single-row cascade, fluid passage through the cascade leads to vortex formation and, subsequently, significant secondary flow losses due to increased fluid flow and turbulence intensity. However, in two-dimensional tandem cascades (as depicted in
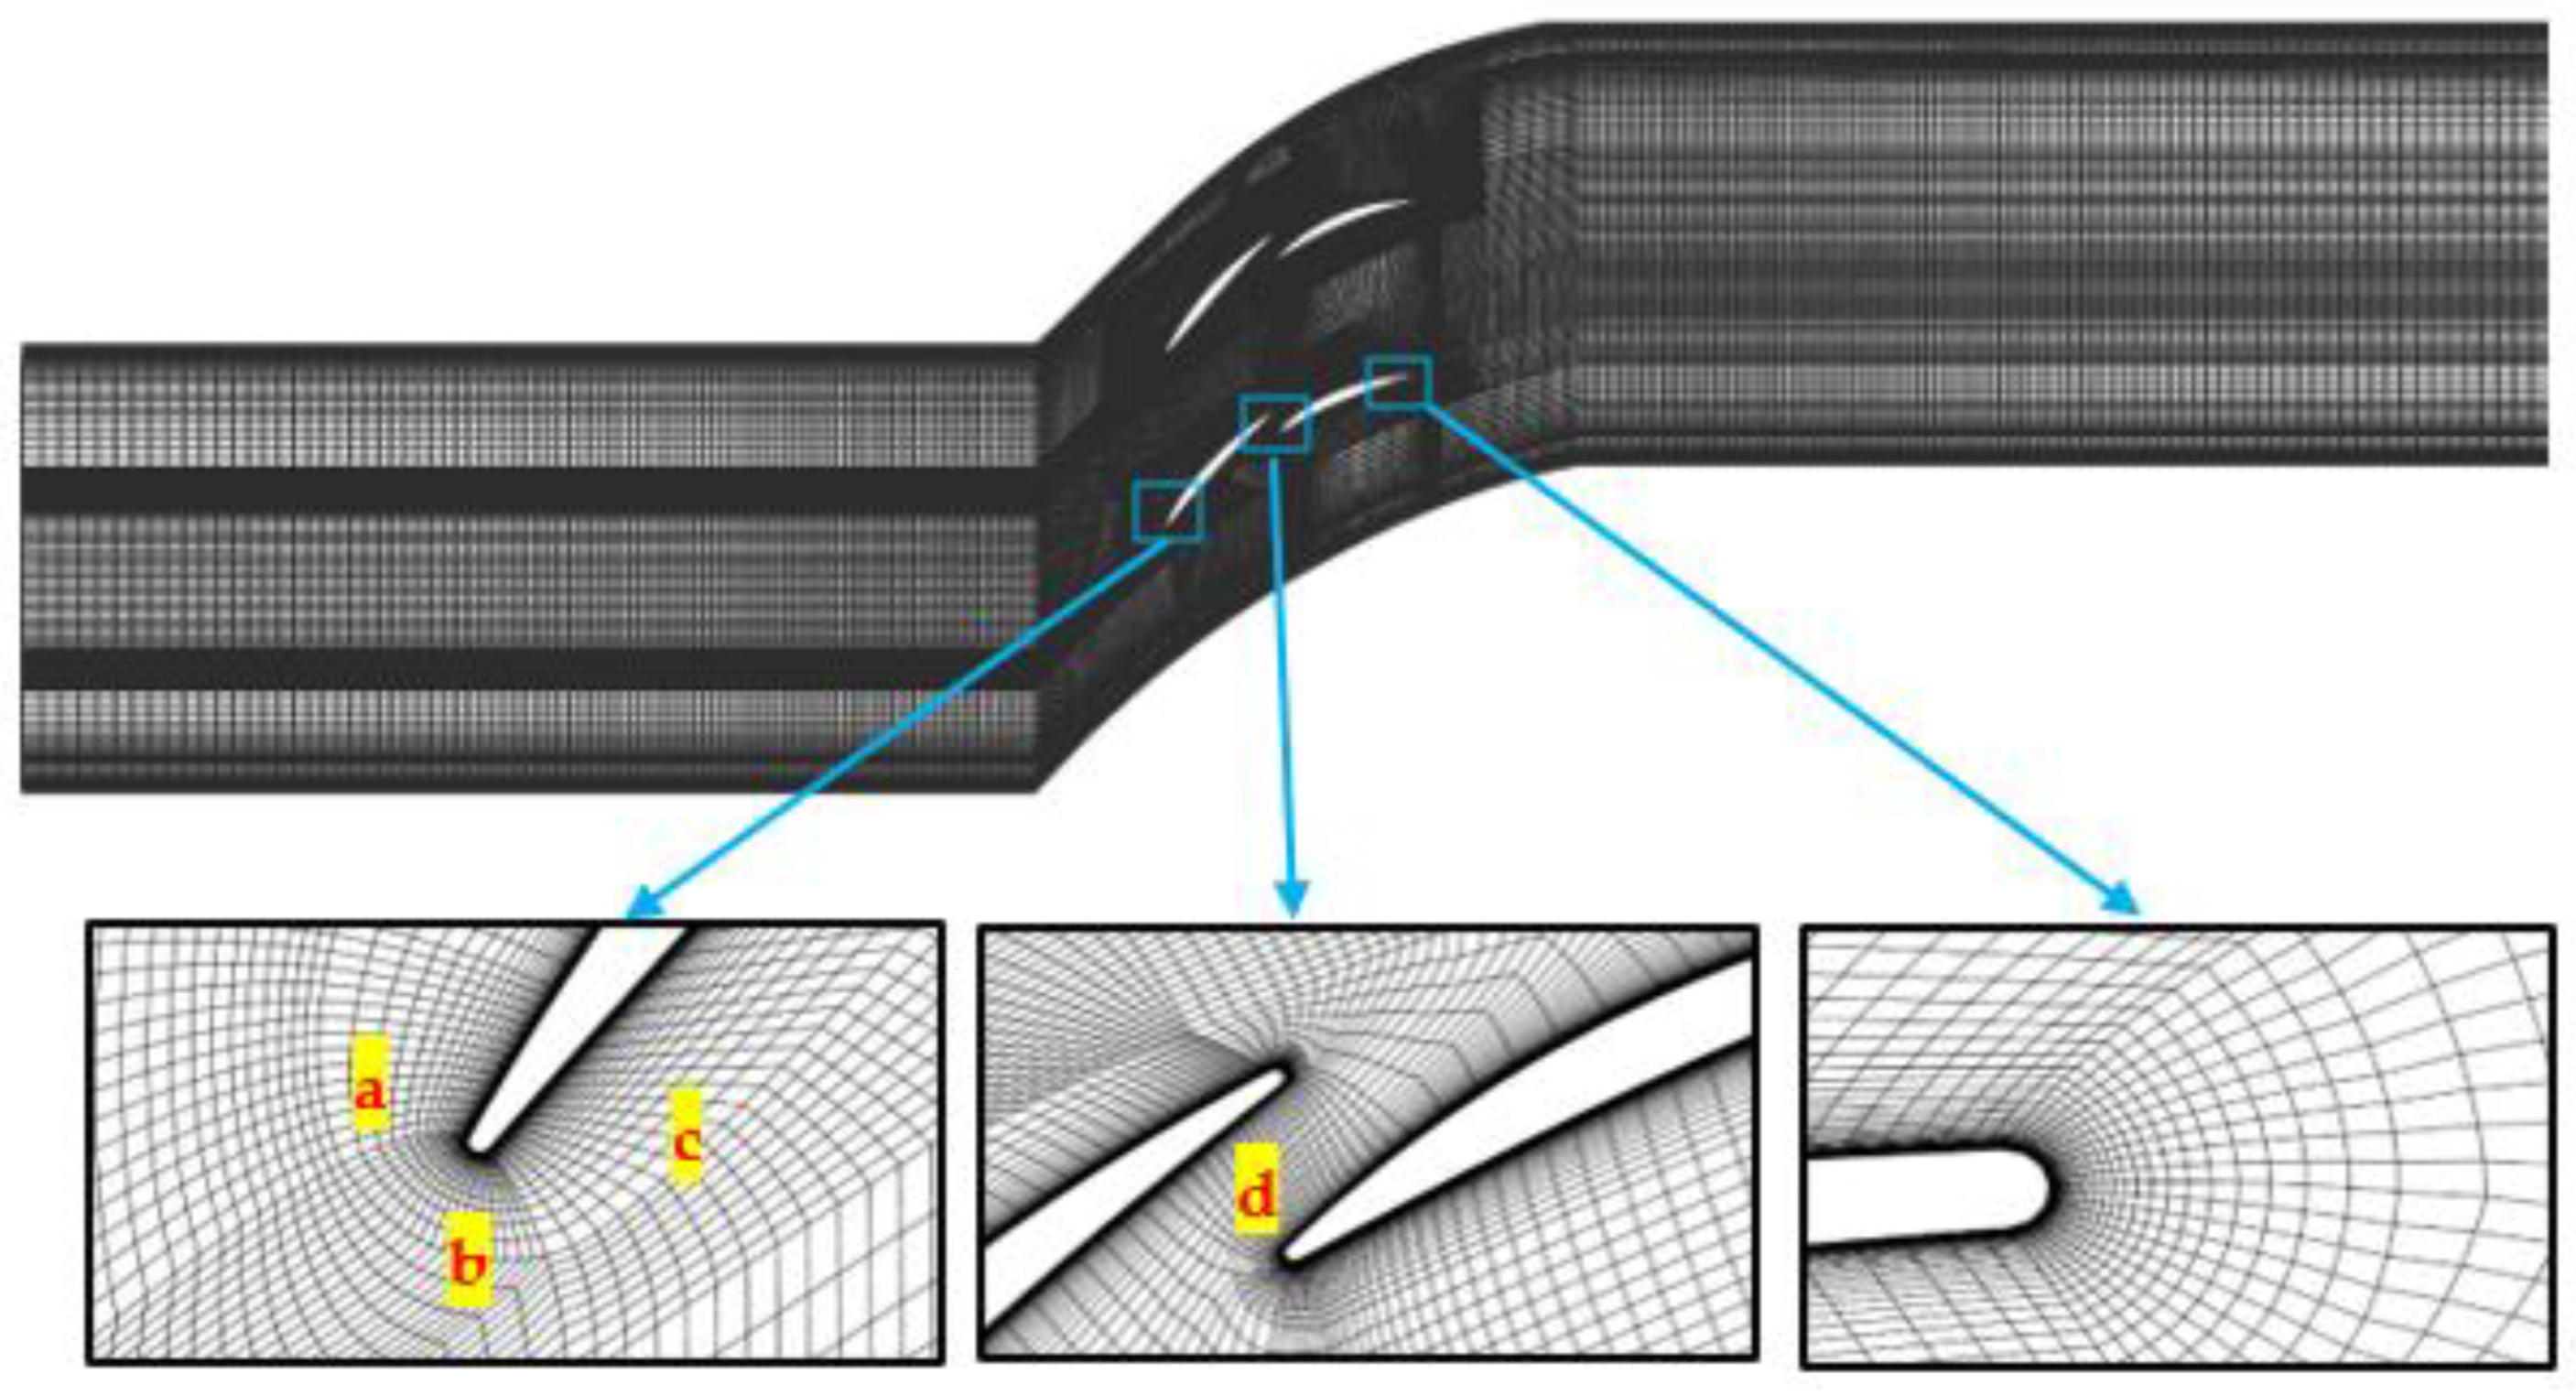
Figure 8), the presence of rear blades effectively suppresses vortex generation and development (the c region in
Figure 8 corresponds to the yellowed area a in
Figure 3). By adjusting the spacing and angle between cascades, a two-dimensional tandem cascade can achieve a smoother flow and minimize turbulence generation. Moreover, rear blades play a guiding role in directing fluid along predetermined streamlines through the cascade, resulting in reduced vortex generation and secondary flow loss. To summarize, compared with single-row cascades, two-dimensional tandem cascades exhibit superior control over the flow with smaller secondary flow losses.
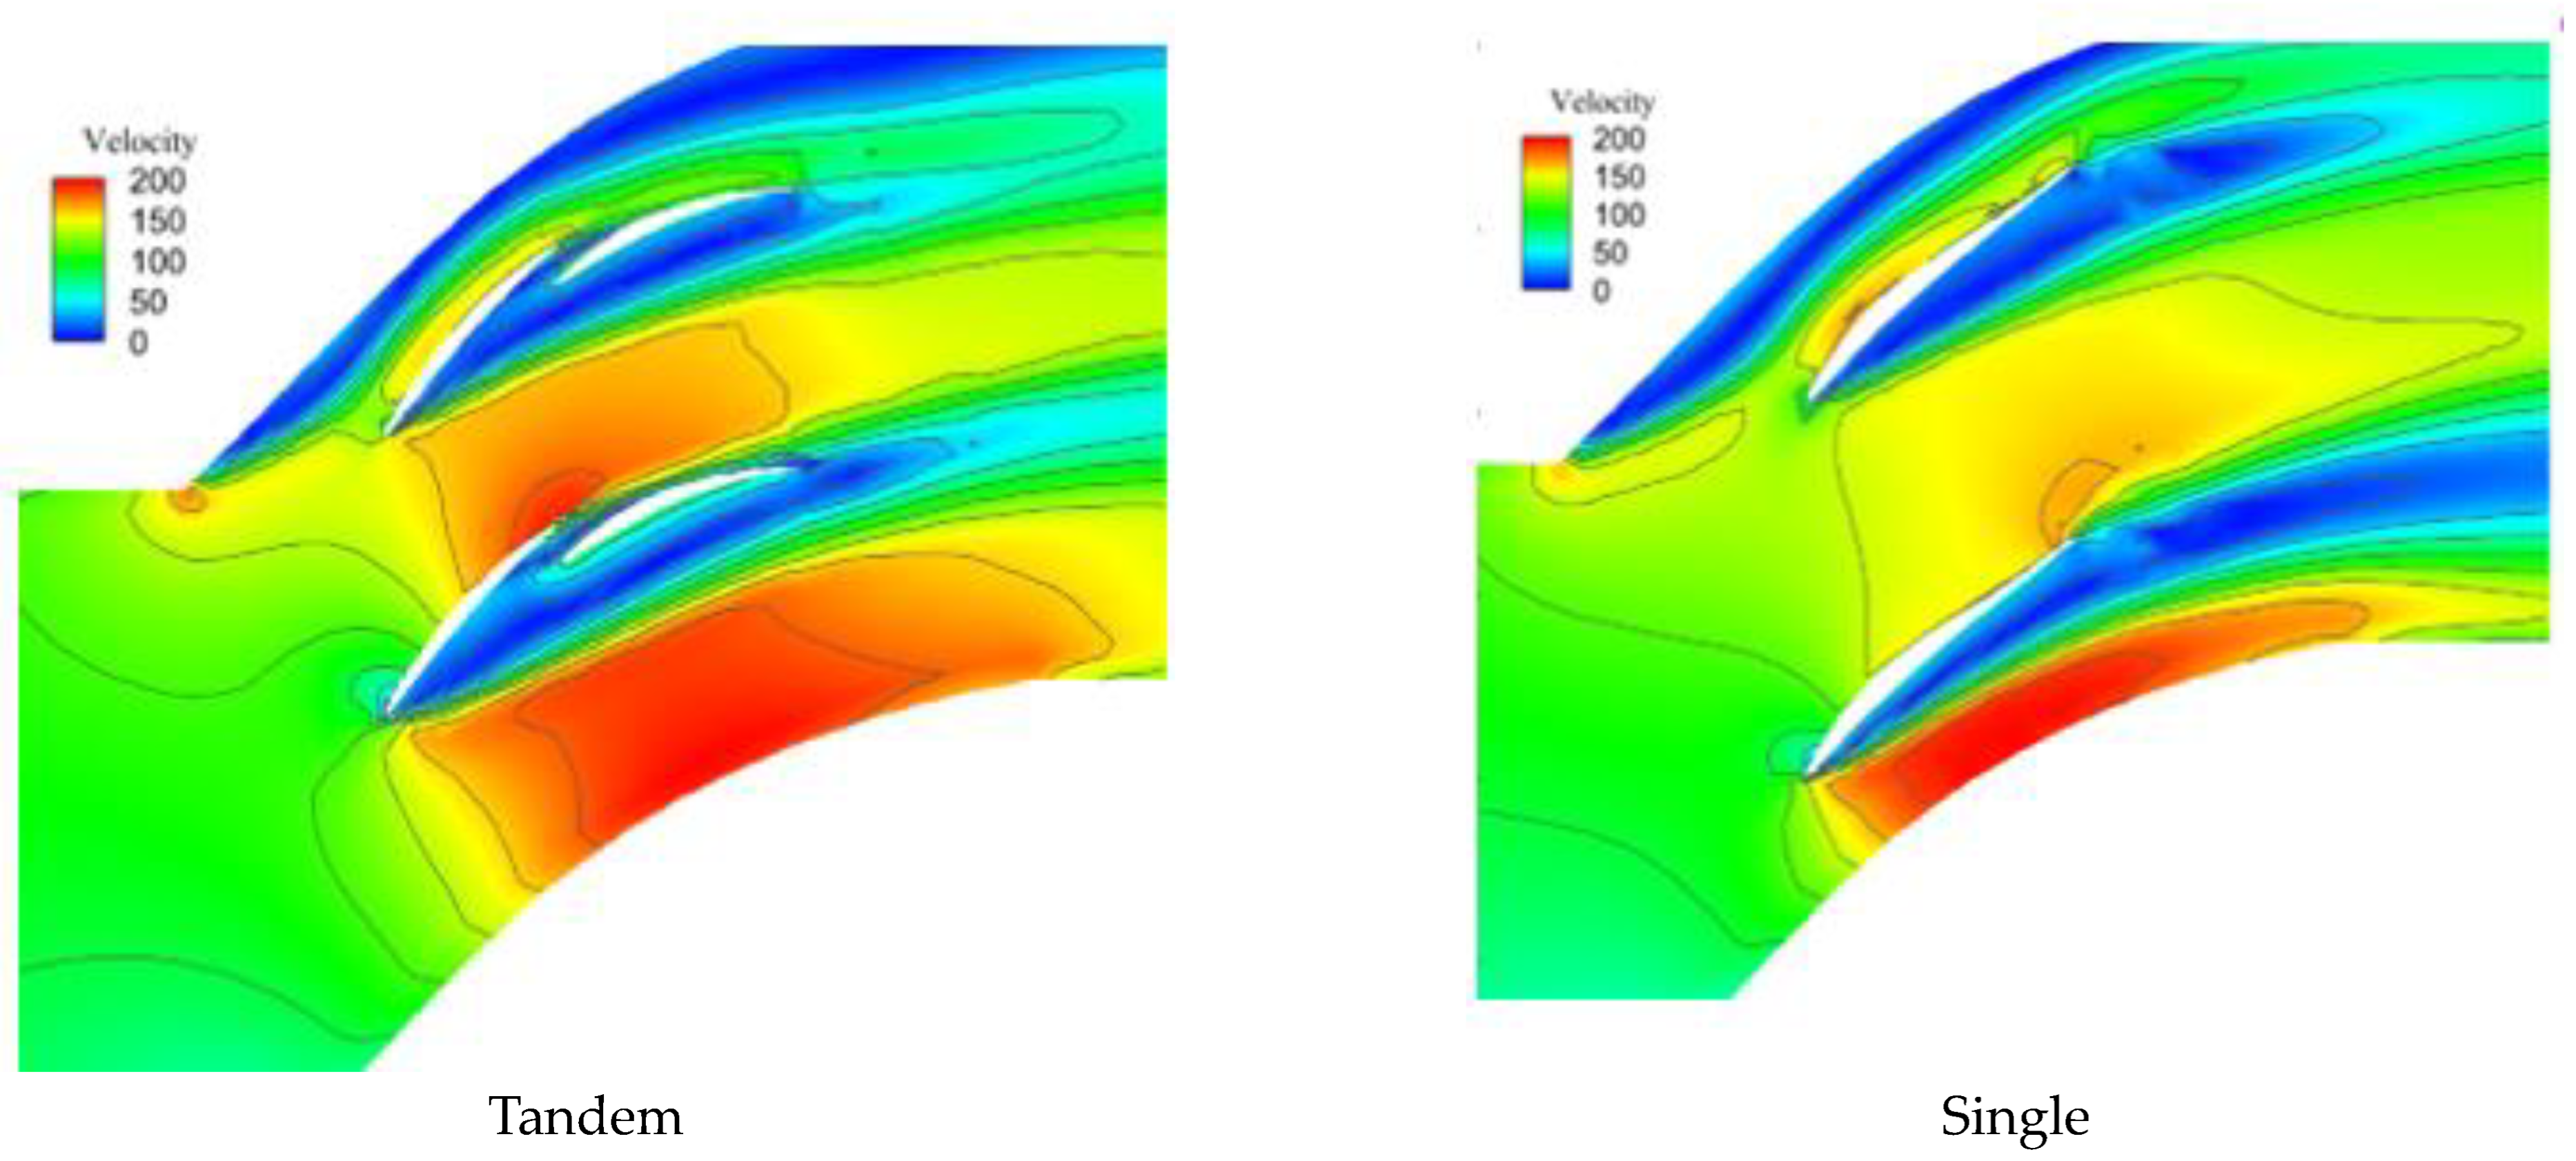
3.3. Wake Loss
Due to factors such as fluid-flow discontinuity and energy dissipation, the calculation formula for wake loss is introduced with reference to Xu [
30] regarding the introduction of wake loss.
Of the parameters, represents the wake-loss coefficient, which primarily correlates with the thickness of the cascade’s trailing edge and the ratio of boundary-layer thickness to blade passage width. A thicker trailing edge in the cascade results in a larger value, indicating an increased magnitude of wake loss.
The wake of the tandem cascade is evidently smaller than that of the single-row cascade, as depicted in
Table 2. Although the upper cascade of the single-row configuration exhibits minimal wake loss, a relatively large wake is observed for the lower cascade (as illustrated in
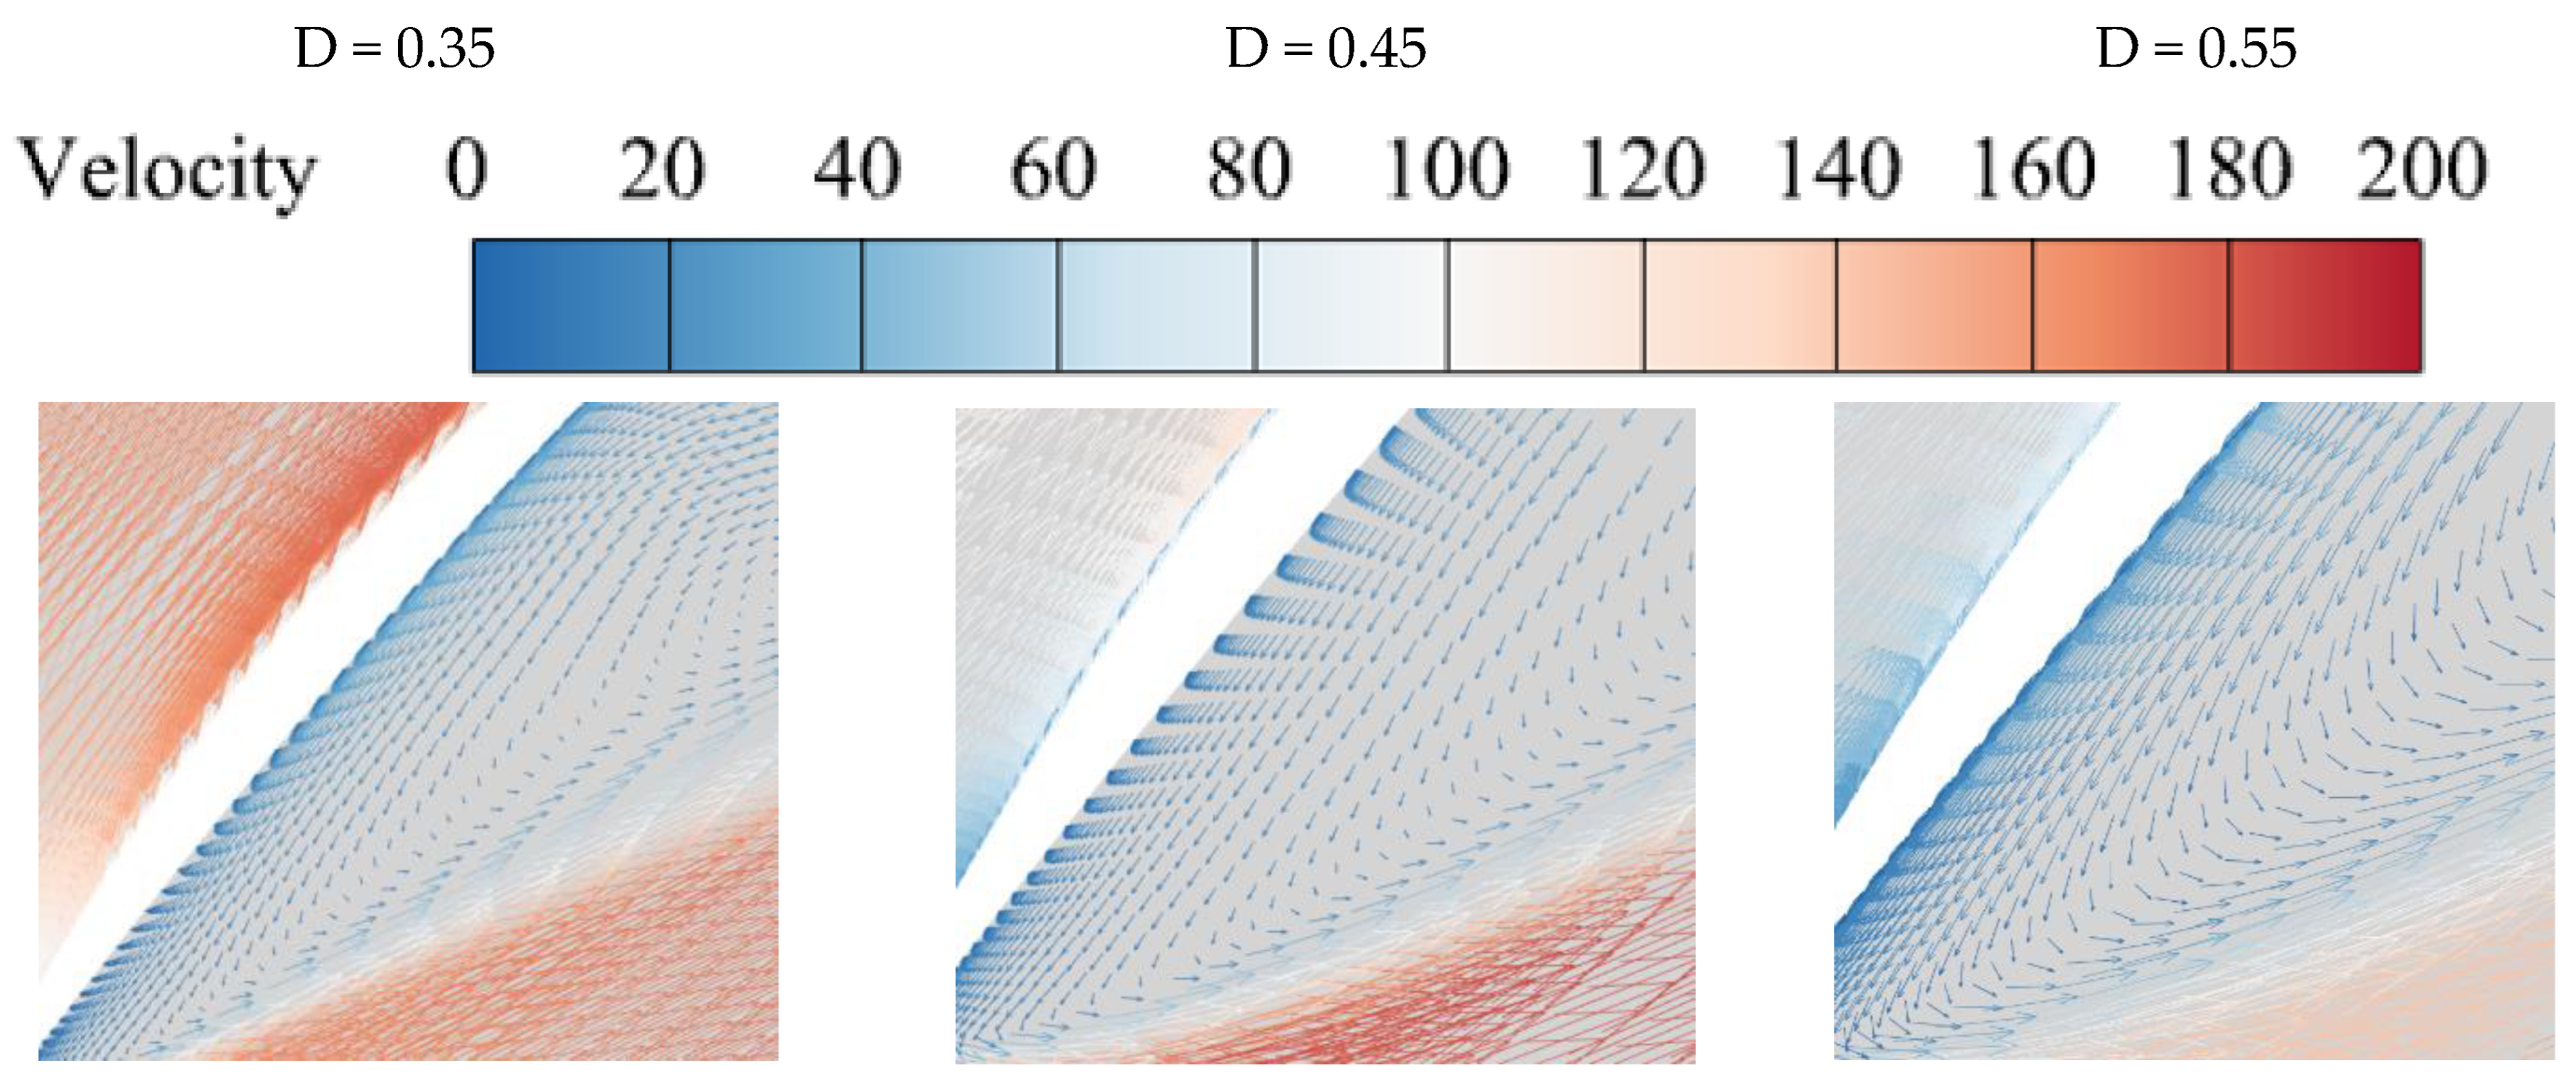
Figure 9). This disparity can be primarily attributed to the significant discrepancy between the incoming flow angle and installation angle of the single-row cascade, which results in an excessively wide range for the wake formation. Notably, negligible wake loss occurs below the lower cascade in a single-row arrangement; however, a prolonged wake forms behind it. After converting the single-row cascade into a tandem cascade, the rear cascade can induce additional turbulence in the wake of the front row, thereby reducing velocity and turbulence intensity of the wake and minimizing wake loss. Amongst the tandem cascades, wakes at different D-factors exhibit variations; when D = 0.45, the range below the cascade is the smallest due to two-dimensional tandem cascades being able to adjust the spacing and angle between cascades for smoother flow continuity, which reduces the dispersion and chaos of wakes while ensuring their stability and energy conservation.
3.4. Shock Loss
The shock loss is determined by referring to the study by Yang [
31]. The magnitude of the shock loss is contingent upon the relative velocity difference before and after the inlet edge of the cascade. The shock loss varies under different operational conditions.
The relative velocity at the leading edge of the cascade inlet is equivalent to the free-stream relative velocity when there is no crowding observed upon exit, while represents the relative velocity at the trailing edge of the cascade inlet.
is the shock loss coefficient, and its calculation formula is
In the formula, represents the inlet angle of the cascade. When the cascade undergoes distortion, we utilize the inlet angle of the cascade at the middle streamline instead, denoted as , which corresponds to the inlet angle at the middle streamline of the impeller.
The minimum shock loss is observed in the single-row cascade at a D-factor of 0.6, while the tandem cascade exhibits the minimum shock loss at a D-factor of 0.5 (as shown in
Table 3). Notably, the minimum value of the single-row cascade is smaller than that of the tandem cascade due to the significant impact on shock loss caused by the angle arrangement between the front and rear rows in the tandem configuration. Specifically, when fluid flows into the front-row blades, deviations between the fluid-flow direction and the blade inlet angle result in wall-surface impacts and subsequent losses (
Figure 10; the b region corresponds to the yellow b region in
Figure 3). When the fluid passes from the front blade to the rear blade in a tandem cascade, it experiences an additional impact on the rear blade. Consequently, tandem cascades exhibit two shock losses compared with single-row cascades, which have only one shock loss. However, by optimizing the blade angle, smooth passage of fluid through tandem cascades can be achieved with reduced losses. Although shock loss constitutes a small fraction of the total loss, the advantages of tandem modification become evident when considering other types of losses. Therefore, from a holistic perspective, the tandem configuration offers distinct advantages.
4. Results and Discussion
The calculation formula of the pressure coefficient can be expressed as follows:
where
represents the difference between the pressure and the average value, and
represents the average value of all detected pressures.
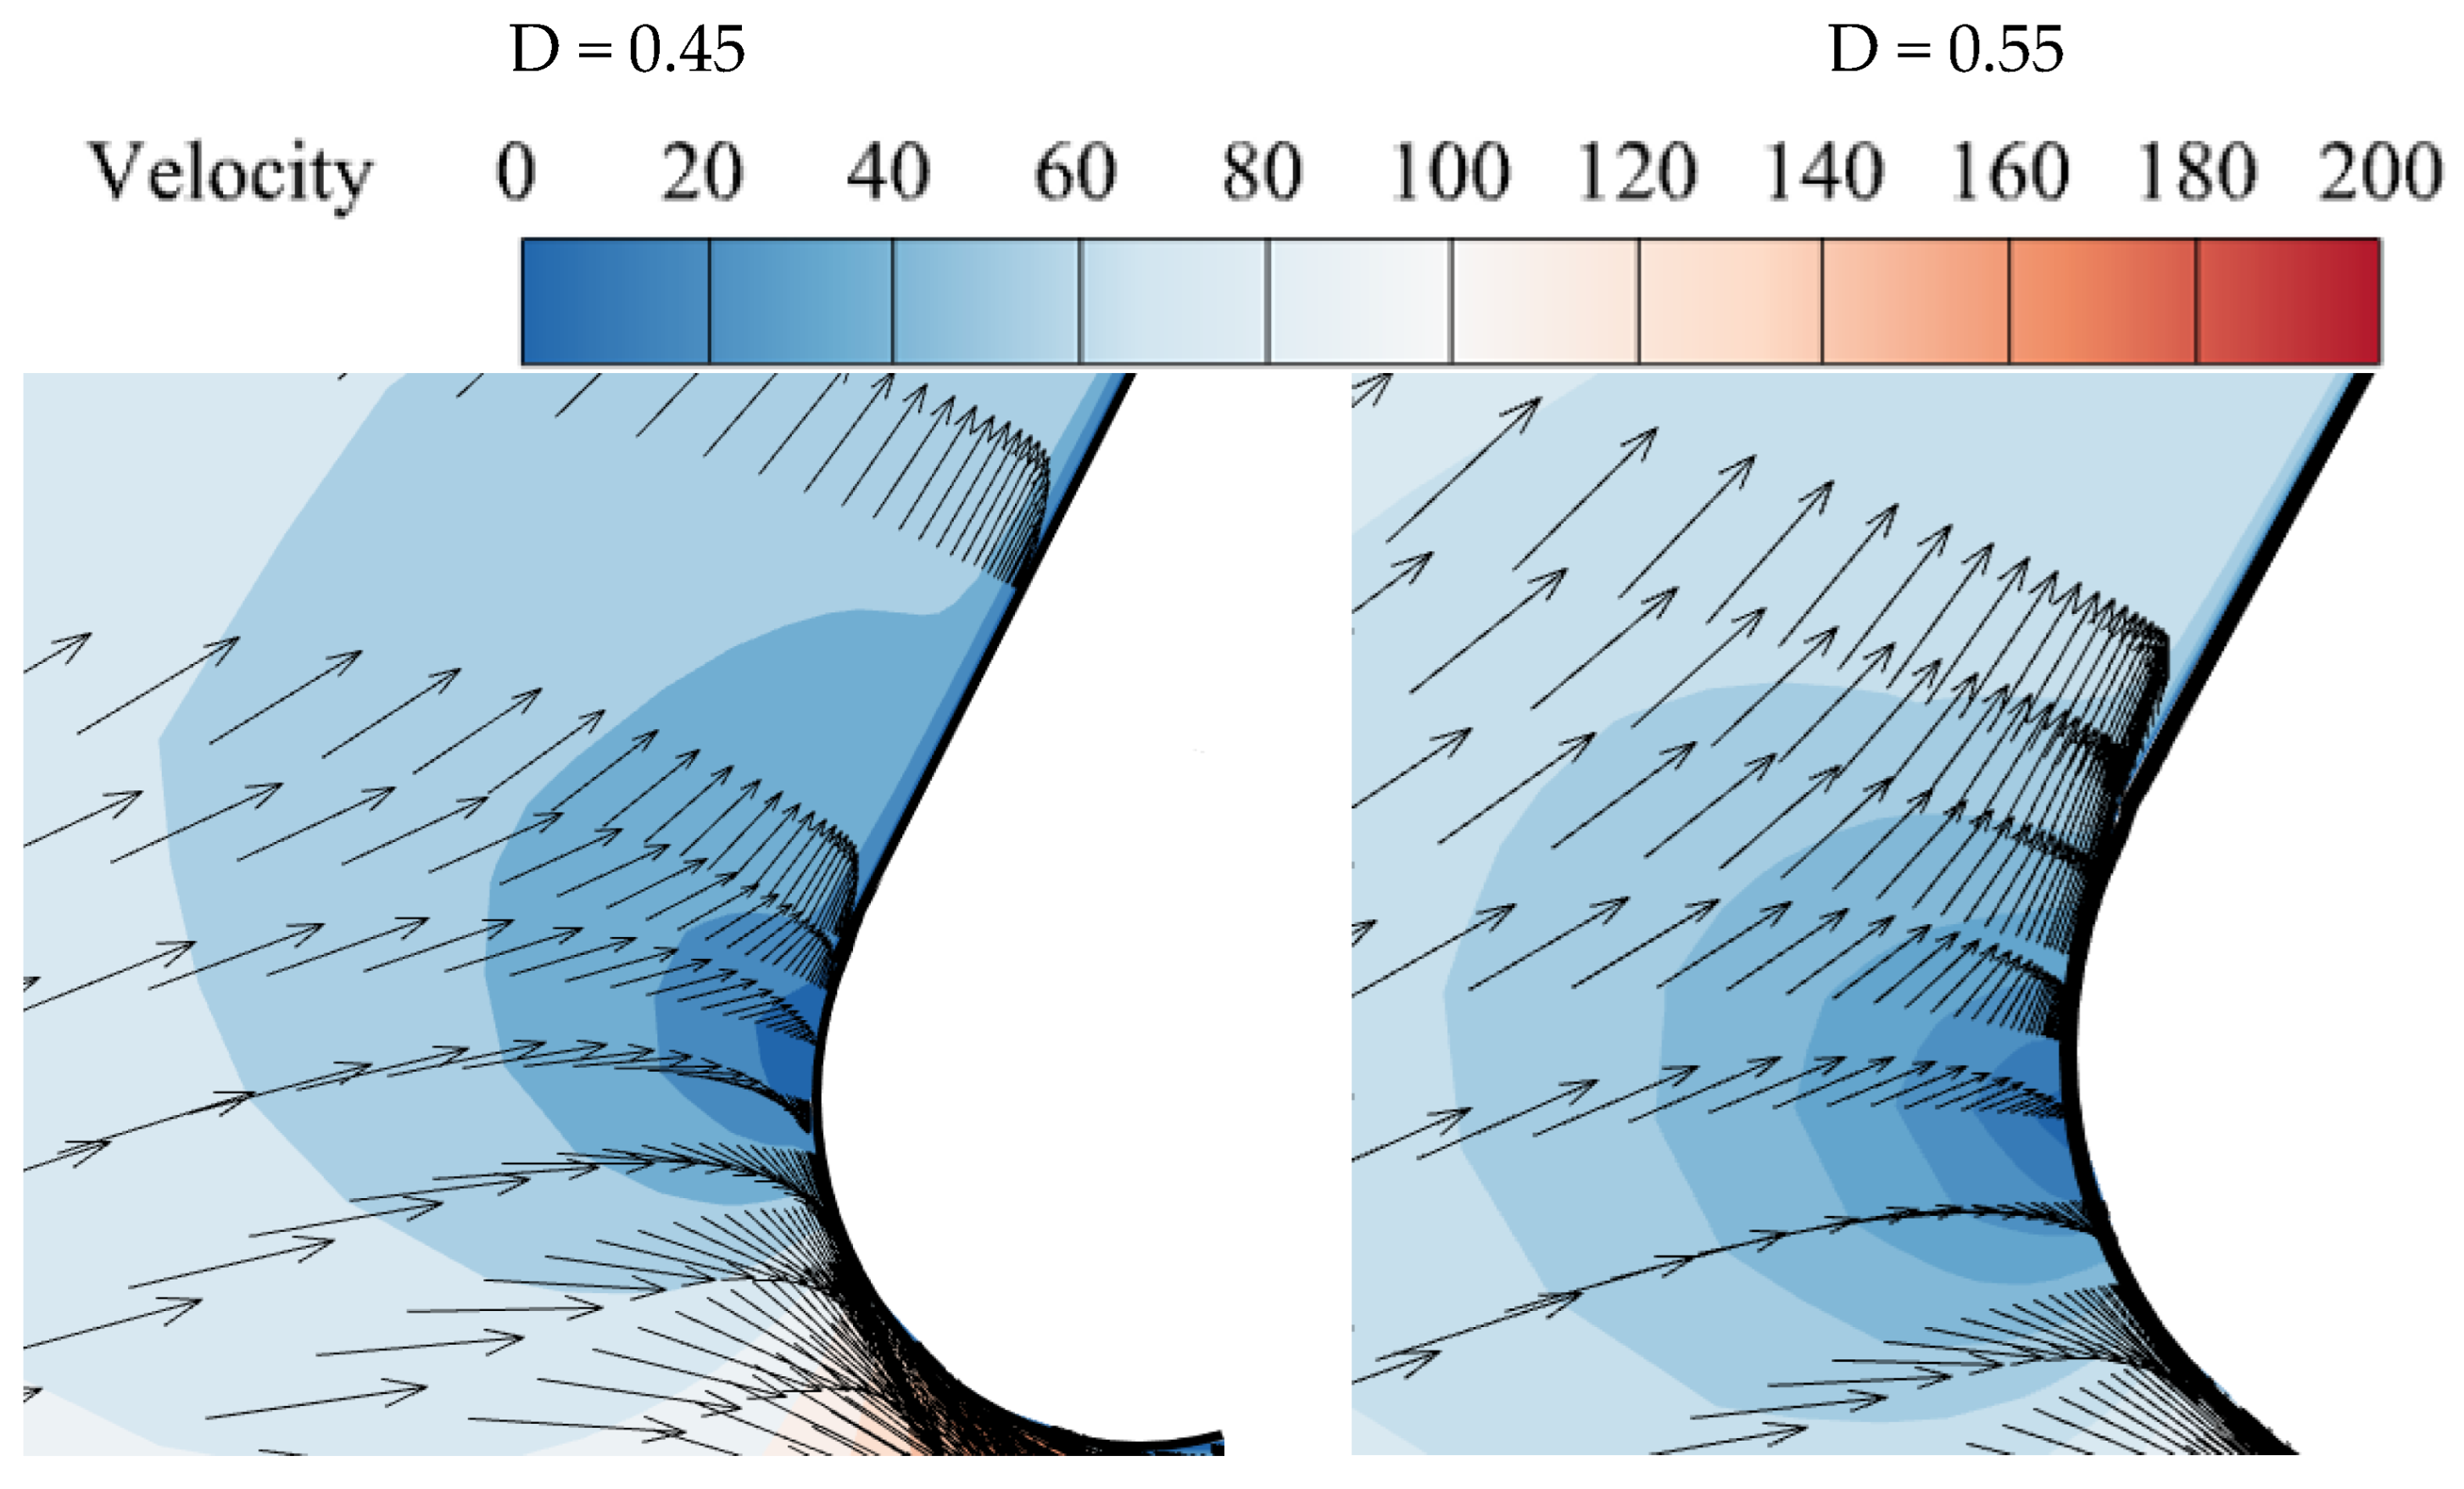
When the D-factor is 0.45 and 0.55 (hereinafter referred to as group 1), there exists a significant disparity in the upper and lower surface-load performance of the front-row blade compared with when the D-factor is 0.35 and 0.65 (hereinafter referred to as group 2). Upon passing through the front-row blade, group 2 exhibits an observable phenomenon of cross-cutting between its upper and lower surface loads, which differs significantly from group 1 (
Figure 11). This discrepancy primarily arises due to the diversion of water flow at the tip of the blade in group 1, as depicted in
Figure 12 (b represents area b in
Figure 3), while on the upper surface leading edge of the blade, group 2 experiences a diversion phenomenon deviating from its intended direction, resulting in reduced fluid velocity, as shown in
Figure 13 (a represents area a in
Figure 3). Consequently, more fluid flows into the lower surface, increasing its flow rate and causing a lower load on the upper surface than on the lower surface. Subsequent passage through this diversion region restores flow velocity and load levels on both surfaces to normal, thereby giving rise to cross-cutting phenomena between their respective loads. When the D-factor is 0.35, the upper and lower surface loads on the single-row blade lattice intersect twice, whereas in other cases, they only intersect once. This phenomenon primarily arises due to the similar and relatively large flow angles of fluid passing through both the leading and trailing edges of the blades at a D-factor of 0.35, resulting in significant flow resistance and causing the overlapping occurrence of load distribution on both surfaces of the blades.
From
Figure 11, it can be observed that the load difference between the upper and lower surfaces of the blade increases abruptly at different D-factors when the water flow enters the rear blade through the front blade. This phenomenon primarily arises due to the flow limitation and formation of a rotating vortex in the cascade gap, resulting in increased pressure locally on the blade surface (as shown in
Figure 14). The uneven load distribution is caused by variations in flow velocity between the upper and lower surfaces of the cascade. Furthermore, as fluid passes through the narrow gap between the front and rear cascades, there is a significant increase in the flow velocity, which leads to substantial shock loss upon impacting with the surface of the rear cascade, consequently amplifying load differences between its upper and lower surfaces. Furthermore, the absence of double-row blades in the single-row cascade eliminates the occurrence of inter blade vortex flow.
According to the significant load disparity between the upper and lower surfaces of group 1′s front and rear blades, it can be inferred that these blades possess a commendable load-bearing capacity and are capable of withstanding high loads and pressures. Moreover, this increased load difference will augment the stress differential between the upper and lower surfaces of the blade, thereby enhancing its rigidity and stability. Within a reasonable design range, these blades exhibit superior characteristics. These findings serve as crucial references for research and application in related fields. Further investigations can validate the bearing capacity and rigidity of these blades through experimental or simulation methods while also optimizing their design to enhance their performance in associated equipment. In engineering practice, comprehensive considerations encompassing factors such as load distribution, material strength, and structural design are essential for achieving optimal blade performance and longevity.


