Article

Revealing the Sources of Nutrients in the Surface Waters of the Selenga River Watershed Using Hydrochemical and Geospatial Data

by
Mikhail Y. Semenov
1,*,
Anton V. Silaev
2,
Yuri M. Semenov
2 and
Larisa A. Begunova
3
1
Limnological Institute, Siberian Branch of Russian Academy of Sciences, Ulan-Batorskaya St. 3, 664033 Irkutsk, Russia
2
V.B. Sochava Institute of Geography, Siberian Branch of Russian Academy of Sciences, Ulan-Batorskaya St. 1, 664033 Irkutsk, Russia
3
Department of Chemistry and Biotechnology, Institute of High Technologies, Irkutsk National Research Technical University, Lermontov St. 83, 664074 Irkutsk, Russia
*
Author to whom correspondence should be addressed.
Water 2024, 16(5), 630; https://doi.org/10.3390/w16050630
Submission received: 14 January 2024 / Revised: 18 February 2024 / Accepted: 19 February 2024 / Published: 20 February 2024

Abstract

:
This study was the first attempt to identify the sources of total oxidized nitrogen (TON) and inorganic phosphorus (IP) in the water of the Selenga River—the main tributary of Lake Baikal. To identify TON and IP sources, the data on nutrient concentrations in water of Selenga River and its tributaries as well as the data on river runoff were collected and mapped. On the basis of the obtained data, the values of TON and IP exported from different parts of Selenga watershed were evaluated and mapped using geospatial techniques. In addition, critical source areas (CSAs) which accumulate soil pollutants from nonpoint pollution sources and release them into the surface water during storm events were identified in most polluted watershed areas. It was found that the values of TON exports in most parts of the Selenga watershed varied in the range 0–50 kg/km2/yr, whereas the values of IP exports varied in the range 0–5 kg/km2/yr. Obtained data on TON export were in agreement with those obtained earlier by foreign researchers using global models of nutrient export, whereas data on IP exports were two times higher than those previously modelled.

1. Introduction

A decline in surface water quality due to eutrophication is one of the most serious environmental problems in the world [1,2,3]. Eutrophication is usually defined as an overabundance of nitrogen (N) and phosphorus (P) in surface waters, leading to increased growth of phytoplankton and macrophytes [4]. Algae blooms block sunlight and sometimes release toxins into water. The decomposition of dead algae by bacteria results in the consumption of dissolved oxygen that is essential for the survival of all aquatic life [5,6].
The problem of nutrient pollution became apparent in early 1950s. Since that time, thousands of studies devoted to the evaluation of eutrophication and assessment of its negative impact on aquatic organisms have been undertaken all over the world [7,8]. Against this background, the effect of anthropogenic N and P input on the aquatic ecosystems of the Lake Baikal watershed seems to be almost unstudied. This is mostly due to the fact that eutrophication of the freshwater ecosystems in the Lake Baikal watershed has a local character. Eutrophication has only been detected in shallow bays [9]. Eutrophied bays are marked by planktonic algae blooms as well as by thick mats of benthic algae [9,10,11,12,13]. The eutrophication of riverine waters in the Lake Baikal watershed was not observed; however, the water quality of some Lake Baikal tributaries does not meet the standards established in Russia and abroad [14,15,16,17,18,19]. Thus, taking into account the recent economic growth in the region, the elaboration of measures to reduce future nutrient pollution is necessary.
The reduction of nutrient inputs into freshwater ecosystems is tightly linked to identification of nonpoint N and P sources. After water-protecting laws were adopted in most countries of the world [20,21,22,23,24], point-source releases of N and P have declined dramatically, but nonpoint-source pollution still poses a significant threat to water quality around the world [25]. Since nonpoint sources (NPS) have no clearly defined borders, their identification is reduced to the identification of NPS areas that accumulate pollutants and are located close to water bodies. Such areas are called critical source areas (CSAs) [26]. CSAs represent hydrologically sensitive areas (HSAs) that are especially prone to generating runoff [27,28] and are characterized by a high level of soil pollution.
Currently, methods ranging from simple index-based techniques such as the Phosphorus Index and Topographic Wetness Index [29,30] to complex hydrologic and water quality (HWQ) models such as SWAT [31], AGNPS [32] and GWLF [33] are used to identify CSAs. The soil and water assessment tool (SWAT) model is believed to be the most powerful tool for the identification of nonpoint pollution sources. The spatial data used in the SWAT model include topographic maps, land cover maps, soil type maps and river network maps. The attribute data required include the physical characteristics of the soil, tillage operations, the composition of pesticides and fertilizers and methods of their application, meteorological and hydrological data, data on septic systems, etc. [34,35].
Unfortunately, although environmental studies in Lake Baikal basin have been carried out for almost one hundred years, the available spatial data are insufficient for modeling N and P losses from soil using SWAT. The existing soil and land use maps use a scale of 1:5,000,000–1:10,000,000 [36,37,38], whereas the desirable map scales should be between 1:50,000 and 1:200,000. Moreover, the databases of soil properties, meteorological conditions of study area and hydrological parameters of the Lake Baikal tributaries are missing completely. Thus, the use of any HWQ model is not possible at present.
This study is the first attempt to evaluate the spatial distribution of total oxidized nitrogen (TON) and inorganic phosphorus (IP) export rates to the surface waters of the Selenga River watershed, to identify areas that strongly contribute to nutrient loadings and to provide the first rough-cut estimate of the spatial distribution of CSAs in these areas using simple GIS techniques.

2. Materials and Methods

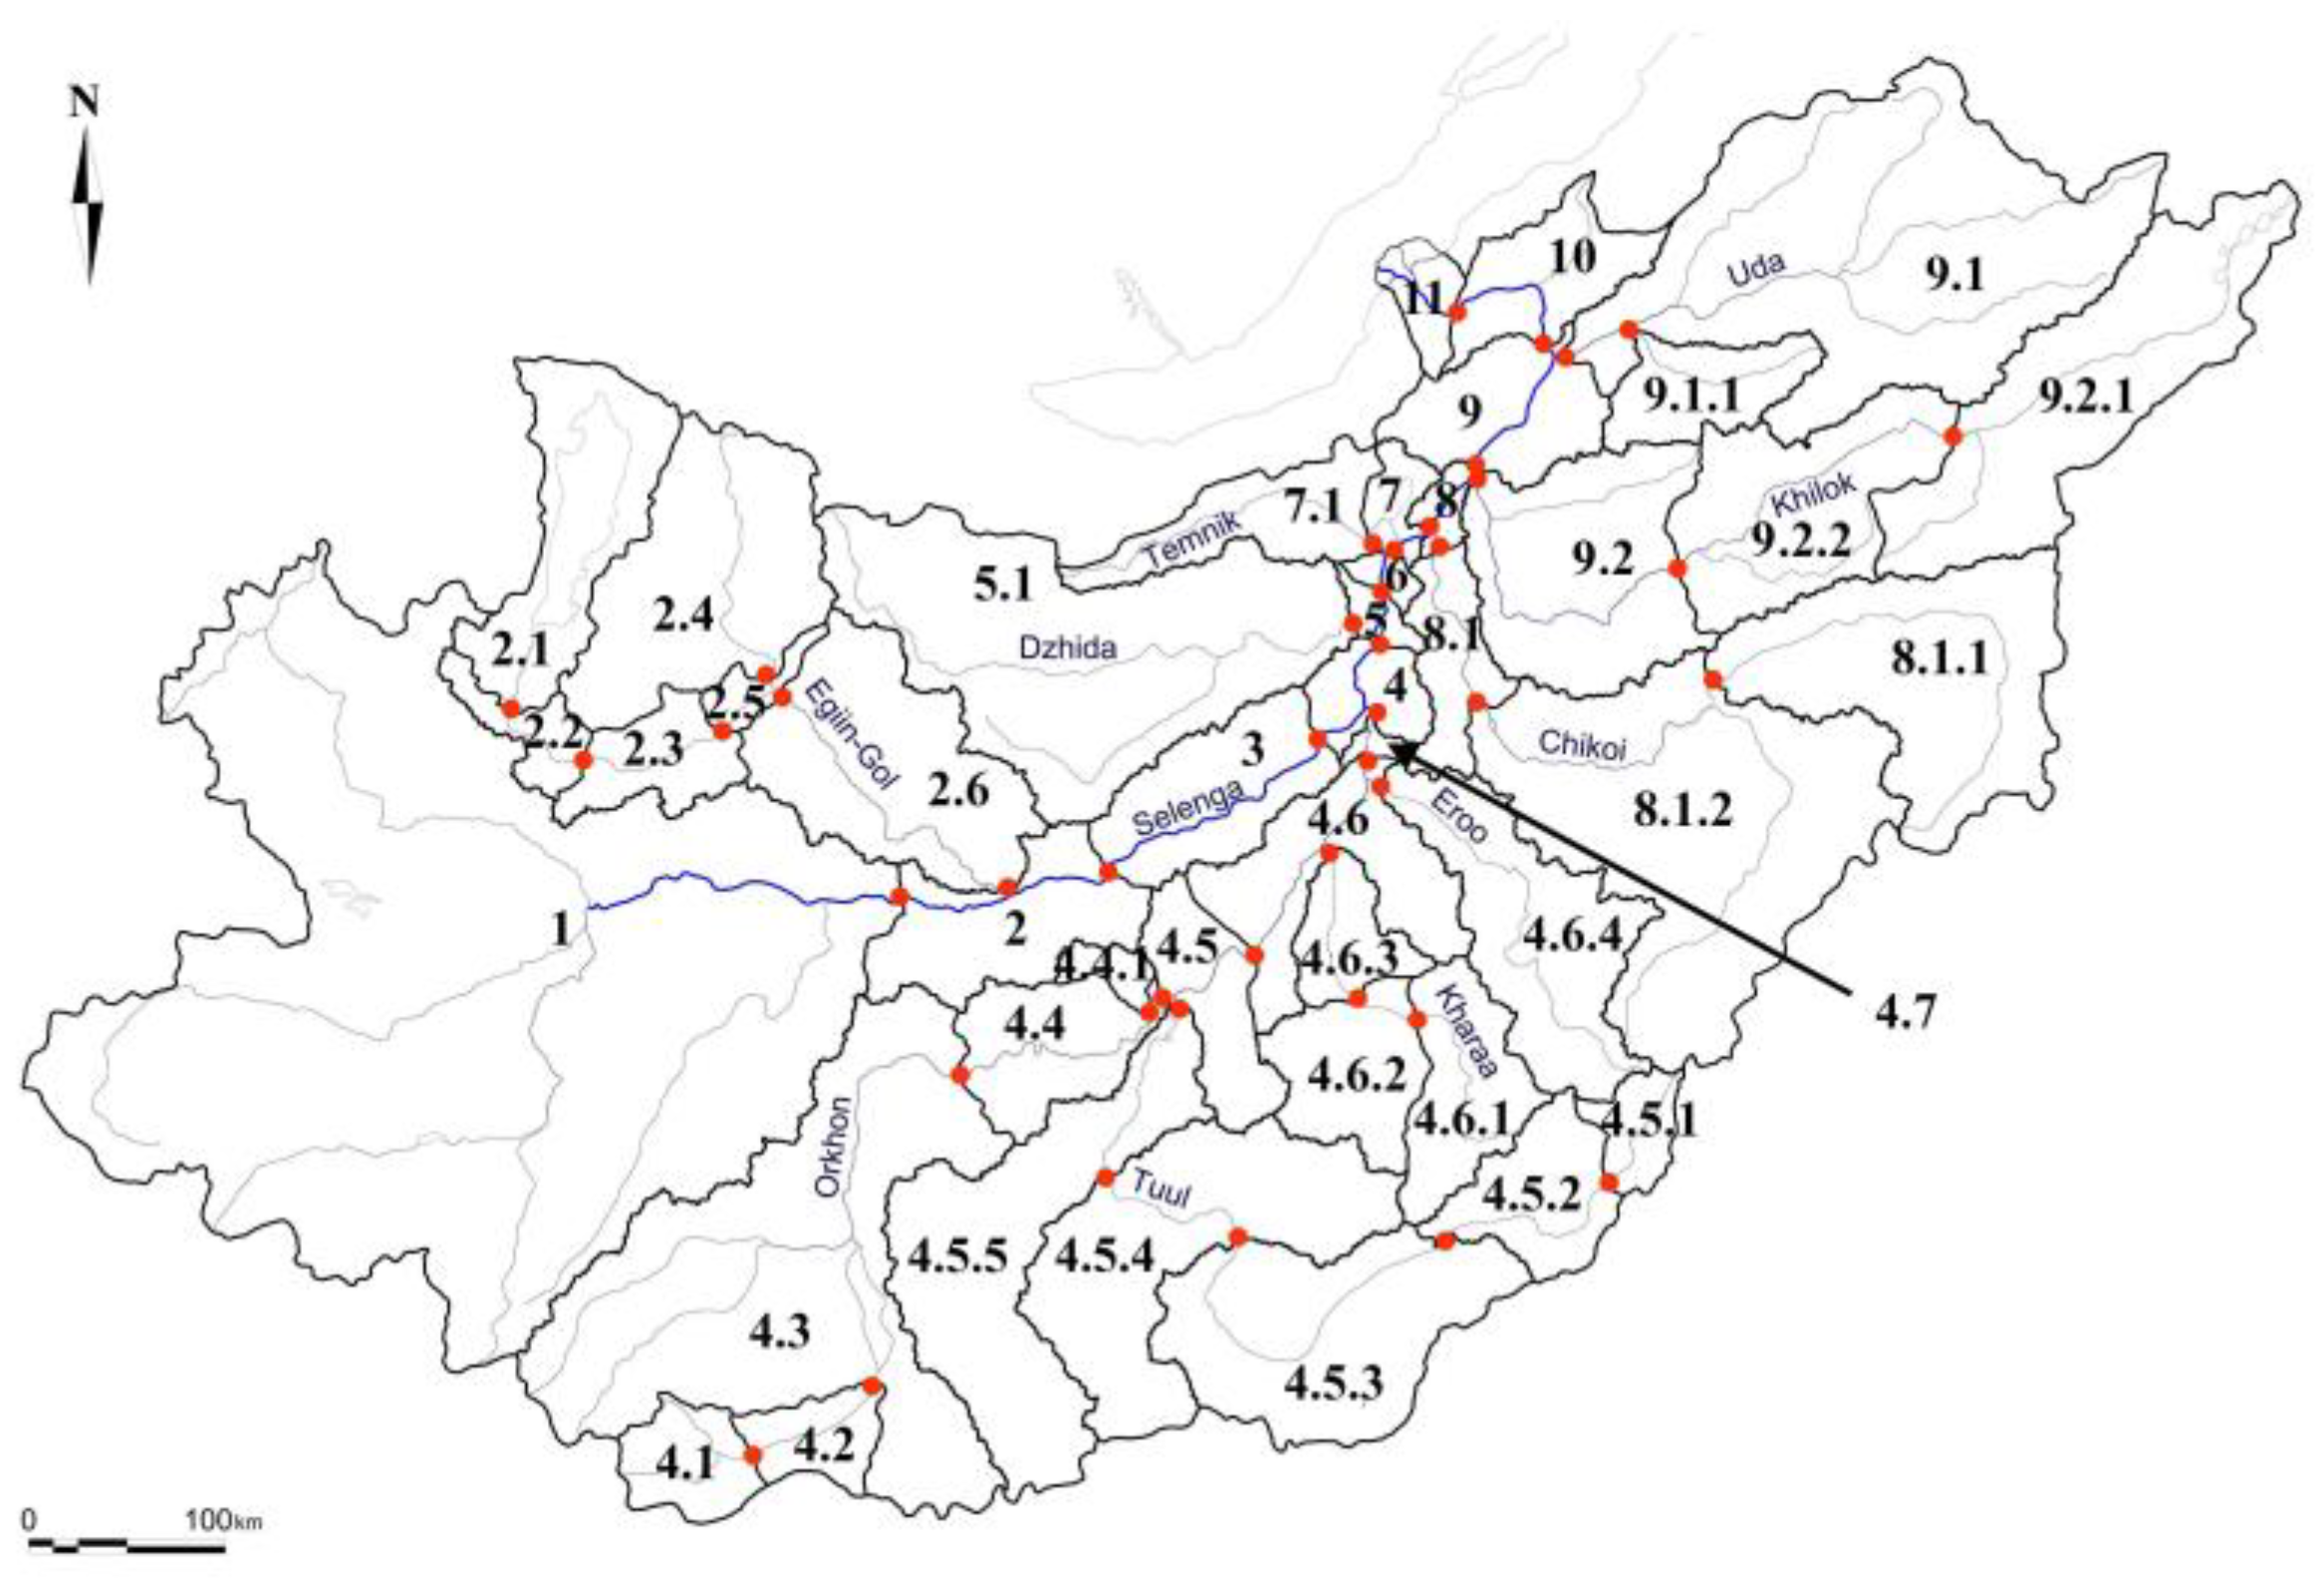
2.1. Study Area Description

The Selenga River is the largest tributary of Lake Baikal (Figure 1), contributing over 60% of the annual water inflow to the Lake. Selenga is formed from the convergence of the Ider and Muren rivers in Mongolia. The length of the river is 1024 km and the basin area is 447,000 km2, which is 82% of the basin area of Lake Baikal. About 67% of the basin area is located in Mongolia; however, more than half of the water runoff is formed in the Russian part of the watershed. Both the Mongolian and Russian parts of the Selenga watershed are characterized by long, cold winters lasting 4–5 months (November–March) and short, hot summers (June–August). The mean winter air temperatures are about −15 to −20 degrees Celsius (°C), and the mean summer air temperatures are about 20 to 25 °C.
The Mongolian part of watershed is characterized by an alternation between mountains covered mainly with larch forests and smoothed landforms that have the shape of plains covered with mountain steppe vegetation [39,40]. The main tributaries of the Selenga in Mongolia are the Tuul, Orkhon and Kharaa rivers. The average water discharges of those rivers into Selenga vary from 12 m3/s (Kharaa) to 120 m3/s (Orkhon) [41,42]. For comparison, the water discharge of the lower Selenga River is 1000 m3/s. In Russia, the Selenga flows through a mountainous region characterized by an alternation between ridges with elevations of 1300–1800 m a.s.l. covered mainly with pine and fir forests and intermountain depressions (550–1000 m a.s.l.) covered with steppe vegetation [37]. The main tributaries of the Selenga in Russian Federation are the Dzhida, Temnik, Chikoy, Khilok and Uda rivers. The average water discharges of tributaries into the Selenga River in Russia vary from 29 m3/s (Temnik) to 263 m3/s (Chikoi) [43,44].
The water in the Selenga River and its tributaries is low-mineralized (the sum of ions does not exceed 100 mg/L) and belongs to the bicarbonate class of the calcium group. That is due to the cold climate causing low evaporation and due to the wide distribution of acidic igneous rocks, such as granites, causing low weathering rates. Nevertheless, in the upper Selenga basin, carbonaceous rocks are also distributed. Carbonaceous rocks cause slightly higher mineralization and alkalinity of the water in the upper Selenga relative to its lower reach [16,45].

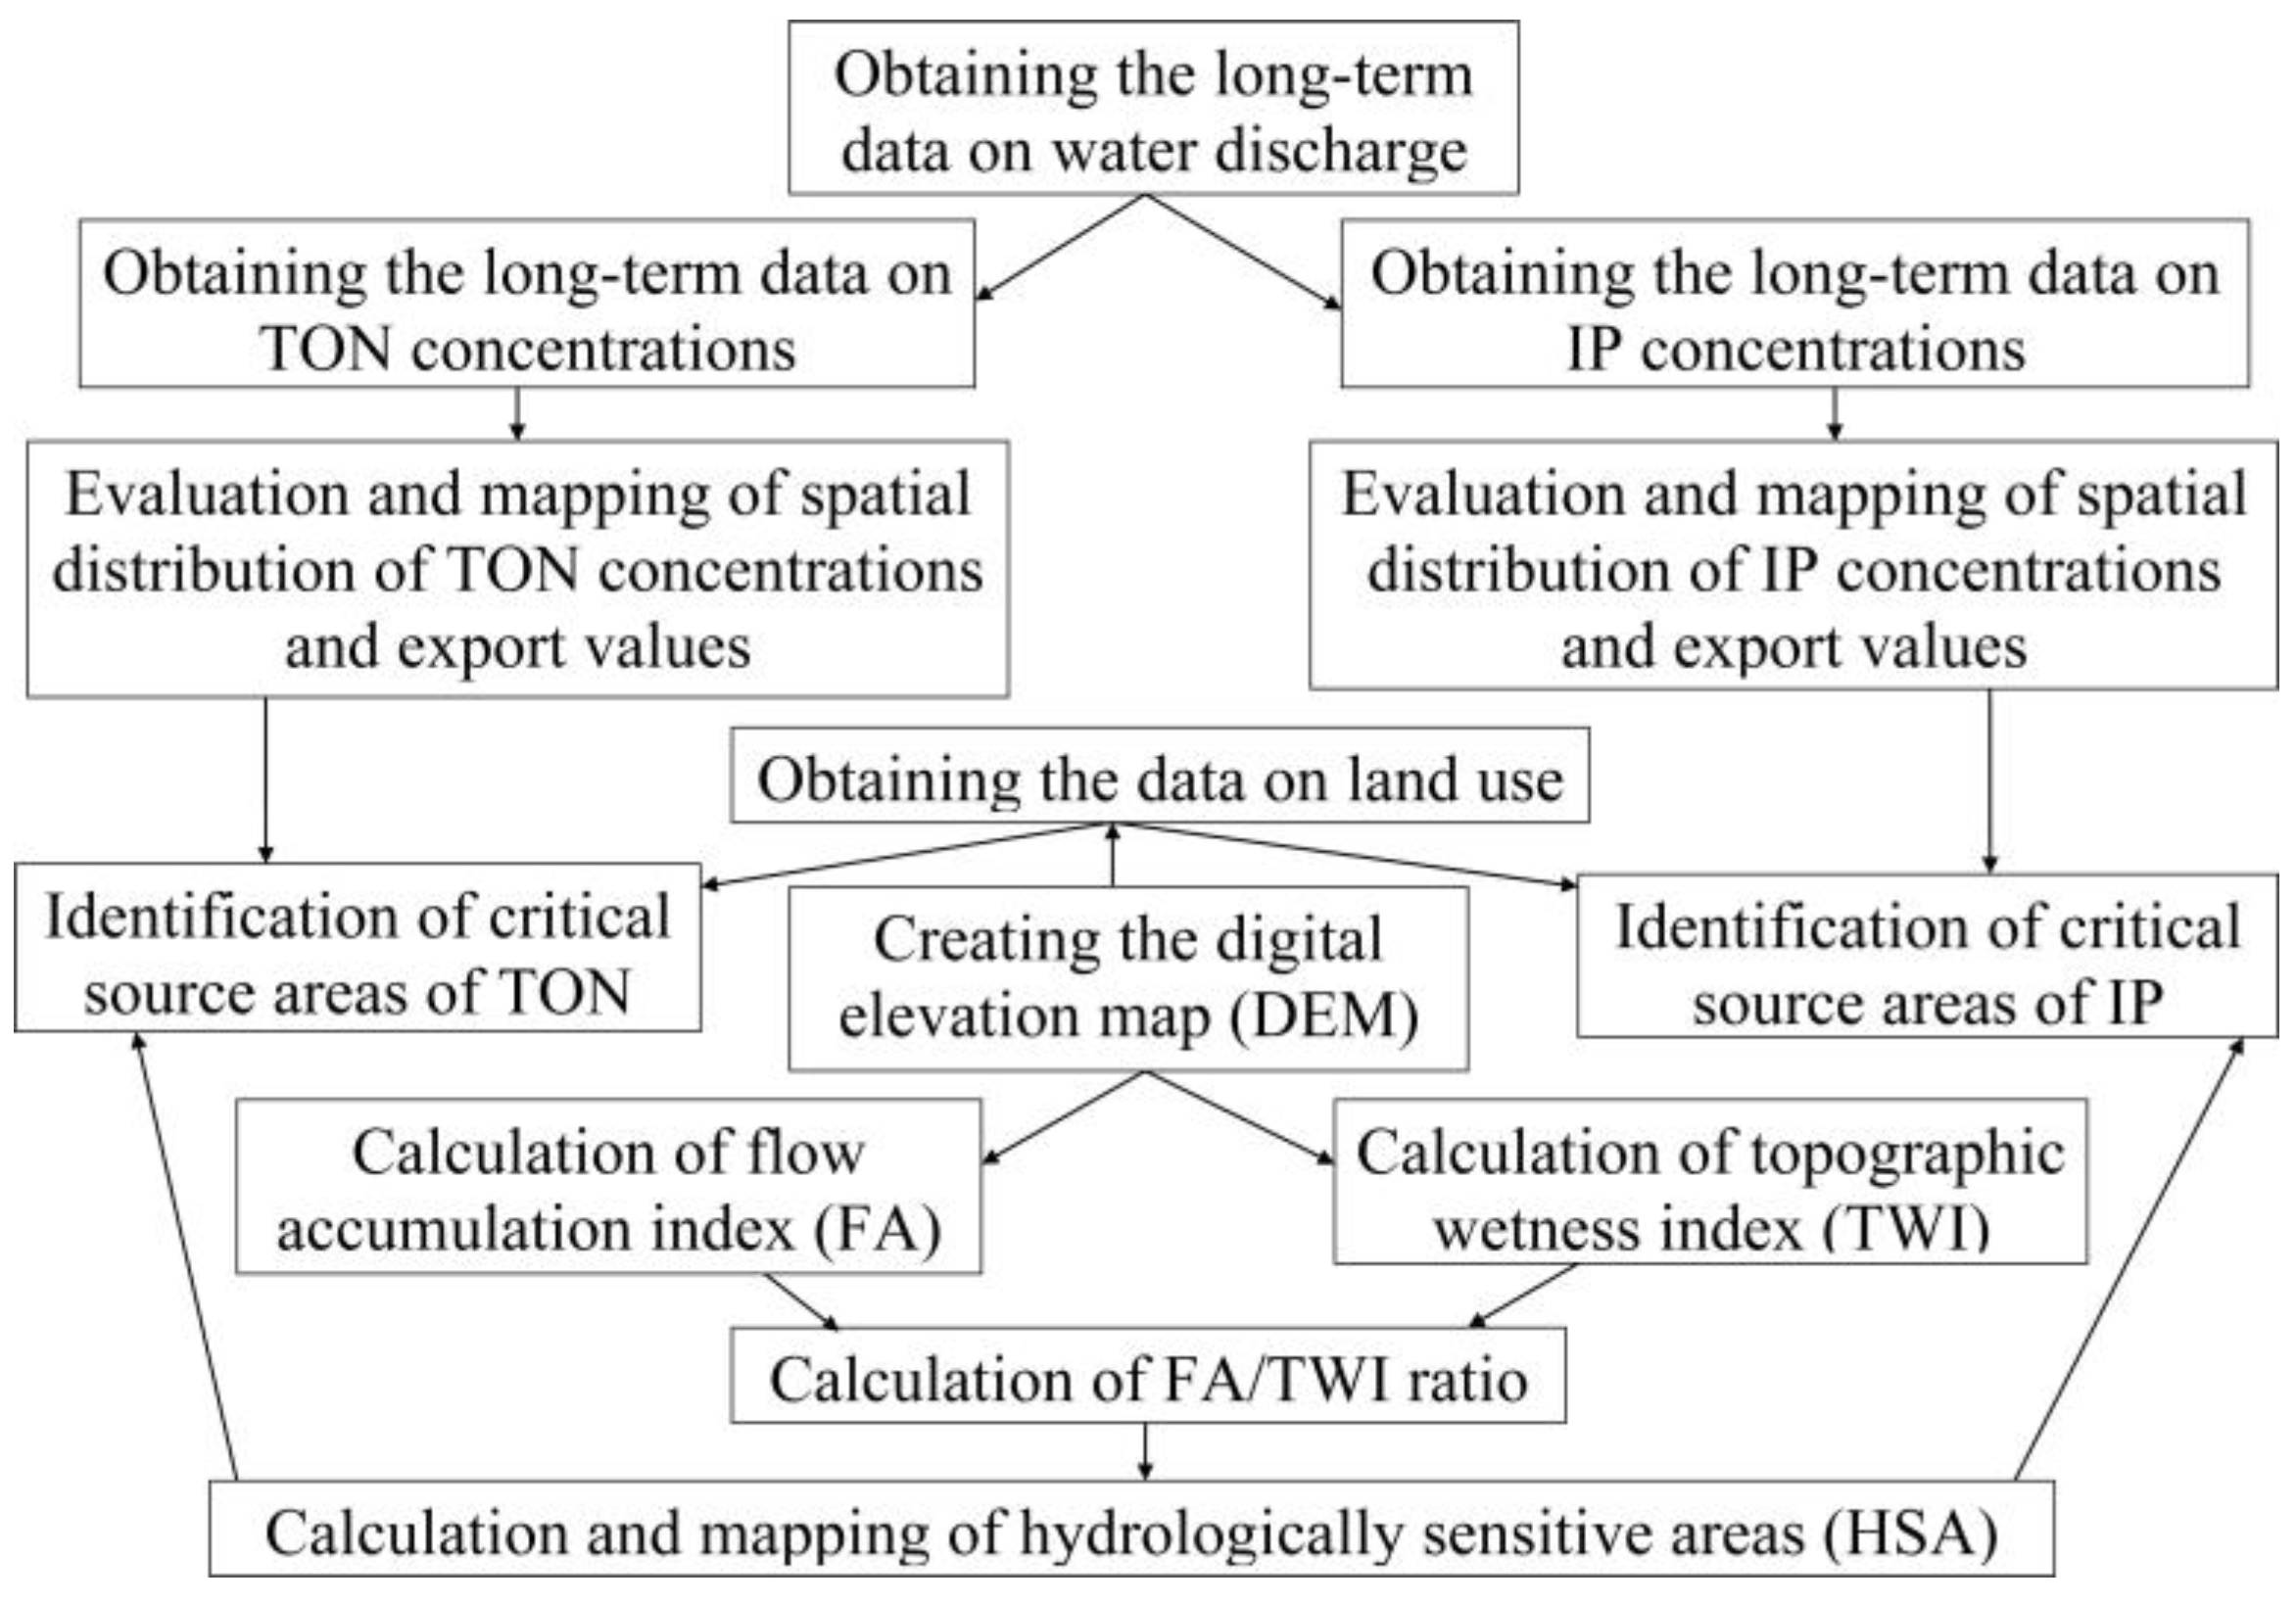
2.2. Research Design

The research design is presented in Figure 2.

2.3. Data Collection, Preparation and Assessment

There were three water chemistry datasets used in this study. The first one consisted of data from surface water chemistry in the Russian part of the Selenga River watershed collected by the authors in 2015, 2017 [16] and 2019. Water was sampled four times a year—in winter, spring, summer and autumn. Samples were collected in areas free of visible pollution sources at the center of the river stream. About 200 samples were collected in total. Water samples were preserved with H2SO4 and stored in high-density polyethylene bottles in refrigerator prior to analysis. Chemical analyses of nitrogen-containing compounds were performed in accordance with Russian State Standard 33045-2014 (analogous to ISO 6777:1984) [46]. The concentrations of NO3 were measured colorimetrically using sodium salicylate. Concentrations of nitrite ions (NO2) were also measured colorimetrically using Griess reagent. The detection limit (DL) for NO2 was 3 µg/L, whereas the DL for NO3 was 10 µg/L. The accuracy of nitrate and nitrite measurements were equal to 15% and 20%, respectively. The sum of the concentrations of NO3 and NO2 ions was used thereafter as concentration of total oxidized nitrogen (TON). Chemical analysis of phosphate (PO43−), also called inorganic phosphorus (IP), was performed in accordance with Russian State Standard 18309-2014 (analogous to ISO 6878:2004) [47]. Concentrations of PO43− were measured colorimetrically using the Denigès–Atkins method. The DL for PO43− was 10 µg/L and the error of phosphate measurement was equal to 30%.
The second dataset consisted of literature data on water chemistry in the Russian part of the Selenga watershed obtained during the period from 2002 to 2010 [14,43,44,48,49]. The sampling methods as well as chemical and instrument techniques used in the process of creating this dataset were identical to those used for creating the first dataset. The total number of samples in this dataset was about 400.
The third dataset consisted of literature-derived data on water chemistry in the Mongolian part of the Selenga watershed collected during the period from 2002 to 2015 [49,50,51,52,53,54]. Water samples were collected from the surface in polyethylene bottles. Samples were preserved with sulfuric acid and stored in the fridge. The total number of samples in this dataset was about 200. Unlike the previous two datasets, a certain number of samples in the third dataset were the averages of nutrient concentrations over several years [43,52,53]. The measurements of nitrite, nitrates and phosphates were performed using continuous flow analysis in accordance with national standards [55,56,57] based on international standards [58,59,60]. The DL for both nitrite and nitrate nitrogen was 3 µg/L and the DL for phosphate phosphorus was also 3 µg/L. The accuracy of N and P measurements using continuous flow analysis were not reported either by the authors of this dataset or by the authors of ISO 13395:1996 [59] and ISO 15681-2:2018 [60]. Thus, to avoid incorrect conclusions about differences in nutrient concentrations between Mongolian and Russian surface waters (that might arise from different accuracy of nutrient measurements), it is necessary to group them (in figures and tables) so that the difference between the minimum and maximum nutrient concentrations within the same group would be at least several times greater than the maximum possible accuracy value. Unfortunately, the “Mongolian” dataset contained only the data on spring and summer baseflow chemistry.
According to collected data on nutrient concentrations, 44 sub-watersheds (SWs) within the Selenga watershed were selected and mapped (Figure 3) using SAGA GIS 9.3.1 software [61]. The sub-watersheds were numbered from Selenga’s source to its mouth. Numbers consisting of one digit (1, 2, 3) were assigned to the Selenga sub-watersheds, numbers consisting of two digits (2.1, 2.2, 2.3 etc.) were assigned to the sub-watersheds of second-order tributaries, and numbers consisting of three digits (4.6.1, 4.6.2, 4.6.3 etc.) were assigned to the sub-watersheds of third-order tributaries.
To evaluate the nutrient export from selected sub-watersheds, their areas and the annual average volumes of water runoff from each sub-watershed (Figure 4) were calculated using satellite images and a map of annual runoff layer [62]. Data on annual average runoff volumes obtained for selected sub-watersheds using annual runoff layer were validated: the sum of runoff volumes from all sub-watersheds (36,072,900,000 m3/yr) was very close to runoff volume of Selenga River calculated using value of Selenga water discharge near Baikal (1000 m3/s) [63] and number of seconds in a year (31,536,000): 1000 × 31,536,000 = 31,536,000,000 m3/yr. The difference between the two values is 13%. Since the volumes of water runoff are rarely used in hydrological practice, to validate the obtained results they were also presented in the form of specific runoff values (Figure 5).
It was clear that annual nutrient export should be calculated using flow-weighted mean concentrations (FWMCs), because FWMCs reflect the interannual and intra-annual variability in both nutrient abundance and water discharge. Unfortunately, as was mentioned above, one of three datasets used in this study contained only the data on spring stormwater and summer baseflow chemistry. Since the duration of the period of baseflow is much longer than the duration of the period of snowmelt when meltwater is a predominant contributor to river runoff, it was decided to demonstrate the differences in nutrient export values among the different watershed parts on the basis of baseflow concentrations (BCs). Thus, it was necessary to assess the differences between nutrient export values calculated using BCs and those that could be calculated using FWMCs. For this purpose, the FWMCs were calculated for the Russian part of the Selenga watershed using long-term data on temporal variability of water discharge and nutrient concentrations [43]. It was established that BCs were 26–61% higher than respective FWMSs. Thus, it is quite possible that nutrient export values calculated for the whole watershed using BCs are also approximately 26–61% higher than real ones.

2.4. Nutrient Export Calculation

The TON and IP export values were evaluated on the basis of summer baseflow nutrient concentrations and annual average runoff volumes [16,17]:
Nutrient export, kg/km2/yr = (C2Q2 − C1Q1)/(S2 − S1)/1,000,000,
where: C1, C2—nutrient concentration; μg/L in upstream and downstream stations, respectively;
Q1, Q2—runoff volumes, m3, in upstream and downstream stations, respectively;
S1, S2—areas, km2, of upstream and downstream sub-watersheds, respectively;
1,000,000—coefficient used for converting micrograms in cubic meters per square kilometer per year (μg·m3/km2/yr) into kilograms per square kilometer per year (kg/km2/yr).
Negative nutrient export values resulted from both low nutrient discharges from sub-watersheds and high nutrient assimilation in streams being set to zero.

2.5. Mapping Procedures

First of all, a digital elevation map (DEM) was created as a basis for all the digital maps that were planned to be produced during this study. DEM was built using SAGA GIS software [61] on the basis of advanced land-observing satellite data with a 30 m spatial resolution (ALOS 210 World 3D-30 m dataset). To reduce the errors, the DEM was converted into a WGS 84 211 UTM Zone 48N projection.
To create 1:100,000 scale maps of nutrient concentrations and runoff, the corresponding map layers were created in QGIS on the basis of combinations of b4/b3/b2 and b7/b6/b5/b4 channels (obtained from the Sentinel-2 satellite) [64]. To map nutrient concentrations and water runoff layers, a qualitative background method was used. Vector layer-containing sub-watershed boundaries were edited in the QGIS program. Numerical values of pre-calculated parameters, such as flow volume, chemical element concentrations, etc., were assigned to each sub-watershed in the attribute table. Then, the field of distributed values was assessed and mapping ranges and their colors were selected using the “Style manager” menu.
To identify areas of runoff generation, the values of the topographical wetness index (TWI) and flow accumulation index (FA) were calculated on the basis of improved DEM. The TWI values were computed as follows [30]:
TWI = ln (α/tan β),
where α is the upslope-contributing area per unit contour length (m) and β is the local surface topographic slope.
FA values were computed as the cumulative weight of the upslope raster cells flowing into each downslope cell. After TWI and FA calculations, FA/TWI ratio values were calculated and mapped. Map contours characterized by certain diapason of FA/TWI values were then considered as hydrologically sensitive areas (HSAs). To reveal the origin of nutrients in watershed areas characterized by high TON and IP export values and to identify CSAs, a map of land use was created. To create this map, the open data on the distribution of industrial objects in the Selenga River basin, topographic maps and Sentinel-2 satellite synthetic images [64] were used. To identify critical source areas (CSAs), the HSA map was superimposed on the land use map. The parts of the HSAs that were bounded by the borders of contours of selected land use types were then considered as CSAs

3. Results and Discussion

3.1. Spatial Distribution of TON Concentrations

It was found that the spatial variability of TON concentrations in the study territory (Figure 6, Table 1) was quite high (it should be noted that the terms “high”, “medium” and “low” are based on concentration ranges obtained during this study). It was observed that TON concentrations in the surface waters of the Mongolian part of the Selenga watershed [49,50,51] were much higher than those in waters from the Russian part. This was probably due to lower precipitation and, consequently, lower river runoff in Mongolia (Figure 4). The highest values (up to 700 µg/L) were measured by Batbayar et al. [50] in water from the middle reaches of the Tuul River near the Zamaar (Figure 7) gold mine (SW 4.5.4) [65,66] and in water from the left tributary of the Orkhon River downstream from Erdenet city (SW 4.4.1), where the world’s fourth largest molybdenum–copper mine is located [50,67].
High values (100–200 µg/L) were measured in the surface waters of both the Russian [14,16,43,48] and Mongolian [49,50,51] parts of the watershed. Similar TON concentrations in waters from spatially separated locations, such as the upper (SW 1) and middle (SWs 2 and 3) reaches of the Selenga and the upper reaches of the Orkhon (SWs 4.1 and 4.2), Tuul (SWs 4.5.3, 4.5.2, 4.5.1) and Uda (SWs 9.1 and 9.1.1) rivers, indicated similar mechanisms of formation of the chemical composition of the water. Taking into account the high population densities in most of the sub-watersheds, it seems that the high TON concentrations in their surface waters were caused largely by human impact rather than natural factors. However, the population density in sub-watershed 1 is low, thus the high waterborne nitrogen concentrations in this area are probably due to high amounts of atmospheric deposition of nitrogen.
Medium concentrations of TON (50–100 µg/L) were characteristic for waters from the Dzhida River (SW 5), middle reaches of Orkhon River (SW 4.5.5), upper and middle reaches of Kharaa River (SW 4.62 and 4.6.3), and the upper reaches of rivers Chikoi (SWs 8.1.1 and 8.1.2) and Khilok (SW 8.2.2). As in the previous case, similar TON concentrations in waters from spatially separated locations indicated similar conditions for the formation of water chemistry. However, unlike the high TON concentrations in water, medium TON concentrations seem to be largely caused by natural factors rather than anthropogenic ones.
The lowest TON concentrations were characteristic of the middle reaches of the Egiin Gol River (SW 2.5) and the Eroo River (SW 4.6.4), and the lower reaches of the Chikoi (SW 8.1), Uda (SW 9.1.1) and Selenga (SWs 9, 10, 11) rivers. Low concentrations of oxidized nitrogen in the lower reaches of the Selenga were definitely due to high water discharges in downstream river sections. Low N concentrations in the lower reaches of rivers could also be due to the wide distribution of wetlands in those areas. Wetlands often act as sinks for N and prevent surface waters from being polluted by nitrogen [68,69].

3.2. Spatial Distribution of IP Concentrations

Concentrations of IP in the waters of the Selenga River and its tributaries ranged from 0.25 µg/L to 159 µg/L (Table 1). Unlike nitrogen, the spatial distribution of IP concentrations was quite uniform (Figure 8). As in the case of TON, concentrations of IP in the surface waters of the Mongolian part of the Selenga watershed were higher than those in waters of the Russian part. This was probably due to both higher concentrations of suspended sediments in Mongolian rivers and lower precipitation [41,62]. The highest IP concentrations (>100 µg/L) were also characteristic of water from the middle reaches of the Tuul River near the Zamaar gold mine (SW 4.5.4) [70] and for water from the left tributary of the Orkhon River downstream from Erdenet city (SW 4.4.1). The anthropogenic origin of phosphorus in those areas is beyond doubt.
High phosphorus concentrations (50–100 µg/L) were characteristic of the middle reaches of the Orkhon River (SW 4.4). High concentrations of IP in the surface waters of this sub-watershed were probably due to soil degradation [71] as a result of intense agricultural activities such as crop production and livestock grazing. Thus, high IP concentrations were solely of anthropogenic origin.
Medium IP concentrations (10–50 µg/L) in water were characteristic of the whole of southern Mongolia (SWs 1, 2, 4.1, 4.2, 4.3, 4.4, 4.4.1, 4.5, 4.5.2, 4.5.3, 4.5.4, 4.5.5, 4.6, 4.6.1, 4.6.2, 4.6.3, 4.7), for the lower reaches of the Chikoi River (SW 8.1) and for the watershed of the Khilok River (SWs 8.2.1, 8.2.2, 8.2). Taking into account that the livestock sector accounts for nearly 83 percent of agricultural products in Mongolia, phosphorus pollution of surface waters in such a large territory due to grazing-induced soil organic matter decomposition may also be possible. Elevated rates of IP export from sub-watersheds in the Russian part of the Selenga watershed can be explained by P fertilization of soils.
Low IP concentrations (1–10 µg/L) were characteristic of waters in almost all of the Russian part of the Selenga watershed (SWs 5.1, 7, 7.1, 8.1.1, 8.1.2, 9, 9.1. 9.1.1, 10 and 11). Low values were probably due to the wide distribution of forests that protect soil from erosion and due to high river runoff in this area. It is known that the average annual water discharge of the Selenga River near the Mongolia–Russia border is 310 m³/s, whereas at the distance of 127 km from the Selenga mouth, the water discharge is 1000 m³/s [43,63]. Phosphate uptake by aquatic vegetation in the wetlands of the lower Selenga basin can, to some extent, also be the reason for low P concentrations in riverine water.
The lowest IP concentrations (<1 µg/L) were characteristic of the Egiin Gol river in northern Mongolia (SWs 2.2, 2.3, 2.4, 2.5 and 2.6) and for the upper reaches of the Orkhon River (SW 4.2) in southern Mongolia. Such low IP concentrations in northern Mongolia were unexpected considering the widespread distribution of phosphorite deposits in the Hovsgol [72,73] province where sub-watersheds 2.2, 2.3, 2.4, 2.5 and 2.6 are located. This was probably due to low weathering rates due to the low air temperatures in the Eastern Sayan mountains. Low IP concentrations in the upper Orkhon River were probably due to a low water vapor content in the atmosphere near the Gobi Desert and, consequently, low precipitation which transports P from soils to surface waters.

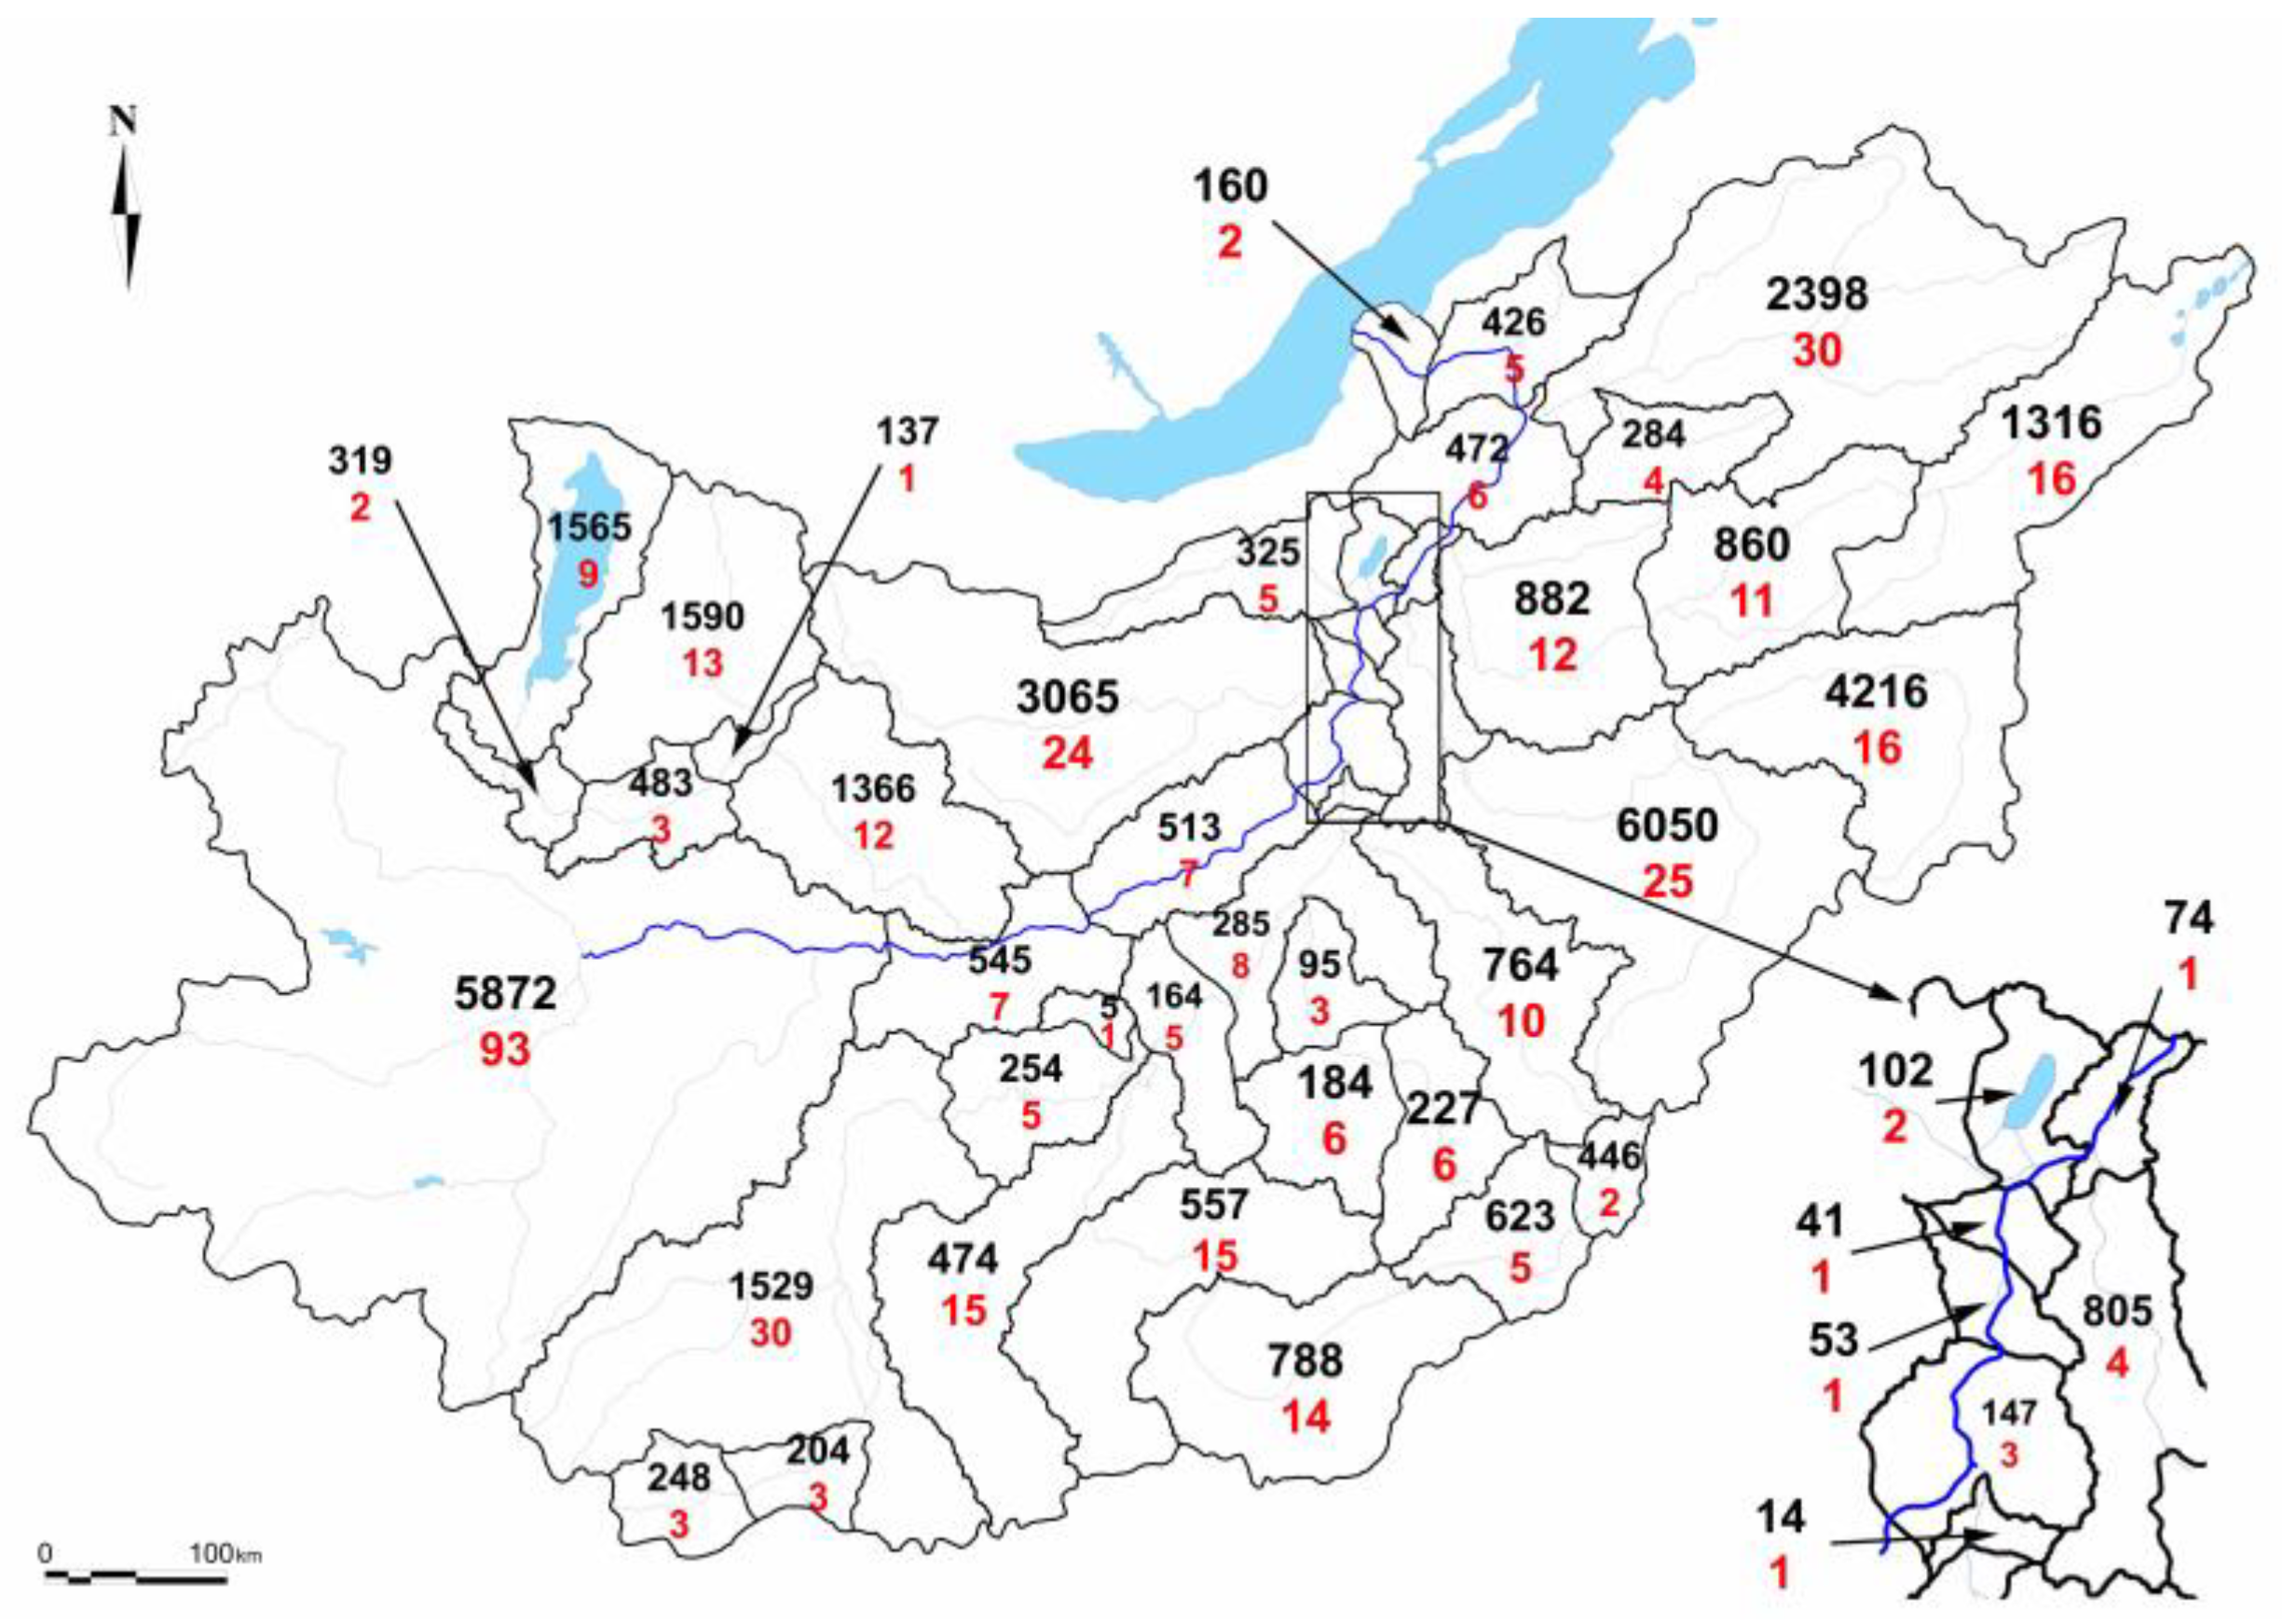
3.3. Spatial Distribution of TON Export

The values obtained for TON exports were in the range 0–1000 kg/km2/yr; however, the values calculated for 90% of territory under study were in the range 0–50 kg/km2/yr (Table 2). These values are close to the values of dissolved inorganic nitrogen (DIN) export modelled by Mayorga et al., 2010 [74] for the same territory, but much lower than modelled global median values (500–1000 kg/km2/yr) [74]. The comparison between TON and DIN is quite fair because TON’s contribution to DIN in the surface waters of the Selenga basin is 80% on average [43].
Spatial distribution of TON export values (Figure 9) roughly followed the spatial distribution of specific runoff values (Figure 5): high values were characteristic of highlands, whereas low values were characteristic of lowlands. However, in some areas nitrogen export rates could not be solely explained in terms of climate factors. Anthropogenic activities and some geological conditions also affected the TON exports. In particular, the highest value of TON export (up to 600 kg/km2/yr) was observed for Selenga sub-watershed number 9.
Such an extremely high nutrient load was probably due to both the wide distribution of highly permeable sandy soils (arenosols and regosols) contributing to the rapid inflow of atmospheric precipitation rich in TON to groundwaters and then to surface waters, and high anthropogenic pressure on this sub-watershed. The main source of pollution in this area is Ulan-Ude city located at the Selenga’s confluence with the Uda River. Ulan-Ude is the largest city in the Selenga watershed and home to almost 500,000 people. There are numerous small anthropogenic sources in Ulan-Ude urban agglomeration [75], thus the nitrogen pollution of surface waters from both point and nonpoint sources is quite possible. The impact of N emission from the State District Power Plant (SDPP) located on the Gusinoye lake shore, windward of sub-watershed 9, is also possible. Each year SDPP emits tons of nitrogen oxides, part of which can be scoured to the Earth’s surface by precipitation and then washed into rivers. Finally, the highly polluted Khilok River flowing into Selenga upstream of Ulan-Ude city also contributes to TON pollution in this sub-watershed.
High values of TON export (up to 500 kg/km2/yr) were also observed for sub-watershed 8 located upstream of SW 9, and sub-watersheds 10 and 11 located downstream of SW9. Surface waters in sub-watershed 8 were probably impacted by N emission from SDPP and by poorly treated municipal wastewater from Gusinoozersk city. Rural sub-watersheds 10 and 11 are characterized by a high population density, thus the waterborne nitrogen in their surface waters probably originated from both agricultural runoff and untreated sewage.
The medium values of TON export observed for the upper reach of the Tuul River near Ulanbaatar City (SW 4.5.2) [53] and near the Zamaar gold mine (SW 4.5.4) were also due to anthropogenic pollution. The calculated rates of TON export from those sub-watersheds ranged from 10 to 50 kg/km2/yr. Similar rates of TON export were also observed for the middle reaches of the Selenga River (SWs 2 and 11), for the upper and middle reaches of the Orkhon river (SWs4.2, 4.4 and 4.5) and for the watersheds of rivers Chikoi (SWs 8.1.1 and 8.1.2) and Uda (SW 9.1). Unlike sub-watersheds 4.5.2 and 4.5.4, the fairly high N export from those areas seemed to be more due to the high N content in steppe and mountain taiga soils than due to anthropogenic pollution. Under non-disturbed conditions nitrate mobility is high because water evaporation is low and nitrate in solution leaches to deeper soil layers [76]. However, the impact of anthropogenic activities on the levels of nitrogen in water could also be high. It is known, for example, that there are many wastewater treatment plants, gold mines and mineral processing facilities in the upper reaches of the Chikoi River that contribute to nutrient pollution in this river.
Low TON export values (1–10 kg/km2/yr) were observed for the upper reaches of the Selenga (SW 1), Egiin Gol (SW 2.4), Tuul (SWs 4.5.1, 4.5.3) and Temnik (SWs 8.2.1, 8.2.2) rivers. Those values probably represented background levels of water pollution from TON due to background levels of air pollution, a medium level of atmospheric precipitation and a medium N content in soils of the non-disturbed ecosystems which are dominant in North Mongolia.
The lowest (down to 0 kg/km2/year) rates of TON export calculated for the middle reaches of the Selenga River (SWs 3, 4, 5 and 6), Kharaa River (SWs 4.6.1, 4.6,3), Eroo River (SW 4.6.4), the lower reaches of the Uda River (SW 9.1.1) and the middle reaches of the Egiin Gol River (SW 2.5) were due to low precipitation and low N accumulation in the disturbed urban soils and arable lands which dominate those areas.

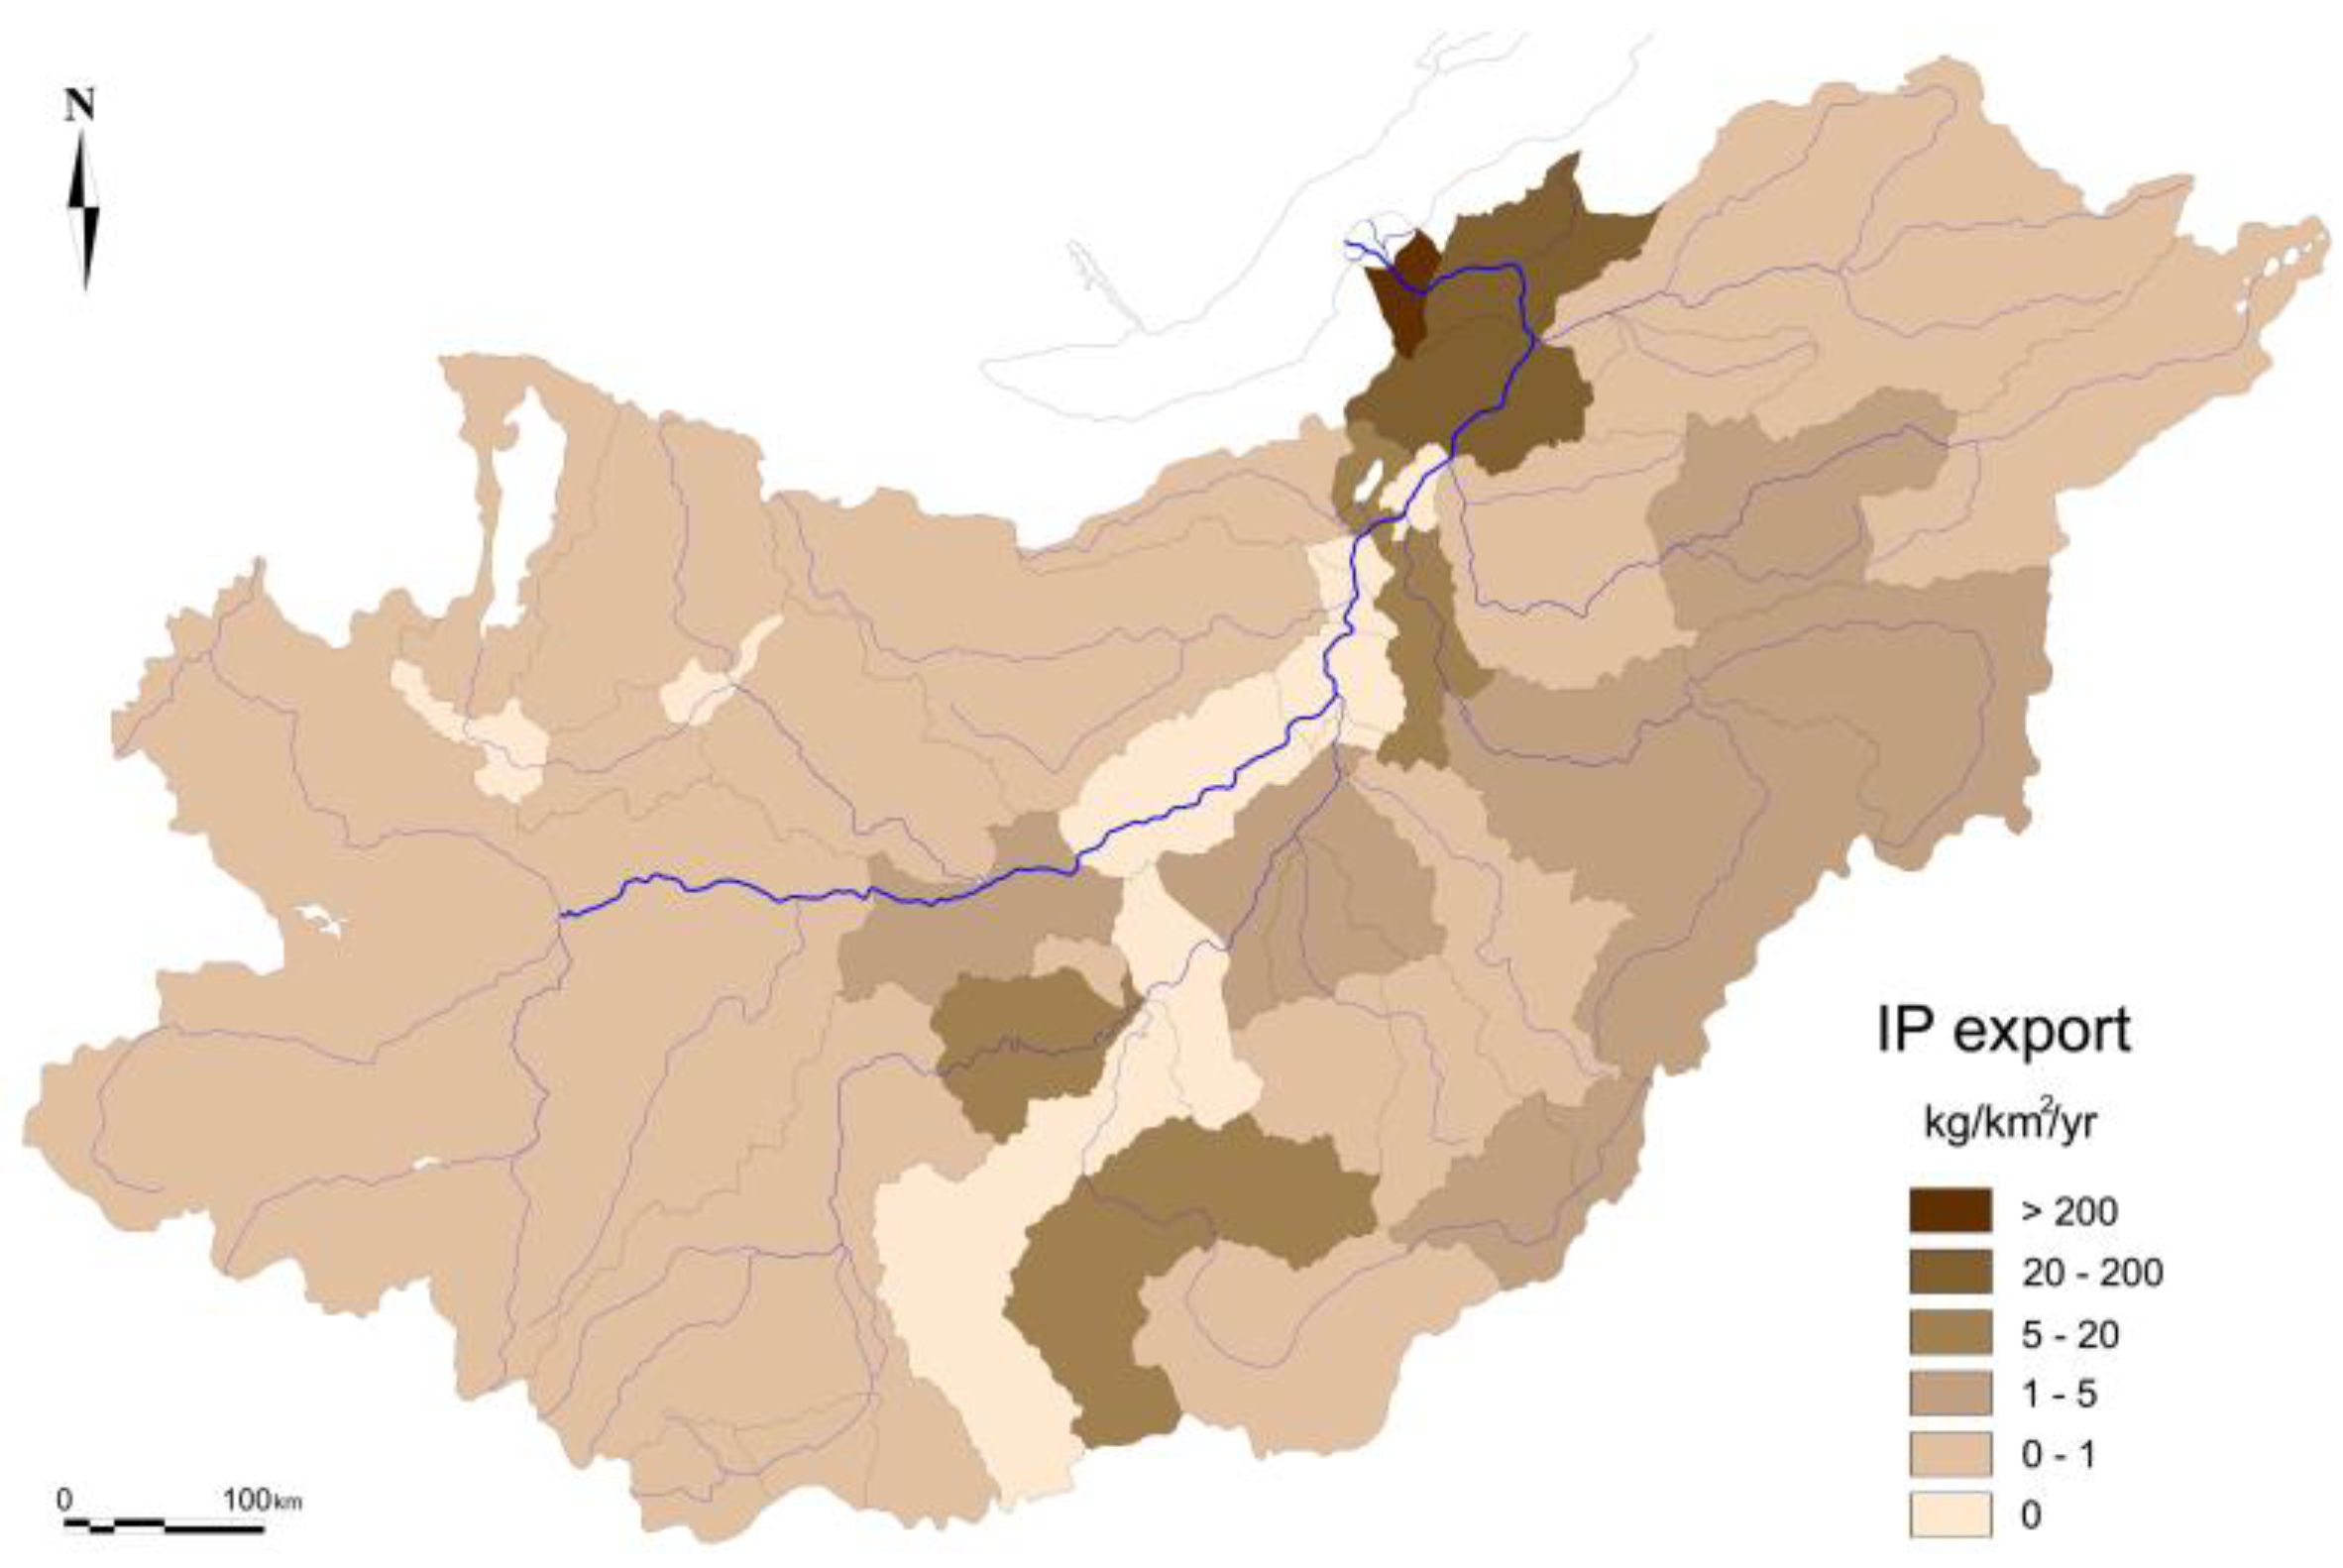
3.4. Spatial Distribution of IP Export

The obtained values of IP export were in the range 0–223 kg/km2/yr, but the values calculated for most of the basin were in the range 0–5 kg/km2/yr (Figure 10, Table 3).
The values we obtained were quite similar to those calculated by Hofmann et al. for the Kharaa River Basin [54] and to global median values (2–10 kg/km2/yr) modelled by Harrison et al. [77]. At the same time, obtained values were almost two times higher than those modelled for East Siberia by Harrison et al., 2010 [77]. The differences between P export values obtained during this study and those modelled by Harrison et al. may be due to different study approaches used in these two studies. In the present study, the phosphorus export from the watershed was estimated by means of a simple mass balance approach using the differences in P concentrations and water discharges between two adjacent river sections. The results obtained using this approach may be underestimated due to P assimilation in the river channel. The NEWS-DIP model applied by Harrison et al. is based on using the global data on the phosphorus-supplying capacities of point and non-point P sources. This method of estimating phosphorus loadings does not account for P assimilation in the riverine water and may overestimate the real export values.
Due to the predominantly anthropogenic origin of phosphorus, the spatial distribution of IP export was poorly influenced by the spatial distribution of specific runoff values. Since the highest rates of IP export were calculated for rural watersheds 10 and 11 (113 and 223 kg/km2/yr, respectively), characterized by high agricultural activity [78], it can be concluded that the main anthropogenic sources of phosphorus in these areas are fertilizers or animal wastes. Nevertheless, it must be considered that a significant proportion of the phosphorus compounds in soils of the lower Selenga basin (including the delta) was accumulated due to sedimentation of suspended solids delivered by riverine waters [79,80].
Relatively high values of IP export (5–20 kg/km2/yr) to surface waters were also calculated for the upper reaches of the Selenga River (SW 7), the upper and middle reaches of the Orkhon River (SWs4.4 and 4.6), the middle reach of the Tuul River (SW 4.5.4), and the lower reaches of the Kharaa (SW 4.6.3) and Chikoi (SW 8.1) rivers. All these sub-watersheds, except SW 4.5.4, are characterized by a high population growth rate (>108%) and by a high proportion of arable lands [62,81], thus the agricultural origin of phosphorus in these areas is beyond doubt [37,73,82]. This is especially true for sub-watersheds 4.4 and 4.6 which are characterized by highly fertile soils (such as chernozems and mollisols) as well as by a high density of livestock [37,83]. Mining activities in the Boroo and Kharaa river basins [84,85] may also contribute to the P pollution of surface waters. High values of IP export to surface waters in sub-watershed 4.5.4 were probably due to mining activity in the Zamaar gold field.
Medium IP export values (1–5 kg/km2/yr) were characteristic of the upper reaches of the Selenga (SW 2), Tuul (SWs 4.5.1 and 4.5.2) and Chikoi (SWs 8.1.1 and 8.1.2) rivers as well as for the middle reaches of the Orkhon (SW 4.6), Kharaa (SW 4.6.2) and Khilok (SW 8.2.2) rivers. As in the case of nitrogen, medium values of P export could be due to natural soil/ecosystem properties as well as due to anthropogenic pollution. In the upper reaches of the Selenga River (SW 2) and the middle reaches of the Orkhon River (including the upper Kharaa River basin) medium values of P export were influenced by both wide a distribution of highly P-saturated soils such as Chernozens and Leptic Chernozems [37,86] and livestock grazing. In the upper reaches of the Tuul, Chikoi and Khilok rivers, IP export was mostly influenced by anthropogenic pollution: the Tuul river basin was definitely polluted by numerous sources of agglomeration located in Ulaanbaatar, whereas the Chikoi and partly Khilok river basins were affected by mining activities.
Despite the high values of IP export observed for some watershed areas, most of the Selenga watershed was characterized by low (0–1 kg/km2/yr) values of IP loading. Territories characterized by low IP export values included the basins of the Egiin Gol (SWs 2.2, 2.3, 2.4, 2.6), Dzhida (SW 5.1), Temnik (SW 7), Eroo (SW 4.6.4) and Uda (SW 9.1) rivers. Also, low values of IP export were characteristic of significant areas of the Orkhon (SWs 4.1, 4.2 and 4.3) and Khilok (SWs 8.2 and 8.2.1) river basins. Low export values probably represented background level of water pollution by IP, influenced by the wide distribution of forests that prevent soil erosion and by the absence of P fertilization of soil.
Extremely low (down to 0 kg/km2/yr) rates of IP export to surface waters were calculated for sub-watersheds 4.5.5, 4.5, 3, 4, 5, 6, 8. These areas were also characterized by the lowest values of specific runoff (Figure 4). This probably means that phosphorus export to surface waters in these areas is restricted by low atmospheric precipitation. Extremely low rates of IP export were also calculated for the watersheds of the Egiin Gol (SW 2.2) and Uul Nuer (SW 2.5) rivers. It is possible that this was due to the low rate of dissolution of phosphorites in weakly acid and weakly alkaline solutions of mollic leptosols, mollic umbrisols and leptic calcisols that dominated in the soil cover of that area [37,86,87]. A low annual air temperature in the highlands also slowed down weathering.

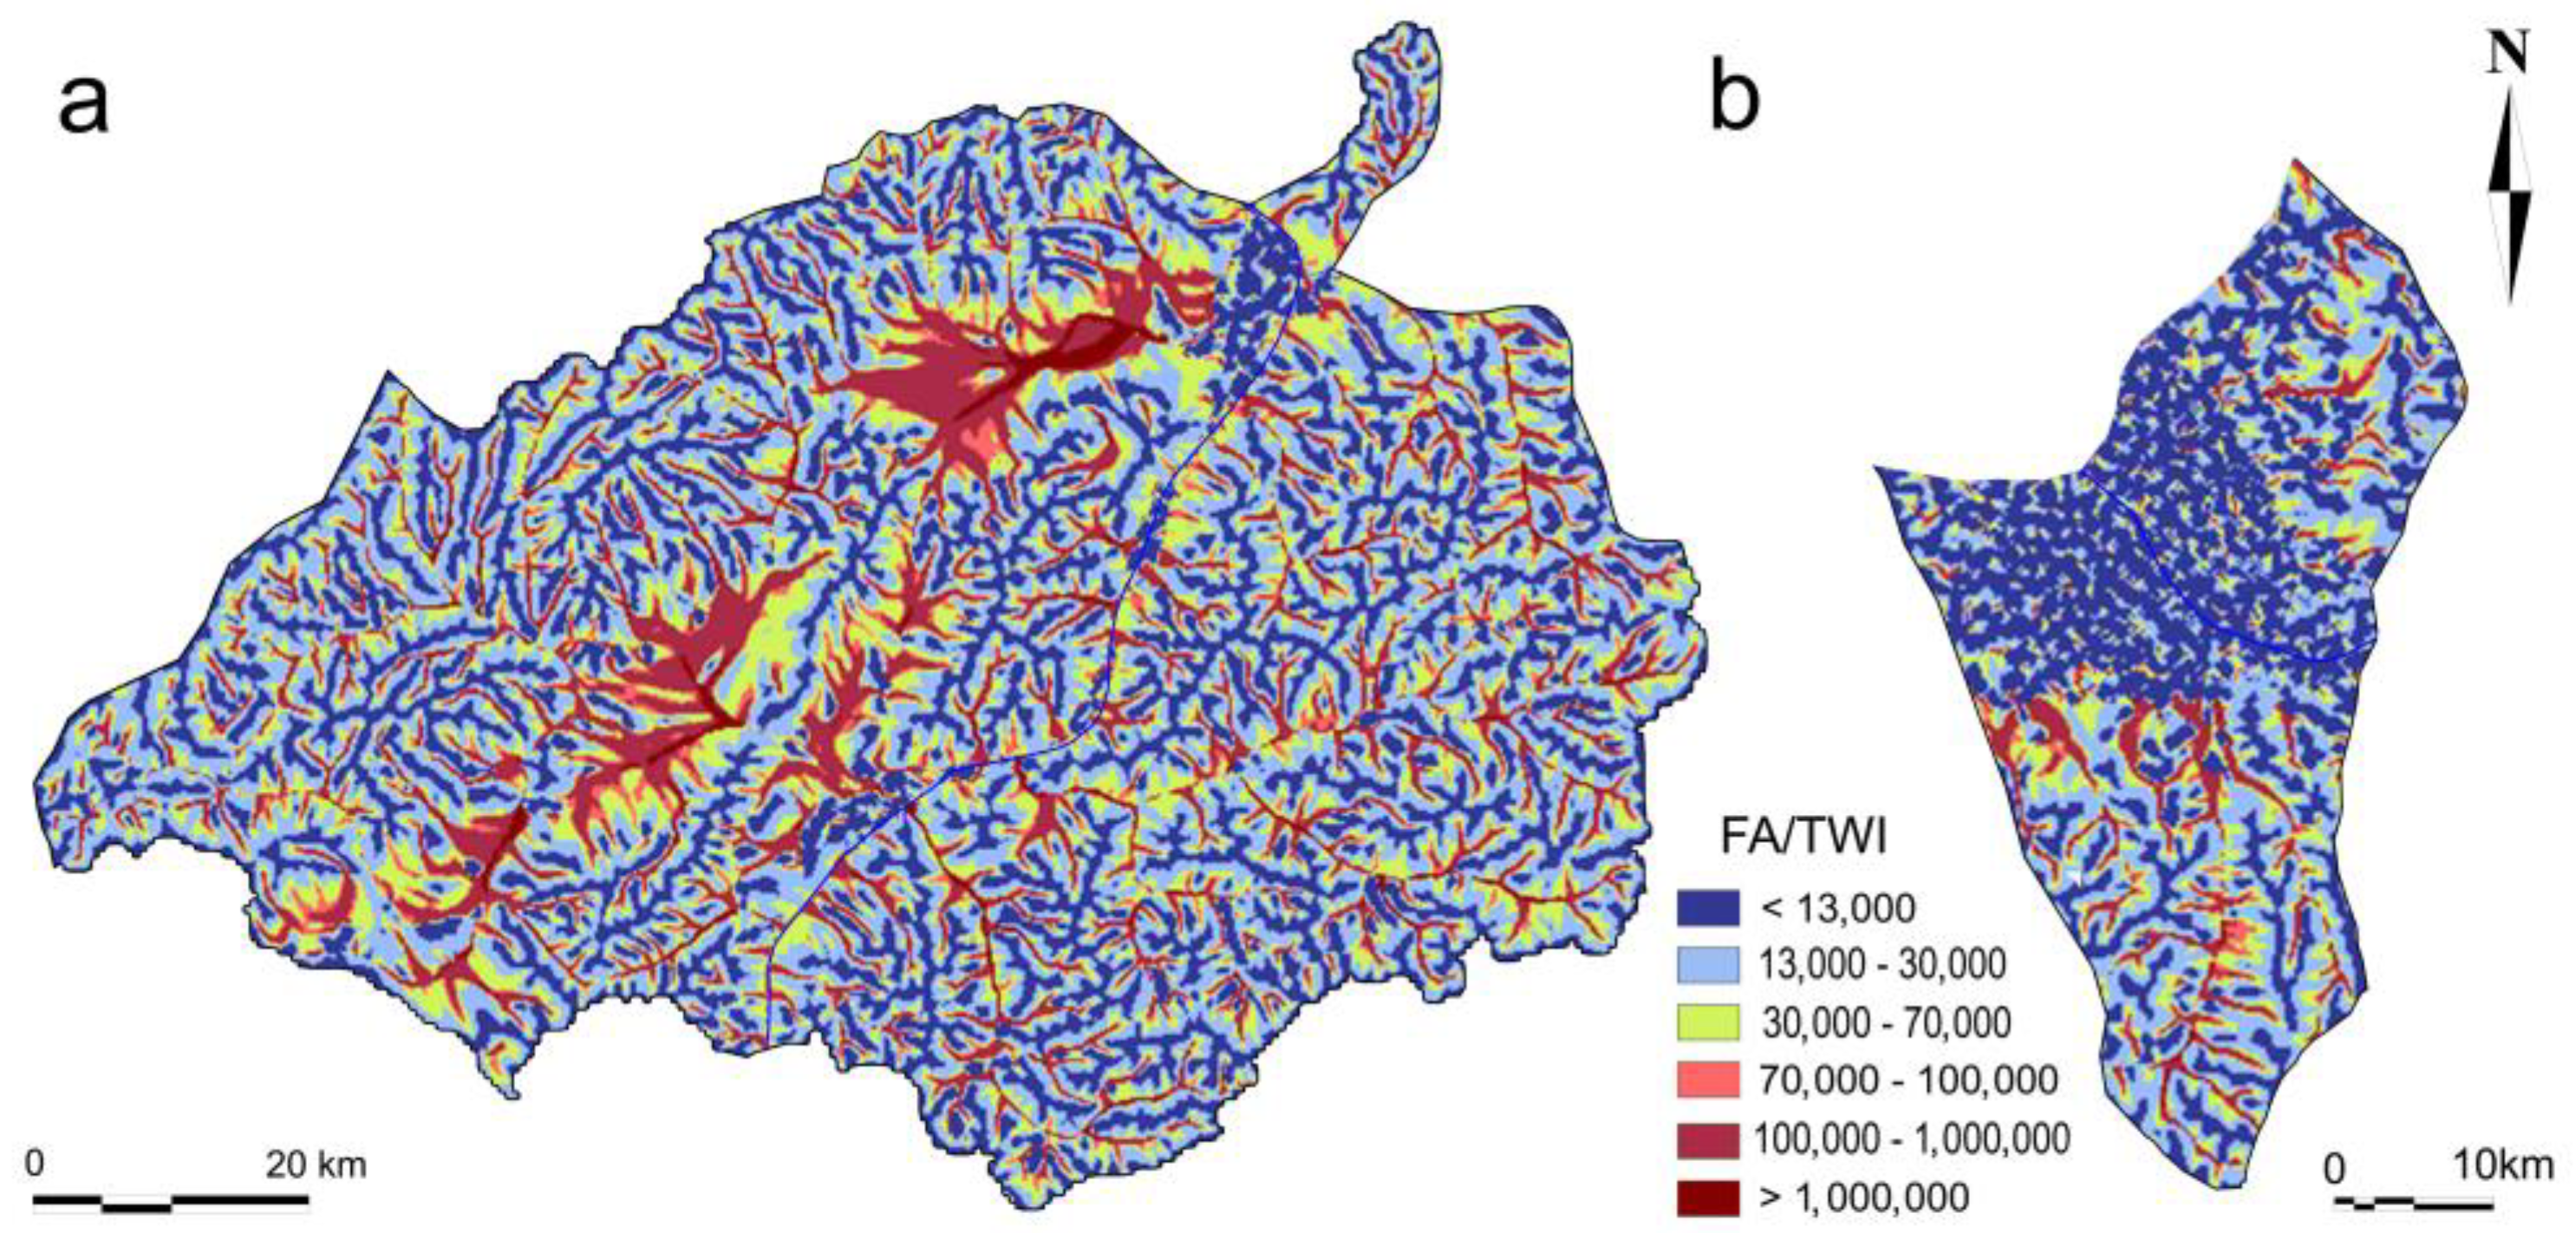
3.5. Identification of Hydrologically Sensitive Areas on the Basis of Spatial Distribution of FA/TWI Ratio Values

For the identification of hydrologically sensitive areas and critical source areas, sub-watersheds 9 and 11, characterized by the highest values of TON and IP export, respectively, were selected. It was found that the FA/TWI ratio values calculated for sub-watersheds 9 (Figure 11a) and 11 (Figure 11b) varied from 0 to more than 10 million.
Lowest FA/TWI values (<13,000) were characteristic of the flat areas like river floodplains and watershed plateaus, whereas the highest values (>1,000,000) were characteristic of slightly inclined areas like the lower parts of intermountain valleys including alluvial fans. In hydrological terms, cells with high FA/TWI values represented areas of infiltration excess overland flow generation, whereas cells with low FA/TWI values represented areas of saturation excess overland flow generation.
Such an easy interpretation of the obtained data in terms of hydrology testifies to their logical consistency which is the type of accuracy in a GIS. Logical consistency means that the data are topologically correct. The topological correctness of the obtained data, and, consequently, its good accuracy, is also evidenced by the closed boundaries of the area objects (spots characterized by certain diapason of FA/TWI values) and by the absence of breaks in the axial lines of linear objects (rivers, intermountain depressions etc.). The obtained data are also reliable because their reliability is ensured by the use of world-renowned, accurate and verified data such as ALOS images and Sentinel-2 images. Thus, the validity of the obtained data is supported by their high accuracy and reliability.
Sub-watersheds 9 and 11 have areas of about 10,000 and 6000 km2, respectively. Unfortunately, HSAs, the areas of which rarely exceed several hundred square meters, cannot be adequately identified and displayed at this scale. To understand the patterns of HSA distribution at real scales, the FA/TWI maps for the most densely populated urban area of sub-watershed 9 (Figure 12a) and for the most densely populated rural area of sub-watershed 11 (Figure 12b) were created.
The creation of large-scale maps allowed us to understand that cells characterized by FA/TWI values within the range 70,000–80,000 were situated simultaneously in floodplains of big rivers and in channels of intermittent rivers and ephemeral streams. Those areas were then considered as HSAs in both the densely populated urban area of sub-watershed 9 (Figure 13a) and the densely populated rural area of sub-watershed 11 (Figure 13b).

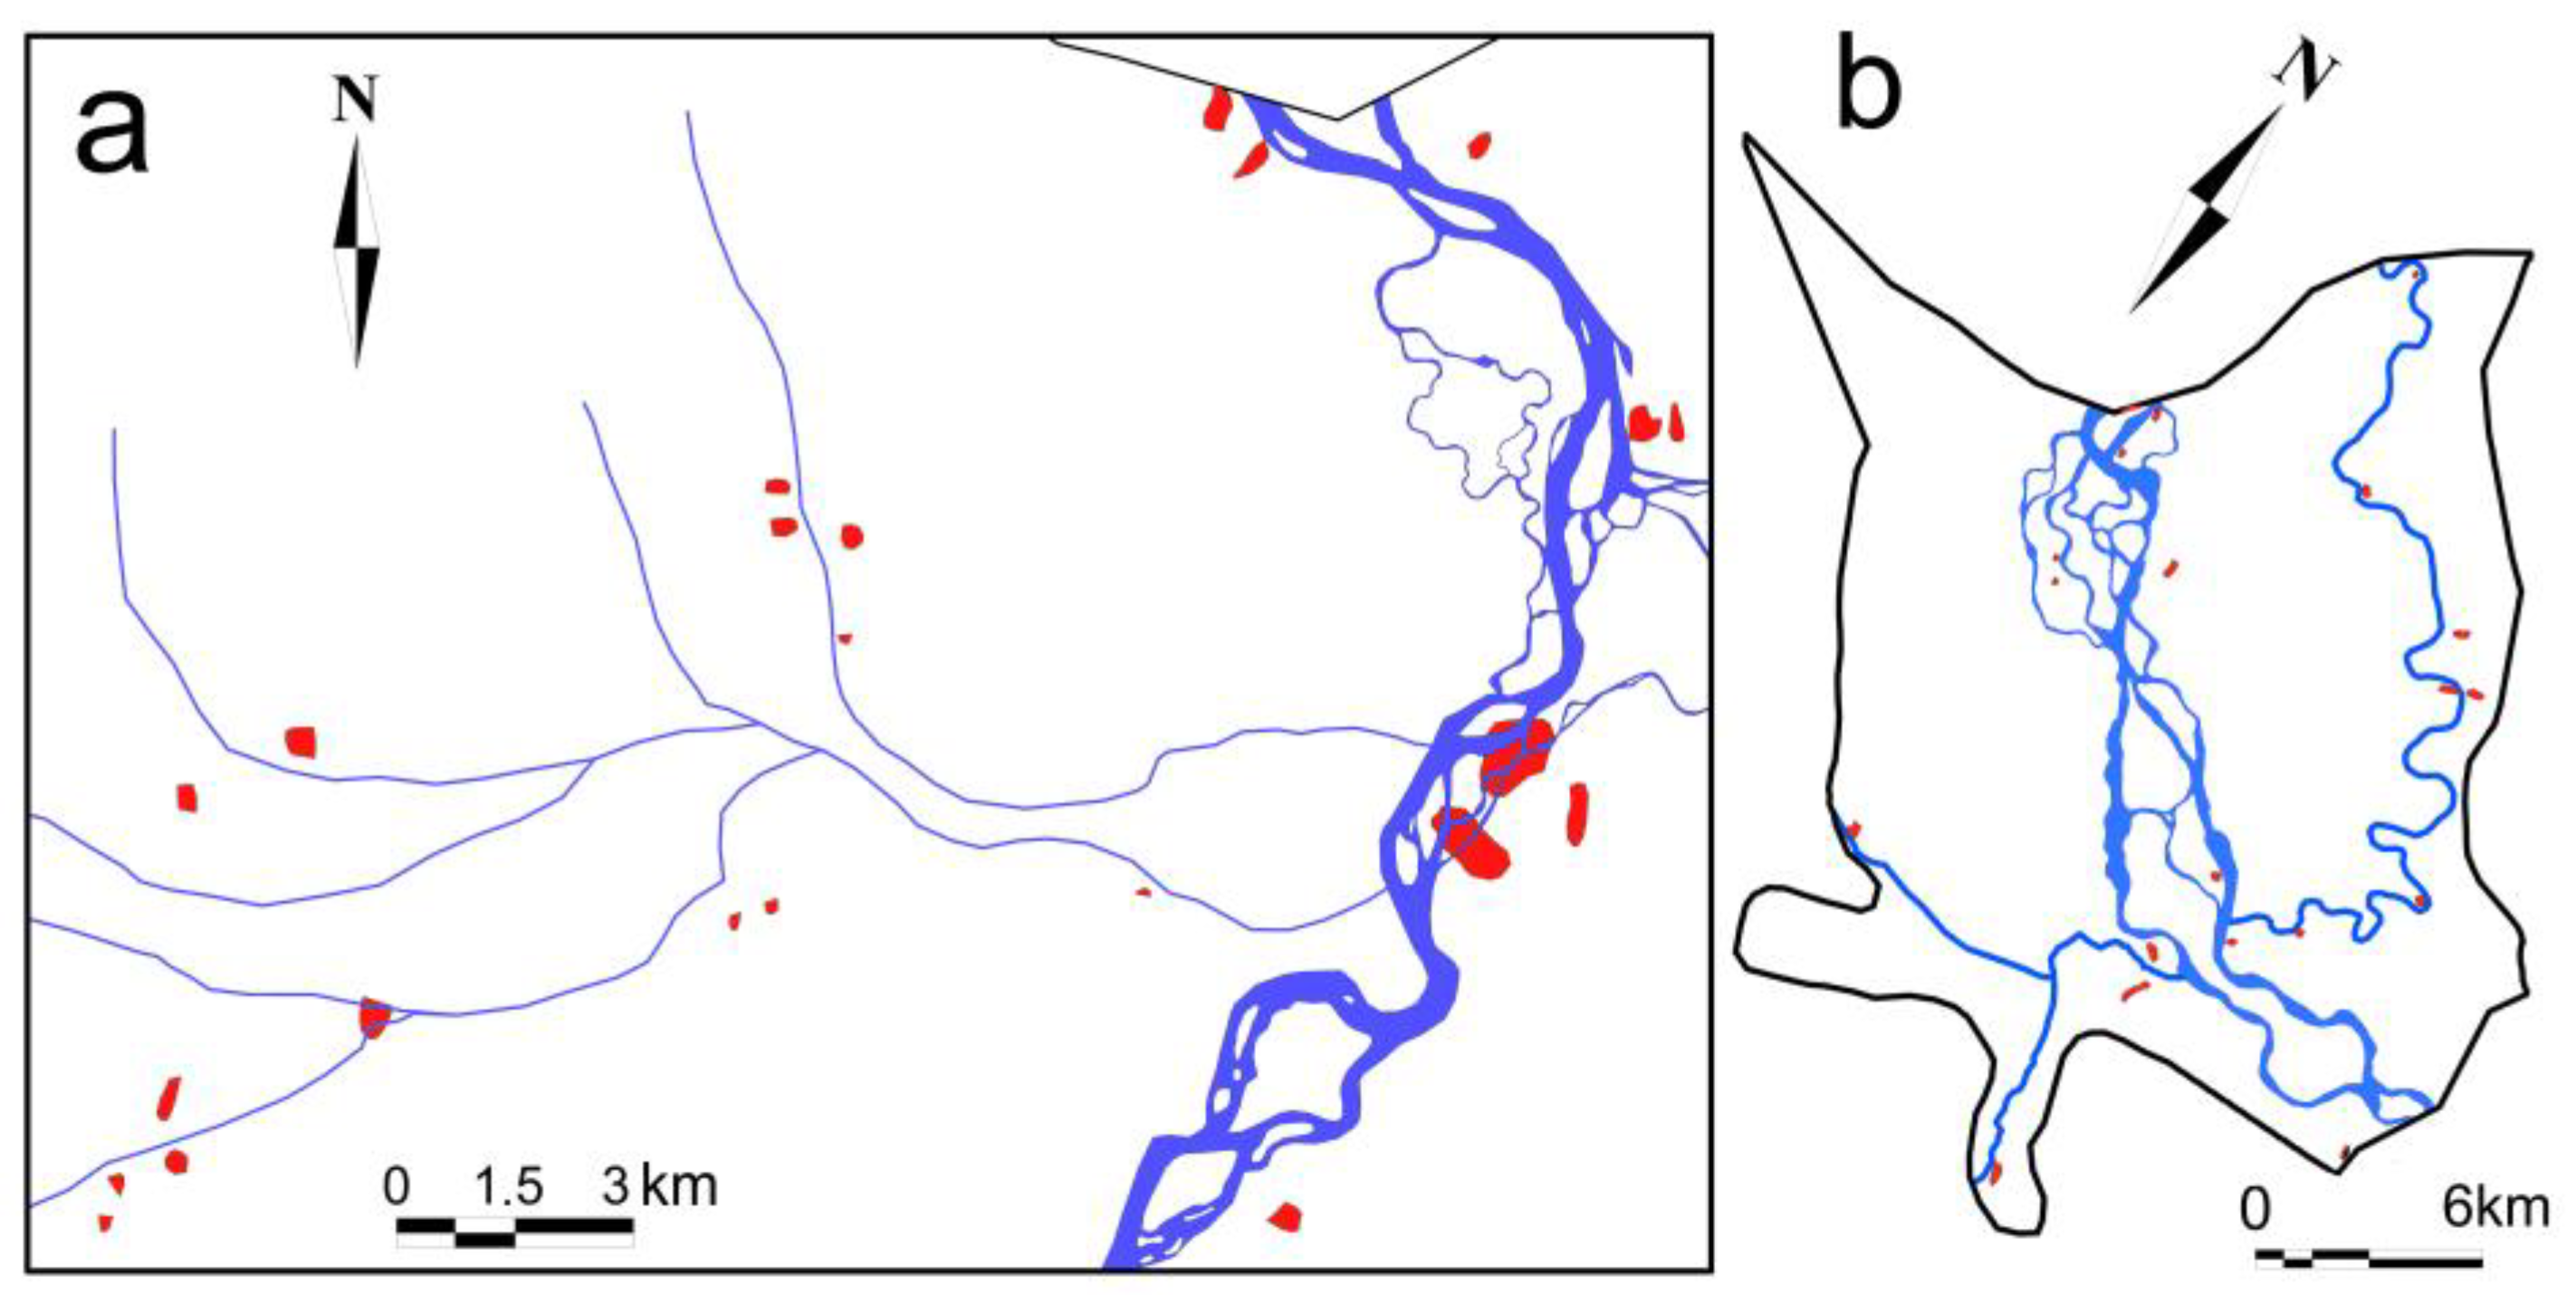
3.6. Identification of Critical Source Areas on the Basis of Data on Spatial Distribution of HSAs and Land Use

To identify CSAs in the most polluted areas of sub-watersheds 9 and 11, maps of the land use in those areas were created (Figure 14). Since high concentrations of oxidized nitrogen are characteristic of wastes from both urban and rural territories, the land use map of sub-watershed 9 (Figure 14a) displays the spatial distribution of cities and settlements. Since the main anthropogenic sources of phosphorus in the Selenga watershed are agricultural activities, the land use map created for sub-watershed 11 (Figure 14b) displays only the spatial distribution of agricultural lands. To identify CSAs, the HSA map was superimposed onto the land use map.
The parts of the HSAs that were bounded by the borders of urban and rural lands were then considered as CSAs in sub-watershed 9 (Figure 15a). The parts of HSAs bounded by the borders of agricultural lands were then considered as CSAs in sub-watershed 11 (Figure 15b).
The reliability of the obtained CSA maps is based on the quality of the satellite and radar images that have been used in this study as the cartographic basis. The resolution of the available images was 30 × 30 m. In other words, 1 pixel on a map or space image corresponded to a 30 × 30 m area on the ground (1 arcsecond). This means that the spatial resolution of HSA maps generated from the above-mentioned images is also 30 × 30 m. The obtained CSA areas vary from 150 to 700 m2, thus the area of the smallest CSA is larger than the area of a pixel. Thus, the robustness of CSA identification at a scale of 1:100,000 is pretty high. The accuracy of CSA border drawing at a scale of 30 by 30 m is also good enough: the possible deviation of a CSA’s position from the real one is in the range 30–60 m.

3.7. Implications of the Obtained Data for Water Quality Management and Environmental Conservation

To reduce the pollution of Selenga water by CSAs in urban areas like Ulan-Ude city (Figure 15a) the best engineering and landscape management practices should be used. The best engineering practices should include the creation of terraces fields on steep slopes and the creation of contour hedgerows on gentle slopes or flat surfaces along the Selenga and Uda rivers. To reduce the water pollution from CSAs in rural areas like the part of the Selenga valley between Ulan-Ude city and the Mongolian border, non-engineering management practices like fertilizer reduction and no-tillage seeding should be used. In areas where agricultural activities do not generate a high income, landscape management practices like returning farmland to forest land should be used. With regards to the Selenga delta (Figure 15b), it must be considered that a significant proportion of the phosphorus compounds in its soils was accumulated due to sedimentation of suspended solids delivered by riverine waters [79]. To reduce the sediment load in the lower part of the Selenga River basin (including delta), some stream–wetland complexes can be constructed. The implementation of all the above-mentioned best management practices will reduce the nutrient pollution load on Lake Baikal and prevent its eutrophication.

4. Conclusions

  • Obtained estimates of the nutrient export rates are not precise due to the use of summer baseflow concentrations instead of flow-weighted mean concentrations. At the same time, the locations of nutrient source areas were identified quite precisely because baseflow concentrations reflect the groundwater chemistry which is an indicator of chronic pollution.
  • Since the study is based on the evaluation of nutrient export rates, its main limitations are associated with determining the physical properties of the watershed such as water discharge, watershed area and watershed boundary. The second most important limitation is associated with the choice of nutrient concentration values used for nutrient export calculations.
  • Taking into account the scales of the maps and the quality of the chemical data used in the present study, it is clear that further research is needed to detail the picture of spatial distribution of nutrient export rates and nutrient source areas.
  • Due to less precipitation, the TON and IP concentrations in the surface waters of the Mongolian part of the Selenga watershed are much higher than those in the waters of the Russian part.
  • The values of TON export in both parts of watershed were approximately in the range 0–1000 kg/km2/yr; however, the values calculated for 95% of the territory under study were in the range 0–50 kg/km2/yr.
  • The values of IP export were approximately in the range 0–223 kg/km2/yr, but the values calculated for most of the basin are in the range 0–5 kg/km2/yr.
  • The lowest concentrations of TON and IP in surface waters, as well as the highest values of TON and IP export from watershed, were observed in the lowest part of the Selenga watershed, not far from Baikal.
  • TON in surface waters of Selenga watershed originated mostly from urban sources, whereas IP originated mostly from rural sources.
  • Hydrologically sensitive areas characterized by FA/TWI values within the range 70,000–80,000 can be used for the identification of critical source areas in the lower Selenga basin.

Author Contributions

Research design, data analysis and writing, M.Y.S.; digital mapping, A.V.S. and Y.M.S.; chemical analyses, L.A.B. All authors have read and agreed to the published version of the manuscript.

Funding

This work has been supported by the grant of the Russian Science Foundation, RSF 23-27-00101 (https://rscf.ru/project/23-27-00101/ (accessed on 15 June 2023)).

Data Availability Statement

Data available on request from the authors.

Conflicts of Interest

The authors declare no conflicts of interest.

References

  1. Lund, J.W.G. Proceedings of the Royal Society of London. Eutrophication 1972, 180, 371–382. [Google Scholar]
  2. Carpenter, S.R.; Caraco, N.F.; Correll, D.L.; Howarth, R.W.; Sharpley, A.N.; Smith, V.H. Nonpoint pollution of surface waters with phosphorus and nitrogen. Ecol. Appl. 1998, 8, 559–568. [Google Scholar] [CrossRef]
  3. Khan, F.A.; Ansari, A.A. Eutrophication: An Ecological Vision. Bot. Rev. 2005, 71, 449–482. Available online: http://www.jstor.org/stable/4354503 (accessed on 3 July 2023). [CrossRef]
  4. Gibson, G.; Carlson, R.; Simpson, J.; Smeltzer, E.; Gerritson, J.; Chapra, S.; Heiskary, S.; Jones, J.; Kennedy, R. Nutrient Criteria Technical Guidance Manual—Lakes and Reservoirs; Protection Agency: Washington, DC, USA, 2000; pp. 9-1–9-17. Available online: https://www.epa.gov/sites/default/files/2018-10/documents/nutrient-criteria-manual-lakes-reservoirs.pdf (accessed on 18 February 2024).
  5. Rixen, T.; Baum, A.; Sepryani, H.; Pohlmann, T.; Jose, C.; Samiaji, J. Dissolved oxygen and its response to eutrophication in a tropical black water river. J. Environ. Manag. 2010, 91, 1730–1737. [Google Scholar] [CrossRef] [PubMed]
  6. Hanjaniamin, A.E.; Tabrizi, M.S.; Babazadeh, H. Dissolved oxygen concentration and eutrophication evaluation in Yamchi dam reservoir, Ardabil, Iran. Appl. Water Sci. 2023, 13, 9. [Google Scholar] [CrossRef]
  7. Le, C.; Zha, Y.; Li, Y.; Sun, D.; Lu, H.; Yin, B. Eutrophication of Lake Waters in China: Cost, Causes, and Control. Environ. Manag. 2010, 45, 662–668. [Google Scholar] [CrossRef] [PubMed]
  8. Zhang, Y.; Li, M.; Dong, J.; Yang, H.; Van Zwieten, L.; Lu, H.; Alshameri, A.; Zhan, Z.; Chen, X.; Jiang, X.; et al. A Critical Review of Methods for Analyzing Freshwater Eutrophication. Water 2021, 13, 225. [Google Scholar] [CrossRef]
  9. Kobanova, G.I.; Takhteev, V.V.; Rusanovskaya, O.O.; Timofeyev, M.A. Lake Baikal ecosystem faces the threat of eutrophication. Int. J. Ecol. 2016, 401, 6058082. [Google Scholar] [CrossRef]
  10. Kravtsova, L.S.; Izhboldina, L.A.; Khanaev, I.V.; Pomazkina, G.V.; Rodionova, E.V.; Domysheva, V.M.; Sakirko, M.V.; Tomberg, I.V.; Kostornova, T.Y.; Kravchenko, O.S.; et al. Nearshore benthic blooms of filamentous green algae in Lake Baikal. J. Great Lakes Res. 2014, 40, 441–448. [Google Scholar] [CrossRef]
  11. Timoshkin, O.A.; Samsonov, D.P.; Yamamuro, M.; Moore, M.V.; Belykh, O.I.; Malnik, V.V.; Sakirko, M.V.; Shirokaya, A.A.; Bondarenko, N.A.; Domysheva, V.M.; et al. Rapid ecological change in the coastal zone of Lake Baikal (East Siberia): Is the site of the world’s greatest freshwater biodiversity in danger? J. Great Lakes Res. 2016, 42, 487–497. [Google Scholar] [CrossRef]
  12. Panizzo, V.N.; Swann, G.E.A.; Mackay, A.W.; Vologina, E.; Alleman, L.; André, L.; Pashley, V.; Horstwood, M.S.A. Constraining modern-day silicon cycling in Lake Baikal. Glob. Biogeochem. Cycles 2017, 31, 556–574. [Google Scholar] [CrossRef]
  13. O’Donnell, D.R.; Wilburn, P.; Silow, E.A.; Yampolsky, L.Y.; Litchman, E. Nitrogen and phosphorous colimitation of phytoplankton in Lake Baikal: Insights from a spatial survey and nutrient enrichment experiments. Limnol. Oceanogr. 2017, 62, 1383–1392. [Google Scholar] [CrossRef]
  14. Chebykin, E.P.; Sorokovikova, L.M.; Tomberg, I.V.; Rasskazov, S.V.; Khodzher, T.V.; Grachev, M.A. Current state of the Selenga River waters in the Russian territory concerning major components and trace elements. Chem. Sustain. Dev. 2012, 20, 561–580. [Google Scholar]
  15. Khodzher, T.V.; Domysheva, V.M.; Sorokovikova, L.M.; Sakirko, M.V.; Tomberg, I.V. Current chemical composition of Lake Baikal water. Inland Waters 2017, 7, 250–258. [Google Scholar] [CrossRef]
  16. Semenov, M.Y.; Semenov, Y.M.; Silaev, A.V.; Begunova, L.A. Assessing the Self-Purification Capacity of Surface Waters in Lake Baikal Watershed. Water 2019, 11, 1505. [Google Scholar] [CrossRef]
  17. Semenov, M.Y.; Snytko, V.A.; Silaev, A.V.; Semenov, M.Y. Complex Assessment of Permissible Pollutant Loads for Freshwater and Terrestrial Ecosystems Using the Selenga River Basin as an Example. Dokl. Earth Sci. 2020, 492, 455–463. [Google Scholar] [CrossRef]
  18. Malnik, V.V.; Timoshkin, O.A.; Suturin, A.N.; Onishchuk, N.A.; Sakirko, M.V.; Tomberg, I.V.; Gorshkova, A.S.; Zabanova, N.S. Anthropogenic Changes in the Hydrochemical and Sanitary–Microbiological Characteristics of Water Quality in Southern Baikal Tributaries: Listvennichnyi Bay. Water Resour. 2019, 46, 748–758. [Google Scholar] [CrossRef]
  19. Sorokovikova, L.M.; Tomberg, I.V.; Sinyukovich, V.N.; Ivanov, V.G. Dynamics of nutrient concentrations and eutrophication of the waters in Barguzin Bay (Lake Baikal). Limnol. Freshw. Biol. 2020, 4, 890–891. [Google Scholar] [CrossRef]
  20. United States Statutes at Large. The Clean Water Act, 33 U.S.C. §1251 et seq. of 1972; Based on the Federal Water Pollution Control Act of 1948 (Ch. 758; P.L. 845); U.S. Government Printing Office: Washington, DC, USA, 1973.
  21. Dworsky, L.B. Analysis of Federal Water Pollution Control Legislation, 1948–1966. J. Am. Water Work. Assoc. 1967, 59, 651–680. Available online: https://www.jstor.org/stable/41265049 (accessed on 1 July 2023). [CrossRef]
  22. Griffiths, M. The European Water Framework Directive: An Approach to Integrated River Basin Management; European Water Management Online, European Water Association: Hennef, Germany, 2002. [Google Scholar]
  23. Law of the People’s Republic of China on Prevention and Control of Water Pollution. Available online: http://www.bjqixingguan.gov.cn/zfbm/swj/zcwj_5713012/202204/t20220424_73571170.html (accessed on 5 June 2023).
  24. Russian Ministry of Health. San Pin 2.1.4.1074-01. Drinking Water. Hygienic Requirements for Water Quality of Centralized Drinking Water Supply Systems. Quality Control (Instead San Pin 2.1.4.559-96). Available online: https://www.fao.org/faolex/results/details/ru/c/LEX-FAOC187270/ (accessed on 26 July 2023).
  25. Manuel, J. Nutrient pollution: A persistent threat to waterways. Environ. Health Perspect. 2014, 122, A304–A309. [Google Scholar] [CrossRef]
  26. Sharpley, A.N.; Daniel, T.C.; Edwards, D.R. Phosphorus movement in the landscape. J. Prod. Agric. 1993, 6, 492–500. [Google Scholar] [CrossRef]
  27. Walter, M.T.; Walter, M.F.; Brooks, E.S.; Steenhuis, T.S.; Boll, J.; Weiler, K. Hydrologically sensitive areas: Variable source area hydrology implications for water quality risk assessment. J. Soil Water Conserv. 2000, 55, 277–284. [Google Scholar]
  28. Agnew, L.J.; Lyon, S.; Gérard-Marchan, T.P.; Collins, V.B.; Lembo, A.J.; Steenhuis, T.S.; Walter, M.T. Identifying hydrologically sensitive areas: Bridging the gap between science and application. J. Environ. Manag. 2006, 78, 63–76. [Google Scholar] [CrossRef] [PubMed]
  29. Kirkby, M. Hydrograph modelling strategies. In Processes in Physical and Human Geography: Bristol Essays; Peel, R., Chisholm, M., Hagget, P., Eds.; Heinemann Educational: London, UK, 1975. [Google Scholar]
  30. Beven, K.J.; Kirkby, M.J. A physically based, variable contributing area model of basin hydrology/Unmodèle à base physique de zone d’appel variable de l’hydrologie du bassin versant. Hydrol. Sci. Bull. 1979, 24, 43–69. [Google Scholar] [CrossRef]
  31. Arnold, J.G.; Srinivasan, R.; Muttiah, R.S.; Williams, J.R. Large area hydrologic modeling and assessment part I: Model development. J. Am. Water Resour. Assoc. 1998, 34, 73–89. [Google Scholar] [CrossRef]
  32. Young, R.A.; Onstad, C.A.; Boesch, D.D.; Anderson, W.P. AGNPS—A nonpoint source pollution model for evaluating agricultural watersheds. J. Soil Water Conserv. 1989, 44, 168–173. [Google Scholar]
  33. Haith, D.A.; Shoemaker, L.L. Generalized watershed loading functions for stream-flow nutrients. Water Resour. Res. 1987, 23, 471–478. [Google Scholar] [CrossRef]
  34. Arnold, J.G.; Kiniry, J.R.; Srinivasan, R.; Williams, J.R.; Haney, E.B.; Neitsch, S.L. Soil & Water Assessment Tool: Input/Output Documentation; Version 2012, TR-439; Texas Water Resources Institute: College Station, TX, USA, 2012; p. 650. [Google Scholar]
  35. Wang, Y.; Hua, C.; Fan, M.; Yao, J.; Zhou, L.; Cai, C.; Zhong, N. Spatial and temporal distribution characteristics of typical pollution loads based on SWAT model across Tuojiang River watershed located in Sichuan Province, Southwest of China. Environ. Monit. Assess. 2023, 195, 865. [Google Scholar] [CrossRef]
  36. Ubugunov, L.L.; Badmaev, N.B.; Ubugunova, V.I.; Gyninova, A.B.; Balsanova, L.D.; Ubugunov, V.L.; Gonchikov, B.N.; Tsybikdorzhiev, T.D.-T. Soil map of Buryatia. Scale 1:3,000,000; Institute of General and Experimental Biology SB RAS: Ulan-Ude, Russia, 2011. [Google Scholar]
  37. Ecological Atlas of the Baikal Basin. Available online: http://bic.iwlearn.org/en/atlas/atlas (accessed on 26 July 2023).
  38. Batuev, A.R.; Beshentsev, A.N.; Bogdanov, V.N.; Dorjgotov, D.; Korytny, L.M.; Plyusnin, V.M. Ecological atlas of the Baikal basin: Cartographic innovation. Geogr. Nat. Resour. 2015, 36, 1–12. [Google Scholar] [CrossRef]
  39. Gunin, P.D.; Vostokova, E.A.; Dorofeyuk, N.I.; Tarasov, P.E.; Black, C.C. Vegetation dynamics of Mongolia; Kluwer Academic Publishers: Dordrecht, The Netherlands, 1999. [Google Scholar]
  40. Dulamsuren, C.; Hauck, M.; Mühlenberg, M. Ground Vegetation in the Mongolian Taiga Forest-Steppe Ecotone Does Not Offer Evidence for the Human Origin of Grasslands. Appl. Veg. Sci. 2005, 8, 149–154. [Google Scholar] [CrossRef]
  41. Chalov, S.; Zavadsky, A.; Belozerova, E.; Bulacheva, M.; Jarsjö, J.; Thorslund, J.; Yamkhin, J. Suspended and dissolved matter fluxes in the upper Selenga River basin. Geogr. Environ. Sustain. 2012, 5, 78–94. [Google Scholar] [CrossRef]
  42. Ochirbold, B.-E.; Tserendorj, A.; Westphal, K.; Karthe, D. Hygienic Condition of Different Water Sources in the Kharaa River Basin, Mongolia in the Light of a Rapid Warming Trend. Atmosphere 2020, 11, 1113. [Google Scholar] [CrossRef]
  43. Khazheeva, Z.I.; Plyusnin, A.M. Discharge of biogenic substances with river runoff in Selenga basin. Water Resour. 2012, 39, 420–431. [Google Scholar] [CrossRef]
  44. Khazheeva, Z.I.; Plyusnin, A.M. The regime of dissolved gases and organic matter in Selenga basin rivers. Water Resour. 2013, 40, 61–73. [Google Scholar] [CrossRef]
  45. Semenov, M.Y.; Semenov, Y.M.; Silaev, A.V.; Begunova, L.A. Source Apportionment of Inorganic Solutes in Surface Waters of Lake Baikal Watershed. Sustainability 2021, 13, 5389. [Google Scholar] [CrossRef]
  46. GOST 33045-2014; Water. (ISO 6777:1984, NEQ) Methods for Determination of Nitrogen-Containing Matters. Standartinform: Moscow, Russia, 2019. Available online: https://files.stroyinf.ru/Data2/1/4293766/4293766954.pdf (accessed on 25 December 2023).
  47. GOST 18309-2014; Water. (ISO 6878:2004, NEQ) Methods for Determination of Phosphorus-Containing Matters. Standartinform: Moscow, Russia, 2019. Available online: https://files.stroyinf.ru/Data/584/58485.pdf (accessed on 25 December 2023).
  48. Sorokovikova, L.M.; Sinyukovich, V.N.; Tomberg, I.V.; Marinaite, I.I.; Khodzher, T.V. Assessing the water quality in the tributary streams of Lake Baikal from chemical parameters. Geogr. Nat. Resour. 2015, 36, 31–39. [Google Scholar] [CrossRef]
  49. Hosoda, K.; Murata, T.; Mochizuki, A.; Katano, T.; Tanaka, Y.; Mimura, T.; Mitamura, O.; Nakano, S.; Sugiyama, Y.; Satoh, Y.; et al. Biogeochemical characteristics of the Hövsgöl–Ustilimsk water system in Mongolia and Russia: The effect of environmental factors on dissolved chemical components. Limnology 2022, 23, 385–402. [Google Scholar] [CrossRef]
  50. Batbayar, G.; Pfeiffer, M.; von Tümpling, W.; Kappas, M.; Karthe, D. Chemical water quality gradients in the Mongolian sub-catchments of the Selenga River basin. Environ. Monit. Assess. 2017, 189, 420. [Google Scholar] [CrossRef]
  51. Sorokovikova, L.M.; Tomberg, I.V.; Stepanova, O.G.; Marinaite, I.I.; Bashenkhaeva, N.V.; Khash-Erdene, S.; Fedotov, A.P. Chemical composition and quality of water of the Selenga River and its tributaries in Mongolia. Limnol. Freshw. Biol. 2019, 6, 332–338. [Google Scholar] [CrossRef]
  52. Hofmann, J.; Karthe, D.; Ibisch, R.; Schäffer, M.; Avlyush, S.; Heldt, S.; Kaus, A. Initial Characterization and Water Quality Assessment of Stream Landscapes in Northern Mongolia. Water 2015, 7, 3166–3205. [Google Scholar] [CrossRef]
  53. Zagdragchaa, O.; Bold, A.; Mizunoya, T.; Yabar, H.; Utsumi, M.; Lei, Z.; Zhang, Z.; Sugiura, N.; Shimizu, K. Seasonal Dynamics of Surface Water Quality and River Water Quality Deterioration in an Urban Area of Mongolia. Jpn. J. Water Treat. Biol. 2021, 57, 91–102. [Google Scholar] [CrossRef]
  54. Hofmann, J.; Hürdler, J.; Ibisch, R.; Schaeffer, M.; Borchardt, D. Analysis of recent nutrient emission pathways, resulting surface water quality and ecological impacts under extreme continental climate: The Kharaa River Basin (Mongolia). Int. Rev. Hydrobiol. 2011, 96, 484–519. [Google Scholar] [CrossRef]
  55. Wellmitz, J.; Gluschke, M. Leitlinie zur Methodenvalidierung. Texte 01/05 ISSN 0722-186X. 2005. Available online: http://www.umweltbundesamt.de/sites/default/files/medien/publikation/long/2832.pdf (accessed on 7 July 2023).
  56. Murata, A.; Aoyama, M.; Cheong, C.; Miura, T.; Fujii, T.; Mitsuda, H.; Kitao, T.; Sasano, D.; Nakano, T.; Nagai, N.; et al. Current situation and future perspective for environmental standards of seawater: Commencing with certified reference materials (CRMs) for nutrients. Oceanogr. Jpn. 2019, 29, 153–187. (In Japanese) [Google Scholar] [CrossRef] [PubMed]
  57. Yamashita, M. Renzoku Nagare Bunsekihou (The Continuous Flow Analysis); Kankyoshimbunsya: Tokyo, Japan, 2009. (In Japanese) [Google Scholar]
  58. Thompson, M.E.; Stephen, L.R.; Wood, R. Harmonized guidelines for single-laboratory validation of methods of analysis (IUPAC Technical Report). Pure Appl. Chem. 2002, 74, 835–855. [Google Scholar] [CrossRef]
  59. ISO 13395:1996; Water Quality—Determination of Nitrite Nitrogen and Nitrate Nitrogen and the Sum of Both by Flow Analysis (CFA and FIA) and Spectrometric Detection. International Organization for Standardization: Geneva, Switzerland, 1996.
  60. ISO 15681-2:2018; Determination of Orthophosphate and Total Phosphorus Contents by Flow Analysis (FIA and CFA)—Part 2: Method by Continuous Flow Analysis (CFA). International Organization for Standardization: Geneva, Switzerland, 2018.
  61. Conrad, O.; Bechtel, B.; Bock, M.; Dietrich, H.; Fischer, E.; Gerlitz, L.; Wehberg, J.; Wichmann, V.; Böhner, J. System for automated geoscientific analyses (SAGA). Geosci. Model Dev. 2015, 8, 107–122. [Google Scholar] [CrossRef]
  62. Kasimov, N.S.; Kosheleva, N.; Lychagin, M.; Chalov, S.; Alexeenko, A.; Bazilova, V.; Beshentsev, A.; Bogdanova, M.; Chernov, A.; Dorjgotov, D. Environmental Atlas-Monograph “Selenga-Baikal”; Faculty of Geography of Lomonosov Moscow State University: Moscow, Russia, 2019; (In Russian). Available online: https://www.researchgate.net/publication/335567904_Environmental_Atlas-monograph_SelengaBaikal (accessed on 7 July 2023).
  63. Bazarzhapov, T.Z.; Shiretorova, V.G.; Radnaeva, L.D.; Nikitina, E.P.; Sodnomov, B.V.; Tsydypov, B.Z.; Batomunkuev, V.S.; Taraskin, V.V.; Dong, S.; Li, Z.; et al. Trend Analysis of Precipitation, Runoff and Major Ions for the Russian Part of the Selenga River Basin. Water 2023, 15, 197. [Google Scholar] [CrossRef]
  64. Drusch, M.; Del Bello, U.; Carlier, S.; Colin, O.; Fernandez, V.; Gascon, F.; Hoersch, B.; Isola, C.; Laberinti, P.; Martimort, P.; et al. Sentinel-2: ESA’s optical high-resolution mission for GMES operational services. Remote Sens. Environ. 2012, 20, 25–36. [Google Scholar] [CrossRef]
  65. Stubblefield, A.; Chandra, S.; Eagan, D.; Tuvshinjargal, G.; Davaadorzh, D.; Gilroy, J.; Sampson, J.; Thorne, B.; Allen, Z.; Hogan, Z. Impacts of gold mining and land use alterations on the water quality of central Mongolian rivers. Integr. Environ. Assess. Manag. Int. J. 2005, 4, 365–373. [Google Scholar] [CrossRef]
  66. Farrington, J.D. Environmental problems of placer gold mining in Zaamar Goldfield, Mongolia. World Placer J. 2000, 1, 107–128. [Google Scholar]
  67. Battogtokh, B.; Lee, J.M.; Woo, N. Contamination of water and soil by the Erdenet copper-molybdenum mine in Mongolia. Environ. Earth Sci. 2014, 71, 3363–3374. [Google Scholar] [CrossRef]
  68. Jordan, S.J.; Stoffer, J.; Nestlerode, J.A. Wetlands as Sinks for Reactive Nitrogen at Continental and Global Scales: A Meta-Analysis. Ecosistems 2011, 14, 144–155. [Google Scholar] [CrossRef]
  69. Baron, J.S.; Hall, E.K.; Nolan, B.T.; Finlay, J.C.; Bernhardt, E.S.; Harrison, J.A.; Chan, F.; Boyer, E.W. The Interactive Effects of Excess Reactive Nitrogen and Climate Change on Aquatic Ecosystems and Water Resources of the United States. Beogeochemistry 2013, 114, 71–92. [Google Scholar] [CrossRef]
  70. Thorslund, J.; Jarsjö, J.; Belozerorva, E.; Chalov, S. Assessment of the gold mining impact on riverine heavy metal transport in a sparsely monitored region: The upper Lake Baikal Basin case. J. Environ. Monit. 2012, 14, 2780–2792. [Google Scholar] [CrossRef] [PubMed]
  71. Dalantai, S.; Sumiya, E.; Bao, Y.; Otgonbayar, M.; Mandakh, U.; Batsaikhan, B.; Natsagdorj, B. Spatial-temporal changes of land degradation caused by natural and human induced factors: Case study of bulgan province in Central Mongolia. Int. Arch. Photogramm. Remote Sens. Spatial Inf. Sci. 2021, 43, 79–85. [Google Scholar] [CrossRef]
  72. Munkhtsengel, B.; Byambaa, J.; Tamiraa, A. Phosphate Deposits. In Mineral Resources of Mongolia: Modern Approaches in Solid Earth Sciences; Gerel, O., Pirajno, F., Batkhishig, B., Dostal, J., Eds.; Springer: Singapore, 2021; p. 19. [Google Scholar] [CrossRef]
  73. Ubugunov, L.L.; Enkhtuyaa, B.; Merkusheva, M.G. The content of available mineral phosphorus compounds in chestnut soils of Northern Mongolia upon application of different forms of phosphorite. Eurasian Soil Sci. 2015, 48, 634–642. [Google Scholar] [CrossRef]
  74. Mayorga, E.; Seitzinger, S.P.; Harrison, J.A.; Dumont, E.; Beusen, A.H.W.; Bouwman, A.F.; Fekete, B.M.; Kroeze, C.; Van Drecht, G. Global Nutrient Export from Water Sheds 2 (NEWS 2): Model development and implementation. Environ. Model. Softw. 2010, 25, 837–853. [Google Scholar] [CrossRef]
  75. Semenov, M.Y.; Marinaite, I.I.; Silaev, A.V.; Begunova, L.A. Composition, Concentration and Origin of Polycyclic Aromatic Hydrocarbons in Waters and Bottom Sediments of Lake Baikal and Its Tributaries. Water 2023, 15, 2324. [Google Scholar] [CrossRef]
  76. Eriksen, J.; Askegaard, M.; Soegaard, K. Residual effect and nitrate leaching in grass-arable rotations: Effect of grassland proportion, sward type and fertilizer history. Soil Use Manag. 2008, 24, 373–382. [Google Scholar] [CrossRef]
  77. Harrison, J.A.; Bouwman, A.F.; Mayorga, E.; Seitzinger, S. Magnitudes and sources of dissolved inorganic phosphorus inputs to surface fresh waters and the coastal zone: A new global model. Global Biogeochem. Cycles 2010, 24, GB1003. [Google Scholar] [CrossRef]
  78. Belozertseva, I.A.; Ekimovskaya, O.A.; Lopatina, D.N. Soils of natural, arable and fallow Lands of the Selenga River delta. IOP Conf. Ser. Earth Environ. Sci. 2019, 381, 012009. [Google Scholar] [CrossRef]
  79. Tulokhonov, A.K. (Ed.) The Selenga River Delta—Natural Biofilter and Indicator of the Condition of Lake Baikal; Publishing House of SB RAS: Novosibirsk, Russia, 2008; p. 292. [Google Scholar]
  80. Sharapova, E.; Efimova, L.; Denisova, I.; Ermekova, A.; Lychagin, M.; Chalov, S. Spatial variability of biogenic elements and organic carbon content in the tributaries of Lake Baikal. E3S Web Conf. 2020, 163, 05012. [Google Scholar] [CrossRef]
  81. Tuvdendorj, B.; Wu, B.; Zeng, H.; Batdelger, G.; Nanzad, L. Determination of Appropriate Remote Sensing Indices for Spring Wheat Yield Estimation in Mongolia. Remote Sens. 2019, 11, 2568. [Google Scholar] [CrossRef]
  82. Wesche, K.; Ronnenberg, K. Effects of NPK fertilisation in arid southern Mongolian desert steppes. Plant. Ecol. 2010, 207, 93–105. [Google Scholar] [CrossRef]
  83. Wei, Y.; Lin, Z. The dynamics of livestock and its influencing factors on the Mongolian Plateau. Environ. Dev. 2020, 34, 100518. [Google Scholar] [CrossRef]
  84. Inam, E.; Khantotong, S.; Kim, K.W.; Tumendemberel, B.; Erdenetsetseg, S.; Puntsag, T. Geochemical distribution of trace element concentrations in the vicinity of Boroo gold mine, Selenge Province, Mongolia. Environ. Geochem. Health 2011, 33 (Suppl. S1), 57–69. [Google Scholar] [CrossRef] [PubMed]
  85. Chalov, S.R.; Jarsjö, J.; Kasimov, N.S.; Romanchenko, A.O.; Pietroń, J.; Thorslund, J.; Promakhova, E.V. Spatio-temporal variation of sediment transport in the Selenga River Basin, Mongolia and Russia. Environ. Earth Sci. 2015, 73, 663–680. [Google Scholar] [CrossRef]
  86. Jugder, D.; Gantsetseg, B.; Davaanyam, E.; Shinoda, M. Developing a soil erodibility map across Mongolia. Nat. Hazards 2018, 92, 71–94. [Google Scholar] [CrossRef]
  87. Batkhishig, O. Soil classification of Mongolia. Mongolian J. Soil. Sci. 2016, 1, 18–31. [Google Scholar]
Figure 1. Study area.
Water 16 00630 g001
Figure 2. Research design.
Water 16 00630 g002
Figure 3. Division of Selenga watershed into sub-watersheds according to available data (the red dots denote water sampling points and the black figures denote sub-watershed numbers).
Water 16 00630 g003
Figure 4. Annual average runoff volumes (million cubic meters (black figures)) and areas (thousand square kilometers (red figures)), calculated for selected sub-watersheds.
Water 16 00630 g004
Figure 5. Spatial distribution of specific runoff values in the Selenga River watershed.
Water 16 00630 g005
Figure 6. Spatial distribution of summer baseflow TON concentrations in surface waters of the Selenga River watershed.
Water 16 00630 g006
Figure 7. Spatial distribution of predominant land use types in the study territory.
Water 16 00630 g007
Figure 8. Spatial distribution of summer baseflow IP concentrations in surface waters of Selenga River watershed.
Water 16 00630 g008
Figure 9. Spatial distribution of TON export from different areas of Selenga River watershed into surface waters, kg/km2/yr.
Water 16 00630 g009
Figure 10. Spatial distribution of IP export from different areas of Selenga River watershed into surface waters, kg/km2/yr.
Water 16 00630 g010
Figure 11. Spatial distribution of FA/TWI ratio values in sub-watersheds 9 (a) and 11 (b).
Water 16 00630 g011
Figure 12. Spatial distribution of FA/TWI ratio values in most densely populated urban area of sub-watershed 9 (a) and in most densely populated rural area of sub-watershed 11 (b).
Water 16 00630 g012
Figure 13. Spatial distribution of hydrologically sensitive areas (HSAs) in most densely populated urban area of sub-watershed 9 (a) and in most densely populated rural area of sub-watershed 11 (b).
Water 16 00630 g013
Figure 14. Land use in sub-watersheds 9 (a) and 11 (b).
Water 16 00630 g014
Figure 15. Spatial distribution of critical source areas (CSAs) in most densely populated urban area of sub-watershed 9 (a) and in most densely populated rural area of sub-watershed 11 (b).
Water 16 00630 g015
Table 1. Basic statistical parameters of nutrient composition of the waters of the Selenga River and its tributaries, µg/L.
Min25th *Median75thMaxMeanSTD **
TON0.436.8027.578.270247.652.3
IP0.251.352.333.371593.594.35
Notes: * Percentile, ** standard deviation.
Table 2. Ranges and distribution of TON export values in Selenga basin.
TON Export, kg/m2/yr
00–11–1010–5050–500>500
Occupied area,%
12.314.445.625.01.471.25
Table 3. Ranges and distribution of IP export values in Selenga basin.
IP Export, kg/m2/yr
00–11–55–2020–200>200
Occupied area,%
8.1363.719.95.542.350.37
Disclaimer/Publisher’s Note: The statements, opinions and data contained in all publications are solely those of the individual author(s) and contributor(s) and not of MDPI and/or the editor(s). MDPI and/or the editor(s) disclaim responsibility for any injury to people or property resulting from any ideas, methods, instructions or products referred to in the content.

