Article

Projected Increase in Compound Drought and Hot Days over Global Maize Areas under Global Warming

1
State Key Laboratory of Severe Weather (LASW), Chinese Academy of Meteorological Sciences, Beijing 100081, China
2
Joint Open Laboratory on Meteorological Risk and Insurance, Chinese Academy of Meteorological Sciences, Beijing 100081, China
3
Academy of Disaster Reduction and Emergency Management, Ministry of Emergency Management & Ministry of Education, Beijing Normal University, Beijing 100875, China
4
Institute of Remote Sensing and Earth Sciences, School of Information Science and Technology, Hangzhou Normal University, Hangzhou 311121, China
*
Author to whom correspondence should be addressed.
Water 2024, 16(4), 621; https://doi.org/10.3390/w16040621
Submission received: 3 January 2024 / Revised: 5 February 2024 / Accepted: 7 February 2024 / Published: 19 February 2024

Abstract

:
Compound drought and hot events can lead to detrimental impacts on crop yield with grave implications for global and regional food security. Hence, an understanding of how such events will change under unabated global warming is helpful to avoid associated negative impacts and better prepare for them. In this article, we comprehensively analyze the projected changes in compound drought and hot days (CDHDs) occurring within the maize-growing season of 2015–2100 over dynamic global maize areas using 10 downscaled Coupled Model Intercomparison Project Phase 6 (CMIP6) models and four socio-economic scenarios (SSP1-2.6, SSP2-4.5, SSP3-7.0 and SSP5-8.5). The results demonstrate a notable increase in the frequency and severity of CDHDs over global maize areas under all four SSPs, of which SSP5-8.5 has the fastest rise, followed by SSP3-7.0, SSP2-4.5 and SSP1-2.6. By the end of 21st century, the global average frequency and severity of CDHDs will reach 18~68 days and 1.0~2.6. Hotspot regions for CDHDs are mainly found in southern Africa, eastern South America, southern Europe and the eastern USA, where drought and heat show the most widespread increases. The increase in CDHDs will be faster than general hot days so that almost all increments of hot days will be accompanied by droughts in the future; therefore, compound dry and hot stresses will gradually become the predominant form of dry and heat stress on maize growth. The results can be applied to optimize adaptation strategies for mitigating risks from CDHDs on maize production worldwide.

Graphical Abstract

1. Introduction

In the context of global climate change, recent decades have witnessed a great increase in climate extremes worldwide [1]. Droughts and hot events are among the most detrimental climate extremes, leading to pronounced threats to ecosystems and societies across the globe [2,3]. Over the past few decades, positive trends in droughts’ frequency, duration and intensity were detected globally, including western Africa, eastern Asia, central America and the Mediterranean [4]. Meanwhile, a notable increase in hot extremes (e.g., heatwaves, warm spells, hot days) is witnessed around the world [5], such as Africa [6,7], India [8], the USA [9] and China [10]. Global warming systematically alters the relationship between droughts and heat, increasing the probability of their concurrence and/or succession [11,12]. The co-occurrence of drought and hot events, commonly referred to as compound drought and hot events, have received notable increasing attention across the globe because of their considerably amplified deleterious impacts [12]. The intensified hazardous impacts can be attributed to land–atmosphere feedback [13], which is even greater than the total impacts of drought and hot extreme event; thus, ignoring the concurrences of drought and hot events would underestimate their harmful impacts on human society [12,14].
Previous studies have investigated the variations, exposure and impacts of compound drought and hot events [15,16,17]. Despite the diversity of definitions and data, there is now a general consensus about an overall increase in the frequency, duration, severity and spatial extent of compound drought and hot events over different regions across the globe [18,19,20,21,22,23]. In addition, extensive efforts have been devoted to investigating population/cropland exposure to compound drought and hot events because they are a commonly used metric in evaluating the impact of compound drought and hot events on human society [24]. Results show that population/cropland exposure will be exacerbated in the future and climate effects will be the dominant driving factor for such an exposure increase [17]. Moreover, some studies have been conducted to directly assess the impacts of compound drought and hot events on agriculture [25,26,27,28,29,30], tree mortality [31], vegetation [32], wildfire [16], socio-ecosystem productivity [33,34,35], land desertification [36] and hydrology [37,38,39], revealing a substantial increase in the impacts of compound drought and hot events over recent decades.
Agriculture is among the most vulnerable sectors to climate extremes [40]; crops growth is threatened seriously by drought and hot events [41]. Maize was planted in about 203.47 M ha of land globally in 2022, making it the second most widely grown crop in the world after wheat [42]. Maize is an established and important food crop in many regions, such as Sub-Saharan Africa, Latin America and some countries in Asia. Drought is the most important abiotic stress factor for maize production in temperate and tropical environments, and heat stress is becoming more important as climate change evolves [43]. Compound drought and hot events can result in amplified detrimental impacts on maize yield that are larger than that of isolated dry or hot conditions [44]; for example, the 2003 European heatwaves were accompanied by serious drought, leading to a reduction in maize production by 13% [45].
Previous studies have investigated the change characteristics during maize-growing seasons over global or regional maize areas. For example, Feng et al. (2021) conducted a multi-index evaluation of compound dry and hot events during 1949–2012 over global maize areas; the results indicated that compound events based on different thresholds and different base periods show consistent growth patterns [40]. Lu et al. (2018), Wang et al. (2018), Guo et al. (2023) and Li et al. (2023) investigated spatial–temporal patterns of compound drought and hot events during the maize-growing seasons of recent decades over Chinese maize areas [46,47,48,49]. Furthermore, some studies were devoted to revealing the impacts of compound drought and hot events on maize yield. For example, Feng et al. (2019) proposed a multivariate model for assessing compound dry–hot events’ impacts on crop yield, and proved that the probability of maize yield reduction could increase when individual extreme drought or hot conditions change to compound dry–hot conditions [50]. Li et al. (2022) found that the magnitude of maize yield loss in northeast China caused by compound dry and hot stresses is higher than that of individual ones; thus, the compound effects of dry and hot stresses will be the main constraints on maize yield [29]. Although preliminary exploration has been conducted in compound drought and hot events related to maize, a systematical, well-targeted analysis of the future changes in compound drought and hot events related to maize is a vital and necessary study for ensuring maize production and food security.
In this study, future variations in compound drought and hot days (hereafter, CDHDs) occurring in maize-growing seasons during 2015–2100 are investigated over global maize areas under different future scenarios. We begin by investigating future changes in drought events and hot days in maize-growing seasons worldwide. Then, we identify CDHDs occurring in maize-growing seasons based on drought events and hot days, and examine the variations in their frequency and severity. We finally illustrate the difference between the future changes in CDHDs and general hot days to explore the special changing features of CDHDs under global warming.

2. Data and Methodology

2.1. Current Situation of Maize Production

We first introduce the current situation of maize production in order to show the key regions for maize, including key maize producers and key maize demanders, where maize production is of great importance for food security and trade. Compared to wheat and rice, maize is a more versatile multi-purpose crop: on the one hand, it provides food, feed and nutritional security in the developing world, and provides the most food calories for millions of people in some lower-income countries [51]. On the other hand, maize is a major source of livestock feed with a varied role as an industrial and energy crop in the developed world [42]. Therefore, we display the spatial distributions of the current situation of maize production, including planting area, production, the proportion in total food crop production (including wheat, rice and maize), population and food calorie demand from maize, as shown in Figure 1. And we also display the import/export of maize globally in 2021 in Table S1 to show the supply and demand of maize.
As shown in Figure 1, maize is widely planted around the world, including the Americas, Asia, Europe and Africa. The Americas, eastern Asia and southern Europe are the key maize producers, of which the USA and China have long dominated maize production. The proportion of maize production in total food crop production is relatively larger in the Americas and Africa, where maize production is important for food production and/or industry. Populations are concentrated in eastern China and northern India. As shown in Figure 1e, Latin America, Africa, India and China have a higher demand for maize to provide food calories, where maize plays an important role for food security and livelihoods. From Table S1, we find that Asia stands out as the key maize importer, especially eastern Asia. Africa is also a maize-importing region. North America and South America are the world’s largest exporters. With income growth and urbanization globally, food consumption and feed requirement will accelerate and propel the demand of maize; thereby, maize will play an increasingly important role in global agri-food systems and food/nutrition security [51,52].

2.2. Data

2.2.1. NEX-GDDP-CMIP6

The latest version of NASA Earth Exchange Global Daily Downscaled Projections (NEX-GDDP-CMIP6) is based on the GCM simulations of CMIP6 with downscaling and bias correction to generate a high-resolution (0.25° × 0.25°) dataset covering historical and future periods over a global scale (Table 1) [53]. The daily precipitation, daily mean temperature and daily maximum temperature for historical (1951–2014) and future (2015–2100) periods were obtained from 10 global climate models (GCMs) of NEX-GDDP-CMIP6 (Table S2). Four future scenarios were used—SSP1-2.6, SSP2-4.5, SSP3-7.0 and SSP5-8.5—corresponding to global warming levels of 2.2 °C, 3.3 °C, 4.3 °C and 5.1 °C at the end of the 21st century [54]. Following IPCC AR6, we selected three periods, 2021–2040, 2041–2060 and 2081–2100, to represent the near future, mid-future and far future, respectively.

2.2.2. GCAM Land Use Change Projection

Future maize-planting areas are obtained from the Global Change Assessment Model (GCAM) land use change projection dataset (Table 1). This dataset provides 32 plants’ planting area percentage projections from 2005 to 2100 in each 5-year period under 15 SSP-RCP scenarios; the spatial resolution is 0.05° × 0.05° [55]. Here, we adopt maize-planting area percentage data (including rainfed maize and irrigated maize) under SSP1-RCP2.6, SSP2-RCP4.5, SSP3-RCP6.0 and SSP5-RCP8.5. “Maize-planting grids” refer to the grids with a planting area percentage greater than 0. Because the temporal resolution of this dataset is 5 years, the planting area percentage in each 5-year period is assumed to be static. For example, the projection of maize-planting areas in 2030 is used for the period of 2028–2032. Detailed changes in maize-planting areas in the future are shown in Figures S1–S4 of the Supplementary Materials.

2.2.3. GGCMI Phase 3 Crop Calendar Dataset

Maize-growing season information was obtained from the GGCMI Phase 3 crop calendar dataset (Table 1). This dataset provides the planting date and maturity date of maize for each grid at a spatial resolution of 0.5° × 0.5° [56], including rainfed maize and irrigated maize, as shown in Figure 2. Based on this, the “maize-growing season” of a maize-planting grid is defined as “the period from maize planting date to maize maturity date” in this maize-planting grid. In other words, from this dataset, we can obtain the maize-growing season for each 0.5° × 0.5° grid. For example, the planting date and maturity date of maize in a given grid are 152 and 304; based on the definition, the “maize-growing season” of this grid is the duration from 1 June to 30 October in each year. We assume that the maize-growing season will remain the same in the future following the existing studies [57,58].

2.3. Methodology

This study aims to investigate the variations in compound drought and hot days (CDHDs) in maize-growing seasons during 2015–2100 under 4 future scenarios (SSP1-2.6, SSP2-4.5, SSP3-7.0 and SSP5-8.5) over global maize areas. In this study, a CDHD is defined as “the coincidence of a drought event and a hot day during maize-growing season”. Therefore, the methodology of CDHD identification can be divided into 3 steps: (1) identifying drought events in maize-growing seasons; (2) identifying hot days in maize-growing seasons; and (3) identifying CDHDs based on drought events and hot days. The methodology diagram is shown in Figure 3. Detailed calculation methods are shown below.

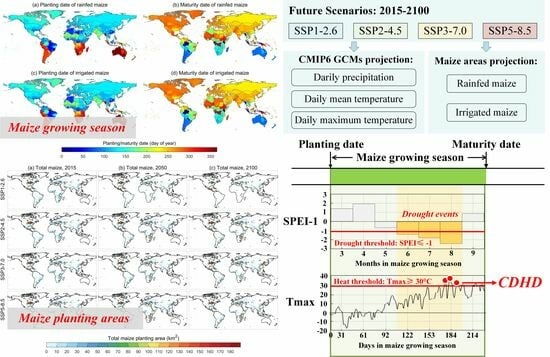
2.3.1. Drought Events

The Standardized Precipitation Evapotranspiration Index (SPEI) is employed in this study to trace drought events in maize-growing seasons, since it has been shown to be a suitable proxy of soil moisture and it is highly correlated with crops’ yield [59]. The SPEI is a measure of water surplus or deficits considering precipitation and potential evapotranspiration (PET) [60]. Due to the PET component, the SPEI is more sensitive to warming-induced droughts. In this study, a 1-month-scale SPEI is calculated for each month during 1951–2014 (historical period) and 2015–2100 (future period, under 4 SSPs) for each maize-growing grid; the calculation method is shown in “1.2 SPEI calculation method” of the Supplementary Materials. A drought event is defined as a monthly SPEI value smaller than −1.

2.3.2. Hot Days

Heat stress is frequent during maize-growing seasons and is harmful to yield. According to previous studies [61], daily maximum temperatures larger than 30 °C are used as the heat threshold in this study because it has been proven that heat stress greater than 30 °C can cause serious impacts on maize growth, including reducing net photosynthesis rates and hastening crop development, thus leading to a shortened maize-growing duration [62,63]. Based on this, a hot day is identified as a daily maximum temperature larger than 30 °C.
Here, we use heating degree days (HDDs, °C·day) to assess the severity of heat stress of a maize-growing season, considering the duration and severity of heat stress [64]. HDDs are given as
H D D s = i = 1 n T m a x , i T t h r e ,     T m a x , i > T t h r e               0                                         ,           T m a x , i T t h r e
where H D D s is the heating degree days, n is the number of days in the maize-growing season, T m a x , i is the daily maximum temperature of day i , and T t h r e is the heat threshold, which is 30 °C in this study.

2.3.3. CDHD

A compound drought and hot day (CDHD) is defined as the coincidence of a hot day and a drought event during a maize-growing season; in other words, a CDHD is a hot day that occurs within a monthly drought event. In this study, we investigate the future changes in the frequency and severity of CDHDs. The frequency of CDHDs ( C D H D f ) is the total number of CDHDs occurring within a maize-growing season. The severity of a CDHD includes the total severity ( C D H D t s ) and average severity ( C D H D a s ); C D H D t s and C D H D a s are given as
C D H D t s = i = 1 C D H D f 1 × S P E I i ( T m a x , i T t h r e T t h r e T b a s e )
C D H D a s = C D H D t s C D H D f
where C D H D f , C D H D t s and C D H D a s are the frequency, total severity and average severity of CDHDs in a maize-growing season, respectively. S P E I i is the value of the SPEI of the month that contains the C D H D i , T m a x , i is the daily maximum temperature of C D H D i , T t h r e is the heat threshold (30 °C), and T b a s e is the base temperature referring to the minimum biology temperature for maize, which is 10 °C according to Zhu et al. (2018) and He et al. (2022) [65,66].

3. Result

3.1. Drought and Heat in Maize-Growing Seasons

We first explore the changes in drought and heat in maize-growing seasons during 1951–2014 and 2015–2100 (under four SSPs). The total precipitation, total PET, average SPEI and drought events within maize-growing seasons are employed to reveal the variations in drought, hot days and HDDs within maize-growing seasons; a Mann–Kendall trend test and the Theil–Sen approach (MK-TSA) are used to test their trends and significance (calculation method of MK-TSA is shown in “1.3 Mann–Kendall trend test” of the Supplementary Materials), as shown in Figure 4. And to better understand the spatial heterogeneity of drought and heat, the spatial distributions of the total precipitation, total PET, average SPEI, drought events, hot days and HDDs in the near future (2021–2040), mid-future (2041–2060) and far future (2081–2100) are displayed in Figures S5–S10.
Drought in maize-growing seasons will be more frequent and serious in the 21st century, because the difference between precipitation and PET will expand gradually as global warming evolves, especially under high forcing pathways. The total precipitation in maize-growing season will decrease significantly by 0.10 mm/y under SSP1-2.6, while increasing significantly by 0.19 mm/y under SSP2-4.5; the trends under SSP3-7.0 and SSP5-8.5 are not significant (Figure 4a). As shown in Figure S5, southeastern Africa and southern and eastern Asia will have much more precipitation in maize-growing season than other croplands. As shown in Figure 4b and Figure S6, the total PET in the maize-growing season is projected to increase over nearly all maize areas under all four SSPs due to climate warming; the largest speed increase, 6.37 mm/y, will occur under SSP5-8.5. A larger total PET in maize-growing season will occur in central and southern Africa as well as India. As shown in Figure 4c, the SPEI will decrease significantly under all SSPs because the strong increase in PET will expand the water deficit, thereby intensifying droughts. The obvious changes in SPEI from the near future to the far future, shown in Figure S7, also reveal the dry trends over nearly all maize areas. Correspondingly, drought events in maize-growing season will increase significantly under all SSPs; the largest-magnitude increase will occur under SSP5-8.5, followed by SSP3-7.0, SSP2-4.5 and SSP1-2.6 (Figure 4d). By the end of the 21st century, global average drought events in maize-growing season will reach 1.2 months, 1.7 months, 2.6 months and 2.9 months under SSP1-2.6, SSP2-4.5, SSP3-7.0 and SSP5-8.5, respectively. From the spatial heterogeneity shown in Figure S8, we find that maize in southern Africa and Europe will suffer more droughts in its growing season.
Meanwhile, heat stress in maize-growing season will become more and more severe over the 21st century. As shown in Figure 4e and Figure S9, hot days in maize-growing season will increase significantly by 0.06 d/y, 0.28 d/y, 0.43 d/y and 0.56 d/y under SSP1-2.6, SSP2-4.5, SSP3-7.0 and SSP5-8.5, respectively. By the end of the 21st century, the global average hot days in maize-growing season will reach 63 days, 79 days, 92 days and 102 days under SSP1-2.6, SSP2-4.5, SSP3-7.0 and SSP5-8.5, respectively. Maize in southern Africa, the USA and South America will suffer more hot days in its growing season. HDDs represent the severity of heat stress. As shown in Figure 4f, the global average HDDs will increase significantly by 0.72 °C·d/y, 2.04 °C·d/y, 3.79 °C·d/y and 5.49 °C·d/y under SSP1-2.6, SSP2-4.5, SSP3-7.0 and SSP5-8.5, respectively. From the spatial heterogeneity shown in Figure S10, a strong increase in HDDs can be found over nearly all maize areas, especially under SSP2-4.5, SSP3-7.0 and SSP5-8.5. The strongest heat stress on maize will occur in the eastern USA, southern Africa and South America.
MK-TSA is used to test the trends of total precipitation, total PET and drought events in maize-growing season during 2015–2100 in each maize-planting grid, as shown in Figure 5. The total precipitation in maize-growing season will significantly increase/decrease over 24.9%/2.1%, 41.5%/16.5%, 35.6%/33.6% and 43.7%/32.3% of maize-planting areas under SSP1-2.6, SSP2-4.5, SSP3-7.0 and SSP5-8.5, respectively. A remarkable increase is shown in central Africa, the northwest coast of South America, India, eastern China, Southeast Asia and the eastern USA; a remarkable decrease is shown in Europe, Central America and the central USA (Figure 5a). Nearly all maize-planting areas (more than 99.9%) are projected to witness significant increases in total PET in maize-growing seasons under all SSPs; a strong increase will occur in central and southern Africa, India and eastern South America (Figure 5b). As shown in Figure 5c, drought events will increase significantly over 38.9%, 93.3%, 98.7% and 98.9% of maize-planting areas under SSP1-2.6, SSP2-4.5, SSP3-7.0 and SSP5-8.5, respectively. There is a remarkable increase in drought events in Europe, southern Africa, eastern South America and the northeastern USA, where the difference between precipitation and PET is projected to increase more strongly.
The trends of hot days and HDDs in maize-growing season during 2015–2100 are calculated for each maize-planting grid, as shown in Figure 6. Due to global warming, hot days and HDDs in maize-growing season are projected to increase in almost all maize-planting grids in the 21st century; areas with significant trends in hot days/HDDs account for 94.6%/95.9%, 97.6%/98.7%, 98.1%/99.1% and 98.3%/99.4% of the total maize-planting areas under SSP1-2.6, SSP2-4.5, SSP3-7.0 and SSP5-8.5, respectively. Trends under high forcing pathways are obviously stronger than those under low forcing pathways. Remarkable increases will occur in southern Africa, the northeastern USA, Europe and eastern China.

3.2. CDHDs in Maize-Growing Season

Changes in the frequency ( C D H D f ), total severity (   C D H D t s ) and average severity ( C D H D a s ) of CDHDs in maize-growing season during 1951–2014 and 2015–2100 (under four SSPs) are shown in Figure 7. Due to climate warming, all 10 GCMs project unanimous increases in C D H D f , C D H D t s and C D H D a s under all four SSPs, although at different speeds. A notable finding is that the CDHD trends under the four SSPs diverge more strongly after the 2050s: before the 2050s, the CDHD trends among the different SSPs are quite similar, while after the 2050s, the difference in CDHDs among the four SSPs expands substantially. The growth of CDHDs is projected to slow down and stagnate after the ~2050s under SSP1-2.6 due to the low emissions and more aggressive mitigations, while under the other three SSPs, CDHDs will keep increasing until the end of the 21st century at a stable or even increased speed, of which SSP5-8.5 has the fastest rise, followed by SSP3-7.0 and SSP2-4.5. The difference in CDHDs among different SSPs will reach its peak by the end of the 21st century; for example, by 2100, C D H D f will reach 68 days under SSP5-8.5, while this number is only 18 days under SSP1-2.6. From Figure 7, we can find that the CDHDs will increase gradually from the near future to the far future; we think that the projection of CDHDs in the near future is more realistic because of smaller data uncertainty compared to the far future. Therefore, we should pay immediate attention to CDHDs in the near future; related adaption measures should be prepared as soon as possible in response to increasing CDHD impacts under climate change.
Furthermore, we investigated the spatial distributions of the trends in C D H D f , C D H D t s and C D H D a s under the four SSPs, as shown in Figure 8. Generally, the spatial features of the trends are highly consistent among C D H D f , C D H D t s and C D H D a s . There is a significantly increasing trend of CDHDs over almost all maize-planting areas (more than 95%) in the future under SSP2-4.5, SSP3-7.0 and SSP5-8.5, while nearly half of maize-planting areas have no significant increasing trend for CDHDs under SSP1-2.6. Notably, we find a strong increase in CDHDs with increasing global warming levels. Under SSP5-8.5, C D H D f , C D H D t s and C D H D a s will increase significantly over more than 97.5% of the total maize-planting areas, of which more than 67.2% of the total maize-planting areas with C D H D f increasing by 5 days per decade. It is worth noting that a stronger increasing trend of CDHDs will occur in southern Africa, eastern South America, southern Europe and the eastern USA, where droughts and heat are projected to intensify more sharply in the future, especially under high forcing pathways. In addition, southern and eastern Asia, northern Europe and Australia will likely witness a slightly increasing trend of CDHDs.
The spatial distribution and probability density function (PDF) of the average C D H D f in the near, mid- and far future are presented in Figure 9. As shown in Figure 9a,d, in the near future, there is no significant difference in the spatial pattern of C D H D f among different SSPs, which is in agreement with the temporal changes’ feature in Figure 7a, C D H D f is less than 30 days over most maize-planting areas. As shown in Figure 9b,e, in the mid-future, C D H D f is still similar under different SSPs and larger than that in the near future; C D H D f is larger than 30 days over 13.7%, 18.4%, 9.8% and 12.5% of the total maize-planting areas under SSP1-2.6, SSP2-4.5, SSP3-7.0 and SSP5-8.5, respectively. As shown in Figure 9c,f, in the far future, substantial differences can be found in C D H D f among different SSPs; C D H D f will be amplified significantly with increasing global warming levels. C D H D f is larger than 30 days over 16.6%,60.8%, 84.4% and 92.6% of the total maize-planting areas under SSP1-2.6, SSP2-4.5, SSP3-7.0 and SSP5-8.5, respectively. Especially in the far future under SSP5-8.5, more than half of the total maize-planting areas (56.7%) will suffer CDHDs for more than 60 days in maize-growing season. For spatial heterogeneity, maize in southern Africa, eastern South America, southern Europe and the eastern USA will suffer much more CDHDs in maize-growing season. Among these regions, North America and South America are the most important maize exporters, especially the USA, Brazil and Argentina, whose maize production will deeply affect maize trade globally; thus, special attention should be paid to mitigating CDHD risks in these regions.
Besides C D H D f , we investigated the spatial distribution and PDF of the average C D H D a s in the near, mid and far future as well, which is presented in Figure 10. We found that the spatial pattern of C D H D a s is highly consistent with that for C D H D f in the three future periods. As shown in Figure 10a,d, in the near future, C D H D a s under different SSPs is similar, which is in agreement with the temporal changes’ feature in Figure 7c; C D H D a s is less than one over 67.2%, 57.2%, 81.5% and 79.5% of the total maize-planting areas under SSP1-2.6, SSP2-4.5, SSP3-7.0 and SSP5-8.5, respectively. As shown in Figure 10b,e, in the mid-future, C D H D a s will increase slightly compared to the previous period; C D H D a s is larger than one over 69.6%, 81.9%, 81.1% and 80.0% of the total maize-planting areas under SSP1-2.6, SSP2-4.5, SSP3-7.0 and SSP5-8.5, respectively. As shown in Figure 10c,f, for the far future, we found a notable difference in C D H D a s among the different SSPs, with a strong increase in C D H D a s with increasing global warming levels. C D H D a s is larger than 1 over 66.4%, 94.0%, 97.9% and 99.0% of the total maize-planting areas under SSP1-2.6, SSP2-4.5, SSP3-7.0 and SSP5-8.5, respectively. In particular, in the far future, C D H D a s will exceed two over 55.2% and 86.7% of the total maize-planting areas under SSP3-7.0 and SSP5-8.5. For spatial heterogeneity, maize in central and southern Africa, the eastern USA and eastern South America will suffer much stronger CDHDs in its growth process.

3.3. Comparison in Future Changes between CDHDs and General Hot Days

A CDHD is a kind of special hot day that coincides with drought events; hence, in this section, we divide hot days into two categories: CDHDs and general hot days (do not coincide with drought events). Then, we compare the difference between CDHDs and general hot days in order to explore if CDHDs will change differently. We separate drought events with or without CDHDs, and separate CDHDs and general hot days; then, we investigate their changes, respectively, as shown in Figure 11.
Figure 11a shows the changes in drought events with or without CDHDs during 2015–2100, as well as the proportion of drought events with CDHDs in total drought events. On global average, total drought events will significantly increase in the future under all four SSPs, which is displayed in Figure 4d. A notable finding is that drought events that contain CDHDs are the dominant component of drought events; furthermore, the increase in drought events that contain CDHDs are the dominant component of the increment of total drought events, while the change in drought events without CDHDs is quite weak. Therefore, the proportion of drought events with CDHDs in total drought events will significantly increase under all four SSPs, of which SSP5-8.5 has the fastest rise, followed by SSP3-7.0 and SSP2-4.5. By 2100, this proportion will reach 82.4%, 89.6%, 93.0% and 95.0% under SSP1-2.6, SSP2-4.5, SSP3-7.0 and SSP5-8.5, respectively. This result indicates that there will be more and more drought events containing hot days; by the end of the 21st century under SSP3-7.0 and SSP5-8.5, nearly all drought events will contain at least one hot day.
Figure 11b shows the changes in CDHDs and general hot days during 2015–2100 under the four SSPs, as well as the proportion of CDHDs in the total hot days. Generally, the changing features of Figure 11b are similar to Figure 11a; the total hot days will increase significantly in the future under all four SSPs, which is displayed in Figure 4e. It is worth noting that the increase in CDHDs is substantial, while the change in general hot days is quite weak; general hot days are even projected to decrease under SSP3-7.0 and SSP5-8.5. Therefore, the increase in total hot days is determined by the increase in CDHDs but not general hot days. Meanwhile, the proportion of CDHDs in total hot days will increase significantly under all four SSPs, of which SSP5-8.5 has the fastest rise, followed by SSP3-7.0, SSP2-4.5 and SSP1-2.6. By 2100, this proportion will reach 28.7%, 42.9%, 61.1% and 66.6% under SSP1-2.6, SSP2-4.5, SSP3-7.0 and SSP5-8.5, respectively. This result indicates that CDHDs will increase much faster than general hot days; in other words, hot days will tend to occur alongside drought events. Thus, CDHDs will gradually become the common form of heat stress, especially under high forcing pathways. From Figure 11, we can draw the conclusion that mitigations and adaptations that only consider drought or heat stress are not enough to cope with the impacts from continuously increasing compound drought and heat stresses; we should take drought and heat stress into overall consideration in response to their increasing correlations and concurrence.
Based on the analysis above, we demonstrate that CDHDs will increase faster than general hot days; almost all increments of hot days in the future will occur in the form of CDHDs but not general hot days. Here, we would like to investigate the difference in the daily maximum temperature (Tmax) between CDHDs and general hot days in order to explore if the Tmax of CDHDs will change differently. Firstly, we divide the Tmax into 11 levels, as shown in the legend of Figure 12a. Secondly, we calculate the average frequency of general hot days in each Tmax level during 2015–2100 under the four SSPs, as shown in the left part of the black vertical line in Figure 12. Thirdly, we calculated the average frequency of CDHDs in each Tmax level during 2015–2100 under the four SSPs, as shown in the right part of the black vertical line in Figure 12. Based on this, we can explore the differences between general hot days and CDHDs.
In general, we can clearly find that CDHDs will increase much faster than general hot days at all Tmax levels under all four SSPs. Under SSP1-2.6, as shown in Figure 12a and the first column of Figure 12e,f, general hot days are the main components of total hot days throughout the 21st century; general hot days with a Tmax greater than 34 °C will increase significantly, even though their trends are weak. CDHDs’ share in total hot days is much less than general hot days, and the CDHDs at all Tmax levels are projected to increase at a greater speed compared with that of general hot days. Under SSP2-4.5, as shown in Figure 12b and the second column of Figure 12e,f, general hot days will occur more than CDHDs throughout the 21st century; general hot days with a Tmax of 33–40 °C will increase significantly with slight trends. CDHDs at all Tmax levels will increase significantly with larger trends compared with that for general hot days.
Such comparisons show special features under SSP3-7.0 and SSP5-8.5. As shown in Figure 12c,d and the third and forth columns of Figure 12e,f, under SSP3-7.0 and SSP5-8.5, general hot days will increase first and then decrease with a turning point in the ~2050s, while CDHDs will keep increasing throughout the future. Thus, in the second half of the 21st century, CDHDs will gradually replace general hot days and become the dominant part of total hot days. Another noteworthy finding is that, under SSP3-7.0 and SSP5-8.5, general hot days with a Tmax less than 34 °C will significantly decrease with relatively larger trends compared with those under SSP1-2.6 and SSP2-4.5, while general hot days with a Tmax greater than 34 °C will increase significantly with relatively larger trends compared with those under SSP1-2.6 and SSP2-4. CDHDs at all Tmax levels will increase significantly with greater trends compared with that for general hot days, of which CDHDs with a Tmax greater than 40 °C have the fastest growth. These results indicate that under SSP3-7.0 and SSP5-8.5, CDHDs will gradually become the predominant form of hot day; extremely high temperatures will tend to occur in CDHDs but not general hot days.
From the analysis above, we know that, under SSP3-7.0 and SSP5-8.5, the proportion of CDHDs in total hot days will increase; meanwhile, the Tmax of CDHDs will be larger than the Tmax of general hot days. The reasons are as follows: Firstly, as shown in Figure 4d,e, both drought events and hot days in maize-growing season will increase under climate warming, leading to a substantial increase in the probability of hot days coinciding with drought events. Thus, CDHDs will increase, while general hot days will decrease. Similar findings can be found in Bevacqua et al.’s study (2022) [67], showing that local warming will be large enough in the future so that droughts will always coincide with hot extremes. Secondly, there exists a significant correlation between drought and heat [68]; when they occur simultaneously, both drought and heat will be intensified by land–atmosphere feedback [13], which is the reason why the Tmax of CDHDs is larger than the Tmax of general hot days.

4. Discussion

4.1. Comparation with Existing Studies

There are some studies investigating variations in compound dry and hot extremes occurring in the future on a global land scale, such as those by Wu et al. (2020), Zhang et al. (2022) and De Luca et al. (2023) [69,70,71]. Although they used different datasets and different event definitions, all of them projected a significant increase in compound dry and hot events during the 21st century over global land regions, which is consistent with the findings of this study. Some studies investigate compound drought and hot extremes over maize areas and/or in maize-growing season over the past decades. For example, Feng et al. (2021) provide a multi-index evaluation of compound dry and hot events of global maize areas during 1949–2012 [40]; however, they focus on events occurring over the whole period rather than in maize-growing season. Some studies use station observations of maize-growing season derived from weather bureaus when investigating compound drought and hot events, thus providing more realistic information [47,48]; this approach can be used on a regional scale where enough observation data can be obtained.
The differences between our work and previous studies are as follows: Firstly, compared with other studies that investigate compound drought and hot events occurring in the whole future period over all global land, this study first provides a comprehensive analysis on the future variations in compound drought and hot events occurring within a high-resolution-gridded maize-growing season over dynamic maize-planting areas on a global scale, aiming to provide well-targeted information for global maize production. Secondly, compared with studies that define compound drought and hot events based on meteorological thresholds, the definition of CDHDs in this study considers the drought and heat thresholds of maize, providing more practical information for risk management in maize production. Thirdly, this study compares the differences in the future changes between CDHDs and general hot days, revealing that under high forcing pathways, CDHDs will be the main threat to maize production rather than individual drought or heat.
Our results reveal the future changes in CDHDs in maize-growing seasons in the future under different socio-economic scenarios and highlight the difference in variation characteristics between CDHDs and general hot days, which could improve the understanding of how CDHDs will change under global warming and provide useful information for formulating targeted adaptation measures to reduce negative impacts. Also, we would like to provide an analysis framework for investigating future variations in compound extremes within crop-growing seasons worldwide.

4.2. Uncertainty and Limitations of this Study

This study is subjected to some uncertainties and limitations induced by the data and calculation methods, where we must pay special attention when interpreting the results.
First, although we use 10 downscaled CMIP6 GCMs in order to reduce uncertainties in climate variable projection, it should be noted that uncertainties from GCM simulations and downscaling will affect the accuracy of the results, especially in the far future. Therefore, further research can use larger GCM ensembles that contain more GCMs to provide a better range of results. And the development of climate projection technology will help to improve the accuracy of data.
Second, limited by data availability, we use a static maize-growing season for the future periods. Crop phenology is a predominant biological indicator of climate change; global warming can largely alter the seasonal timing of phenological events and the duration of growing seasons; thus, adjusting sowing dates and using late-maturing varieties are among the most important measures of climate change adaptation [72]. A recent study by Luo et al. (2022) shows that the maize phenological response to climate warming in China was weakened during 1981–2018 because of agricultural management, especially cultivar shifts [73]. Therefore, using a static maize-growing season in this study is a compromise to some extent, considering the impacts of both climate warming and agricultural management. Moreover, we look forward to available, high-quality maize-growing season projections that contain the impacts of climate change and anthropogenic factors, which can be used in our further research.
Thirdly, agricultural drought is a comprehensive phenomenon comprising precipitation shortages, evapotranspiration reduction and soil moisture deficits [74]. In this study, the SPEI is used as a drought indicator because it can reflect the impacts of both precipitation and temperature on droughts, and has been proven to be the most representative of soil moisture conditions [59]. However, agricultural drought is also influenced by other factors, such as irrigation facilities and techniques, the retention capacity of soil and the use of drought-resistant varieties. Therefore, further research can investigate drought by considering both natural and anthropogenic factors, which could better capture agricultural droughts in the crop-growing process.
Finally, maize in different growing stages has different sensitivities and tolerance to drought and heat; therefore, two identical droughts (or heats) can cause totally different impacts on maize if they occur in different growing stages. For example, drought that occurs at the end of the growing season will cause less of an impact on maize than drought that occurs at the key growing stages of maize (such as flowering), even though the two droughts have the same severity. However, limited by a lack of sufficient information, we do not further subdivide a growing season into different growing stages, but use consistent drought thresholds and heat thresholds for the whole growing season, which may introduce uncertainties into the results. In further research, we would like to try to consider difference threshold combinations of drought and heat for different growing stages to provide more precise results.

5. Conclusions

In this study, we provide a comprehensive, global-scale analysis of the variations in the frequency and severity of compound drought and hot days (CDHDs) that occur within maize-growing seasons during 2015–2100 under diverse future scenarios, including SSP1-2.6, SSP2-4.5, SSP3-7.0 and SSP5-8.5, based on downscaled CMIP6 GCM simulations. The main findings of this study are summarized as follows:
(1)
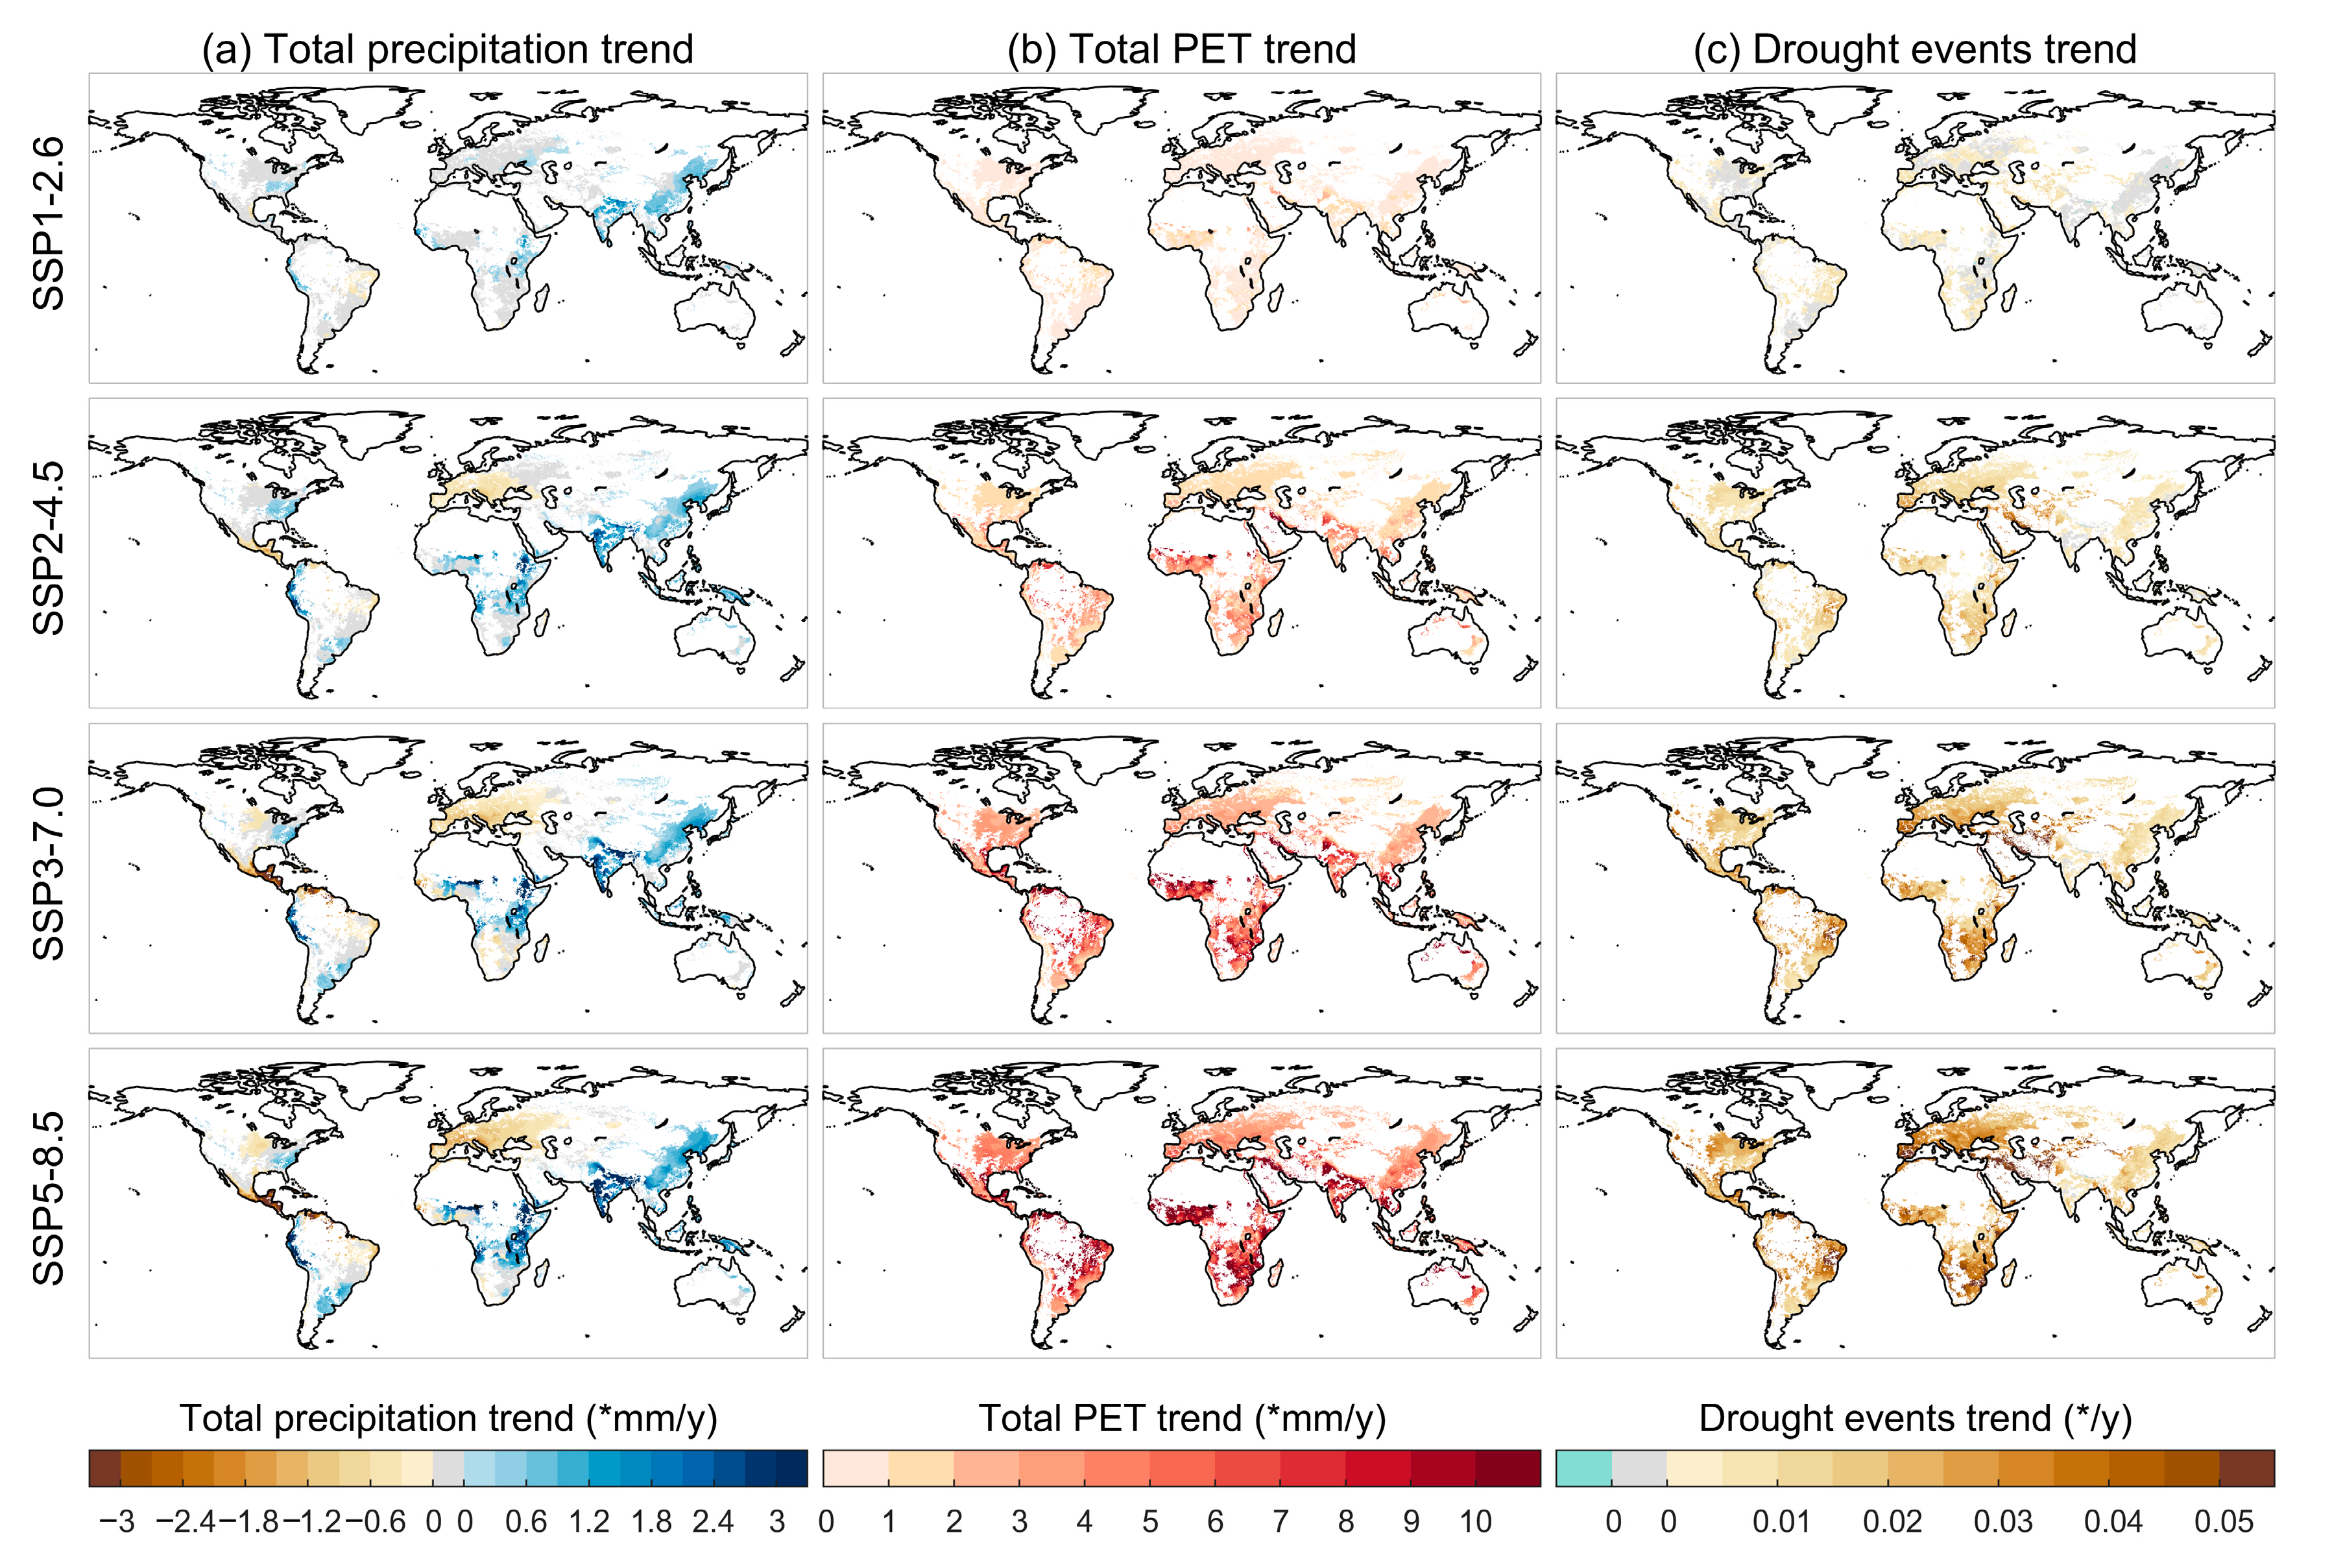
Drought events and hot days in maize-growing season are projected to increase due to climate warming. The largest magnitude of increase in drought events and hot days will occur under SSP5-8.5, followed by SSP3-7.0, SSP2-4.5 and SSP1-2.6. The substantial increase in PET caused by temperature rises will be the main driver of drought events increasing. A remarkable increase in drought events and hot days will occur in southern Africa, eastern South America, Europe and the northeastern USA.
(2)
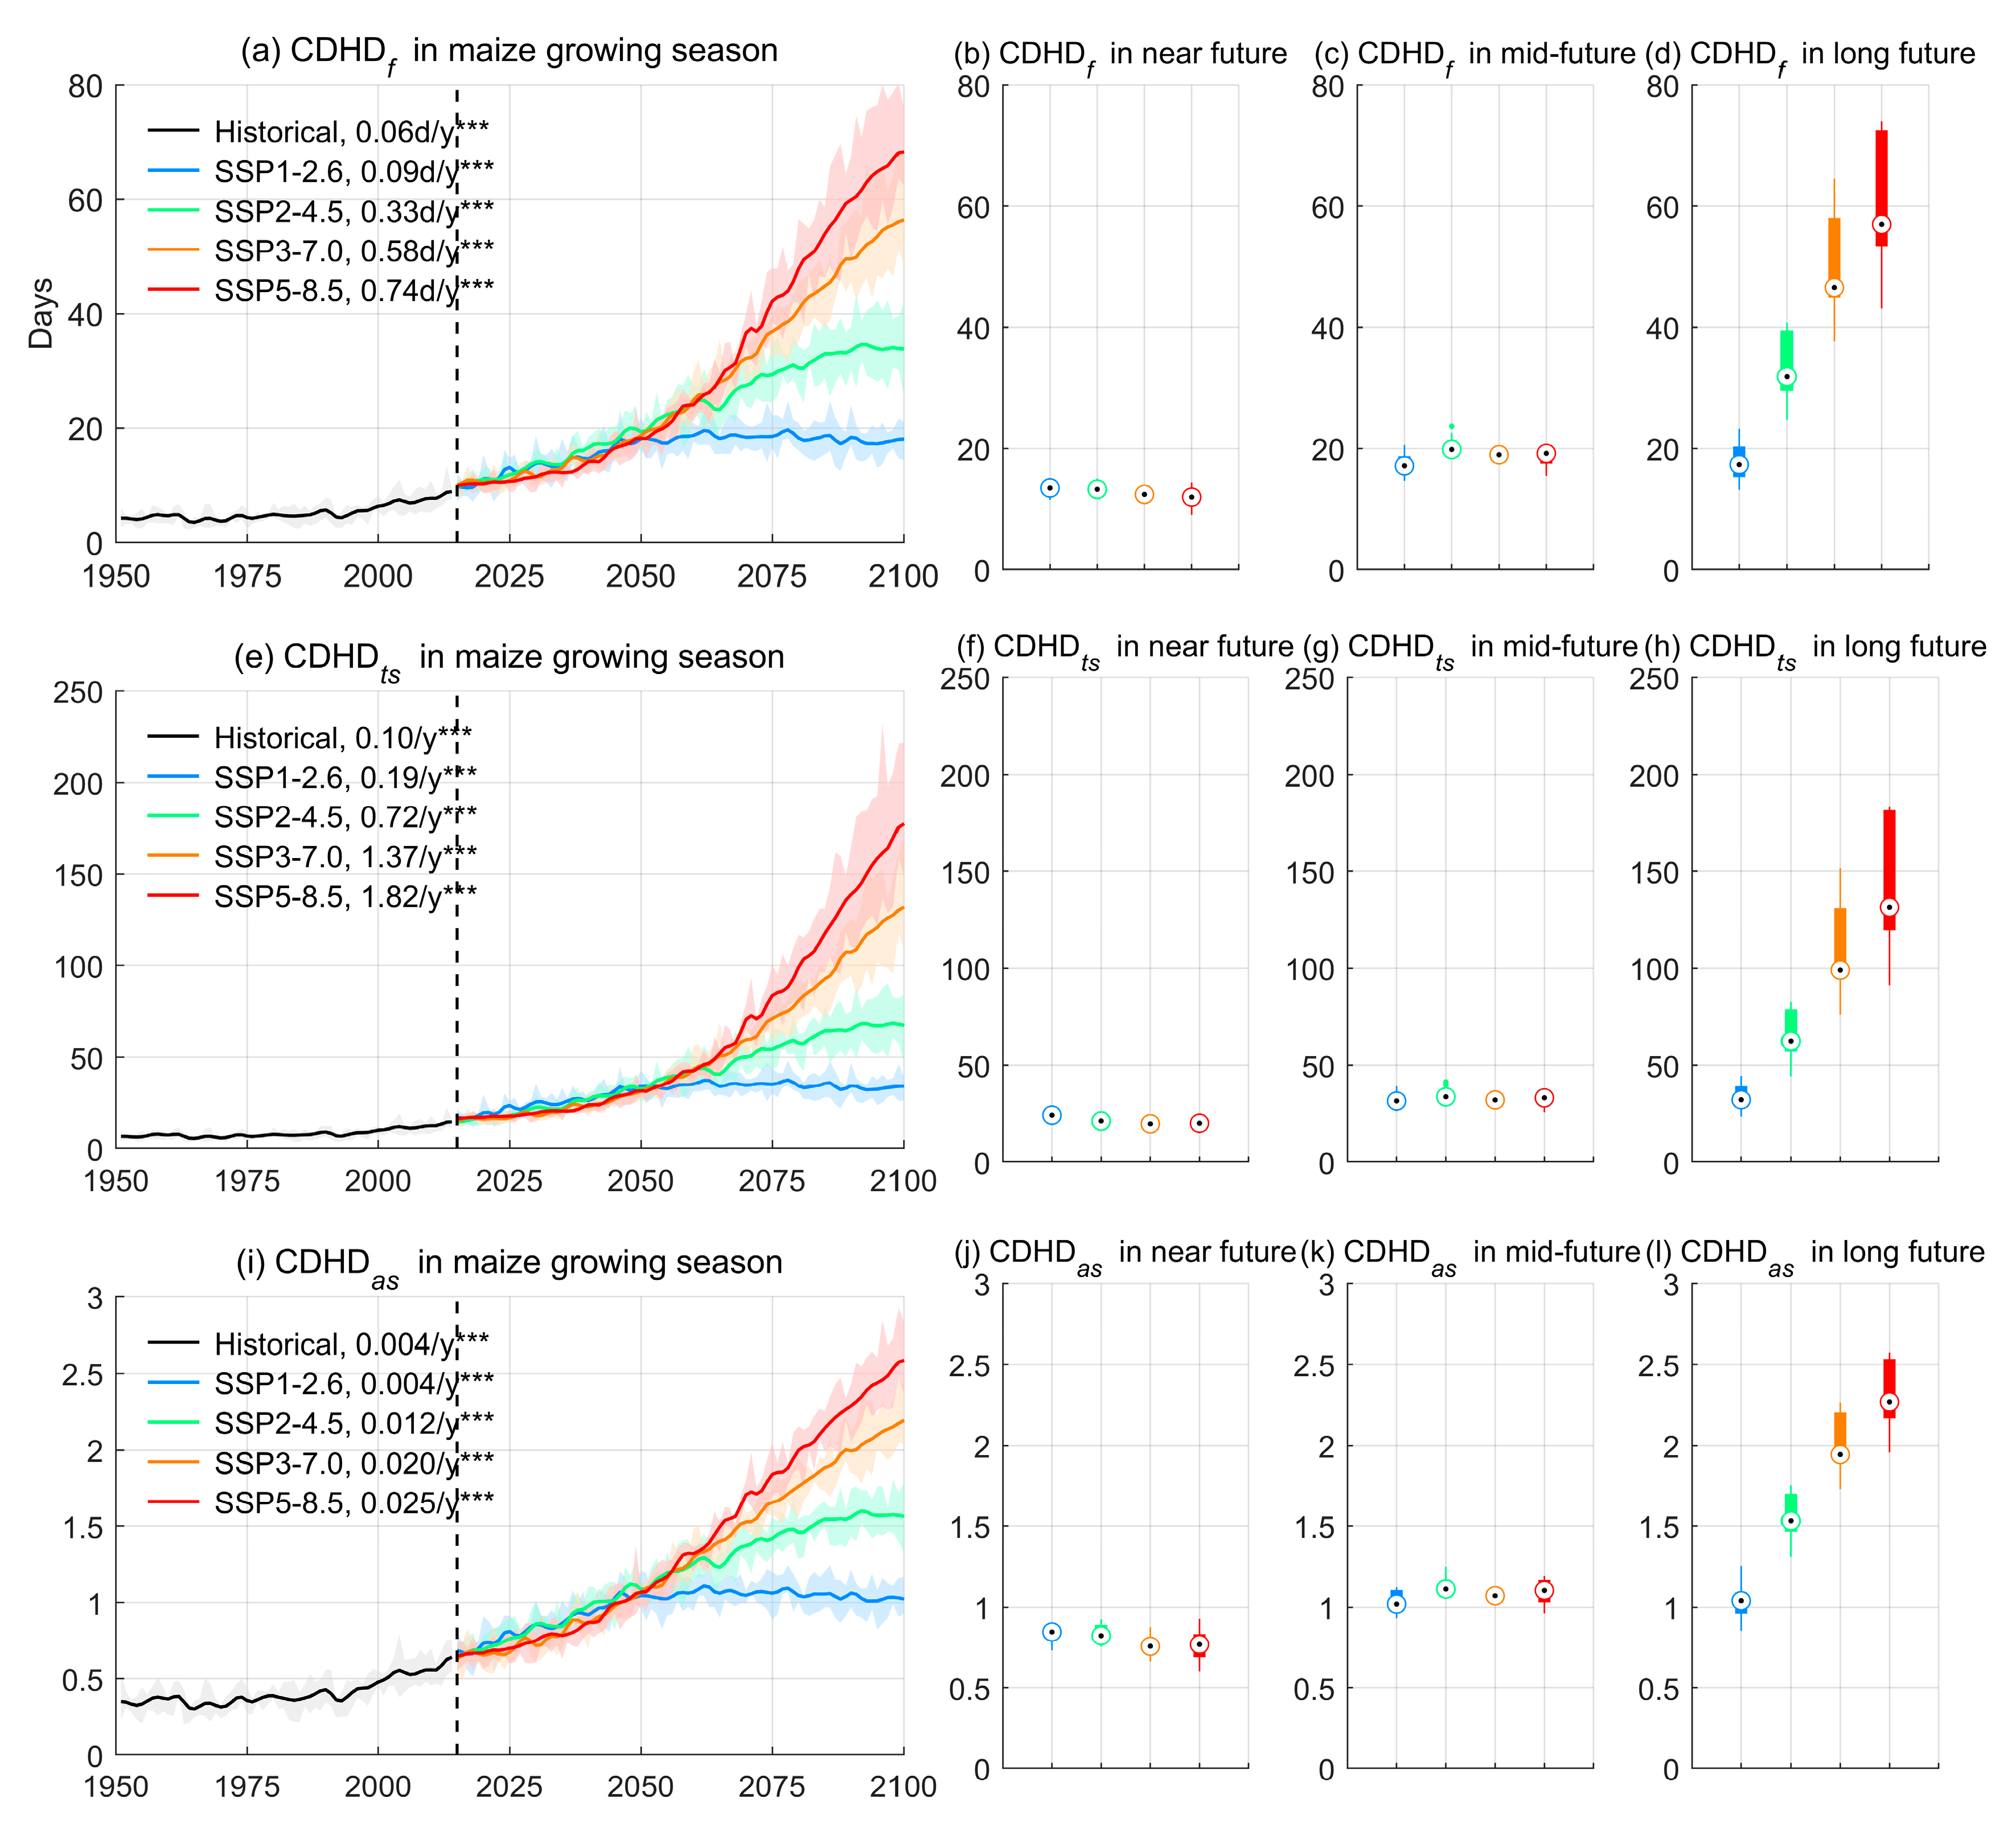
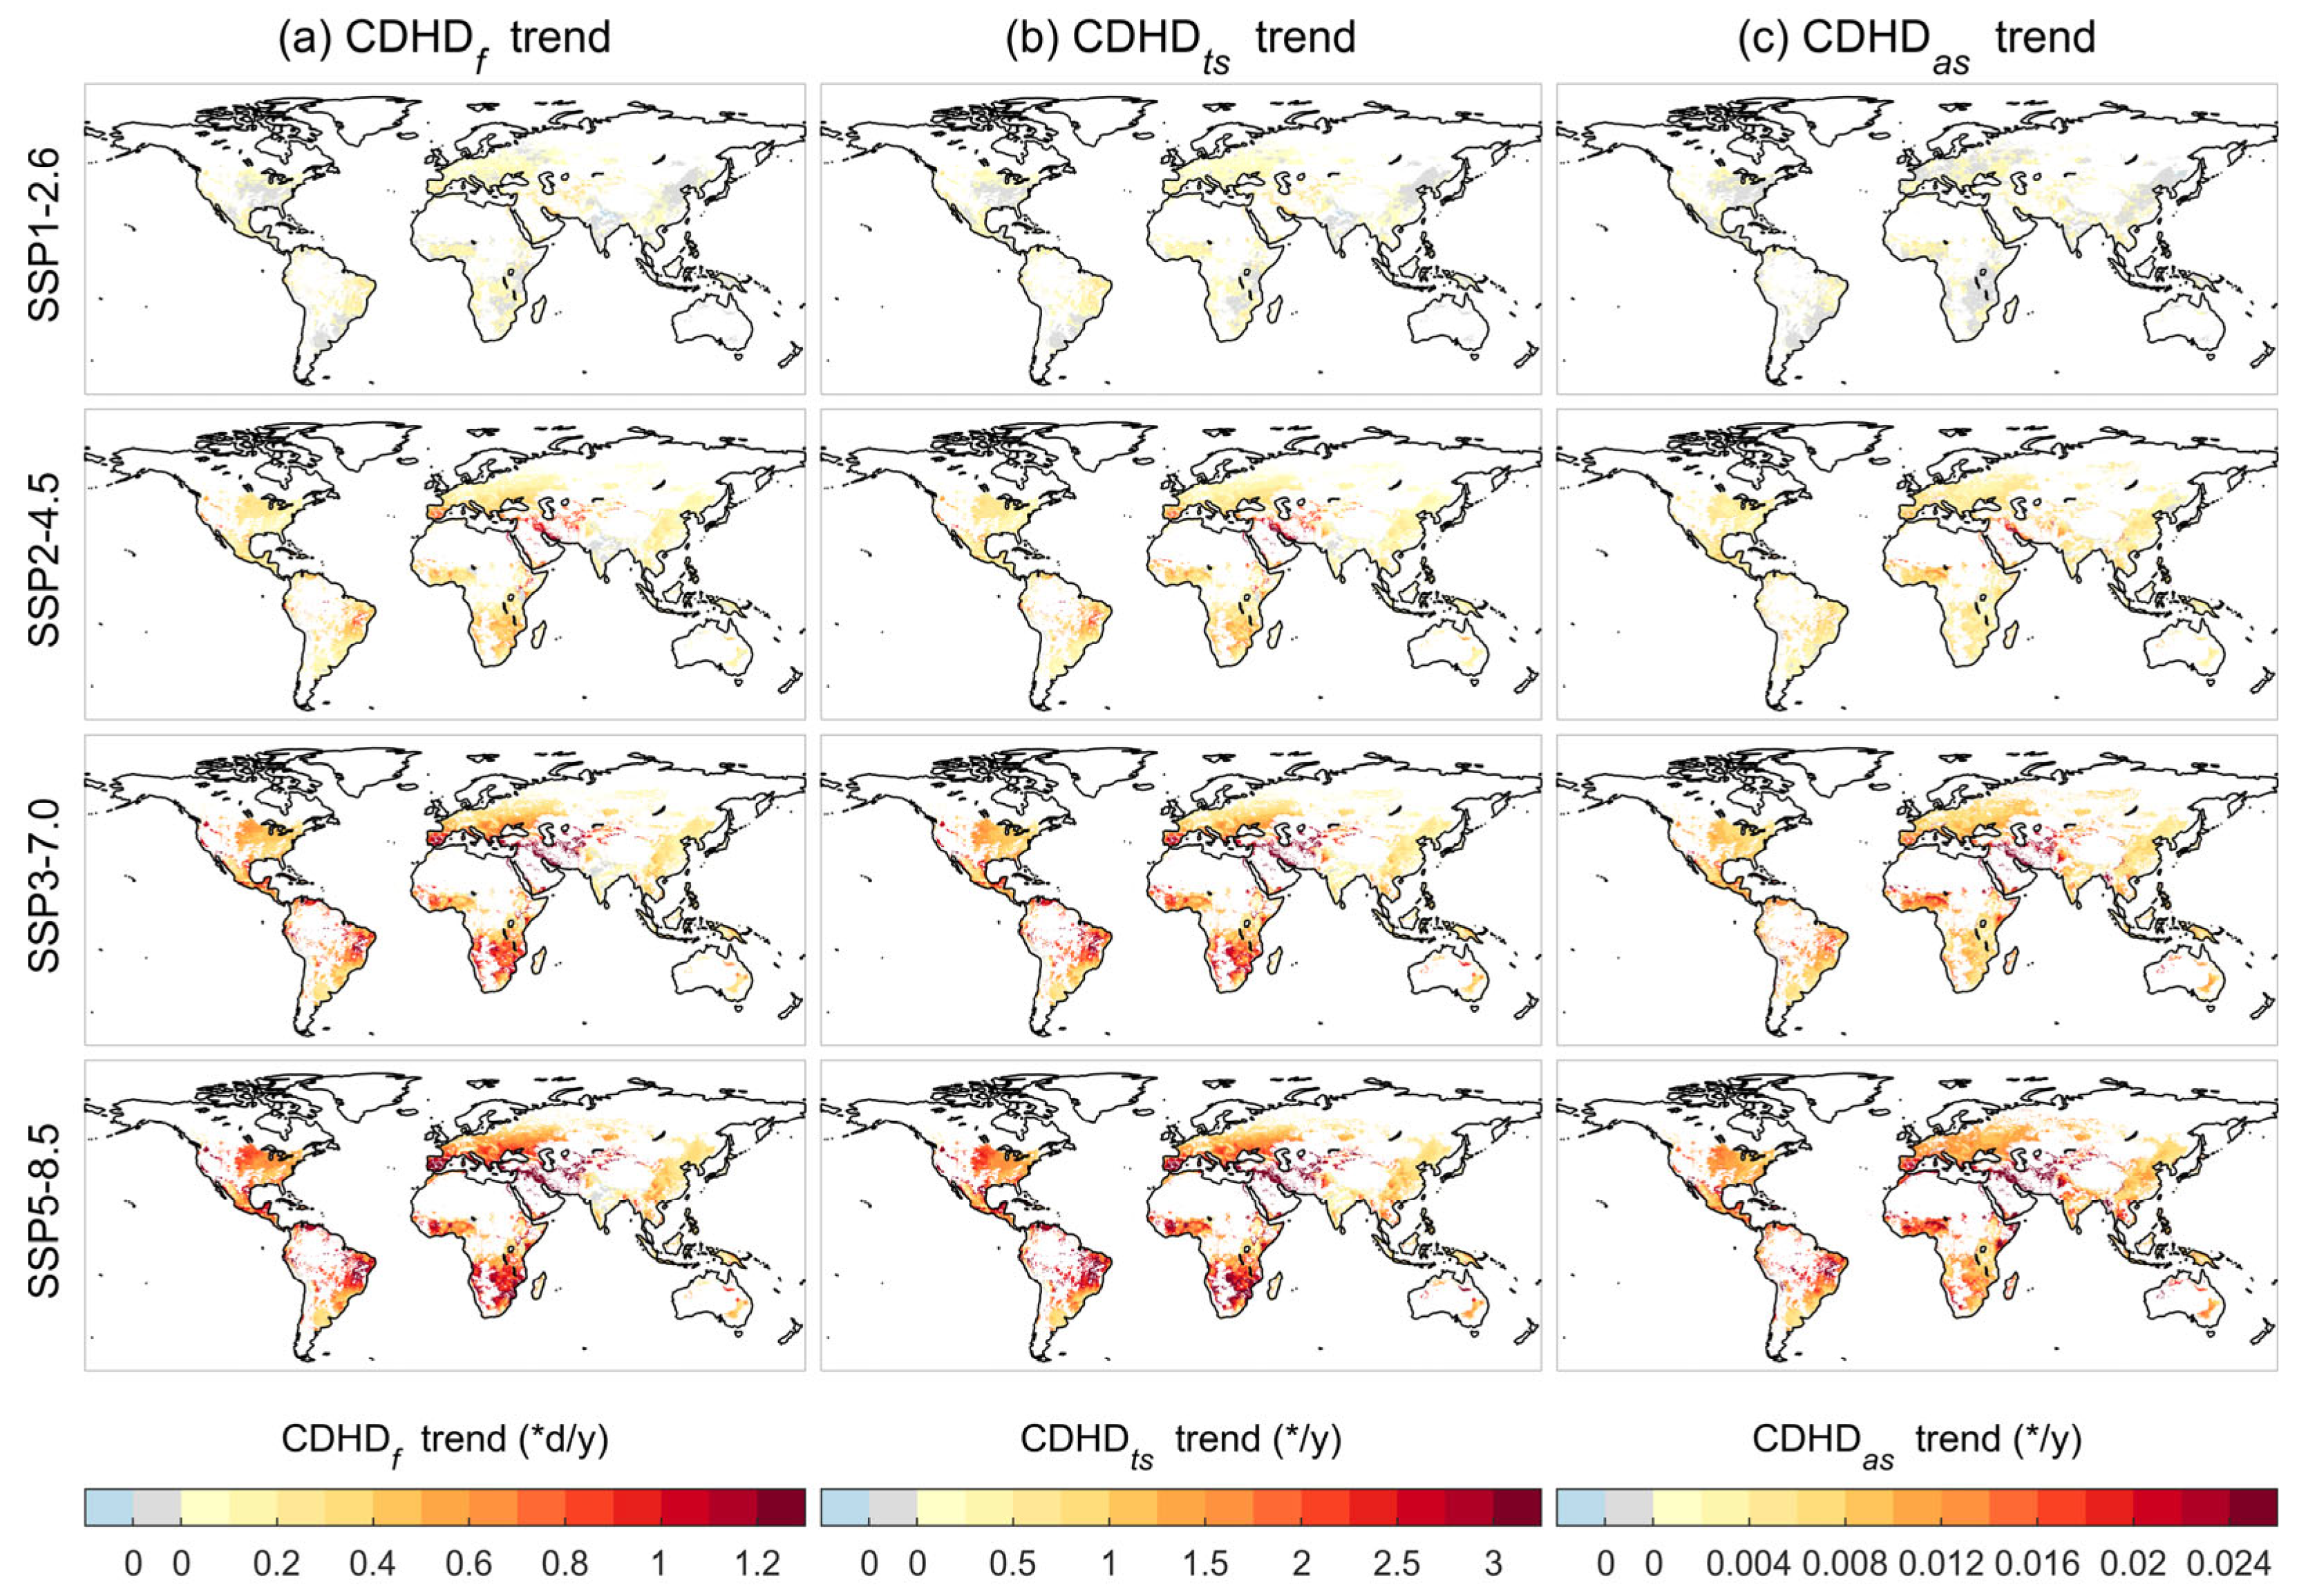
Significant increasing trends are found for both the frequency and severity of CDHDs in maize-growing seasons during 2015–2100 under all SSPs. The trends under the four SSPs diverge strongly after the 2050s, of which SSP5-8.5 has the fastest rise, followed by SSP3-7.0, SSP2-4.5 and SSP1-2.6. Stronger increasing trends of CDHDs will occur in southern Africa, eastern South America, southern Europe and the eastern USA, where both drought events and hot days are projected to grow more sharply in the future.
(3)
The increase in CDHDs will be much faster than that of general hot days (hot days that do not coincide with drought events); almost all increments of hot days in the future will occur in the form of CDHDs rather than general hot days. Therefore, compound dry and hot stresses will gradually become the predominant form of dry and heat stress on maize growth. Furthermore, under SSP3-7.0 and SSP5-8.5, CDHDs will become the main threat to maize rather than individual drought and heat; the daily maximum temperature of CDHDs will be greater than that of general hot days, and thus may cause even larger risks to maize production.

Supplementary Materials

The following supporting information can be downloaded at https://www.mdpi.com/article/10.3390/w16040621/s1. Calculation method 1: SPI calculation method. Calculation method 2: SPEI calculation method. Calculation method 3: Mann-Kendall trend test. Figure S1: Changes in rainfed maize, irrigated maize and total maize planting areas over 2015–2100 under SSP1-2.6, SSP2-4.5, SSP3-7.0 and SSP5-8.5. Numbers are the difference in planting area between 2100 and 2015. Figure S2: Global distribution of rainfed maize planting areas in 2015, 2050 and 2100 under SSP1-2.6, SSP2-4.5, SSP3-7.0 and SSP5-8.5. Figure S3: Global distribution of irrigated maize planting areas in 2015, 2050 and 2100 under SSP1-2.6, SSP2-4.5, SSP3-7.0 and SSP5-8.5. Figure S4: Global distribution of total maize planting areas in 2015, 2050 and 2100 under SSP1-2.6, SSP2-4.5, SSP3-7.0 and SSP5-8.5. Figure S5: Global distribution of total precipitation in maize growing season in near future, mid-future and long future under SSP1-2.6, SSP2-4.5, SSP3-7.0 and SSP5-8.5. Figure S6: Global distribution of total PET in maize growing season in near future, mid-future and long future under SSP1-2.6, SSP2-4.5, SSP3-7.0 and SSP5-8.5. Figure S7: Global distribution of average SPEI in maize growing season in near future, mid-future and long future under SSP1-2.6, SSP2-4.5, SSP3-7.0 and SSP5-8.5. Figure S8: Global distribution of drought events in maize growing season in near future, mid-future and long future under SSP1-2.6, SSP2-4.5, SSP3-7.0 and SSP5-8.5. Figure S9: Global distribution of hot days in maize growing season in near future, mid-future and long future under SSP1-2.6, SSP2-4.5, SSP3-7.0 and SSP5-8.5. Figure S10: Global distribution of HDD in maize growing season in near future, mid-future and long future under SSP1-2.6, SSP2-4.5, SSP3-7.0 and SSP5-8.5. Table S1: Regional maize import and export indicators (FAOStat, 2021). Table S2: GCMs from NEX-GDDP-CMIP6 used in this study. References [75,76,77,78,79] are cited in the Supplementary Materials.

Author Contributions

Y.H.: methodology, software, formal analysis, investigation, visualization, writing—original draft preparation. Y.Z.: writing—review and editing, supervision, funding acquisition. Y.D. writing—review and editing, supervision, funding acquisition. X.H.: writing—review and editing. J.F.: data curation, validation. All authors have read and agreed to the published version of the manuscript.

Funding

This study was supported by the National Natural Science Foundation of China (grant no. 42301100), the China Postdoctoral Science Foundation (grant no. 2023M733846), the National Key Research and Development Program of China (grant no. 2022YFD2300204), the China Meteorological Administration Special program for Innovation and Development (no. CXFZ2023J057), and the Basic Research Fund of the Chinese Academy of Meteorological Sciences (no. 2022Z001).

Data Availability Statement

The NEX-GDDP-CMIP6 data is openly available at https://www.nccs.nasa.gov/services/data-collections/land-based-products/nex-gddp-cmip6, reference number [53]. The GCAM Land Use Change Projection data is openly available at https://data.pnnl.gov/group/nodes/dataset/13192, reference number [55]. The GGCMI Phase 3 Crop Calendar Dataset is openly available at https://zenodo.org/record/5062513, reference number [56].

Conflicts of Interest

The authors declare no conflicts of interest.

References

  1. IPCC. Climate Change 2021: The Physical Science Basis. In Contribution of Working Group I to the Sixth Assessment Report of the Intergovernmental Panel on Climate Change; Masson-Delmotte, V., Zhai, P., Pirani, A., Connors, S.L., Péan, C., Berger, S., Caud, N., Chen, Y., Goldfarb, L., Gomis, M.I., et al., Eds.; Cambridge University Press: Cambridge, UK, 2021. [Google Scholar]
  2. Ren, F.; Trewin, B.; Brunet, M.; Dushmanta, P.; Walter, A.; Baddour, O.; Korber, M. A research progress review on regional extreme events. Adv. Clim. Chang. Res. 2018, 9, 161–169. [Google Scholar] [CrossRef]
  3. Richardson, D.; Black, A.S.; Irving, D.; Matear, R.J.; Monselesan, D.P.; Risbey, J.S.; Squire, D.T.; Tozer, C.R. Global increase in wildfire potential from compound fire weather and drought. npj Clim. Atmos. Sci. 2022, 5, 23. [Google Scholar] [CrossRef]
  4. Spinoni, J.; Naumann, G.; Carrao, H.; Barbosa, P.; Vogt, J. World drought frequency, duration, and severity for 1951–2010. Int. J. Climatol. 2014, 34, 2792–2804. [Google Scholar] [CrossRef]
  5. Perkins-Kirkpatrick, S.E.; Lewis, S.C. Increasing trends in regional heatwaves. Nat. Commun. 2020, 11, 3357. [Google Scholar] [CrossRef] [PubMed]
  6. Ceccherini, G.; Russo, S.; Ameztoy, I.; Marchese, A.F.; Carmona-Moreno, C. Heat waves in Africa 1981–2015, observations and reanalysis. Nat. Hazards Earth Syst. Sci. 2017, 17, 115–125. [Google Scholar] [CrossRef]
  7. Mbokodo, I.L.; Bopape, M.-J.M.; Ndarana, T.; Mbatha, S.M.S.; Muofhe, T.P.; Singo, M.V.; Xulu, N.G.; Mohomi, T.; Ayisi, K.K.; Chikoore, H. Heatwave Variability and Structure in South Africa during Summer Drought. Climate 2023, 11, 38. [Google Scholar] [CrossRef]
  8. Hari, M.; Tyagi, B. Investigating Indian summer heatwaves for 2017–2019 using reanalysis datasets. Acta Geophys. 2021, 69, 1447–1464. [Google Scholar] [CrossRef]
  9. Zeighami, A.; Kern, J.; Yates, A.J.; Weber, P.; Bruno, A.A. U.S. West Coast droughts and heat waves exacerbate pollution inequality and can evade emission control policies. Nat. Commun. 2023, 14, 1415. [Google Scholar] [CrossRef] [PubMed]
  10. Liu, J.; Ren, Y.; Tao, H.; Shalamzari, M.J. Spatial and Temporal Variation Characteristics of Heatwaves in Recent Decades over China. Remote Sens. 2021, 13, 3824. [Google Scholar] [CrossRef]
  11. AghaKouchak, A.; Cheng, L.; Mazdiyasni, O.; Farahmand, A. Global warming and changes in risk of concurrent climate extremes: Insights from the 2014 California drought. Geophys. Res. Lett. 2014, 41, 8847–8852. [Google Scholar] [CrossRef]
  12. Zscheischler, J.; Westra, S.; van den Hurk, B.J.J.M.; Seneviratne, S.I.; Ward, P.J.; Pitman, A.; AghaKouchak, A.; Bresch, D.N.; Leonard, M.; Wahl, T.; et al. Future climate risk from compound events. Nat. Clim. Chang. 2018, 8, 469–477. [Google Scholar] [CrossRef]
  13. Miralles, D.G.; Gentine, P.; Seneviratne, S.I.; Teuling, A.J. Land-atmospheric feedbacks during droughts and heatwaves: State of the science and current challenges. Ann. N. Y. Acad. Sci. 2019, 1436, 19–35. [Google Scholar] [CrossRef]
  14. Tripathy, K.P.; Mukherjee, S.; Mishra, A.K.; Mann, M.E.; Williams, A.P. Climate change will accelerate the high-end risk of compound drought and heatwave events. Proc. Natl. Acad. Sci. USA 2023, 120, e2219825120. [Google Scholar] [CrossRef] [PubMed]
  15. Wang, J.; Chen, Y.; Tett, S.F.B.; Yan, Z.; Zhai, P.; Feng, J.; Xia, J. Anthropogenically-driven increases in the risks of summertime compound hot extremes. Nat. Commun. 2020, 11, 528. [Google Scholar] [CrossRef]
  16. Libonati, R.; Geirinhas, J.L.; Silva, P.S.; Russo, A.; Rodrigues, J.A.; Belém, L.B.C.; Nogueira, J.; Roque, F.O.; DaCamara, C.C.; Nunes, A.M.B.; et al. Assessing the role of compound drought and heatwave events on unprecedented 2020 wildfires in the Pantanal. Environ. Res. Lett. 2022, 17, 015005. [Google Scholar] [CrossRef]
  17. Wang, A.; Tao, H.; Ding, G.; Zhang, B.; Huang, J.; Wu, Q. Global cropland exposure to extreme compound drought heatwave events under future climate change. Weather Clim. Extrem. 2023, 40, 100559. [Google Scholar] [CrossRef]
  18. Hao, Z.; AghaKouchak, A.; Phillips, T.J. Changes in concurrent monthly precipitation and temperature extremes. Environ. Res. Lett. 2013, 8, 034014. [Google Scholar] [CrossRef]
  19. Mazdiyasni, O.; AghaKouchak, A. Substantial increase in concurrent droughts and heatwaves in the United States. Proc. Natl. Acad. Sci. USA 2015, 112, 11484–11489. [Google Scholar] [CrossRef] [PubMed]
  20. Sarhadi, A.; Ausín, M.C.; Wiper, M.P.; Touma, D.; Diffenbaugh, N.S. Multidimensional risk in a nonstationary climate: Joint probability of increasingly severe warm and dry conditions. Sci. Adv. 2018, 4, eaau3487. [Google Scholar] [CrossRef]
  21. Wu, X.; Hao, Z.; Hao, F.; Zhang, X. Variations of compound precipitation and temperature extremes in China during 1961–2014. Sci. Total Environ. 2019, 663, 731–737. [Google Scholar] [CrossRef]
  22. Zhang, H.; Wu, C.; Yeh, P.J.F.; Hu, B.X. Global pattern of short-term concurrent hot and dry extremes and its relationship to large-scale climate indices. Int. J. Climatol. 2020, 40, 5906–5924. [Google Scholar] [CrossRef]
  23. Mukherjee, S.; Mishra, A.K. Increase in Compound Drought and Heatwaves in a Warming World. Geophys. Res. Lett. 2021, 48, e2020GL090617. [Google Scholar] [CrossRef]
  24. Tabari, H.; Willems, P. Global risk assessment of compound hot-dry events in the context of future climate change and socioeconomic factors. npj Clim. Atmos. Sci. 2023, 6, 74. [Google Scholar] [CrossRef]
  25. Ben-Ari, T.; Boé, J.; Ciais, P.; Lecerf, R.; Van der Velde, M.; Makowski, D. Causes and implications of the unforeseen 2016 extreme yield loss in the breadbasket of France. Nat. Commun. 2018, 9, 1627. [Google Scholar] [CrossRef]
  26. Feng, S.; Hao, Z. Quantifying likelihoods of extreme occurrences causing maize yield reduction at the global scale. Sci. Total Environ. 2020, 704, 135250. [Google Scholar] [CrossRef]
  27. Ribeiro, A.F.S.; Russo, A.; Gouveia, C.M.; Páscoa, P.; Zscheischler, J. Risk of crop failure due to compound dry and hot extremes estimated with nested copulas. Biogeosciences 2020, 17, 4815–4830. [Google Scholar] [CrossRef]
  28. Haqiqi, I.; Grogan, D.S.; Hertel, T.W.; Schlenker, W. Quantifying the impacts of compound extremes on agriculture. Hydrol. Earth Syst. Sci. 2021, 25, 551–564. [Google Scholar] [CrossRef]
  29. Li, E.; Zhao, J.; Pullens, J.W.M.; Yang, X. The compound effects of drought and high temperature stresses will be the main constraints on maize yield in Northeast China. Sci. Total Environ. 2022, 812, 152461. [Google Scholar] [CrossRef]
  30. Zhang, Y.; Hao, Z.; Zhang, Y. Agricultural risk assessment of compound dry and hot events in China. Agric. Water Manag. 2023, 277, 108128. [Google Scholar] [CrossRef]
  31. Gazol, A.; Camarero, J.J. Compound climate events increase tree drought mortality across European forests. Sci. Total Environ. 2022, 816, 151604. [Google Scholar] [CrossRef] [PubMed]
  32. Li, H.; Li, Y.; Huang, G.; Sun, J. Quantifying effects of compound dry-hot extremes on vegetation in Xinjiang (China) using a vine-copula conditional probability model. Agric. For. Meteorol. 2021, 311, 108658. [Google Scholar] [CrossRef]
  33. Bastos, A.; Orth, R.; Reichstein, M.; Ciais, P.; Viovy, N.; Zaehle, S.; Anthoni, P.; Arneth, A.; Gentine, P.; Joetzjer, E.; et al. Vulnerability of European ecosystems to two compound dry and hot summers in 2018 and 2019. Earth Syst. Dyn. 2021, 12, 1015–1035. [Google Scholar] [CrossRef]
  34. Gampe, D.; Zscheischler, J.; Reichstein, M.; O’Sullivan, M.; Smith, W.K.; Sitch, S.; Buermann, W. Increasing impact of warm droughts on northern ecosystem productivity over recent decades. Nat. Clim. Chang. 2021, 11, 772–779. [Google Scholar] [CrossRef]
  35. Yin, J.; Gentine, P.; Slater, L.; Gu, L.; Pokhrel, Y.; Hanasaki, N.; Guo, S.; Xiong, L.; Schlenker, W. Future socio-ecosystem productivity threatened by compound drought–heatwave events. Nat. Sustain. 2023, 6, 259–272. [Google Scholar] [CrossRef]
  36. Huang, M.; Zhai, P. Desertification dynamics in China’s drylands under climate change. Adv. Clim. Chang. Res. 2023, 14, 429–436. [Google Scholar] [CrossRef]
  37. Feng, S.; Hao, Z.; Zhang, Y.; Zhang, X.; Hao, F. Amplified future risk of compound droughts and hot events from a hydrological perspective. J. Hydrol. 2023, 617, 129143. [Google Scholar] [CrossRef]
  38. Otero, N.; Horton, P.; Martius, O.; Allen, S.; Zappa, M.; Weschler, T.; Schaefli, B. Impacts of hot-dry conditions on hydropower production in Switzerland. Environ. Res. Lett. 2023, 18, 064038. [Google Scholar] [CrossRef]
  39. Wu, D.; Hu, Z. Increasing compound drought and hot event over the Tibetan Plateau and its effects on soil water. Ecol. Indic. 2023, 153, 110413. [Google Scholar] [CrossRef]
  40. Feng, S.; Hao, Z.; Wu, X.; Zhang, X.; Hao, F. A multi-index evaluation of changes in compound dry and hot events of global maize areas. J. Hydrol. 2021, 602, 126728. [Google Scholar] [CrossRef]
  41. Zhang, L.; Ameca, E.I.; Cowlishaw, G.; Pettorelli, N.; Foden, W.; Mace, G.M. Global assessment of primate vulnerability to extreme climatic events. Nat. Clim. Chang. 2019, 9, 554–561. [Google Scholar] [CrossRef]
  42. Erenstein, O.; Jaleta, M.; Sonder, K.; Mottaleb, K.; Prasanna, B.M. Global maize production, consumption and trade: Trends and R&D implications. Food Secur. 2022, 14, 1295–1319. [Google Scholar] [CrossRef]
  43. Tesfaye, K.; Kruseman, G.; Cairns, J.E.; Zaman-Allah, M.; Wegary, D.; Zaidi, P.H.; Boote, K.J.; Rahut, D.; Erenstein, O. Potential benefits of drought and heat tolerance for adapting maize to climate change in tropical environments. Clim. Risk Manag. 2018, 19, 106–119. [Google Scholar] [CrossRef]
  44. Leonard, M.; Westra, S.; Phatak, A.; Lambert, M.; van den Hurk, B.; McInnes, K.; Risbey, J.; Schuster, S.; Jakob, D.; Stafford-Smith, M. A compound event framework for understanding extreme impacts. WIREs Clim. Chang. 2013, 5, 113–128. [Google Scholar] [CrossRef]
  45. Ciais, P.; Reichstein, M.; Viovy, N.; Granier, A.; Ogee, J.; Allard, V.; Aubinet, M.; Buchmann, N.; Bernhofer, C.; Carrara, A.; et al. Europe-wide reduction in primary productivity caused by the heat and drought in 2003. Nature 2005, 437, 529–533. [Google Scholar] [CrossRef]
  46. Lu, Y.; Hu, H.; Li, C.; Tian, F. Increasing compound events of extreme hot and dry days during growing seasons of wheat and maize in China. Sci Rep. 2018, 8, 16700. [Google Scholar] [CrossRef] [PubMed]
  47. Wang, L.; Liao, S.; Huang, S.; Ming, B.; Meng, Q.; Wang, P. Increasing concurrent drought and heat during the summer maize season in Huang-Huai-Hai Plain, China. Int. J. Climatol. 2018, 38, 3177–3190. [Google Scholar] [CrossRef]
  48. Guo, Y.; Zhang, J.; Li, K.; Aru, H.; Feng, Z.; Liu, X.; Tong, Z. Quantifying hazard of drought and heat compound extreme events during maize (Zea mays L.) growing season using Magnitude Index and Copula. Weather Clim. Extrem. 2023, 40, 100566. [Google Scholar] [CrossRef]
  49. Li, E.; Zhao, J.; Zhang, W.; Yang, X. Spatial-temporal patterns of high-temperature and drought during the maize growing season under current and future climate changes in northeast China. J. Sci. Food Agric. 2023, 103, 5709–5716. [Google Scholar] [CrossRef] [PubMed]
  50. Feng, S.; Hao, Z.; Zhang, X.; Hao, F. Probabilistic evaluation of the impact of compound dry-hot events on global maize yields. Sci. Total Environ. 2019, 689, 1228–1234. [Google Scholar] [CrossRef] [PubMed]
  51. Shiferaw, B.; Prasanna, B.M.; Hellin, J.; Bänziger, M. Crops that feed the world 6. Past successes and future challenges to the role played by maize in global food security. Food Secur. 2011, 3, 307–327. [Google Scholar] [CrossRef]
  52. Poole, N.; Donovan, J.; Erenstein, O. Viewpoint: Agri-nutrition research: Revisiting the contribution of maize and wheat to human nutrition and health. Food Policy 2021, 100, 101976. [Google Scholar] [CrossRef] [PubMed]
  53. Thrasher, B.; Wang, W.; Michaelis, A.; Melton, F.; Lee, T.; Nemani, R. NASA Global Daily Downscaled Projections, CMIP6. Sci. Data 2022, 9, 262. [Google Scholar] [CrossRef]
  54. Tabari, H.; Willems, P. Trivariate Analysis of Changes in Drought Characteristics in the CMIP6 Multimodel Ensemble at Global Warming Levels of 1.5°, 2°, and 3 °C. J. Clim. 2022, 35, 5823–5837. [Google Scholar] [CrossRef]
  55. Chen, M.; Vernon, C.R.; Graham, N.T.; Hejazi, M.; Huang, M.; Cheng, Y.; Calvin, K. Global land use for 2015–2100 at 0.05 degrees resolution under diverse socioeconomic and climate scenarios. Sci. Data 2020, 7, 320. [Google Scholar] [CrossRef]
  56. Jagermeyr, J.; Muller, C.; Ruane, A.C.; Elliott, J.; Balkovic, J.; Castillo, O.; Faye, B.; Foster, I.; Folberth, C.; Franke, J.A.; et al. Climate impacts on global agriculture emerge earlier in new generation of climate and crop models. Nat. Food 2021, 2, 873–885. [Google Scholar] [CrossRef]
  57. Liu, W.; Ye, T.; Jägermeyr, J.; Müller, C.; Chen, S.; Liu, X.; Shi, P. Future climate change significantly alters interannual wheat yield variability over half of harvested areas. Environ. Res. Lett. 2021, 16, 094045. [Google Scholar] [CrossRef]
  58. Qiao, S.; Liu, Z.; Zhang, Z.; Su, Z.; Yang, X. The heat stress during anthesis and the grain-filling period of spring maize in Northeast China is projected to increase toward the mid-21st century. J. Sci. Food Agric. 2023, 103, 7612–7620. [Google Scholar] [CrossRef] [PubMed]
  59. Tian, L.; Yuan, S.; Quiring, S.M. Evaluation of six indices for monitoring agricultural drought in the south-central United States. Agric. For. Meteorol. 2018, 249, 107–119. [Google Scholar] [CrossRef]
  60. Vicente-Serrano, S.M.; Beguería, S.; López-Moreno, J.I. A Multiscalar Drought Index Sensitive to Global Warming: The Standardized Precipitation Evapotranspiration Index. J. Clim. 2010, 23, 1696–1718. [Google Scholar] [CrossRef]
  61. Lobell, D.B.; Hammer, G.L.; McLean, G.; Messina, C.; Roberts, M.J.; Schlenker, W. The critical role of extreme heat for maize production in the United States. Nat. Clim. Chang. 2013, 3, 497–501. [Google Scholar] [CrossRef]
  62. Crafts-Brandner, S.J.; Salvucci, M.E. Sensitivity of Photosynthesis in a C4 Plant, Maize, to Heat Stress. Plant Physiol. 2002, 129, 1773–1780. [Google Scholar] [CrossRef] [PubMed]
  63. Parent, B.; Tardieu, F. Temperature responses of developmental processes have not been affected by breeding in different ecological areas for 17 crop species. N. Phytol. 2012, 194, 760–774. [Google Scholar] [CrossRef] [PubMed]
  64. Butler, E.E.; Huybers, P. Adaptation of US maize to temperature variations. Nat. Clim. Chang. 2012, 3, 68–72. [Google Scholar] [CrossRef]
  65. Zhu, X.; Troy, T. Agriculturally Relevant Climate Extremes and Their Trends in the World’s Major Growing Regions. Earth’s Future 2018, 6, 656–672. [Google Scholar] [CrossRef]
  66. He, Y.; Hu, X.; Xu, W.; Fang, J.; Shi, P. Increased probability and severity of compound dry and hot growing seasons over world’s major croplands. Sci. Total Environ. 2022, 824, 153885. [Google Scholar] [CrossRef] [PubMed]
  67. Bevacqua, E.; Zappa, G.; Lehner, F.; Zscheischler, J. Precipitation trends determine future occurrences of compound hot–dry events. Nat. Clim. Chang. 2022, 12, 350–355. [Google Scholar] [CrossRef]
  68. Zscheischler, J.; Seneviratne, S.I. Dependence of drivers affects risks associated with compound events. Sci. Adv. 2017, 3, e1700263. [Google Scholar] [CrossRef]
  69. Wu, X.; Hao, Z.; Tang, Q.; Singh, V.P.; Zhang, X.; Hao, F. Projected increase in compound dry and hot events over global land areas. Int. J. Climatol. 2020, 41, 393–403. [Google Scholar] [CrossRef]
  70. Zhang, Q.; She, D.; Zhang, L.; Wang, G.; Chen, J.; Hao, Z. High Sensitivity of Compound Drought and Heatwave Events to Global Warming in the Future. Earth’s Future 2022, 10, e2022EF002833. [Google Scholar] [CrossRef]
  71. De Luca, P.; Donat, M.G. Projected Changes in Hot, Dry, and Compound Hot-Dry Extremes Over Global Land Regions. Geophys. Res. Lett. 2023, 50, e2022GL102493. [Google Scholar] [CrossRef]
  72. Minoli, S.; Jagermeyr, J.; Asseng, S.; Urfels, A.; Muller, C. Global crop yields can be lifted by timely adaptation of growing periods to climate change. Nat. Commun. 2022, 13, 7079. [Google Scholar] [CrossRef]
  73. Luo, Y.; Zhang, Z.; Zhang, L.; Zhang, J.; Tao, F. Weakened maize phenological response to climate warming in China over 1981–2018 due to cultivar shifts. Adv. Clim. Chang. Res. 2022, 13, 710–720. [Google Scholar] [CrossRef]
  74. Łabędzki, L.; Bąk, B. Meteorological and agricultural drought indices used in drought monitoring in Poland: A review. Stoch. Environ. Res. Risk Assess 2015, 2, 3–14. [Google Scholar] [CrossRef]
  75. Thornthwaite, C.W. An Approach toward a Rational Classification of Climate. Geogr. Rev. 1948, 38, 55–94. [Google Scholar] [CrossRef]
  76. Mann, H.B. Nonparametric Tests Against Trend. Econometrica 1945, 13, 245–259. [Google Scholar] [CrossRef]
  77. Kendall, M.G. Rank Correlation Methods; Griffin: Oxford, UK, 1948. [Google Scholar]
  78. Sen, P.K. Estimates of the Regression Coefficient Based on Kendall’s Tau. J. Am. Stat. Assoc. 1968, 63, 1379–1389. [Google Scholar] [CrossRef]
  79. Theil, H. A rank-invariant method of linear and polynomial regression analysis. In Henri Theil’s Contributions to Economics and Econometrics: Econometric Theory and Methodology; Springer: Dordrecht, The Netherlands, 1992; pp. 345–381. Available online: https://link.springer.com/chapter/10.1007/978-94-011-2546-8_20 (accessed on 6 February 2024).
Figure 1. Global maize-planting areas in 2010 (a), maize production in 2010 (b), the proportion of maize production in total food crop production (c), population in 2022 (d) and food calorie demand from maize (e). Data for (ac) were obtained from SPAM 2010 (the latest high-resolution data on global scale, https://mapspam.info/data/, accessed on 1 June 2023). Data for (d) were obtained from LandScan (https://landscan.ornl.gov/, accessed on 1 June 2023). (e) is from Erenstein et al. (2022) [42].
Water 16 00621 g001
Figure 2. Planting date and maturity date of rainfed maize (a,b) and irrigated maize (c,d) at global scale, provided by GGCMI Phase 3 crop calendar dataset.
Water 16 00621 g002
Figure 3. Methodology of identifying CDHDs in maize-growing seasons.
Water 16 00621 g003
Figure 4. Global average total precipitation (a), total PET (b), average SPEI (c), drought events (d), hot days (e) and HDDs (f) in each maize-growing season during the historical period (1951–2014) and future period (2015–2100) (under SSP1-2.6, SSP2-4.5, SSP3-7.0 and SSP5-8.5). Solid lines represent 10-GCM ensemble averages; the shades represent the range between 25th and 75th percentiles of the 10-GCM ensemble. Trends are calculated based on MK-TSA, significance level: p < 0.1 *, p < 0.05 **, p < 0.01 ***.
Water 16 00621 g004
Figure 5. Spatial distribution of trends in total precipitation (a), total PET (b) and drought events (c) in maize-growing season during 2015–2100 under SSP1-2.6, SSP2-4.5, SSP3-7.0 and SSP5-8.5. Trends are calculated based on MK-TSA; blank regions indicate no maize-planting; gray indicates trends are not significant; other colors indicate trends are significant at p < 0.05.
Water 16 00621 g005
Figure 6. Spatial distribution of trends in hot days (a) and HDDs (b) in maize-growing season during 2015–2100 under SSP1-2.6, SSP2-4.5, SSP3-7.0 and SSP5-8.5. Trends are calculated based on MK-TSA; blank regions indicate no maize planting; gray indicates trends are not significant; other colors indicate trends are significant at p < 0.05.
Water 16 00621 g006
Figure 7. Global average C D H D f (a), C D H D t s   (e) and C D H D a s (i) in each maize-growing season during historical period (1951–2014) and future period (2015–2100) (under SSP1-2.6, SSP2-4.5, SSP3-7.0 and SSP5-8.5). Solid lines represent 10-GCM ensemble averages; the shades represent the range between 25th and 75th percentiles of 10-GCM ensemble. Trends are calculated based on MK-TSA, significance level: p < 0.1 *, p < 0.05 **, p < 0.01 ***. And the average C D H D f (bd), C D H D t s   (fh) and C D H D a s (jl) in near, mid- and long-term future.
Water 16 00621 g007
Figure 8. Spatial distribution of trends in C D H D f (a), C D H D t s (b) and C D H D a s (c) in maize-growing season during 2015–2100 under SSP1-2.6, SSP2-4.5, SSP3-7.0 and SSP5-8.5. Trends are calculated based on MK-TSA; blank regions indicate no maize planting; gray indicates trends are not significant; other colors indicate trends are significant at p < 0.05.
Water 16 00621 g008
Figure 9. Spatial distribution and the probability density function (PDF) of average C D H D f in near future (a,d), mid-future (b,e) and far future (c,f) under SSP1-2.6, SSP2-4.5, SSP3-7.0 and SSP5-8.5.
Water 16 00621 g009
Figure 10. Spatial distribution and the probability density function (PDF) of average C D H D a s in near future (a,d), mid-future (b,e) and far future (c,f) under SSP1-2.6, SSP2-4.5, SSP3-7.0 and SSP5-8.5.
Water 16 00621 g010
Figure 11. Global average drought events with and without CDHDs and the proportion of drought events with CDHDs in total drought events (a); global average CDHDs and general hot days (hot days that do not coincide with drought events), and the proportion of CDHDs in total hot days (b), during 2015–2100 under SSP1-2.6, SSP2-4.5, SSP3-7.0 and SSP5-8.5. Trends in proportion are calculated based on MK-TSA, significance level: p < 0.1 *, p < 0.05 **, p < 0.01 ***.
Water 16 00621 g011
Figure 12. Global average general hot days (hot days that do not coincide with drought events) and CDHDs at different levels of daily maximum temperature (Tmax) during 2015–2100 under SSP1-2.6, SSP2-4.5, SSP3-7.0 and SSP5-8.5 (ad). Trends in general hot days and CDHDs at different levels of Tmax are calculated based on MK-TSA, significance level: p < 0.1 *, p < 0.05 **, p < 0.01 *** (e,f).
Water 16 00621 g012
Table 1. Data used in this study.
DatasetVariablesTemporal ResolutionSpatial ResolutionDownload
NEX-GDDP-CMIP6Daily precipitation
Daily mean temperature
Daily maximum temperature
1. Daily
2. Period:
  • Historical: 1951–2014
  • Future: 2015–2100 (4 SSPs)
0.25° × 0.25°https://www.nccs.nasa.gov/services/data-collections/land-based-products/nex-gddp-cmip6 (accessed on 1 June 2023)
GCAM land use datasetMaize-planting area percentage1. Five-year resolution
2. Period: 2005–2100 (4 SSPs)
0.05° × 0.05°https://data.pnnl.gov/group/nodes/dataset/13192 (accessed on 1 June 2023)
GGCMI Phase 3 crop calendarMaize-planting date
Maize maturity date
Daily0.5° × 0.5°https://zenodo.org/record/5062513 (accessed on 1 June 2023)
Disclaimer/Publisher’s Note: The statements, opinions and data contained in all publications are solely those of the individual author(s) and contributor(s) and not of MDPI and/or the editor(s). MDPI and/or the editor(s) disclaim responsibility for any injury to people or property resulting from any ideas, methods, instructions or products referred to in the content.

