Article

Prediction Model of Water Abundance of Weakly Cemented Sandstone Aquifer Based on Principal Component Analysis–Back Propagation Neural Network of Grey Correlation Analysis Decision Making

1
School of Resources and Geosciences, China University of Mining and Technology, Xuzhou 221116, China
2
National Investment Hami Energy Development Co., Ltd., Hami 839000, China
*
Author to whom correspondence should be addressed.
Water 2024, 16(4), 551; https://doi.org/10.3390/w16040551
Submission received: 12 January 2024 / Revised: 1 February 2024 / Accepted: 7 February 2024 / Published: 10 February 2024

Abstract

:
At present, in the vast majority of coal mine production processes in China, the degree of hydrogeological exploration often lags behind geological exploration. The main difficulty in evaluating the water richness of coal seam top and bottom water-bearing beds is that the existing evaluation methods often rely on less hydrogeological investigation data. How to utilize the abundant geological exploration data in the mining area to appraise the water-rich distribution of sandstone aquifers is a feasible and challenging methodology. At present, some experts and scholars have tried to use multivariate factor analysis to solve the problem of water-richness evaluation, and they have achieved certain results, but there are some shortcomings: (1) The prediction results are mostly qualitative estimations of the water-richness grade, and there is a lack of quantitative analysis of the units-inflow; and (2) at present, the more advanced prediction methods, such as the back propagation (BP) neural network model, have the disadvantages of low accuracy, requiring many iterations, and slow convergence speed. Therefore, with geological exploration data of the 1503E working face of the Yili No.1 coal mine as the basis., this paper uses grey correlation analysis to screen out the factor indexes suitable for the evaluation of the water richness of a weakly cemented sandstone aquifer, and it combines principal component analysis (PCA) with a BP neural network. Based on the selected factor indexes, a prediction model of the water richness of a weakly cemented sandstone aquifer is established. The results show that compared with the existing methods, the prediction accuracy is higher and has a certain application value.

1. Introduction

Due to the special diagenesis and sedimentary environment, the coal measure strata composed of Jurassic and Cretaceous weakly cemented sandstones are widely distributed in the western mining areas of China. Their characteristics mainly include later diagenesis, lower strength, easier weathering, poor cementation, relatively higher porosity, and so on [1,2,3,4]. In the process of coal mining, because the strength of weakly cemented stratum is lower than that of the coal seam, and the stratum composition contains clay minerals, such as kaolinite, chlorite, and illite, and these clay minerals are easy to expand and disintegrate in water and show the characteristics of quicksand under hydrodynamic action, which has the risk of water and sand inrush [5], causing great safety hazards to mine production. Therefore, prediction of the water richness of weakly cemented sandstone aquifers is of great significance in guiding the safe production of coal mines.
At present, methods for appraising the water-rich properties of the water-bearing layer of the coal seam roof and floor mainly include the field pumping test technique (the unit water inflow method), the geophysical exploration method, and the multi-factor coupling analytical technique [6,7,8,9,10,11]. Among them, the geophysical exploration method has a volumetric effect and cannot avoid the ambiguity of the results, so it has certain limitations [12,13,14]. Many scholars at home and abroad believe that the multifactor coupling analysis methodology is one of the most scientific and reasonable appraisal methods under the current cognitive conditions [15,16,17], but its prediction process usually depends on the hydrological hole, and the prediction results are not significantly different from the analysis results of the field pumping test method. The on-site pumping test method is based on the theory of groundwater runoff. When pumping in the hole, the water volume and water level change are observed to obtain the unit water inflow of drilling, and the water-bearing strata are evaluated according to the relevant provisions in the “Detailed Rules for Coal Mine Water Control” [18], but more pumping holes are required. Therefore, Li Zhe [19] combined the units of water inflow with multi-factor coupling, introduced the BP neural network algorithm, took the units of water inflow as the water-rich prediction target, and comprehensively considered various water-rich influencing factors to construct a water-richness prediction model. However, the single BP neural network model has the disadvantages of low precision, many iterations, and slow convergence speed. Shi Longqing and Han Zhong et al. [17,20] utilized PCA-BP neurological network modelling to accurately predict the height of the water-conducting fracture zones and stabilized the source of water influx. The model is superior to the single BP neural network model in terms of stability and accuracy.
As per the drilling data of the 1503E working face of the Yili No.1 coal mine, this paper uses grey correlation analysis to screen out the factor indexes suitable for the evaluation of the water richness of a weakly cemented sandstone aquifer and combines PCA with BP neural network to establish a prediction model of the water richness of a weakly cemented sandstone aquifer based on the selected factor indexes.

2. Survey of the Research Area

There are 9 minable coal seams in the Yili No.1 mine area, namely 1 coal, 2 coal, 3 coal, 4-1 coal, 4-2 coal, 5 coal, 8 coal, 10 coal, and 12 coal, among which 3 and 5 coal are the main minable coal seams. The mine is located on the slope belt of the southern margin of the Ili Basin. The developed strata, from old to new, are the Middle-Upper Triassic Xiaoquangou Group (T2-3xq), the Middle Jurassic Xishanyao Formation (J2x), and the Toutunhe Formation (J2t), the Cretaceous Donggou Formation (K2d), the Neogene (N), and the Quaternary (Q).
The 1503E working face is the first working face in the east wing of the first mining area of the mine (see Figure 1). The south of the working face is not developed, the north is the 1504E upper crossheading, the east is the protective coal pillar of the minefield, the west is the protective coal pillar of the main roadway, the overlying 3 coal seam is not developed, and the underlying coal seam is not developed. The strike length of the working face is 3880 m, and the inclination width is 300 m. The average coal thickness is 20.00 m.
The groundwater aquifer group mainly includes the Quaternary loose sandy gravel layer, the Neogene sandstone aquifer, and the Jurassic fissure–pore confined aquifer. According to the exposed data of the mined working face and the analysis of the supplementary exploration data, the underground aquifers affecting the mining of the 1503E working face are mainly the Quaternary pore aquifer, the 3 coal roof weakly cemented sandstone aquifer II2 (the 3 top sand aquifer), and the 5 coal floor aquifer II4 (the 5 bottom sand aquifer).
Among them, the water-bearing stratum of weakly cemented sandstone on the roof of the No. 3 coal layer is situated between the No. 1 seams and the No. 3 seams, which is the direct water-filled water-bearing stratum on the top slab of No. 3 seams during mining. In light of the drilling data, it is located between coal 1 and coal 3, which is the immediate, filled, water-bearing stratum in the course of extracting the No. 3 coal seam. The thickness of the water-bearing layer is 2.19~59.77 m, with an average of 14.75 m. The lithology is mainly weakly cemented coarse sandstone and gravelly coarse sandstone, which has the characteristics of late diagenetic time, poor cementation, large plastic deformation, low strength, good permeability, easy weathering, and so on.

3. The Selection of Influencing Factors to Characterize the Water Abundance of Weakly Cemented Sandstone Aquifers

3.1. Related Factor Indicators

3.1.1. Layers of Sand–Mud Interaction nh

The sandstone and mudstone in the study area are mostly interbedded with thick and thin layers. In conditions where the sandstone thickness is the same, the greater the number of interbedded layers, the worse the hydraulic connection of the sandstone and the ability to give water. On the contrary, the greater the number of interbedded layers, the better the hydraulic connection of the sandstone and the ability to give water.

3.1.2. Sand–Mud Ratio nsn

Under the condition of the same thickness as the aquifer, the sand mudstone is presented in the form of interbedded layers. The thickness ratio of the sand mudstone is different, and the water richness is also different. In addition, the sandstone is generally brittle in the process of stress realization and failure, and cracks will be produced. However, the mudstone is generally plastic in the process of stress deformation, and cracks will not be produced. The proportion of sand and mud can reflect the development of fractures in the water layer somewhat. The more cracks, the better the water storage.

3.1.3. Equivalent Thickness of Sandstone Sdx

The substance of the water-filled aquifer is equal to the sum of the substance of fine-grained sandstone, medium-grained sandstone, and coarse sandstone in the water-bearing stratum. Sandstones with different grain sizes have dissimilar water richness. The larger the particle size of the sandstone, the greater the water richness. Therefore, to distinguish the influence of sandstone aquifers with different grain sizes on water richness, the three sandstone thicknesses are converted into the equivalent thickness of sandstone as the aquifer thickness. The calculation method is as follows:
L = (a + 0.8b + 0.6c)
In the formula, L is the equivalent aquifer thickness (m), a is the thickness of coarse sandstone (m), b is the thickness of medium sandstone (m), and c is the thickness of fine sandstone (m).

3.1.4. Buried Depth of Aquifer H

The underground rock strata will produce cracks in the process of the influence of ground stress, and the in situ stress increases nonlinearly with the increase in the buried depth. The greater the depth of the aquifer, the greater the geopathic stress, and the increase in geopathic stress will, in turn, lead to an increase in the development of fractures, and the water richness will increase with the increase in the development of fractures.

3.1.5. Core Recovery V

The core retrieval percentage is the ratio of the length of the core drilled to the length of the corresponding actual drilling footage, and it is an indicator of the integrity of the rock mass and the degree of rock fracture intersections. In general, the degree of fracture intersections will increase as the core take rate decreases, and the increase in fracture intersections will increase the likelihood of fracture connectivity, which will result in improved groundwater runoff conditions and increased water enrichment.

3.1.6. The Average Single-Layer Thickness of Sandstone Sdc

The average single-layer thickness of sandstone can represent the size of the water storage space to a certain extent. When other conditions remain unchanged, the larger the mean monolayer thickness of sandstone, the greater the water reservoir space and the greater the enrichment of the water.

3.1.7. Number of Sandstone Layers nc

When other conditions remain unchanged, the more sandstones are layered, the greater the likelihood of aquifer fracture development and the greater the water enrichment.

3.2. Factor Index Quantification

According to the selection of relevant factor indicators in Section 3.1, the relevant drilling data in the study area are quantified, and the statistics are sorted out as follows in Table 1. Furthermore, the thematic map of factor indicators is drawn in combination with Surfer technology (see Figure 2). To ensure the accuracy of the subsequent model construction, this paper expands and adds the relevant data of 5 coal based on 3 coal roof aquifers, for a total of 25 sets of borehole data.

3.3. Factor Index Screening Based on Grey Correlation Analysis

Grey correlation analysis is a kind of data analysis technology in grey system theory [21,22,23] that is mainly designed to analyze the extent of the association between target parameters and control factors in a system. The basic idea is based on the actual data between the target parameters and the various control factors, and the geometric shape proximity between the data curves is studied by establishing a mathematical model, which is the correlation degree. The higher the geometric proximity, the greater the grey correlation between the two.
The computational steps for grey correlation analysis are as below:
  • Select the target parameter as the reference sequence X0 = (x01, x02, …, x0n), and the control factor as the comparison sequence Xi = (xi1, xi2, …, xin), where n is the number of data groups, i is the i-th control factor, i [ 1 , m ] , and m is the number of control factors;
  • The initial value method is used to non-dimensionalize the above sequence, and the following is obtained: X j = X j / x j 1 = ( x j 1 , x j 2 , , x j n ) , j [ 0 , m ] ;
  • Obtain the grey correlation coefficient ( ξ j n ) between the above dimensionless reference series and the comparison series:
    ξ i n = M i n + υ M a x Δ i n + υ M a x
    In the formula, Δ i n is the absolute difference between the reference sequence and each comparison sequence, Δ i n = | x 0 n - x i n | , Min is the minimum value in Δ i n , and Max is the maximum value. v is the resolution coefficient, usually v = 0.5;
  • Calculate the correlation degree ri:
    r i = 1 n n = 1 n ξ i n
According to the above grey correlation analysis and calculation method, the data in Table 1 are analyzed, the correlation degree between the unit water inflow and the selected factors is obtained, and the correlation degree is sorted, as shown in Table 2.
As can be seen from the results of Table 2, the correlation between the indicators of the relevant factors and the units of water influx is more than 0.8, indicating that the selected relevant factor index can well reflect the changing state of the units of water inflow.
In summary, the layers of sand–mud interaction nh, the sand–mud ratio nsn, the equivalent thickness of sandstone Sdx, the buried depth of aquifer H, the core recovery V, the average single-layer thickness of sandstone Sdc, and the number of sandstone layers nc are selected as the input units of the PCA-BP neural network model.

4. Prediction Method for Water Abundance Based on the PCA-BP Neural Network Model

4.1. Principal Component Analysis (PCA)

Principal component analysis (PCA) is a statistical analysis approach that integrates data analysis, feature extraction, and data compression [24,25]. Its basic idea is to transform the complex, multi-dimensional correlation factor index into a few independent comprehensive control factors through a linear transformation. PCA can remove the correlation between factor indexes, remove redundant information from sample data, filter data noise, reduce model input, reduce the complexity of the model’s operation, scale up the precision of the predictive model, and make the prediction results more accurate [26,27].

4.1.1. Principle of Principal Component Analysis

  • Generate the variable matrix of each factor index E = ( e p q ) m × n ( E 1 , E 2 , , E n ) , E n = ( e 1 n , e 2 n , …, e m n )T, where p [ 0 , m ] and q [ 0 , n ] ; m and n represent the number of datasets and the number of factor indicators, respectively.
  • The correlation analysis is carried out after the above variable matrix is standardized, and the correlation between the influencing factors is preliminarily determined so as to further determine the necessity of principal component analysis.
    Matrix standardization:
    E = E p q - E q ¯ S D q
    In the above formula, E q ¯ is the mean of the column vector, E q ¯ = ( 1 n ) p = 1 m E p q , and S D q is the standard deviation of the column vector, S D q = p = 1 m ( E p q - E q ¯ ) / ( m - 1 ) , where p [ 0 , m ] and q [ 0 , n ] ; m and n represent the number of datasets and the number of factor indicators, respectively.
    Correlation coefficient calculation:
    r ( E a , E b ) = k = 1 m ( e k a - e k a ¯ ) ( e k b - e k b ¯ ) k = 1 m ( e k a - e k a ¯ ) 2 k = 1 m ( e k b - e k b ¯ ) 2
    In the formula, E a and E b are the a-th column vector and the b-th column vector in the variable matrix E , respectively, a , b [ 1 , n ] ; n represents the number of influencing factors.
  • Based on the variable correlation matrix, the principal component feature matrix is generated using the PCA algorithm, and the accumulated percentage contribution of each principal component to the influencing factors is calculated.
  • Analyze the cumulative proportion of principal components to determine whether the accumulating contribution rate meets the information extraction accuracy setting requirements (conventionally set at 80%). If it meets the requirements, the principal components with a cumulative variance contribution of less than 80% are discarded, and the remaining principal components are calculated as follows (see Formula (6)). Generate j ( j [ 1 , n ] ) new principal components to ensure that it can represent most of the information of the original variable:
    F j = c 1 j E 1 + c 2 j E 2 + + c n j E n
    Need to meet the conditions:
    • cov ( F i , F j ) = 0 , i j , i , j [ 1 , n ] ;
    • var ( F 1 ) > var ( F 2 ) > > var ( F j ) ;
    • c 1 j 2 + c 2 j 2 + + c n j 2 = 1 , j = 1 , 2 , , n .
  • Constitute the new principal component into the matrix F = ( F 1 , F 2 , , F j ) , Fj = (f1j, f2j, …, fmj)T, where fmj represents the value of the j-th new principal component in the m-th set of data.

4.1.2. Construction of the Principal Component Analysis Model

The data in Table 1 are modeled through principal component analysis using SPSS software in light of the principle of PCA. The correlative coefficient matrix is obtained in the modeling process, as shown in Table 3.
The absolute value of the correlation coefficient between each factor index is 0.085~0.803, which can be seen from Table 3 and Figure 3, indicating that there is a significant correlation between the various influencing factors. Therefore, it is necessary to use PCA to eliminate the correlation between the influencing factors before the prediction of water abundance.
The selection of principal components is generally based on the criterion that the characteristic value is greater than 1. However, from Table 4, it is clear that the first two principal components have a cumulative variance contribution of 70.160% (<80%), which cannot explain most of the original data. The first four principal components have a cumulative variance contribution of 90.309%, which conforms to the standard as a principal component and coincides with the information displayed in the gravel map (see Figure 4). Therefore, this paper selects the first four principal components to represent the original data, uses SPSS software for principal component modeling and calculation (Formula (7)), and obtains new principal component values (Table 5).
{ F 1 = 0.347 E 1 + 0.394 E 2 + 0.518 E 3 - 0.101 E 4 - 0.360 E 5 + 0.303 E 6 + 0.474 E 7 F 2 = 0.413 E 1 - 0.400 E 2 + 0.109 E 3 - 0.471 E 4 + 0.283 E 5 + 0.514 E 6 - 0.303 E 7 F 3 = 0.462 E 1 - 0.007 E 2 - 0.054 E 3 - 0.766 E 4 + 0.400 E 5 + 0.169 E 6 - 0.088 E 7 F 4 = - 0.100 E 1 + 0.546 E 2 - 0.067 E 3 - 0.331 E 4 + 0.728 E 5 - 0.060 E 6 + 0.213 E 7

4.2. PCA-BP Neural Network Modeling

A predictive model of the PCA-BP artificial neural network for the prediction of water enrichment of a weakly cemented aquifer has been written in this paper using the PyCharm development tool in Python language (https://www.jetbrains.com/es-es/pycharm, accessed on 11 January 2024). Similarly to a single BP neural network, a three-layer PCA-BP neural network model is established in this paper. PCA was performed using SPSS software. The four principal component values obtained through dimensionality reduction are used as the number of input neurons. The units of water inflow (q) are used as the output layer. The neuron count of the hidden layer is determined using the empirical formula below: p = m + 1 + a (p and m are the number of neurons in the hidden layer and input layer, respectively; a is an empiric constant, a [ 1 , 10 ] ). In this paper, the number of hidden layers is 4, so the structure of the PCA-BP neural network is 4 × 4 × 1. The transfer function from the input layer to the hidden layer selects the tangent S-type function; the transfer function from the hidden layer to the output layer selects the linear function purelin (x); and the training function of the neural network is trainlm, based on Levenberg–Marquardt optimization algorithm. This function uses the gradient method to iteratively update the weight threshold of each layer connection until the minimum error is obtained. The learning function of the neural network uses the gradient descent momentum function learned [17] or [28,29,30]. The target mean square error is set to 0.001, and the maximal frequency of training is 5000. The predictive model structure of the PCA-BP neural network for the water richness of weakly cemented sandstone constructed in this paper is illustrated in Figure 5.
The 25 sets of data in Table 1 were normalized and partitioned into two sets of training data and test data according to a ratio of 4:1. PCA-BP prediction modeling of water enrichment in weakly cemented sandstone aquifers was performed using the training dataset, and the test dataset was used for self-training prediction. There are 25 sets of data in Table 1, which are normalized and partitioned into two sets of training data and test data according to a ratio of 4:1. The training set was used to construct a single BP neural network weakly cemented sandstone aquifer water-richness prediction model, and the test set was used for self-training prediction. The training process of PCA-BP and the single BP neural network model are illustrated in Figure 6.
As can be seen from Figure 6, when compared with the single BP model, the PCA-BP model has superior precision, fewer iterations, and more rapid convergence.

5. Discussion and Practical Application

5.1. Comparative Verification of Water-Richness Prediction Models

The data of 1~14 groups of test samples (the 3 coal roof weakly cemented sandstone aquifer) in Table 1 are substituted into the PCA-BP model constructed above as test samples for verification and in comparison with the outcomes of a single BP model. The comparison results are shown in Table 6 and Figure 7.
The mean relative error of the PCA-BP model is 2.0794%, which is relatively stable, and the average accuracy reaches 97.9206%, as can be seen from Table 6 and Figure 7. In contrast, the average relative error of the single BP model is 9.6799%, and the relative error of the KB-6 hole reaches 35.0678%, which is unstable. With an average accuracy of 90.3201%, it is much lower than the prediction accuracy of the PCA-BP model.

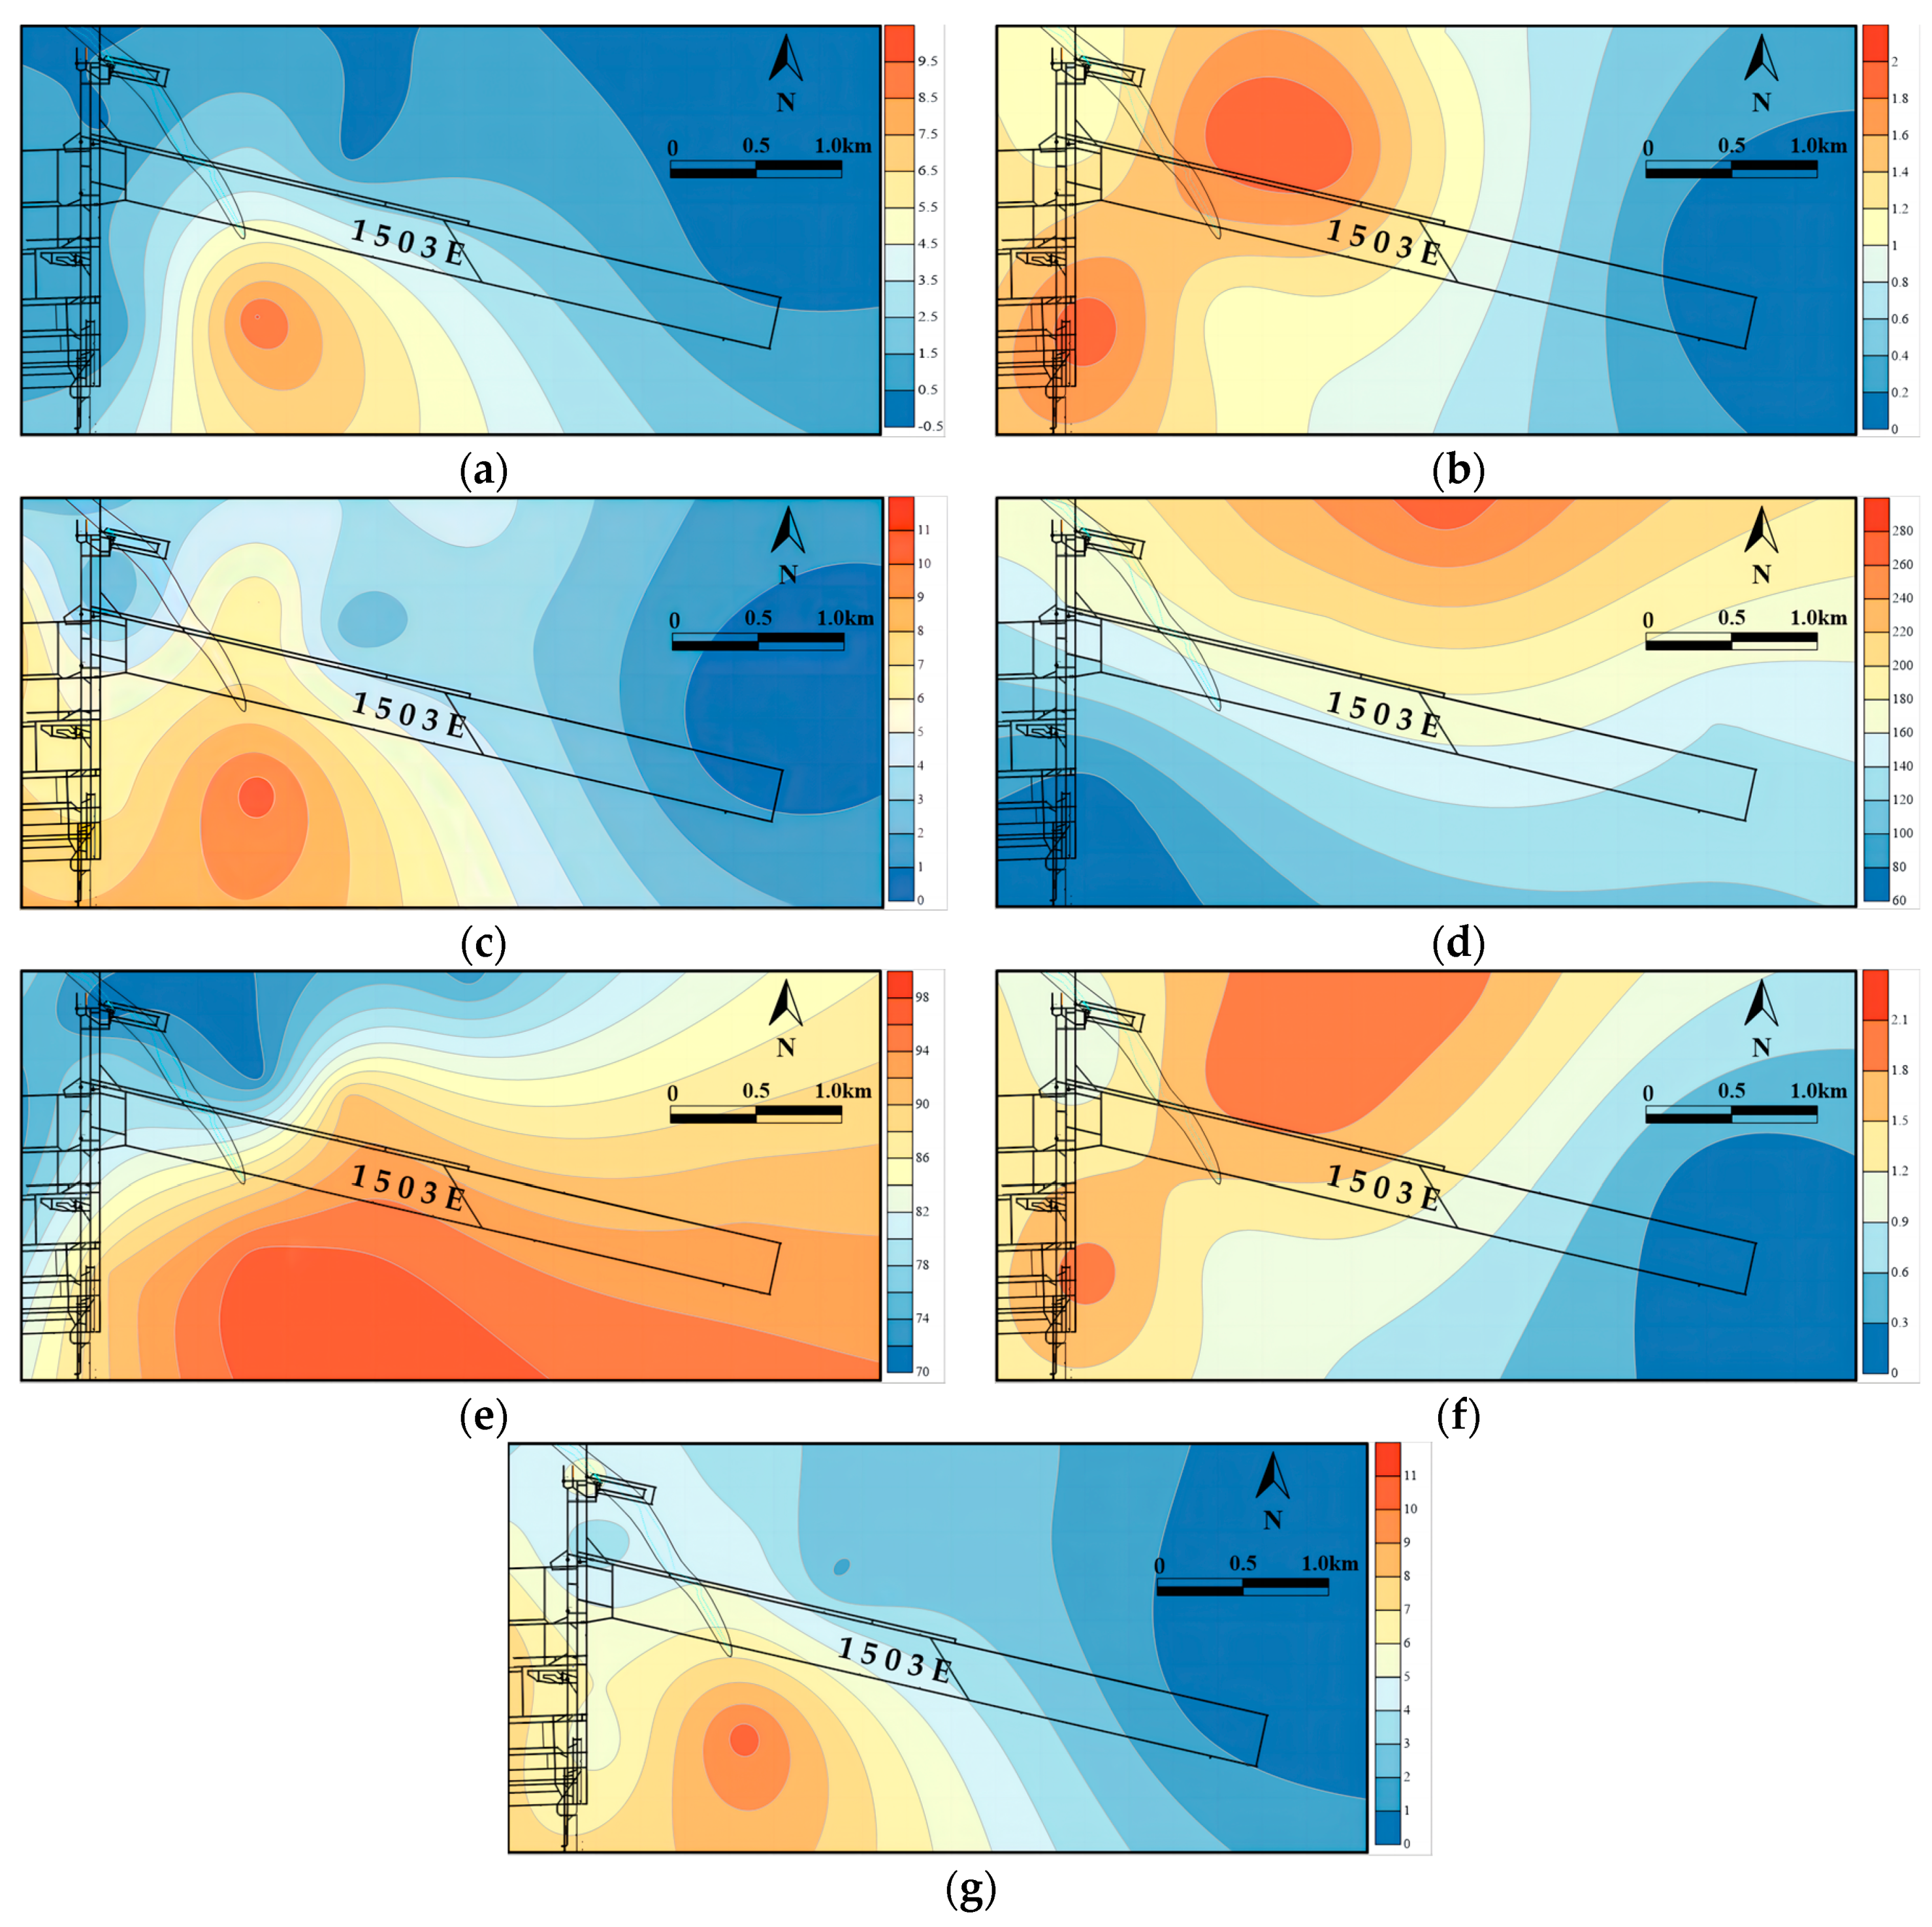
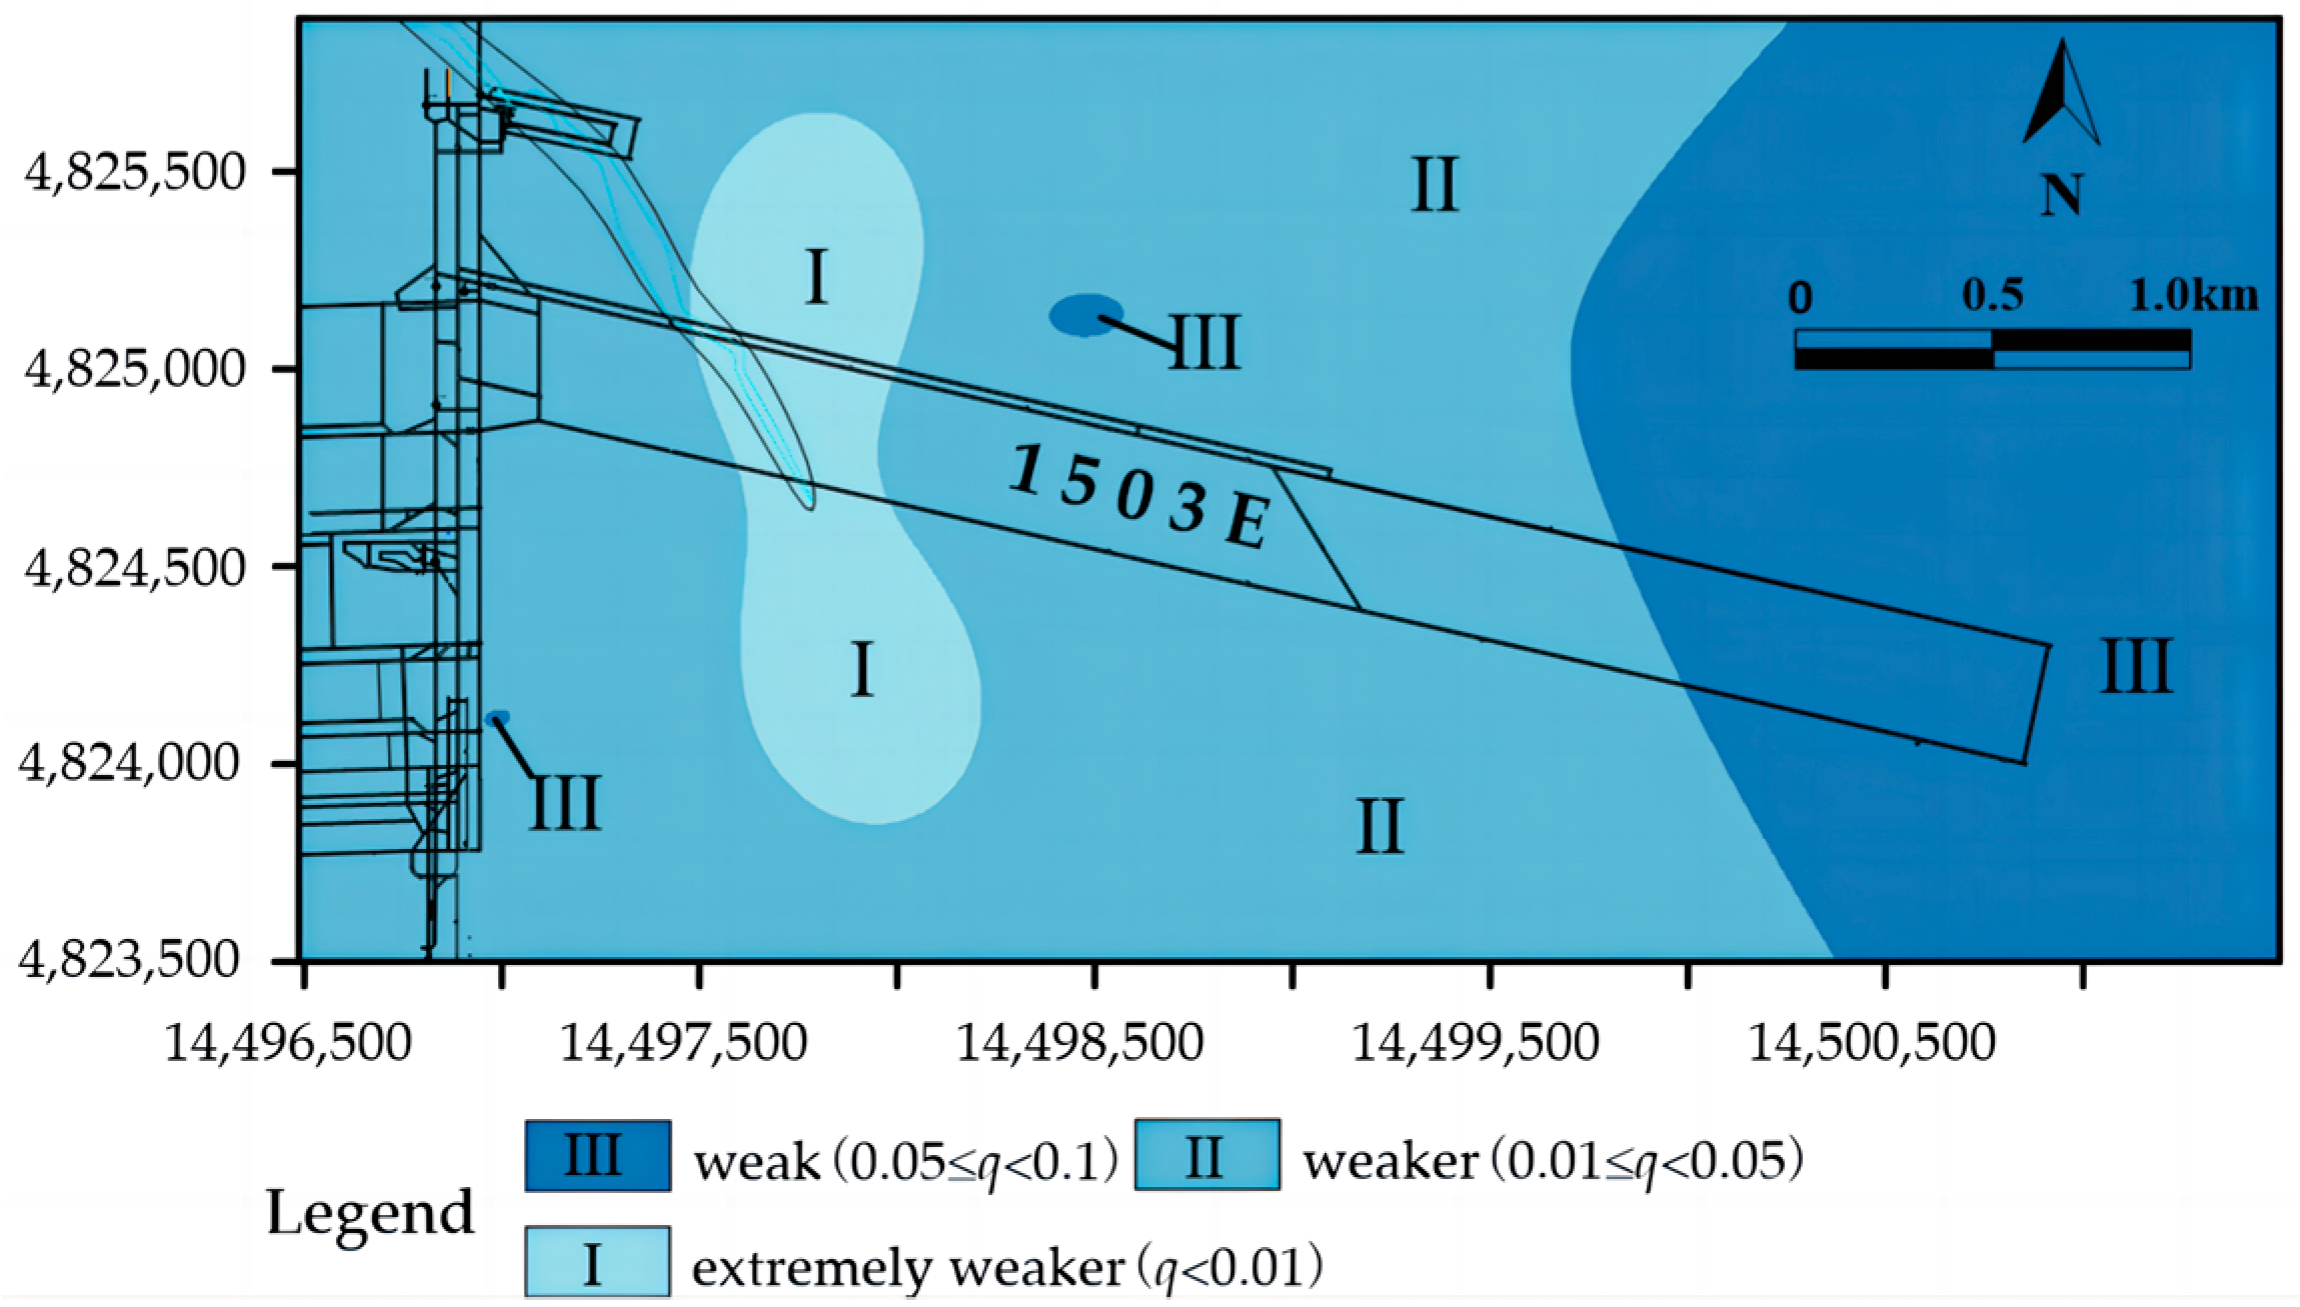
5.2. Evaluation of Water Abundance of Weakly Cemented Sandstone Aquifer in the Study Area

Based on the above discussion results, the accurate and relatively high predicted outcomes of the PCA-BP neural network predictive model are selected to assess the water enrichment of the weakly cemented sandstone water-bearing layer in the 3 coal roof within the study area (see Figure 8 and Figure 9). Drawing on the statistics and the summary of the predicted values, the water richness of the whole area is divided into an extremely weaker water-rich area (q < 0.01 L/s·m), a weaker water-rich area (0.01 ≤ q < 0.05 L/s·m), and a weak water-rich area (0.05 ≤ q < 0.1 L/s·m) using the units of water inflow classification method. This indicates that the weakly cemented sandstone aquifer at the top of the No. 3 coal seam in the entire study area is weakly water-rich and only slightly stronger in the eastern region. In actual production, drilling and geophysical prospecting methods should be used to verify this, and the relevant regulations and regulations of the water exploration and drainage work should be strictly implemented to ensure the safety of mine production.

6. Conclusions

  • In this paper, the units of water inflow (q) are selected as the predicted value. The grey correlation analysis method (GRA) is used to select the layers of sand–mud interaction nh, the sand–mud ratio nsn, the equivalent thickness of sandstone Sdx, the buried depth of aquifer H, the core recovery V, the average single-layer thickness of sandstone Sdc, and the number of sandstone layers nc, which are more than 0.8 more accurate as the predictive factors of the water richness of weakly cemented sandstone. The higher the degree of closeness between the selected factor index and the predicted value, the more accurate the subsequent prediction results;
  • The PCA method is utilized to analyze the correlations among the indicators of the factors, and the influencing factors that are weakly correlated and repeated with the prediction of units of water inflow (q) are eliminated to realize the dimensionality reduction of the original sample input, effectively improve the training efficiency of the whole network, and then enhance the accuracy of predictive modeling of water enrichment in an aquifer with weakly cemented sandstone;
  • According to the proportion of 4:1, the samples processed through the principal component analysis and the original samples are categorized into a training dataset and a test dataset, which are input into the PCA-BP neural network of the weakly cemented water-richness prediction model and the single BP network prediction model, respectively, to complete the construction of the corresponding model. Through the comparison of the training process, it is found that the PCA-BP model has fewer iterations and faster convergence speed;
  • The borehole data of the weakly cemented sandstone aquifer at the top plate of the No. 3 coal seam within the study area are inputted into the PCA-BP model and the single BP model, respectively. Through comparison, it is found that the average relative error of the PCA-BP model is 2.0794%, and the relative error is relatively stable. The average accuracy reaches 97.9206%, and its prediction accuracy is much greater than that of the single BP network model. In this paper, a PCA-BP prediction model of the water abundance of a cemented sandstone aquifer based on grey correlation analysis and decision making can be obtained through research, which can provide a method to predict the water abundance of a cemented sandstone aquifer with temperature, speed, and high precision;
  • The PCA-BP network model is introduced into the practical engineering application of water-richness evaluation of a weakly cemented sandstone aquifer. The prediction results are divided into three grades, namely, extremely weaker water-rich area (q < 0.01 L/s·m), weaker water-rich area (0.01 ≤ q < 0.05 L/s·m), and weak water-rich area (0.05 ≤ q < 0.1 L/s·m).

Author Contributions

Methodology, W.L.; Software, Y.Z.; Formal analysis, Q.W.; Writing—original draft, W.K. and X.L.; Writing—review & editing, L.L. All authors have read and agreed to the published version of the manuscript.

Funding

This research was funded by the National Natural Science Foundation of China (Grant No.42372316, No. 41602309) and China Coal’s “Enlisting and Leading” project (No. 2022JB01). All of the funders are Xiaoqin Li.

Data Availability Statement

No new data were created or analyzed in this study. Data are contained within the paper.

Acknowledgments

The authors express their gratitude to everyone that provided assistance in conducting the present study.

Conflicts of Interest

Yuguang Zhang was employed by the National Investment Hami Energy Development Co., Ltd. The remaining authors declare that the research was conducted in the absence of any commercial or financial relationships that could be construed as a potential conflict of interest.

References

  1. Qian, Z.W.; Jiang, Z.Q.; Cao, L.W.; Sun, Q. Experiment study of penetration grouting model for weakly cemented porous media. Rock Soil Mech. 2013, 34, 139–142, 147. [Google Scholar]
  2. Wu, R.; Deng, J.G.; Li, M. Study of Macromechanics and Mesomechanics Behavior of Poorly Consolidated Sandstone Using Particle Flow Code; International Field Exploration and Development Conference: Chengdu, China, 2017; p. 12. [Google Scholar]
  3. Xie, X.Y.; Kang, X.; Zhou, B.; Li, A.Y.; Kang, Y.F. Study on Water-induced Softening Mechanism of Weakly Cemented Sandstone. Build. Constr. 2023, 45, 2359–2362. [Google Scholar]
  4. Zhu, X.J. Water physical properties of soft rock. Min. Sci. Technol. 1996, 24, 46–50. [Google Scholar]
  5. Lyu, Y.G.; Xiao, Q.H.; Han, G. Study on Mechanism of High-strength Water-inrush with Sand Caused by Weak Aquifer in Soft Rock Mining Area. Saf. Coal Mines 2019, 50, 38–42, 47. [Google Scholar]
  6. Lyu, Y.G.; Qi, D.H. Technique based on “double maps” for assessment of water inrush from roof aquifer and its application—With New Shanghai No.1 coal mine at western edge of Ordos basin as example. Coal Geol. Explor. 2016, 44, 108–112. [Google Scholar]
  7. Lyu, Z.M.; Meng, F.Z.; Lyu, W.M.; Li, L.N. Improved Method for Predicting and Evaluating Water Yield Property. Coal Technol. 2023, 42, 152–155. [Google Scholar]
  8. Qiu, Z.L.; Chen, W.H.; Bao, D.L.; Liu, Y.H.; Feng, J.W.; Huang, C.M. Combined Detection of Mine Water Disasters with Various Geophysical Prospecting Techniques. Min. Saf. Environ. Prot. 2016, 43, 60–63, 67. [Google Scholar]
  9. Wu, Q. Progress, problems and prospects of prevention and control technology of mine water and reutilization in China. J. China Coal Soc. 2014, 39, 795–805. [Google Scholar]
  10. Wu, Q.; Wang, Y.; Zhao, D.K.; Shen, J.J. Water abundance assessment method and application of loose aquifer based on sedimentary characteristics. J. China Univ. Min. Technol. 2017, 46, 460–466. [Google Scholar]
  11. Yu, J. Research on Aquifer Prediction Method of Coal Seam Roof Sandstone Based on Seismic and Logging Data; China University of Mining and Technology: Xuzhou, China, 2022. [Google Scholar]
  12. Li, L.N.; Wei, J.C.; Li, L.Y.; Shi, S.Q.; Yin, H.Y. Water yield property prediction model of aquifer based on logging data: A case study from Yingpanhao mine field in Ordos area. China Min. Mag. 2019, 28, 143–147. [Google Scholar]
  13. Li, Y.T.; Pu, Z.G.; Ding, X.; Wang, Y.; Xie, X.F.; He, X.L. Application of Integrated Geophysical Prospecting in Narin Gol Coalmine No. 2 Sandstone Water Control. Coal Geol. China 2018, 30, 75–79. [Google Scholar]
  14. Liu, S.C.; Liu, Z.X.; Jiang, Z.H. Application of T EM in Hydrogeological Prospecting of Mining District. J. China Univ. Min. Technol. 2005, 414–417. [Google Scholar]
  15. Li, Q.; Sui, W.H.; Sun, B.T.; Li, D.L.; Yu, S.B. Application of TOPSIS water abundance comprehensive evaluation method for karst aquifers in a lead zinc mine, China. Earth Sci. Inform. 2022, 15, 397–411. [Google Scholar] [CrossRef]
  16. Liu, S.Q.; Wu, Q.; Zeng, Y.F.; Gong, H.J.; Li, Z. The Improved AHP Vulnerable Index Method Based on GIS. Earth Sci. 2017, 42, 625–633. [Google Scholar]
  17. Shi, L.Q.; Huang, J.Y.; Han, J.; Qin, D.X.; Guo, Y.C. PCA-BP model for height prediction of water conducting fracture zone. China Sci. 2019, 14, 471–475. [Google Scholar]
  18. Detailed Rules for Coal Mine Water Control. National Coal Mine Safety Supervision Bureau Formulated. China, 2018. Available online: https://www.chinamine-safety.gov.cn/xw/zt/2019zt/mkfzszt/gcsy/201906/P020190605471473790006.pdf (accessed on 11 January 2024).
  19. Li, Z.; Zeng, Y.F.; Liu, S.Q.; Gong, H.J.; Niu, P.K. Application of back propagation artificial neural network in water abundance evaluation. Coal Eng. 2018, 50, 114–118. [Google Scholar]
  20. Han, Z.; Wang, X.L.; Shi, L.Q. Study on application of PCA-BP neural network in discrimination of karst water inrush source in mine. J. Henan Polytech. Univ. (Nat. Sci.) 2023, 42, 46–53. [Google Scholar]
  21. Li, Y.Y. Grey correlation analysis of industrial structure and economic growth in Gansu province. Enterp. Econ. 2011, 30, 20–23. [Google Scholar]
  22. Man, K.; Wu, L.W.; Liu, X.L.; Song, Z.F.; Liu, Z.X.; Liu, R.L.; Cao, Z.X. Rock burst Grade Prediction Based on Grey Correlation Analysis and SSA-RF Mode. Met. Mine 2023, 5, 202–212. [Google Scholar]
  23. Xu, M.G.; Gao, S.S.; Cao, Y.J.; Lu, Y.N.; Wang, J.J. Forecast of Gas Content Based on Gray Theory and Multiple Regression Analysis. Saf. Coal Mines 2018, 49, 211–214. [Google Scholar]
  24. Liu, J.; Bai, X.W. Application of Adaptive Neuro-Fuzzy Inference Systems with Principal Component Analysis Model for the Forecasting of Carbonation Depth of Reinforced Concrete Structures. Appl. Sci. 2023, 13, 5824. [Google Scholar] [CrossRef]
  25. Yuan, H.P.; Ji, S.J.; Liu, G.L.; Xiong, L.J.; Li, H.Z.; Cao, Z.H.; Xia, Z.J. Investigation on Intelligent Early Warning of Rock Burst Disasters Using the PCA-PSO-ELM Model. Appl. Sci. 2023, 13, 8796. [Google Scholar] [CrossRef]
  26. Duan, Y.F.; Liu, X.J.; Li, X.; Liu, R.; Li, H.W.; Zhao, J. Molten iron yield predicting of blast furnace using PSO-BP model based on PCA decision. China Metall. 2023, 33, 114–126, 137. [Google Scholar]
  27. Li, Z.H. Damage Detection of Beam Bridge Structure Based on Principal Component analysis And Grey Relational Analysis; Jinan University: Guangzhou, China, 2020. [Google Scholar]
  28. Lan, T.W.; Guo, X.T.; Zhang, Z.J.; Liu, M.W. Prediction of micro seismic events in rock burst mines based on MEA-BP neural network. Sci. Rep. 2023, 13, 8523. [Google Scholar] [CrossRef] [PubMed]
  29. Li, W.Y.; Li, B.J.; Ma, W.Y. Prediction of agricultural grey water footprint in Henan Province based on GM (1, N)-BP neural network. Environ. Ecol. Stat. 2023, 30, 335–354. [Google Scholar] [CrossRef]
  30. Xie, Y.G.; Gao, C.G.; Wang, P.Z.; Zhou, L.; Zhang, C.J.; Qu, X.Q. Research on Vibration Fatigue Damage Locations of Offshore Oil and Gas Pipelines Based on the GA-Improved BP Neural Network. Shock Vib. 2023, 2023, 2530651. [Google Scholar] [CrossRef]
Figure 1. Diagram of the 1503E working face.
Water 16 00551 g001
Figure 2. Factor Index Thematic Map. (a) Sand−mud ratio. (b) Layers of sand–mud interaction. (c) Equivalent thickness of sandstone (m). (d) Buried depth of aquifer (m). (e) Core recovery (%). (f) Number of sandstone layers. (g) The average single-layer thickness of sandstone (m).
Water 16 00551 g002
Figure 3. Factor index correlation heat map.
Water 16 00551 g003
Figure 4. Principal component analysis gravel diagram.
Water 16 00551 g004
Figure 5. Diagram of the PCA-BP neural network for weak cemented sandstone water-richness prediction model structure.
Water 16 00551 g005
Figure 6. PCA−BP and BP neural network model training process comparison chart. (a) PCA-BP model. (b) Single BP model.
Water 16 00551 g006
Figure 7. PCA-BP network model and single BP network model prediction results and error comparison. (a) Comparison of prediction results. (b) Error comparison.
Water 16 00551 g007
Figure 8. Isoline map of units of water inflow of weakly cemented aquifer in the No. 3 coal seam roof in the study area.
Water 16 00551 g008
Figure 9. The water-rich zoning map of the weakly cemented aquifer in the No. 3 coal roof in the study area.
Water 16 00551 g009
Table 1. Indicators of related factors of the weakly cemented sandstone aquifer in the study area.
Drilling NumberSpecific Capacity
q (L/s·m)
Related Factor IndicatorsCoal Seams
nsnnhSdxHVSdcnc
KB-10.01000.50072.00006.664064.95000.90305.32002.00003-coal
KB-20.02210.42271.00001.9020167.05000.78043.17001.00003-coal
KB-30.01760.54891.00003.3000169.55000.70885.50001.00003-coal
KB-4-10.00800.26322.00002.2500195.05000.91001.87502.00003-coal
KB-50.00792.23251.00006.5100168.90000.96701.95002.00003-coal
KB-6-10.00060.00000.00000.0000138.71000.91490.00000.00003-coal
KB-70.02300.80531.00009.1800124.46000.54660.00000.00003-coal
KB-8-10.03060.05671.00000.4200171.65000.87630.70001.00003-coal
3-10.06449.59091.000010.5500112.60000.972510.55001.00003-coal
3-20.02121.21541.00007.9440109.50000.67409.93001.00003-coal
3d-10.01854.09413.000031.6640104.66000.51488.15754.00003-coal
3d-20.07272.25452.00007.0160197.91000.71094.38502.00003-coal
ZK24030.02000.73461.00004.7020273.84000.73242.97502.00003-coal
ZK36040.05500.96303.000010.3280193.80000.98272.92504.00003-coal
KB-4-20.00100.00000.00000.0000272.26000.86110.00000.00005-coal
KB-6-20.04749.57581.000012.2000218.70000.93877.90002.00005-coal
KB-8-20.00992.19672.000016.7200240.75000.79087.18333.00005-coal
5d-10.24389.21601.000023.5760133.35000.71248.64004.00005-coal
5d-20.00332.05562.00005.3600283.00000.56123.40405.00005-coal
ZK30040.01252.04684.000018.0800257.00000.59663.18006.00005-coal
ZK36020.06476.94973.000025.264098.51000.40583.45758.00005-coal
3-210.15182.26532.00006.7800130.90000.72673.66754.00005-coal
5d1-10.02331.07691.00002.2400105.60000.95813.50001.00005-coal
5d1-20.00162.37783.00007.3800229.25000.64293.75004.00005-coal
ZK24010.03302.47061.000016.410087.23000.68879.11673.00005-coal
Table 2. Grey correlation analysis results.
Factor TargetDegree of AssociationRanking of Relevance
Sdc0.84701
Sdx0.84332
nc0.83903
V0.83884
nh0.83725
H0.82436
nsn0.80697
Table 3. Correlation coefficient matrix.
Factor TargetnsnnhSdxHVSdcnc
Sdc1.0000.0850.607−0.181−0.0840.6200.356
Sdx0.0851.0000.5330.114−0.4460.0690.803
nc0.6070.5331.000−0.260−0.5460.5410.669
V−0.1810.114−0.2601.0000.011−0.3430.086
nh−0.084−0.446−0.5460.0111.000−0.082−0.569
H0.6200.0690.541−0.343−0.0821.0000.153
nsn0.3560.8030.6690.086−0.5690.1531.000
Table 4. Results of PCA.
ComponentEigenvalueContribution Rate (%)Cumulative Proportion (%)
13.17245.31945.319
21.73924.84170.160
30.84812.11482.274
40.5628.03590.309
50.3885.54295.851
60.1762.51898.369
70.1141.631100.000
Table 5. New principal component values.
Drilling NumberPrincipal ComponentSpecific Capacity q (L/s·m)
F1F2F3F4
KB-1−0.440.76−1.141.410.010
KB-2−1.47−0.08−0.27−0.240.022
KB-3−0.990.19−0.28−0.640.018
KB-4-1−1.29−0.840.240.870.008
KB-5−1.270.190.350.620.008
KB-6-1−2.830.32−0.45−0.060.001
KB-7−0.93−0.39−1.47−1.190.023
KB-8-1−2.06−0.41−0.160.230.031
3-10.493.231.300.380.064
3-2−0.031.45−0.77−0.630.021
3d-13.470.37−1.18−0.150.019
3d-2−0.09−0.460.19−0.180.073
ZK2403−1.10−1.050.86−0.930.020
ZK36040.11−1.030.421.860.055
KB-4-2−2.92−0.751.02−0.990.001
KB-6-20.491.832.29−0.170.047
KB-8-20.77−0.210.93−0.070.010
5d-12.341.980.53−0.620.244
5d-20.61−2.010.63−0.930.003
ZK30042.37−2.580.260.460.013
ZK36024.16−0.85−1.47−0.130.065
3-210.38−0.37−0.690.460.152
5d1-1−1.640.83−0.450.840.023
5d1-20.86−1.600.290.110.002
ZK24011.041.48−1.00−0.320.033
Table 6. PCA-BP network model and single BP network model prediction results and error comparison.
Drilling NumberThe Measured Value of the Units of Water Inflow q (L/s·m)PCA-BP Network ModelSingle BP Network Model
Predicted Value qpca (L/s·m)Relative Error (%)Mean Relative Deviation (%)Predicted Value qbp (L/s·m)Relative Error (%)Mean Relative Deviation (%)
KB-10.01000.00954.69962.07940.008614.48719.6799
KB-20.02210.02200.54110.02123.9416
KB-30.01760.01741.01860.01693.8645
KB-4-10.00800.00781.88990.009011.9925
KB-50.00790.00755.02650.00824.2801
KB-6-10.00060.00067.60520.000835.0678
KB-70.02300.02271.18740.02233.0093
KB-8-10.03060.03060.09360.02963.2901
3-10.06440.06470.38950.06978.2038
3-20.02120.02101.05490.02005.5790
3d-10.01850.01840.69800.01755.2036
3d-20.07270.07210.81000.084416.1504
ZK24030.02000.02010.35570.017711.3198
ZK36040.05500.05293.74100.06009.1297
Disclaimer/Publisher’s Note: The statements, opinions and data contained in all publications are solely those of the individual author(s) and contributor(s) and not of MDPI and/or the editor(s). MDPI and/or the editor(s) disclaim responsibility for any injury to people or property resulting from any ideas, methods, instructions or products referred to in the content.

