Article

Assessing Groundwater Resources Vulnerability with the New DRASTIC-LP: A Case Study in Chiang Mai Province, Thailand

by
Chaiyathat Imsamranrat
and
Adisorn Leelasantitham
*
Technology of Information System Management Division, Faculty of Engineering, Mahidol University, 25/25 Phutthamonthon Sai 4 Road, Salaya, Phutthamonthon, Nakhon Pathom 73170, Thailand
*
Author to whom correspondence should be addressed.
Water 2024, 16(4), 547; https://doi.org/10.3390/w16040547
Submission received: 1 January 2024 / Revised: 28 January 2024 / Accepted: 1 February 2024 / Published: 9 February 2024
(This article belongs to the Topic Groundwater Pollution Control and Groundwater Management)

Abstract

:
Groundwater vulnerability has gained widespread attention, particularly in Chiang Mai Province, one of Thailand’s fastest-growing cities, which is experiencing rapid development in both economic and social sectors. The expansion of urban communities and the industrial, tourism, and agriculture sectors has resulted in the overutilization of available resources, notably water resources. This overuse, coupled with the adoption of modern technology to boost productivity and meet market demands, has led to an increased reliance on groundwater to supplement surface water sources, providing benefits across all sectors. However, the economic and social growth plays a pivotal role in shaping the diversity of land use, encompassing residential, commercial, industrial, and agricultural activities. These activities, in turn, directly contribute to environmental pollution, particularly in terms of the risk of groundwater contamination in Chiang Mai Province. This study aims to predict the future vulnerabilities of groundwater resources under an ensemble of climate change scenarios and changes in land-use patterns. Chiang Mai Province in northern Thailand is one of the fastest-growing cities and therefore is experiencing rapid urbanization, as well as land-use pattern changes, which was important for the case study. The new DRASTIC model, namely the DRASTIC-LP model, combined with GIS-based techniques and overlay techniques, was used to generate the map of groundwater resource vulnerabilities. A point pollution source (P)-related land-use pattern (L) that represents contamination impacts was considered an additional new DRASTIC parameter. The study’s findings reveal the high reliability and maximum effectiveness of the new DRASTIC-LP model in assessing groundwater vulnerability and contamination-risk areas under a climate change scenario (by MIROC-ESM-CHEM model under RCP.8.5 scenario) and land-use pattern changes (by CA_Markov Chian Model) for both the current year (2020) and the next 50-year period (2021–2070). Furthermore, the new DRASTIC-LP model is employed to trace the movement of pollutants from high- to very high-risk areas based on the groundwater vulnerability and contamination-risk maps. The results highlight that waste disposal dumping sites pose a more critical distribution and movement of pollutants when compared to industrial sites. Additionally, unconsolidated aquifers and cracked consolidated rock aquifers show a potentially higher occurrence of pollutant distribution and movement when compared to consolidated aquifers. Consequently, the study’s outcomes are applied to formulate guidelines for the management and control of groundwater resource contamination. These guidelines serve as valuable tools for decision makers, aiding in pollution prevention and the effective management of contamination risks in groundwater resources.

1. Introduction

The issue of groundwater pollution has garnered significant attention in Thailand, particularly in the northern region, which holds an estimated 166,860 million cubic meters of groundwater resources, constituting 14.67% of the nation’s total groundwater volume [1]. However, due to rapid population growth and extensive development in the tourist, industrial, and agricultural sectors of northern Thailand, the groundwater situation has suffered varying degrees of damage [2,3]. Aligning with prior studies, it has been reported that 80% of shallow groundwater and 30% of deep groundwater in the People’s Republic of China exhibit varying levels of pollution [4].
The review of past research indicates that assessing the vulnerability of groundwater resources is crucial for effective planning, policymaking, and decision making, as well as for the sustainable management of these resources. Such assessments not only aid decision makers in adopting effective management strategies to mitigate groundwater pollution, but also contribute to developing a conceptual framework for the allocation of groundwater resources. This framework helps determine appropriate land-use patterns and practices, fostering awareness among the population regarding the risks associated with groundwater contamination [5]. The concept of groundwater resource vulnerability aims to identify and prioritize the most vulnerable areas or regions within a river basin that could lead to groundwater contamination. Additionally, it furnishes essential scientific information for the protection and preservation of groundwater resources [6]. Consequently, a comprehensive review encompassing all methods and approaches used to assess groundwater resources vulnerability from the past to the present is necessary. For instance, Ducci [7] discovered that regional groundwater pollution vulnerability patterns vary between drought, average, and wet climatic conditions. Butscher and Huggenberger [8] conducted an analysis of a karst aquifer system in north-west Switzerland and found that groundwater vulnerability is influenced by climate-affected recharge conditions. Keilholz et al. [9] highlighted the effects of land use and climate change on groundwater and ecosystems at the middle reaches of the Tarim River, using the MIKE SHE-integrated hydrological model. Nistor [10] confirmed the impact of climate change on groundwater vulnerability in the Pannonian basin through a calculation of spatial analysis for groundwater vulnerability, using GIS-based techniques. The groundwater vulnerability maps indicated that the Pannonian basin appears highly vulnerable to climate change in both the present (2020s) and future (2050s) scenarios.
The vulnerability of groundwater resources can undergo changes overtime due to climate fluctuations, alterations in land use, and land cover (LULC). Various methods have been proposed for assessing groundwater resource vulnerability, including the original DRASTIC model [11] and the modified DRASTIC model, as evidenced by studies over the past ten-year period [12,13,14,15,16,17]. A comprehensive literature review, as presented in Table 1, reveals that there is a gap in past reviews, particularly the lack of studies dealing with groundwater resource vulnerability under the influence of climate change and changes in land-use patterns using modern models. In summarizing the research related to assessing groundwater resource vulnerability, two main groups emerge:
1. Approaches undertaken globally by the original DRASTIC Model [11], combined with the overlay technique and/or the GIS-based technique. This group, totaling 12 research papers, includes studies by Aller et al. [11], Rahman [18], Shirazi et al. [19], Zghibi et al. [20], Abdeslama et al. [21], Rajput et al. [22], Mohammed et al. [23], Nurroh et al. [24], Bera et al. [25], Chilaule et al. [26], Zhang et al. [27], and Wei and Chi [28]. The limitation of these assessments lies in their focus on simulating the susceptibility of groundwater aquifers to contamination from both natural conditions and anthropogenic activities. Notably, these studies primarily concentrate on current scenarios, neglecting any consideration of future scenarios.
2. Applied approaches from the original DRASTIC model to the Modified DRASTIC model. This group, totaling six research papers, encompasses various methodologies, including the overlay technique, the GIS-based technique, and/or remote sensing (RS).
(a)
Approaches without consideration of land-use pattern changes and/or climate change without considering future scenarios: This subgroup consists of three research papers, including Sadat-Noori and Ebrahimi [14], Jenifer and Jha [16], and Maqsoom et al. [17]. The limitation of these assessments of groundwater resource vulnerability is that they mainly focus on land-use pattern and/or anthropogenic activity (population density) indices.
(b)
Approaches without consideration of land-use pattern changes and/or climate change without considering future scenarios: This subgroup consists of one research paper: Zhang et al. [29]. This assessment of groundwater resource vulnerability focuses mainly on four additional evaluation factors: land-use type (L), aquifer thickness (T’), aquifer water potential (P’), pollution source distance (D’). These are considered with the new proposed model that includes DRASTIC-LTPD and AHP-DRASTIC-LTPD.
(c)
Approaches considering land-use changes and land cover without considering future scenarios: one research paper, Kmumbo et al. [30], is included in this subgroup. The limitation of this assessment is its primary focus on land use and land cover (LU/LC) indexes.
(d)
Approaches considering changing land-use patterns under future scenarios, using the Dyna-CLUE model: a study by Lima et al. [12] is included in this subgroup. The limitation of this assessment is its primary focus on land-use pattern indices under both current and future scenarios, without considering future climate changes.
(e)
Approaches considering changing land-use patterns using the LTM model (Land Transformation model), and climate changes using the GCMs model for future scenarios: this subgroup consists of two research papers, including Li and Merchant [13] and Huang et al. [15]. The limitations of this assessment of groundwater resource vulnerability were as follows:
  • Li and Merchant [13] found that the groundwater vulnerability maps developed for this research indicate only the risk of groundwater pollution on a regional scale but may not be used to interpret actual local groundwater contamination incidents, due to the site-specific factors, such as hydraulic fracturing for shale oil, which may cause drinking water contamination, not being considered.
  • Huang et al. [15] confirmed the depth-to-water table (DTW), and also confirmed that the land-use patterns contribute differently to variations in groundwater resource vulnerability. Additionally, this study emphasizes generating an impact model of climate changes and anthropogenic activities on future groundwater resource vulnerability, directly linking future DTW variations to climate change and associating land-use patterns with anthropogenic activities.
Despite the various methodologies applied, addressing future groundwater vulnerability, based on the potential land-use changes and climate change scenarios, is essential for formulating effective policies that ensure sustainable groundwater resource development. This proactive approach aids decision makers in identifying potential future vulnerabilities and taking early steps to protect critical groundwater resources. In the specific context of Chiang Mai Province, Thailand, the assessment of groundwater resource vulnerability utilized the original DRASTIC model [11] and the modified DRASTIC model, incorporating a land-use pattern index (L). Notably, point source pollutions have emerged as critical contributors to groundwater contamination. As mentioned earlier, although many researchers have assessed groundwater vulnerability using the original DRASTIC model and the modified DRASTIC model, these numerous researchers were mainly focused on only current scenarios or land-use patterns change and/or the expansion of anthropogenic activities, without any consideration of climate change scenarios. Little is known, however, about future groundwater resource vulnerability, or the impact of the combination of climate changes and land-use pattern changes under an ensemble of climate change scenarios. The response of groundwater vulnerability to the projected changes in climate change and land-use pattern changes is expected to be profound. Climate change and land-use pattern changes cannot be neglected during the process of the assessment of groundwater vulnerability.
In Chiang Mai Province in the northern region of Thailand, land-use patterns and point source pollution stand out as primary contributors, directly impacting groundwater resources. Consequently, the vulnerability assessment of groundwater resources, utilizing the new DRASTIC-LP model (modified from Aller et al. [11]), aims to simulate both the current situation and future scenarios, considering climate change under high emission scenarios (or RCP8.5 scenario) and land-use pattern changes. Additionally, the identify-cation of contamination-risk areas is an integral part of this assessment. To identify the impacts of the mentioned factors on groundwater vulnerability, the study proposes an integrated approach, as follows:
  • Assessment of climate change situations: Three models suitable for Thailand are selected, specifically three global climate models (GCMs). The data from the three GCMs AR5 [31] models are modified to incorporate spatial data, aligning with inspection data measures from the past. This modification aims to predict the appearance and behavior of temperature and rainfall conditions.
  • Assessment of land-use change situations: Utilizing the CA_Markov Chain Model, the study analyzes the changes in various types of land-use patterns [32].
  • Assessment of groundwater resource vulnerability: The original DRASTIC model [11] is employed to assess the vulnerability of groundwater resources, both in the current and future scenarios.
  • New approach for risk assessment and management: The research introduces a novel approach for the risk assessment and management of groundwater vulnerability. This approach integrates the aforementioned assessments while incorporating the land-use patterns index, denoted as L, and point source pollutions, marked as P, using Geographic Information System (GIS) techniques. The goal is to produce a comprehensive map depicting the vulnerability of groundwater resources.

2. Site Description and Hydrogeology Condition

2.1. Site Condition

Chiang Mai Province covers a total area of 20,107.06 sq.km. or 12,566,912.50 rais, as shown in Figure 1 [33]. Situated in the upper northern part of Thailand, it stands out as one of the fastest-growing cities, experiencing rapid development in both economic and social sectors. This growth has resulted in the expansion of urban communities, industrial sectors, and the tourism industry. The escalating economic prosperity, coupled with the infusion of modern technology to enhance productivity and meet public sector demands, has led to the overuse of available resources, particularly water. Consequently, a surge in water demand has emerged as a significant challenge. Despite comprising predominantly reserved and conserved areas, covering 15,403.77 sq.km. or 9.627 million rais, constituting 76.61 percent of Chiang Mai’s total area [34], legal restrictions prevent the development of medium-to-large surface water reservoirs. The province is situated within the Chiang Mai-Lamphun and Fang groundwater basins [35], with a potential groundwater source. capable of supplying water ranging from less than 2 cubic meters/hour to more than 20 cubic meters/hour [36]. Utilizing groundwater in both basins to replace or supplement surface water sources stands as a beneficial solution across all sectors. The expansive growth in economic and social systems within Chiang Mai Province has significantly influenced the diversity of land-use patterns and the expansion of residential, commercial, industrial, and agricultural sectors. It is evident that activities in these sectors contribute to environmental pollution, posing a threat to groundwater contamination in the Chiang Mai-Lamphun and Fang groundwater basins [2,3].

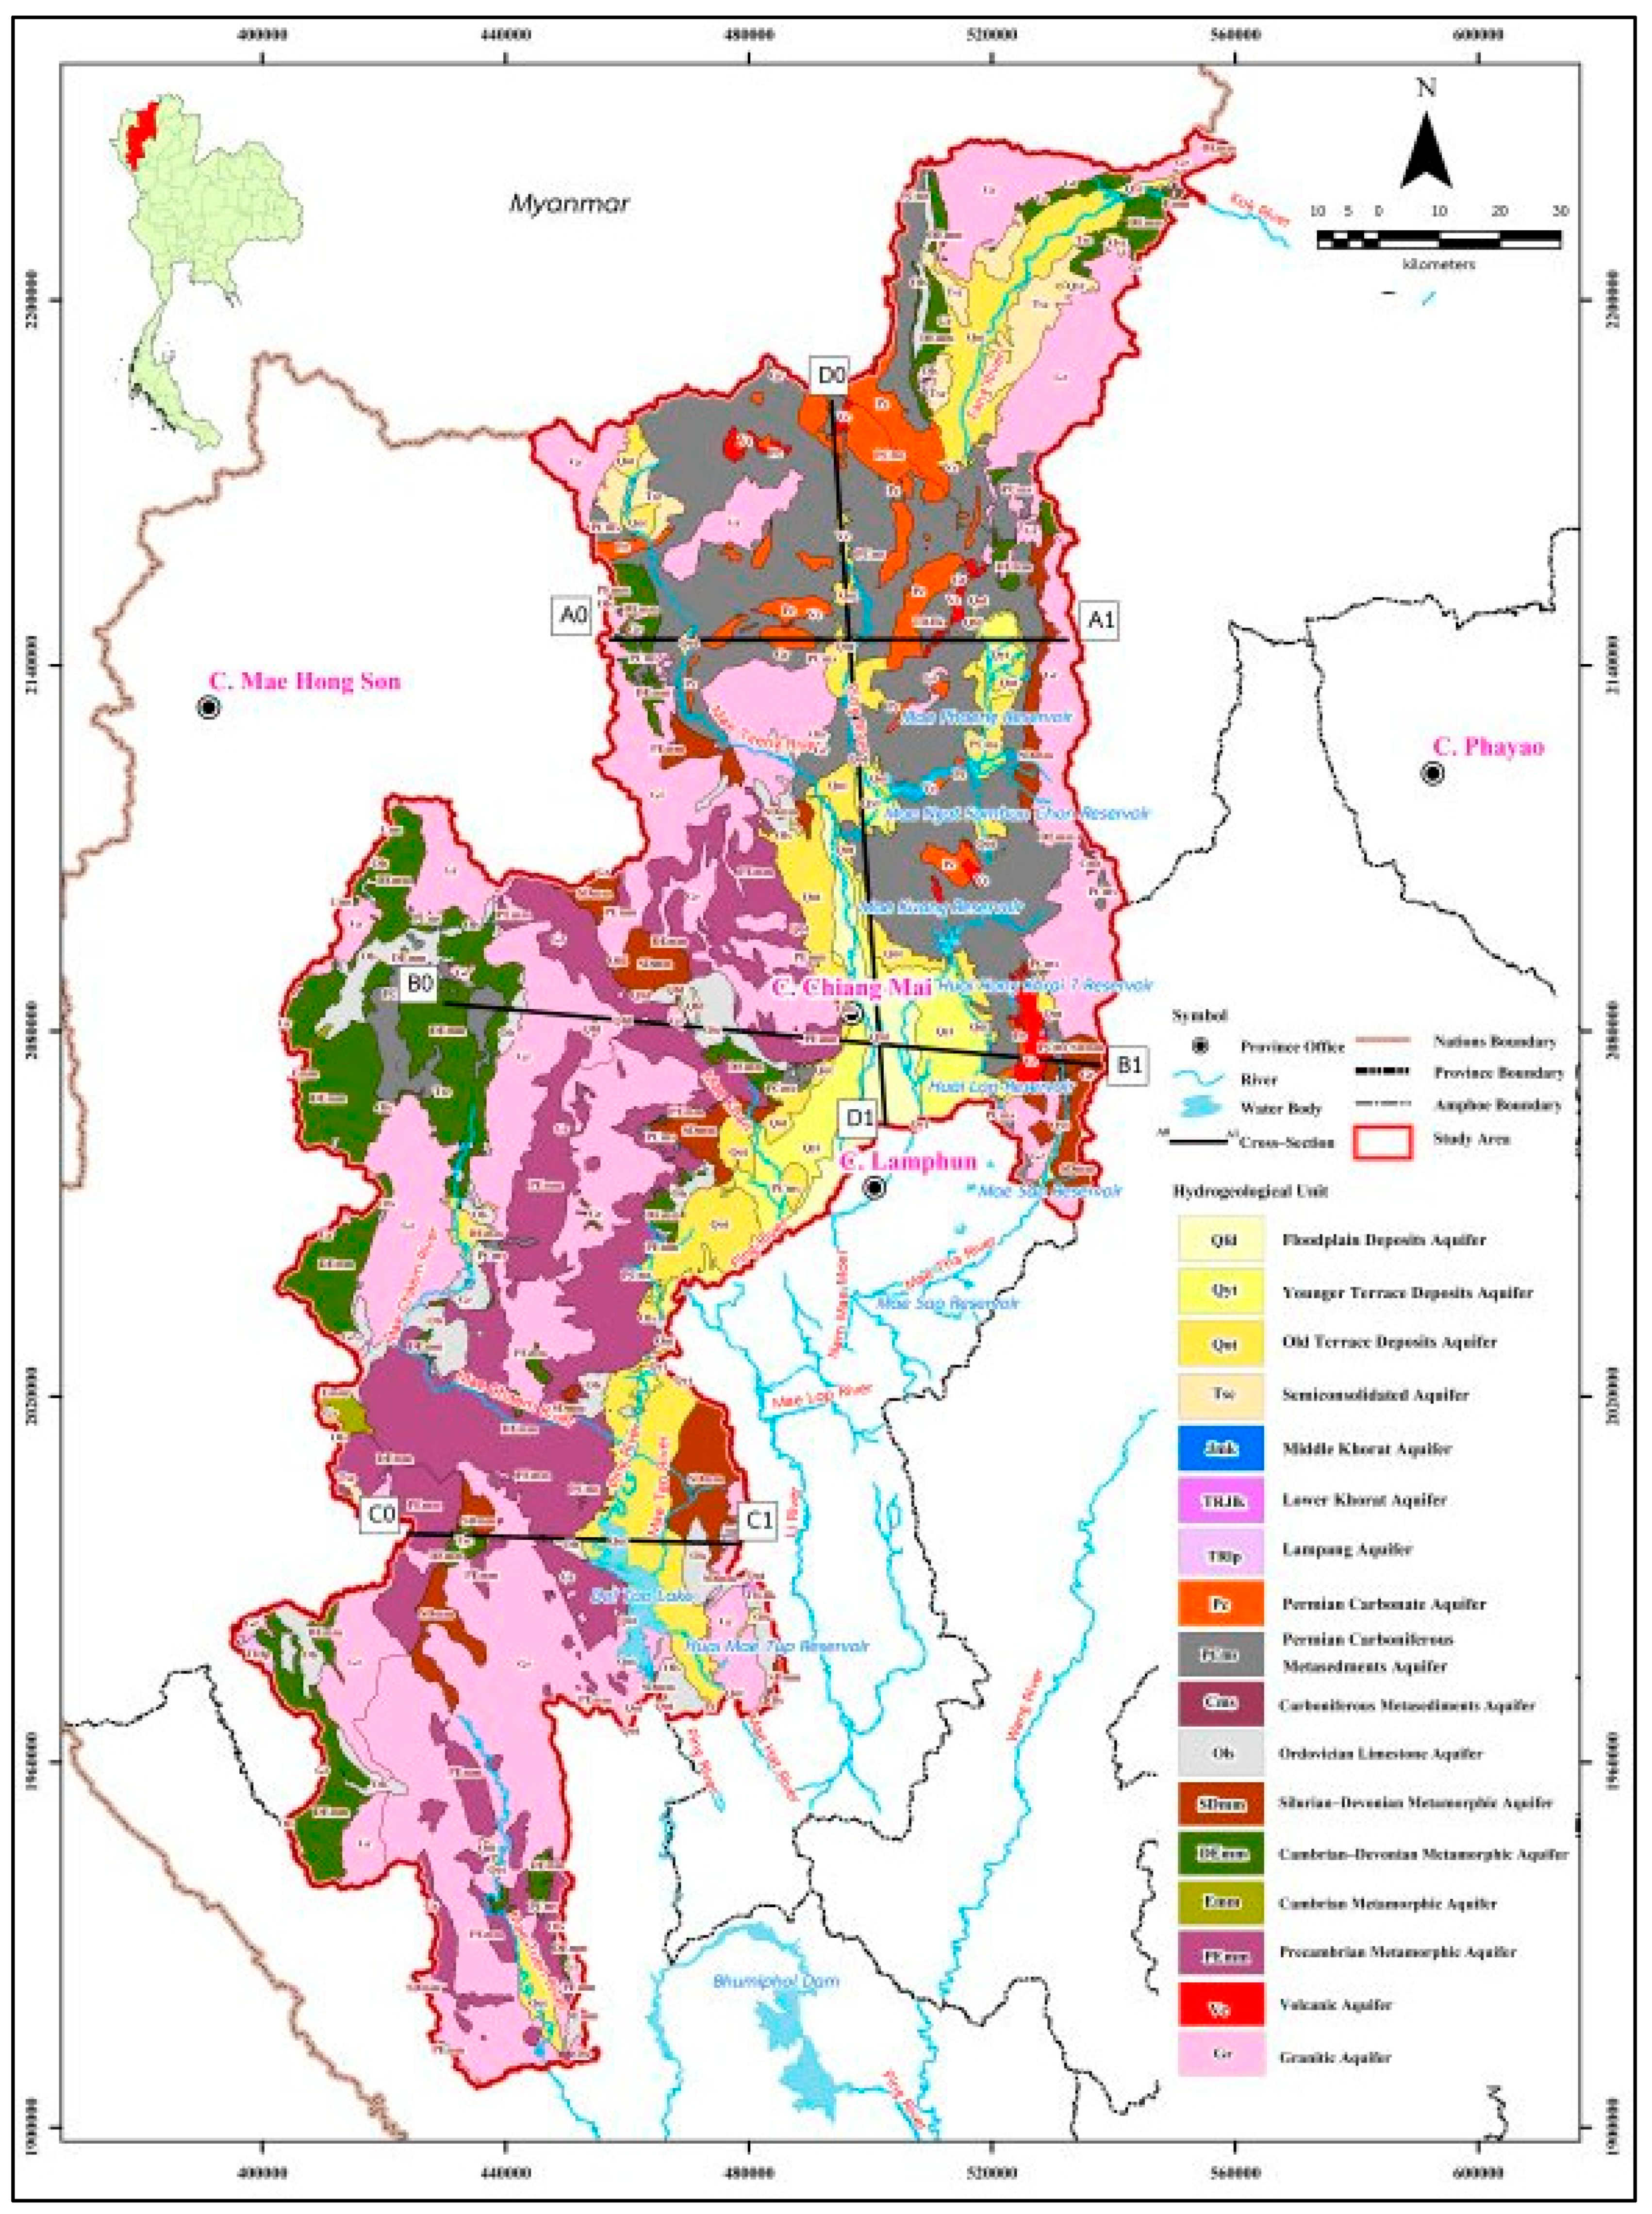
2.2. Hydrogeologic Setting of Chiang Mai Province

The hydrogeological characteristics and the geological map of Chiang Mai Province are shown in Figure 2. The province exhibits both unconsolidated and consolidated aquifers. The unconsolidated aquifers in Chiang Mai Province cover an area of approximately 2800 sq.km. or 1,750,000 rais, ranging from 18°30′ to 19° N and from 98°45′ to 99°15′ E. These areas are flanked by mountain ranges on both the east and west sides, with the Ping River being the main river, generally flowing from north to south. The narrowest width of Chiang Mai Province is approximately 20 km. [37]. Various geologic units, spanning from Precambrian to recent ages, are exposed in the area. Unconsolidated Quaternary alluvium deposits overlay older rock formations, dominating most of Chiang Mai Province [38,39,40]. These aquifers comprise Quaternary sediments, including gravel, sand, silt, and clay, categorized as fluvial deposits aquifers (Qfd), younger terrace aquifers (Qyt), consisting of low terrace aquifers (Qtl) and middle terrace aquifers (Qtm); and the old terrace aquifer (Qot), comparable to high terrace aquifers (Qth) and colluvial aquifers (Qcl). The fluvial deposits aquifer is widespread in the lowlands of the Chiang Mai-Lamphun basin.
On the other hand, consolidated aquifers encompass semi-consolidated aquifers (Tsc), middle Korat aquifers (Jmk), lower Korat aquifers (TRJlk), Lampang aquifers (TRlp), Permian carbonate rocks aquifers (Pc), Permian-Carboniferous metasediments aquifers (PCms), Carboniferous metasediments aquifers (Cms), Ordovician limestone aquifers (Ols), Silurian-Devonian metamorphic aquifers (SDmm), Cambrian metamorphic aquifers (Emm), Precambrian metamorphic aquifers (PEmm), Volcanic aquifers (Vc), and Granitic aquifers (Gr). All these aquifers may undergo fracturing during tectonic events, transforming into cracked consolidated rock aquifers. Groundwater wells in Chiang Mai Province are typically shallow, with a general depth ranging from approximately 20 to 70 m below the ground surface. Figure 3 shows that hydrogeologic cross-sections in lines A0–A1, B0–B1, C0–C1, and D0–D1 (refer to Figure 2) are derived from various lithologic logs, illustrating that semi-consolidated-to-consolidated aquifers are amalgamated into a single, heterogeneous unit, denoted by a dark red color.
The groundwater yield varies across the region, typically falling within the range of 2–10 cubic meters per hour. Notably, the fluvial deposit aquifer (Qfd) exhibits higher groundwater quantities, reaching up to 20 cubic meters per hour, as depicted in Figure 4, modified from the Groundwater Potential Map of Chiang Mai Province (scale 1:100,000, [41]). The flow direction of groundwater resources in the unconsolidated aquifer primarily moves from the edge of the basin towards the center, and ultimately drains into the Ping River. The central alluvial channel of Chiang Mai Province experiences the highest groundwater exploitation. Hydraulic conductivities of these aquifers, as evaluated from pumping tests, range from 0.01 to approximately 20 m per day [42]. Groundwater quality in the region is generally favorable, with the total dissolved solids (TDS) measuring less than 250 mg/L. Fluoride and iron concentrations are consistently low, particularly in the upper part of the aquifer; this can be attributed to the high oxygen levels and flow velocities [2,3].
The research found that it was extremely difficult to delineate the sedimentary units in the Chiang Mai Province, because any correlation was almost impossible due to high heterogeneity [37,43,44]. The hydrostratigraphic model revealed sedimentary facies are associated with varying depths and are intercalated. The correlation between adjacent wells was extremely difficult, due to the lack of key beds or recognizable sequences [44].

3. Materials and Methods

3.1. Research Methodology

This study focuses on evaluating the vulnerability of groundwater resources to pollution loads, stemming from both natural and anthropogenic sources. The assessment aims to gauge the risk of groundwater resource vulnerability in Chiang Mai Province, utilizing a new DRASTIC-LP model. This model integrates groundwater resource vulnerability, climate change scenarios featuring very high greenhouse gas emissions (RCP8.5 scenario), land-use change scenarios, and anthropogenic source points, as identified through the CA_Markov Chain model [45].
The overarching goal is to provide insights into future groundwater resource vulnerability management. Identifying areas that are more susceptible to contamination from both natural and anthropogenic sources has become a pivotal aspect for land-use planning and comprehensive resource management in the northern region of Thailand. This study adheres to the established criteria and employs conventional research methodology, ensuring the reliability and efficient management of operating times. The conceptual framework of all the details of the research methodology is shown in Figure 5, and this also clarifies all aspects of the research methodology, tools, and equipment employed. This comprehensive approach not only strengthens the credibility of the study. but also contributes valuable information for informed decision making in groundwater resource management in Chiang Mai Province.

3.2. Data Analysis and Results of the Study

3.2.1. Climate Change Analysis

A performance analysis of the three general climate models (3GCMs), namely the GFDLSM2M model, the HadGEM2-ES model, and the MIROC-ESM-CHEM model, were compared to determine which model was most suitable for predicting both temperature and rainfall, according to the coefficient of determination (R2 or R-square). From the study, it was revealed that the MIROC-ESM-CHEM model can simulate rainfall behavior in the 30-year period (1991–2020), corresponding to past rainfall behaviors, according to the coefficient of determination (max R2 = 0.5991); this does so in a much more effective way than the HadGEM2-ES model (max R2 = 0.5613), and GFDLSM2M model (max R2 = 0.4503).
1. Monthly temperature data from the 30-year period (1991–2020), provided by the Thai Meteorological Department (TMD) [46] in Chiang Mai Province and its surrounding areas, were collected from eight meteorological stations. These stations were included the Mae Sariang Weather Station (300202), the Mae Hong Son Meteorological Station (300201), the Chiang Mai Meteorological Station (Northern Meteorological Center) (327501), the Lampang Agricultural Weather Station (328301), the Lampang Meteorological Station (328201), the Lamphun Meteorological Station (329201), and the Chiang Rai Meteorological Station (303201). Changes in monthly temperatures over the specified period are depicted in Figure 6.
An analysis of future temperature situations by the MIROC-ESM-CHEM model under the RCP8.5 scenario (very high greenhouse gas (GHG) emissions) is shown in Table 2 and Figure 7. The minimum temperature during the 30-year period (1991–2020) is 20.07 °C for the months of December to February. During the decade of 2021–2030, the minimum temperature is predicted to drop to 18.68 °C, a decrease of −1.38 °C from the 30-year period (1991–2020). Additionally, during the 30-year period (1991–2020), the maximum temperature is 32.08 °C. In the future, specifically across five periods, 2021–2030, 2031–2040, 2041–2050, 2051–2060, and 2061–2070, the maximum temperature is predicted to be 33.44 °C, 33.09 °C, 33.88 °C, 35.43 °C, and 35.48 °C, respectively, with an increase over the 30 years (1991–2020) between +1.02 °C to +3.40 °C. The overall average temperature for the 30 years (1991–2020) is 25.62 °C, while this is predicted to increase from +0.17 °C to +2.55 °C over the 30-year period (1991–2020).
2. Monthly rainfall data from the same period from the Thai Meteorological Depart-ment (TMD) [47], which included 39 stations, and the Royal Irrigation Department (RID) [48], which included 10 stations, but here, the extreme rainfall values were gathered. The continuous monthly rainfall data over a five-year period were used to analyze an average, minimum, and maximum monthly rainfall, as shown in Figure 8.
Analysis of future rainfall situations by MIROC-ESM-CHEM model under RCP8.5 scenario (very high greenhouse gas (GHG) emissions) as shown in Table 3 and Figure 9. During the 30–year period (1991–2020), the average annual rainfall is 1071.43 mm/year. From the prediction of the model, in the decade of 2021–2030, the average annual rainfall is predicted to be 1241.36 mm/year, with a trend increasing of +15.86% over the 30–year period (1991–2020). During the rainy season (July to October) in this decade (2021–2030), the model predicts to be 209.13–290.25 mm., and the highest monthly rainfall in September is 290.25 mm/year. Moreover, in the decade of 2031–2040, the average annual rainfall is predicted to 1241.36 mm/year, with an increasing trend of +15.86% over than the 30–year period (1991–2020). The overall average annual rainfall for three periods: 2041–2050, 2051–2060, and 2061–2070, the model predicts to be 1377.25, 1250.12, and 1339.16 mm/year, respectively. Their average annual rainfall of them, predicted to increase of +16.68% to +28.54%, over the 30–year period (1991–2020).

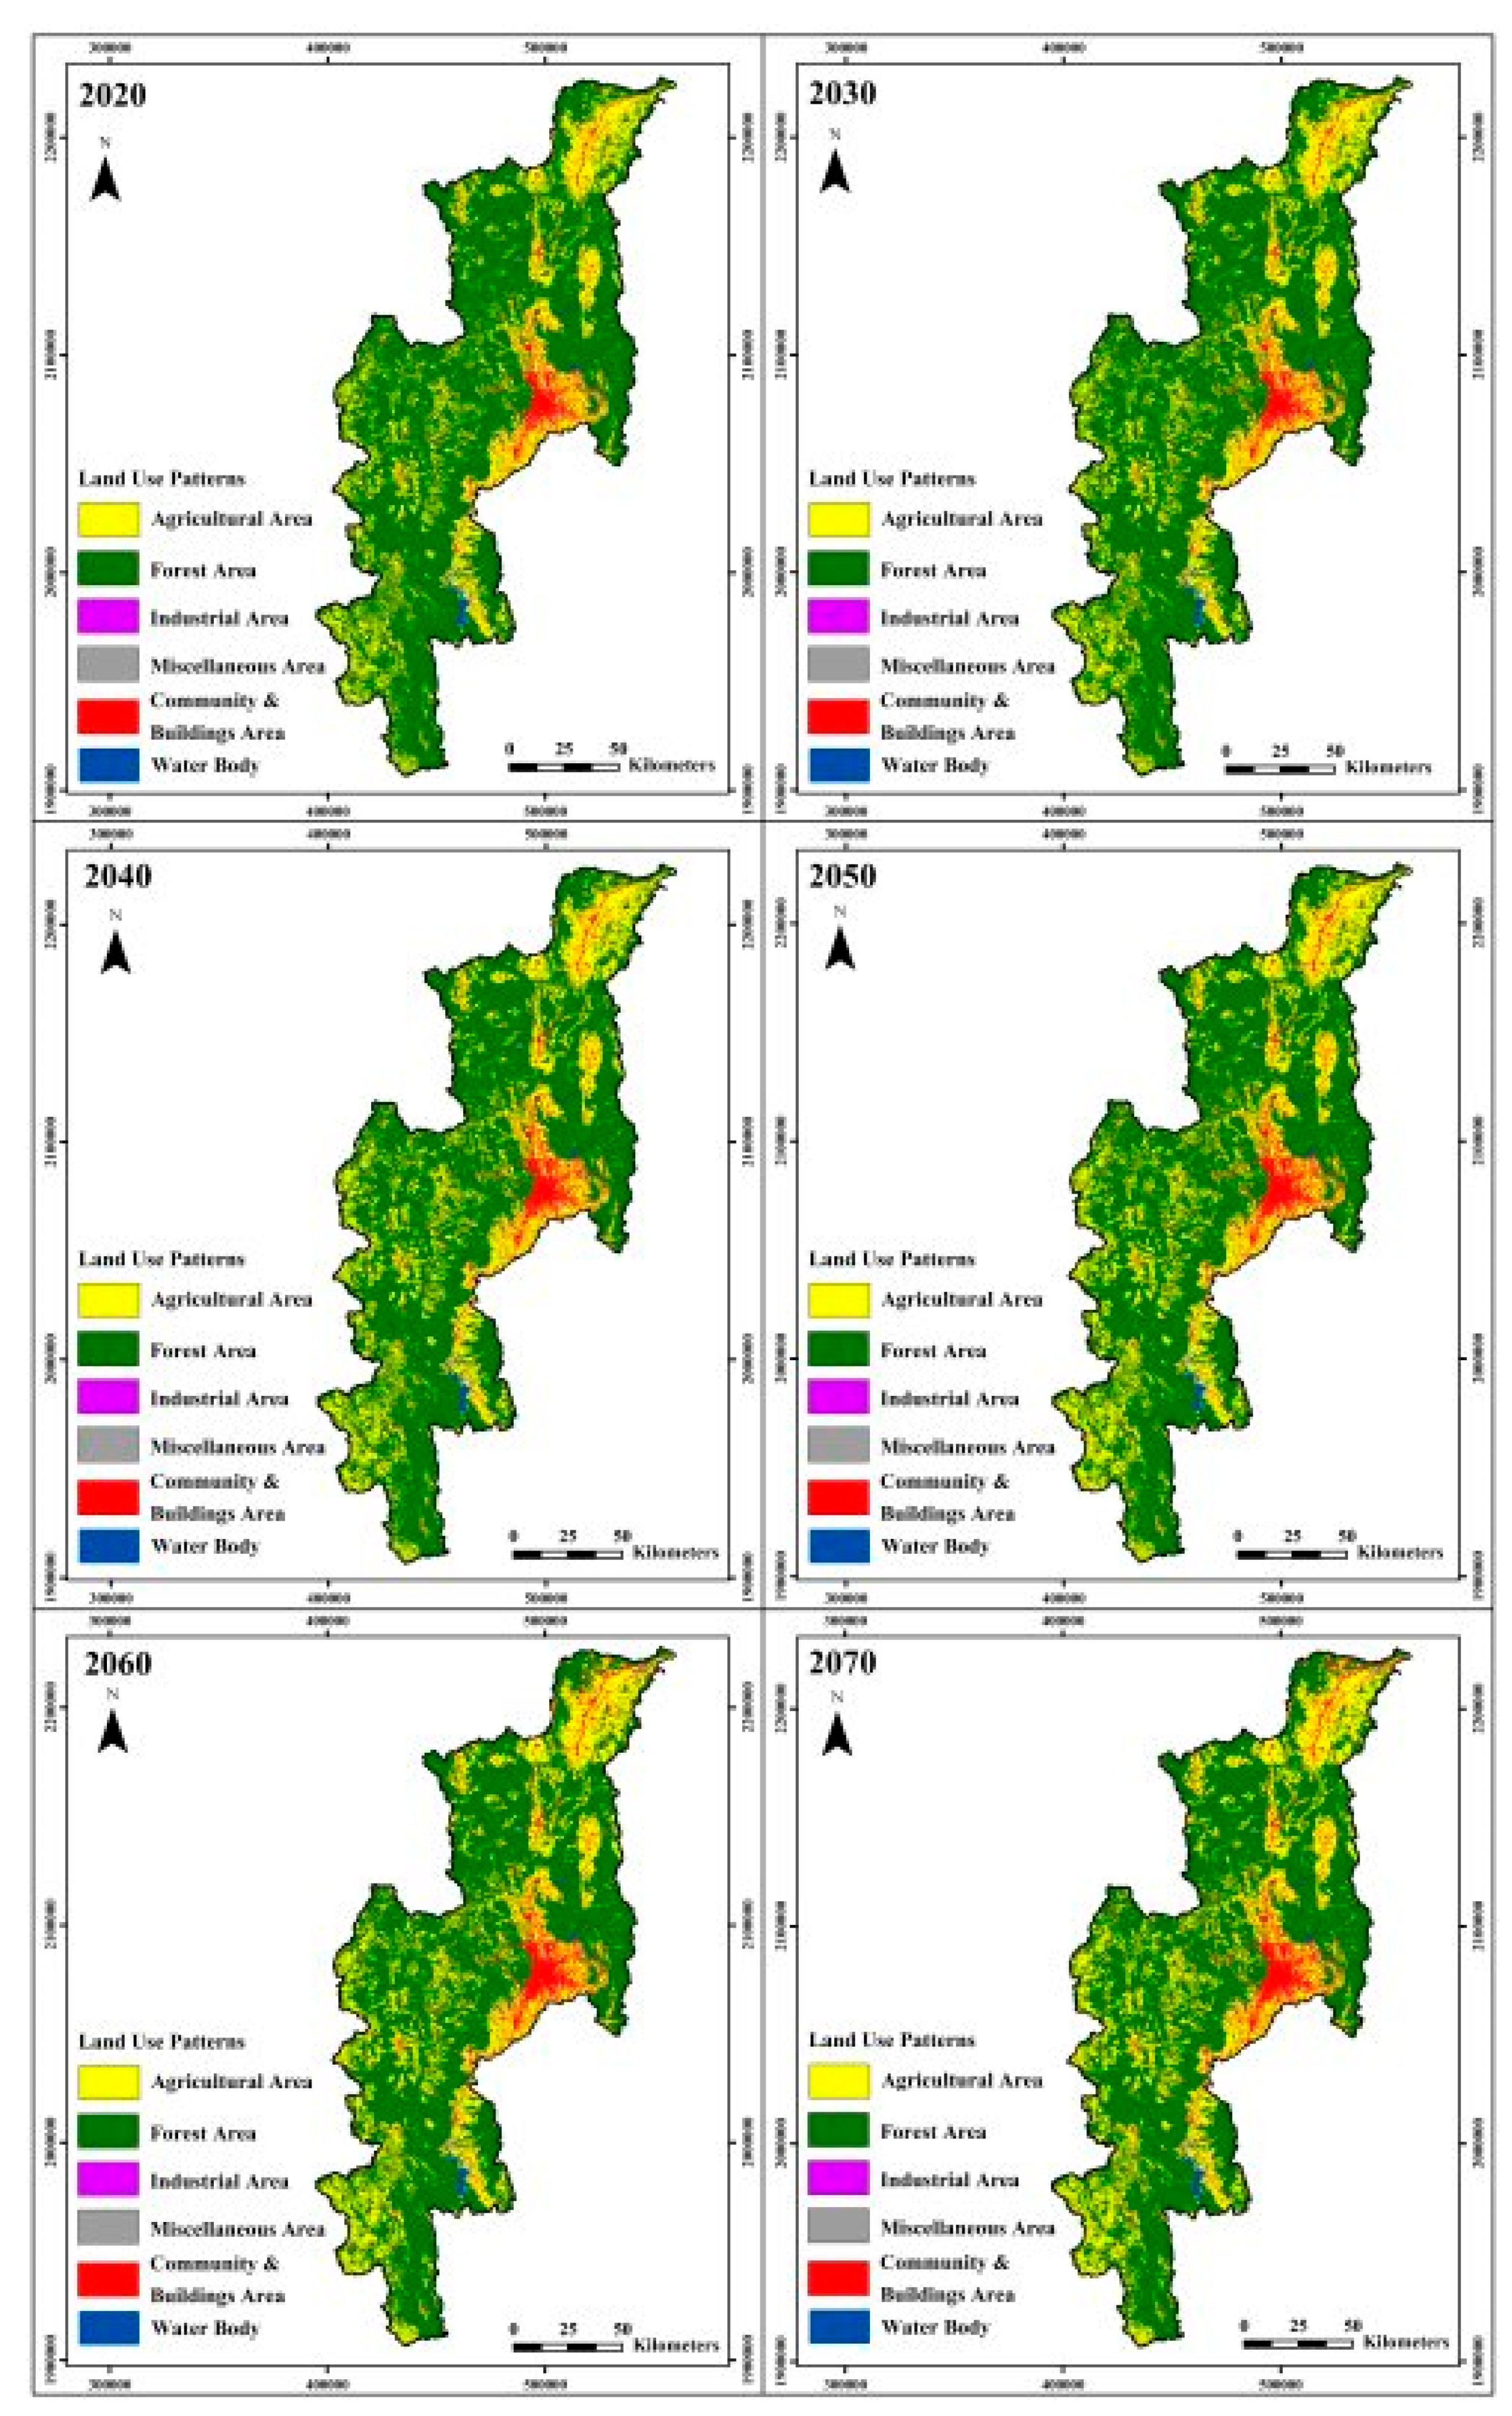
3.2.2. Land-Use Pattern Change Analysis

Satellite data from Landsat-5 and Landsat-8 covering 2001, 2011, and 2020, with a resolution of 30 × 30 m per pixel, has been imported and examined. The existing land-use patterns are applied by a level one land-use map in Chiang Mai Province (GIS), with a scale of 1:25,000 of the Land Development Department (LDD) [49]. These land-use patterns are divided into six categories, namely (i) agricultural areas, (ii) community and buildings areas, (iii) industrial areas, (iv) forest areas, (v) water body, and (vi) miscellaneous areas. A total of twelve scenes of satellite data (Landsat-5/Landsat-8) covering 2001, 2011, and 2020, amounting to four scenes/year, were utilized.
An analysis of trends in land-use pattern changes, as well as community and urban expansion, is undertaken by comparing the changes in land-use patterns over the past 20-year period (2001–2020) using Landsat-8 satellite imagery from 2001, 2011, and 2020. The land-use patterns map for Chiang Mai Province (GIS), 2001, 2011, and 2020, with a scale of 1:25,000 of the Land Development Department (LDD), is shown in Figure 10. Additionally, a topographic map with a scale of 1:4000 (DEM: Digital Elevation Model) is used to verify the accuracy of land-use patterns. Field investigations were conducted in the following time periods: February to March 2020, May to June 2020, and November to December 2020.
An analysis of trends in future land-use patterns changes is conducted for every ten-year period (2030, 2040, 2050, 2060, and 2070) using land-use pattern databases from 2020, in conjunction with Chiang Mai Province Comprehensive Plan. This analysis employs the CA_Markov Chain Model (Cellular Automata and Markov Chain Model) [33], verified at least 5 times to ensure validity and reliability. The analysis of trends in each future land-use pattern changes over a 50-year period (2021–2070) in Chiang Mai Province is represented in Geographic Information System (GIS) maps, as shown in Figure 11 and Table 4.

3.2.3. An Assessment of the Vulnerability of Groundwater Resources

A process for analyzing the groundwater vulnerability in Chiang Mai Province, using the new DRASTIC-LP model, are shown in Figure 5. It can be explained as follows:
1. Normally, either the traditional method or the original DRASTIC model [11] are used for groundwater vulnerability analysis. This research proposed a new approach to groundwater vulnerability assessments by adding two essential extra indexes, which are land-use pattern (L) and point source pollutions (P), into the conventional DRASTIC Equation (1), as follows:
DRASTIC Index (Di) = DrDw + RrRw + ArAw + SrSw + TrTw + IrIw + CrCw + LrLw + PrPw
D = Depth-to-water table
R = Net recharge has been considered from the amount of rainfall in the area and the rate of rainwater infiltration by the soil-type classification of the Land Development Department (LDD) [50], as shown in Equation (2):
r = 0.24(i) + 3.20
The permeability rate was assessed using the percentage of rainfall (r) and the soil permeability coefficient (i), measured using centimeters per hour (cm/hr).
R = Rainfall × Percentage of the permeability rate of water
A = Aquifer media
S = Soil media
T = Topography
I = Impact of vadose zone
C = Hydraulic conductivity of the aquifer
L = Land-use patterns
P = Point sources
r = Weighting values of hydrogeological factors by new DRASTIC-LP model
w = The weights of each determining factor for new DRASTIC-LP model as detailed in Table 5 [11,51].
2. The analysis of vulnerability of the overall groundwater aquifers to pollution is calculated from both secondary data and primary data, obtained from the field investigations.
(a) Depth-to-water table (D): The groundwater development is mainly drilled wells, which are less than 150 m deep. To simulate future net recharge (R) on a large scale, assumptions are proposed based on the very high greenhouse gas (GHG) emissions, using the RCP8.5 scenario provided by the MIROC-ESM-CHEM model. Equation (3), which was used to calculate the depth-to-water table (D), is based on Huang et al. [15]:
D = ΔR(ti) + H(ti)
ΔR(ti) = net recharge occurring between initial time t0 and ending time ti; and H(ti) = baseline depth-to-water table (D), attributed to the recharge period. The predicted scores of the depth-to-water table (D) for the baseline (2020) and the future 50-year periods (2021–2070) are shown in Figure 12.
(b) Net Recharge (R): Considering annual rainfall statistical data from the 30-year period (1991–2020), the rate of rainwater infiltration by the soil-type classification of the Land Development Department (LDD) [50] can be obtained from Equation (2): r = 0.24(i) + 3.20. The permeability rate is assessed as the percentage of rainfall (r) and the soil permeability coefficient (i) in centimeters per hour (cm/h) from the following equation: R = Rainfall × Percentage of the permeability coefficient. The predicted scores of net recharges (R) for the baseline (2020) and the future 50-year period (2021–2070) are shown in Figure 13.
(c) Aquifer Media (A): Considering the aquifer according to the hydrogeological rock unit, there are a total of 17 rock units. Unconsolidated sediment has permeability rates, depending on the properties of the sediment, such as grain size, sorting, and sediment binding, etc. Types of aquifers include fluvial deposit aquifers (Qfd), young terrace deposit aquifers (Qyt), and old terrace deposit aquifers (Qot), while consolidated rocks are highly fractured with high groundwater permeability.
(d) Soil Media (S): This depends on soil texture and soil depth (less than 1.80 m from the soil surface [50]). Soil characteristics are divided into two types, namely clay varieties (low-lying plain with clay, clay mixed with sandstone fragments, laterite, sandy clay, etc.), as well as terraces (slop complex).
(e) Topography or Slope (T): The plain basin on the east side, surrounded by high mountains, causes most areas to have a slope of >18%, accounting for 70% of the total area. Some areas have a slope of <2% (relatively flat), accounting for 9% of the total area.
(f) Impact of Vadose Zone (I): This is classified according to the characteristics of the soil and bedrock above the groundwater layer.
(g) Hydraulic Conductivity of the Aquifer (C): Data obtained from the pumping tests of the main groundwater resources [51] reveal permeability coefficients between 1.0–10.0 m/day.
(h) Land-use patterns (L): These are divided into six types, namely (i) agricultural areas, (ii) forest areas, (iii) water body, (iv) community and building areas, (v) industrial areas, and (vi) miscellaneous. The scores of land-use patterns (L) are shown in Figure 11.
(i) Point Source Pollutions (P): Various anthropogenic activities consist of eight types of point source pollutions, including 233 landfills, 19 sanitary landfills, 457 factories at risk of contamination, 4 active mining sites related to heavy metal elements, 30 active mining sites (industrial quarry), 7 non-active mining sites (old mine), 216 Gas/Petrol Stations, and 1 wastewater treatment plant. A risk assessment for contamination toxics in groundwater resources is conducted using a buffer distance of 200 m from industrial point sources, as shown in Figure 14.
3. Data preparation for groundwater resource vulnerability assessments involves assessing the vulnerability of groundwater resources using a criteria-based vulnerability index with five levels, namely level 1 (very low), level 2 (low), level 3 (moderate), level 4 (high), and level 5 (very high).
4. The tools for analyzing groundwater vulnerability to pollution are as follows:
  • (a)
    ArcGIS Ver. 10.5, comprising a set of tools and commands, is utilized for spatial analysis in a raster-based analysis.
    (b)
    The Model Builder is employed as a process for analyzing the new DRASTIC-LP model to obtain groundwater vulnerability index results (DRASTIC-LP Index Value) regarding pollution.
5. Geo-informatics technology (GIS-based techniques) is selected to create a new groundwater resource vulnerability map (DRASTIC-LP Map). This map is compared with the nitrate (NO3) concentration in groundwater resources from various sources, including the Department of Groundwater Resources (DGR) [51], the Pollution Control Department (PCD, 2020), the Royal Irrigation Department (RID, 2020), and the Environment and Pollution Control Office 1 (Chiang Mai, 2020), etc. These groundwater samples indicate contamination from anthropogenic activities or natural conditions.
6. Calibration of groundwater resource vulnerability using nitrate (NO3) concentration data from field sampling during the rainy (298 samples) and the winter (299 samples) seasons [51]. As nitrate is one of the most important pollutants in the environment, it causes environmental pollution by converting to nitrite (NO2) compounds [52]. It is also found at sites of high levels from anthropogenic activity, such as sewage, septic tank leakages, community, and municipal solid waste. Nitrogen substances are used to make chemical fertilizers, livestock, or non-point pollutions source that runoff from agricultural areas [53]. Moreover, the nitrogen compounds produced by the decomposition of plants and animals accumulated in the soil are converted to nitrate (NO3) compounds by bacteria. Plants absorb nitrogen compounds from the soil in the form of nitrate (NO3) compounds. It can infiltrate into the ground and reach plant roots and, therefore, groundwater resources very easily by rainfall or runoff. Infants below six months old consuming water with high nitrate (NO3) concentrations may experience serious health issues, become seriously ill, and, if untreated, may die, not to mention conditions such as shortness of breath or blue-baby syndrome. The US EPA reported that when nitrate (NO3) concentrations in groundwater resources exceed 1 mg/L, this indicates contamination from anthropogenic activities [54]. Additionally, concentrations exceeding 3 mg/L suggest contamination affecting domestic consumption [55]. The EPA’s maximum contaminant level (MCL) for nitrate (NO3) concentrations to protect against blue-baby syndrome must be over 10 mg/L. The groundwater threshold for monitoring should begin at 5.0 mg/L (Estimated Use of Water in the United States: USGS, 2005) [56], while the groundwater quality standard for drinking purposes, according to the notification of the Ministry of Natural Resources and Environment (2008) [55], is 45.0 mg/L for the maximum allowable concentration of nitrate (NO3). The groundwater resource vulnerability is assessed by with groundwater nitrate (NO3) concentrations from groundwater samples collected during the rainy season (September 2018 to November 2018), comprising 299 samples, and during the winter season (December 2018 to February 2019), consisting of 298 samples [51]. These findings are shown in Figure 15. The results showed concentrations exceeding 3 mg/L in 34 samples of the rainy season, or 11.37% of a total sample, and 4 samples of the winter season, or 8.30% of a total sample. The groundwater nitrate (NO3) concentrations exhibit high vulnerability class in both the young terrace deposits aquifer (Qyt) and the old terrace deposits aquifer (Qot) (Figure 16). These groundwater resources, in both types of aquifers, are used in most intensive agricultural areas along the river bank and tributaries. These results are consistent with the existing literature and regulatory standards. Dubrovsky et al. [57] and Madison and Brunett [58] both indicate the EPA’s maximum contaminant level (MCL), as well as the estimated use of water in the United States in 2005 [56], suggesting that groundwater resource vulnerability ranges from moderate to very high classes due to anthropogenic activities in these areas. Although the concentration values in some areas do not exceed the groundwater standard according to the EPA’s maximum contaminant level (MCL) and estimated use of water in the United States in 2005 [56], the likelihood of contamination remains significant in areas with high anthropogenic activity.
7. Conventionally, groundwater resource vulnerability is analyzed with the original DRASTIC model (seven indexes) [11]. This research proposes a new approach for groundwater vulnerability analysis (the new DRASTIC-LP model) by adding two essential extra-indexes, which are two risk factors caused by anthropogenic activities: land-use patterns (L) and point source pollutions (P). Thus, groundwater vulnerability can be obtained from the following Equation (4):
DRASTIC Index (Di) = DrDw + RrRw + ArAw + SrSw + TrTw + IrIw + CrCw + LrLw + PrPw
Additionally, groundwater resource vulnerability, as determined by the criteria for assessing the vulnerability index, is divided into 5 levels: <120.00 scores (level 1: very low), 120.00–140.00 scores (level 2: low), 140.01–160.00 scores (level 3: moderate), 160.01–180.00 scores (level 4: high), and >180.00 scores (level 5: very high). The distribution of ground-water vulnerability in Chiang Mai Province, considering the increasing risk factors from anthropogenic activities, land-use patterns (L), and point source pollutions or point sources (P), using the new DRASTIC-LP, is shown in Table 6 and Figure 17. These results reveal that the anthropogenic activities (L, P), and the depth-to-water table (D) directly influence vulnerability and the risk of pollution contaminant in groundwater resources. Moreover, the results of the analysis are more reliable than the conventional analysis as they are simulated in current conditions and situations. The analysis of the groundwater vulnerability using the new DRASTIC-LP model can be a better and more comprehensive analysis than the original DRASTIC model [11] and can also contribute to long-term resource management. Pollution levels are rapidly increasing due to the expansion of urban communities, intensive agricultural areas, and industries/factories/manufactures, etc., highlighting the importance of these results. National resources are heavily used with very few appropriate controls. The variety of pollution depends on the various land-use patterns, as well as point source pollutions. Moreover, the pollutants are directly correlated to the quality of groundwater resources. Thus, the contamination of pollution to groundwater resources has to be seriously protected, in order to sustain these resources.
8. An analysis of groundwater resource vulnerability using the new DRASTIC-LP model was conducted, comparing the present (2020) with the future situations over the 50-year period (2021–2070). Key factors considered include predictions of rainfall behavior under the RCP8.5 scenario [(very high greenhouse gas (GHG) emissions)] and the land-use patterns, as modeled by the CA_Markov Chain Model, which is one of the risk factors that influenced the change of the vulnerability of groundwater resources. These results highlight the trends of decreasing or increasing groundwater vulnerability projected by the MIROC-ESM-CHEM model for future periods of every 10 years (2021–2030, 2031–2040, 2041–2050, 2051–2060, and 2061–2070), as shown in Table 6 and Figure 17. The overall vulnerability changes in groundwater resources in Chiang Mai Province, Thailand during the period ranging 2000–2070 covers 20,107.06 sq.km., with percentages in vulnerability classes for very low (−5.10%), low (+3.44%), moderate (+0.48%), high (−0.24%), and very high (+1.41%). The anticipated groundwater vulnerability changes in the next 50 years (2021–2070) suggest significant shifts in groundwater vulnerability patterns under the combined influence of climate change and land-use patterns, particularly under the RCP8.5 scenario. Some areas of Chiang Mai Province may face a high risk of groundwater pollution in this period (2021–2070), with vulnerability classes expanding from urban centers, the central business district (CBD), the medium-large industrial areas, and the intensive agricultural areas, etc., to surrounding areas, especially recharge areas and lowland areas along the main rivers, namely Nam Mae Ping, Nam Mae Kok, Nam Mae Khan, and Nam Mae Taeng, etc. These overall areas of vulnerability classes of moderate to very high will directly affect and increase the areas of expansion, corresponding to the risk of increasing groundwater pollution in the future. Furthermore, the areas of vulnerability classes of low to very low will also substantially decrease. Hence, the results affirm that the new DRASTIC-LP model in this study is able to effectively identify the potential areas of Chiang Mai Province, Thailand that are more vulnerable to groundwater pollution.

4. Groundwater Resource Risk Management

Normally, achieving the sustainable development of groundwater resources involves striking a balance between usage and demand, encompassing both aspects of quality and quantity. In Chiang Mai Province, it has become evident from historical to current contexts that effective groundwater resource management is imperative. Failure to regulate and mitigate groundwater usages can result in various short-term and long-term problems, including groundwater deterioration, heavy metal contamination, other toxins, and even over-pumping. Consequently, managing groundwater resources is intricately linked to the overseeing groundwater user groups to attain equilibrium within the socio-economic system for national development and ensuring the sustainability of hydrogeological systems on the supply side. A risk management approach for the sustainable development of groundwater resources is proposed as follows:
1. Groundwater resource management for sustainable development is divided into three phases, as follows:
(a) Short-term or urgent phase (1–3 years):
      • Government agencies must thoroughly study and review existing laws and regulations related to groundwater protection, utilization, monitoring, remediation, as well as identify regulatory gaps and update needs.
      • Establish a baseline database of the nation’s groundwater quality, review the locations of monitoring stations and data gaps, and ensure that the collected data aligns with the requirements for monitoring and prediction models.
      • Establish heavy metals baseline values in groundwater resources, review critical parameters, and set up a list of parameters to be tracked and modeled, including useful indicators like As, Pb, and NO3, etc. Urgent mitigating measures should focus on controlling and reducing fertilizer use, including nitrate and pollution control, particularly wastewater from septic tanks in urban areas.
      • Establish a general awareness campaign, including in schools, emphasizing the importance of properly managing this valuable natural resource. Encourage uncontrolled farmers who are conducting agricultural activities along the Mae Ping River to cooperate in reducing fertilizer use, including nitrate, especially in urban areas.
(b) Medium-term phase (3–10 years):
      • Strengthen and focus on regulations for better the monitoring and control of groundwater resource usage.
      • Develop guidelines for planning, developing, remediating, and monitoring groundwater use, as well as treatment, rehabilitation, and damage assessment for heavy metal contamination in groundwater resources.
      • Authorize and expand the roles and responsibilities of relevant government agencies, especially the Department of Groundwater Resources (DGR), the Royal Irrigation Department (RID), the Department of Water Resources (DWR), and the Office of National Water Resources (ONWR).
      • Promote community education and involvement in groundwater management, as well as generate economic tools to offset damage to anthropogenic, natural resources, and the environmental aspects from heavy metal or toxic contamination in groundwater resources.
(c) Long-term phase (>10 years):
      • Concerned government agencies, especially the Department of Ground-water Resources (DGR), must be supported, and must cooperate with other local agencies and local communities for public participation in all sectors related to groundwater resources management. The participation cloud involves site selection, groundwater well drilling, well development, the design and installation of pumps, training, and well maintenance.
      • Review the institutional structure for groundwater resource management and the roles of stakeholder departments at 10–year intervals for efficiency and relevance in order to adapt to changing conditions and needs.
      • Periodically review regulations, guidelines, and standards every 10–15 years in order to ensure that they remain up to date with practices and technology. Harmonize water-related laws for both groundwater and surface water resources.
      • Continuously educate and raise awareness in every sector, intermittently.
2. The action plan for sustainable groundwater resource management should be implemented in order to inspect and assess the conditions of groundwater resources, based on the study and analysis of main factors like groundwater vulnerability, vulnerability mapping, contamination risks, groundwater conditions, treatment plants, rehabilitation, groundwater damage assessment, and the roles and responsibilities of concerned government agencies. Thus, the action plan for sustainable groundwater resource management should involve the country, expanding the tool for local decision makers and assessing scenarios, such as new developments. Responsible government agencies include the Department of Groundwater Resources (DGR), the Department of Industrial Work (DIW), the Department of Local Administration (DLA), the Provincial Industry Office (PIO), the Environmental and Pollution Contral Office (EPCO), the Provincial Public Health Office (PPHO), and the Provincial Natural Resources and Environment Office (PNREO), etc. These action plans include the following:
(a) Establish a predictive vulnerability model for all regions.
(b) Develop the early warning system, disseminating information to local communities, decision makers, and stakeholder agencies at the central level. Responsible government agencies include the Department of Groundwater Resources (DGR), the Department of Industrial Work (DIW), the Department of Local Administration (DLA), the Provincial Industry Office (PIO), the Environmental and Pollution Control Office (EPCO), the Provincial Public Health Office (PPHO), and the Provincial Natural Resources and Environment Office (PNREO), etc.
(c) Implement a remote data collection, monitoring, and evaluation system for obtaining real-time data. Responsible agencies include the Department of Groundwater Resources (DGR), the Pollution Control Department (PCD), the Wastewater Management Authority (WMA), the Department of Industrial Works (DIW), the Provincial Industry Office (PIO), the Provincial Natural Resources and Environment Office (PNREO), and the Environmental and Pollution Control Office (EPCO), etc.
(d) Develop pollution source tracking and identification capabilities using the model to identify illegal polluters. Responsible government agencies include the Pollution Control Department (PCD), the Provincial Natural Resources and Environment Office (PNREO), and the Department of Groundwater Resources (DGR), etc.
(e) Set up an interface plan for water resource management, integrating groundwater and surface water resources. Responsible government agencies include the Department of Groundwater Resources (DGR), the Royal Irrigation Department (RID), the Office of the National Water Resources (ONWR), and the Department of Water Resources (DWR), etc.
(f) Determine guidelines for improving the law in order to enhance the roles and duties of officials under the Groundwater Act 1977, making them administrative officials or police officers, according to the criminal procedure law for more efficient law enforcement. Responsible government agencies include the Department of Groundwater Resources (DGR), the Secretariat of the House of Representatives (SHR), and the Secretariat of the Senate (SS), etc.

5. Discussion

The primary objective of groundwater resource protection is to safeguard both consolidated and unconsolidated aquifers, comprehensively. In addition, groundwater source protection aims to prevent the anthropogenic contamination of groundwater production wells, as opposed to natural contamination. While most groundwater vulnerability studies focus on groundwater resource protection, this research extends its scope to encompass all vulnerability studies related to groundwater resources or groundwater source protection. Previous studies have proposed various methods for assessing groundwater resource vulnerability over the past 35 years, as shown in Table 7. These various methods highlight diverse approaches undertaken globally, starting with the original DRASTIC model [11], and evolving through subsequent modifications, e.g., Sadat-Noori and Ebrahimi [14], Jenifer and Jha [16], Maqsoom et al. [17], Rahman [18], Shirazi et al. [19], Zghibi et al. [20], Abdeslama et al. [21], Rajput et al. [22], Mohammed et al. [23], Nurroh et al. [24], Bera et al. [25], Chilaue et al. [26], Zhang et al. [27], and Wei and Chi [28]. Some studies have applied the original DRASTIC model to the modified DRASTIC model, e.g., Lima et al. [12], Li and Merchant [13], Sadat-Noori and Ebrahimi [14], Huang et al. [15], Jenifer and Jha [16], Maqsoom et al. [17], Mkumbo et al. [30], and Zhang et al. [29], and Mkumbo et al. [30]. These reviews focus on index-based applied methods, considering land-use pattern changes and/or climate change, for both the current situation and the future scenarios when assessing groundwater resource vulnerability. Consequently, a comprehensive review of the literature, as shown in Table 1, reveals that past reviews had several gaps and lacked a coverage of studies that dealt with groundwater resource vulnerability under the influence of climate change and land-use pattern changes, and while using modern models. These limitations imply a narrow focus, necessitating an in-depth review, considering the state-of-the-art methods and approaches that consider the influence of climate change and land-use pattern changes, based on the current situation and the future scenarios, and using modern models.
This paper aims to assess the future risks of groundwater resource vulnerability patterns, based on climate change, projected by the MIROC-ESM-CHEM model under the RCP8.5 scenario (indicating very high greenhouse gas emissions), stemming from anthropogenic activities and changes in land-use patterns (using the CA_Markov Chain model). These risks span various spatial and temporal scales. This study integrates climate change, land-use pattern changes models, and a groundwater vulnerability model using GIS-based overlay techniques to produce a groundwater vulnerability map for the next 50 years (2021–2070) in Chiang Mai Province, Northern Thailand. The new DRASTIC-LP approach, modified by Aller et al. [11], effectively links groundwater resource vulnerability patterns with climate change and land-use pattern changes at the regional scale, with potential application in other areas of Thailand and even globally.
The results of the new DRASTIC-LP mapping indicate that groundwater resource vulnerability patterns in Chiang Mai Province will change over the next 50 years (2021–2070). The risk of groundwater resource vulnerability, centered around districts like Mueang Chiang Mai District, Mae Rim District, Saraphi District, Mae Taeng District, Hang Dong District, San Sai District, San Pa Tong District, San Kamphaeng District, Chom Thong District, Doi Tao District, Doi Lo District, Mae Ai District, Fang District, and Hot District, is expected to spread continuously to surrounding areas. The study emphasizes that the eastern areas of Chiang Mai Province, particularly recharge areas and low-lands along main rivers and tributaries, will be significantly affected by climate change and land-use pattern changes. Under the RCP8.5 scenario (very high greenhouse gas emissions) in the next 50 years (2021–2070), the new DRASTIC-LP modeling reveals an increased contamination risk in groundwater resources through nitrate (NO3) compounds from chemical fertilizers and/or pesticide in intensive agricultural sectors and/or the processing of industrial areas, especially in the eastern part of Chiang Mai Province. The results indicate a notable rise in groundwater pollution risks under these scenarios, suggesting that the rapid development of Chiang Mai Province may not be sustainable in terms of the environment, social aspects, and quality of life. Recent field studies conducted during February to March 2020, May to June 2020, and November to December 2020 [51,52] further support these findings, showing a significant increase in nitrate (NO3) concentrations in the shallow groundwater aquifer in eastern areas and lowlands along main rivers and tributaries. Furthermore, in the future, increasing risks of groundwater pollution will persist, driven by urbanization and the expansion of intensive agricultural areas, industrial processes, and anthropogenic activities. To address these concerns, effective site selection, the prioritization of monitoring areas, appropriate remedial measures, and the formulation of pollution protection and prevention strategies and policies are crucial, especially in high groundwater vulnerability areas.

6. Conclusions

In conclusion, the new approach model serves as a valuable planning and predictive tool for local and national decision makers involved in regional development. While this study focuses on Chiang Mai Province, its adaptability and applicability is evident, particularly in other regions of Thailand or even globally who are facing significant climate changes and rapid land-use pattern changes. Considering future climate changes when using the MIROC-ESM-CHEM Model under the RCP8.5 scenario (very high greenhouse gas emissions), alongside future land-use patterns by the CA_Markov Chain model, the simulation of groundwater vulnerability patterns for the next 50 years (2021–2070) emphasizes the necessity of formulating policies and strategies for sustainable groundwater resource development. The groundwater vulnerability map, derived from the new DRASTIC-LP model, can be used as a base for managing groundwater pollution in the future scenario, aiding decision makers in identifying potential vulnerabilities and taking early measures to protect and restore critical groundwater resources in Chiang Mai Province.
The contamination-risk management of sustainable groundwater resource development places emphasis on concerned government agencies. Standardizing and establishing heavy metal baseline values in groundwater resources, along with classifying groundwater quality, are imperative. Moreover, a thorough review and legislation of pertinent laws and regulations, accompanied by the authorization and expansion of roles and responsibilities of concerned government agencies, are necessary. The promotion and support of local communities in participating in the maintenance, selection of groundwater well sites, and well development, as well as fostering public participation across various sectors such as government, local scholars, academia, local communities, and industrial private sectors, etc., are essential actions. These efforts are particularly crucial for generating economic tools to address any environmental damage caused by anthropogenic activities, as well as the contamination of heavy metals or toxic wastes in groundwater resources. Consequently, an action plan for sustainable groundwater resource management must be implemented to inspect and assess the condition of groundwater resources. This action plan should be based on the results of studies and analyses addressing the following issues:
1. Groundwater resource vulnerability: Evaluate the susceptibility of groundwater resources to external influences, considering factors such as land-use patterns, anthropo-genic activities, and point source pollutions.
2. Groundwater vulnerability map: Develop comprehensive groundwater resource vulnerability maps using advanced tools and GIS-based techniques, integrating data on climate change, land-use patterns, and hydrogeological conditions.
3. Groundwater risk: Identify and assess potential contamination risks associated with groundwater contamination, considering factors like point pollutant sources, aquifer characteristics, and human or anthropogenic activities.
4. Groundwater conditions: Analyze the present state of groundwater conditions, including water levels, quality, and natural variations, to understand the contamination baseline and potential deviations.
5. Treatment plan: Formulate plans for treating contaminated groundwater, outlining effective strategies for the removal of pollutants and the implementation of preventive measures.
6. Rehabilitation: Develop rehabilitation programs for every area affected by ground-water contamination and groundwater risks, including measures to restore aquifer health and mitigate long-term environmental damage.
7. Groundwater damage assessment: Conduct assessments to quantify and under-stand the extent of damage caused by anthropogenic/human activities, heavy metal contamination, or toxic waste in groundwater resources.
8. Roles and responsibilities of concerned government agencies: Clearly define and allocate roles and responsibilities among government agencies involved in groundwater management, such as the Department of Groundwater Resources (DWR), the Royal Irriga-tion Department (RID), and the Environmental and Pollution Control Office (EPCO).
By systematically addressing these issues in the action plan, effective and sustainable groundwater management can be achieved. The active involvement of local communities and collaboration across diverse sectors will play a pivotal role in mitigating environ-mental damage and ensuring the long-term health of groundwater resources.
The results of this study will be extended in future studies in mapping the risks of groundwater contamination under climate change, based on the RCP8.5 scenario and changes in land-use patterns for the 50-year period with numerical concept models, hydrogeological models, or (numerical) groundwater flow models (or called MODFLOW model) [59]. It predicts the possibility of spreading the risk of heavy metal contamination in groundwater resources from pollutant sources. Moreover, it is also used to predict the impacts of anthropogenic activities on the quality and quantity of groundwater resources.

Author Contributions

Conceptualization, C.I. and A.L.; methodology, C.I. and A.L.; software, C.I.; validation, C.I. and A.L.; formal analysis, C.I.; investigation, C.I. and A.L.; resources, C.I.; data curation, C.I.; Writing—Original draft preparation, C.I.; Writing—Review and editing, C.I. and A.L.; visualization, C.I.; supervision, A.L. All authors have read and agreed to the published version of the manuscript.

Funding

This research received no external funding.

Data Availability Statement

The behavior of temperature, rainfall conditions, land-use patterns, figures and tables of groundwater vulnerability, and groundwater contamination-risk maps, as well as simulation input files, are available upon request.

Acknowledgments

This research work was partially supported data by the Department of Groundwater Resources (DGR), the Royal Irrigation Department (RID), and the Thai Meteorological Department (TMD). The authors would also like to express their gratitude to company employee of Dhara Consultants Co., Ltd., in Sam Sern Nok, Huai Khwang, Bangkok, Thailand and Trans Asia Consultants Co., Ltd., in Sam Nok, Huai Khwang, Bangkok, Thailand who contributed to their support data for this academic research publication.

Conflicts of Interest

The authors declare that the research was conducted in the absence of any commercial or financial relationships that could be construed as a potential conflict of interest.

References

  1. Thairath Newspaper. Underground Treasure Inscriptions: The Ministry of Natural Resources and Environment, “Groundwater maps” across the Country Solve the Repeated “Drought” Crisis. Available online: https://www.thairath.co.th/news/local/1701995 (accessed on 12 November 2023).
  2. Department of Groundwater Resources (DGR). Thailand’s Conjunctive Groundwater and Surface Water Use Planning: Northern Thailand; Final Report; Ministry of Natural Resources and Environment: Bangkok, Thailand, 2010. [Google Scholar]
  3. Department of Groundwater Resources (DGR). The State of Groundwater Annual Report: Thailand Groundwater Monitoring Networks Project; Final Report; Ministry of Natural Resources and Environment: Bangkok, Thailand, 2018. [Google Scholar]
  4. Zhao, X.; Wang, D.; Xu, H.; Ding, Z.; Shi, Y.; Lu, Z.; Cheng, Z. Groundwater pollution risk assessment based on groundwater vulnerability and pollution load on an isolated island. J. Chemosphere 2022, 289, 133134. [Google Scholar] [CrossRef] [PubMed]
  5. National Research Council (NRC). Groundwater Vulnerability Assessment: Predictive Relative Contamination Potential under Conditions of Uncertainty; National Academy Press: Washington, DC, USA, 1993; 211p. [Google Scholar]
  6. Machiwal, D.; Jha, M.K.; Singh, V.P.; Mohan, C. Assessment and mapping of groundwater vulnerability to pollution: Current status and challenges. Earth-Sci. Rev. 2018, 185, 901–927. [Google Scholar] [CrossRef]
  7. Ducci, D. Influence of Climate Changes on Vulnerability Maps. In Proceedings of the First Conference and Workshop on “Groundwater and Climate Change”, Norwich, UK, 4–6 April 2005. [Google Scholar]
  8. Butscher, C.; Huggenberger, P. Modeling the temporal variability of karst groundwater vulnerability, with implications for climate change. Environ. Sci. Technol. 2009, 43, 1665–1669. [Google Scholar] [CrossRef]
  9. Keilholz, P.; Disse, M.; Halik, U. Effects of land use and climate change on groundwater and ecosystems at the Middle Reaches of the Tarim River Using the MIKE SHE integrated hydrological model. Water 2015, 7, 3040–3056. [Google Scholar] [CrossRef]
  10. Nistor, M.M. Vulnerability of groundwater resources under climate change in the Pannonian Basin. Geo-Spat. Inf. Sci. 2019, 22, 345–358. [Google Scholar] [CrossRef]
  11. Aller, L.; Bennett, T.; Lehr, J.; Petty, R.J.; Hackett, G. DRASTIC: A Standardized System for Evaluating Groundwater Pollution Potential using Hydrogeologic Settings; NWW AIEPA Series; Robert, S., Ed.; US.EPA Report 600/2-87/035; Kerr Environmental Research Laboratory: Ada, OK, USA, 1987; 622p. [Google Scholar]
  12. Lima, M.L.; Zelaya, K.; Massone, H. Groundwater vulnerability assessment combining the drastic and Dyna-Clue Model in the Argentine Pampas. Environ. Manag. 2011, 47, 828–839. [Google Scholar] [CrossRef]
  13. Li, R.; Merchant, J.W. Modeling vulnerability of groundwater to pollution under future scenarios of climate change and biofuels-related land use change: A case study in North Dakota, U.S.A. Sci. Total Environ. 2013, 447, 32–45. [Google Scholar] [CrossRef]
  14. Sadat-Noori, M.; Ebrahimi, K. Groundwater vulnerability assessment in agricultural areas using a modified DRASTIC model. Environ. Monit. Assess. 2016, 188, 19. [Google Scholar] [CrossRef]
  15. Huang, L.; Zeng, G.; Liang, J.; Hua, S.; Yuan, Y.; Li, X.; Dong, H.; Liu, J.; Nie, S.; Liu, J. Combined Impacts of Land Use and Climate Change in the Modeling of Future Groundwater Vulnerability. J. Hydrol. Eng. 2017, 22. [Google Scholar] [CrossRef]
  16. Jenifer, M.A.; Jha, M.K. Comparative evaluation of GIS-based models for mapping aquifer vulnerability in hard-rock terrains. Environ. Earth Sci. 2018, 77, 672. [Google Scholar] [CrossRef]
  17. Maqsoom, A.; Aslam, B.; Khalil, U.; Ghorbanzadeh, O.; Ashraf, H.; Tufail, R.; Farooq, D.; Blaschke, T. A GIS-based DRASTIC Model and an adjusted DRASTIC Model (DRASTICA) for groundwater susceptibility assessment along the China-Pakistan Economic Corridor (CPEC) Route. ISPRS Int. J. Geo-Inf. 2020, 9, 332. [Google Scholar] [CrossRef]
  18. Rahman, A. A GIS based DRASTIC model for assessing groundwater vulnerability in shallow aquifer in Aligarh, India. Appl. Geogr. 2008, 28, 32–53. [Google Scholar] [CrossRef]
  19. Shirazi, S.M.; Imran, H.M.; Akib, S.; Yusop, Z.; Harun, Z.B. Groundwater vulnerability assessment in the Melaka State of Malaysia using DRASTIC and GIS techniques. Environ. Earth Sci. 2013, 70, 2293–2304. [Google Scholar] [CrossRef]
  20. Zghibi, A.; Merzougui, A.; Chenini, I.; Ergaieg, K.; Zouhri, L.; Tarhouni, J. Groundwater vulnerability analysis of Tunisian coastal aquifer: An application of DRASTIC index method in GIS environment. Int. Soc. Groundw. Sustain. Dev. 2016, 2–3, 169–181. [Google Scholar] [CrossRef]
  21. Abdeslama, I.; Fehdia, C.; Djabrib, L. Application of DRASTIC method for determining the vulnerability of an alluvial aquifer: Morsott-El Aouinet Northeast of Algeria: Using ArcGIS environment. In Proceedings of the International Conference on Technologies and Materials for Renewable Energy, Environment and Sustainability, TMREES17, Beirut, Lebanon, 21–24 April 2017. [Google Scholar]
  22. Rajput, H.; Goyal, R.; Brighu, U. Modification and optimization of DRASTIC model for groundwater vulnerability and contamina-tion risk assessment for Bhiwadi Region of Rajasthan, India. Environ. Earth Sci. 2020, 79, 136. [Google Scholar] [CrossRef]
  23. Mohammed, S.H.A.; Nejad, R.A.; Hamamin, D.F. Vulnerability pesticide DRASTIC and risk intensity map for multi aquifer units: A case study from Basara basin, Iraqi Kurdistan Region. Eurasia J. Biosci. 2020, 14, 6119–6131. [Google Scholar]
  24. Nurroh, S.; Gunawan, T.; Kurniawan, A. Assessment of groundwater pollution risk potential using DRASTIC Model in Yogyakarta City, Indonesia. E3S Web Conf. 2020, 200, 02002. [Google Scholar] [CrossRef]
  25. Bera, A.; Mukhopadhyay, B.P.; Das, S. Groundwater vulnerability and contamination risk mapping of semi-arid Totko River Basin, India using GIS-based DRASTIC model and AHP techniques. Chemosphere 2022, 307, 135831. [Google Scholar] [CrossRef]
  26. Chilaule, S.M.; Vélez-Nicolás, M.; Ruiz-Ortiz, V.; Sánchez-Bellón, Á.; García-López, S. Assessment of Intrinsic Vulnerability Using DRASTIC vs. Actual Nitrate Pollution: The Case of a Detrital Aquifer Impacted by Intensive Agriculture in Cádiz (Southern Spain). Agriculture 2023, 13, 1082. [Google Scholar] [CrossRef]
  27. Zhang, Q.; Shan, Q.; Chen, F.; Liu, J.; Yuan, Y. Groundwater Vulnerability Assessment and Protection Strategy in the Coastal Area of China: A GIS-Based DRASTIC Model Approach. Appl. Sci. 2023, 13, 10781. [Google Scholar] [CrossRef]
  28. Wei, Z.; Chi, Z. Groundwater Risk Assessment Based on DRASTIC and Special Vulnerability of Solidified/Stabilized Heavy-Metal-Contaminated Sites. Sustainability 2023, 15, 2997. [Google Scholar] [CrossRef]
  29. Zhang, Y.; Qin, H.; An, G.; Huang, T. Vulnerability Assessment of Farmland Groundwater Pollution around Traditional Industrial Parks Based on the Improved DRASTIC Model-A Case Study in Shifang City, Sichuan Province, China. Int. J. Environ. Res. Public Health 2022, 19, 7600. [Google Scholar] [CrossRef] [PubMed]
  30. Mkumbo, N.J.; Mussa, K.R.; Mariki, E.E.; Mjemah, I.C. The Use of the DRASTIC-LU/LC Model for Assessing Groundwater Vulnerability to Nitrate Contamination in Morogoro Municipality. Tanzan. Earth 2022, 3, 1161–1184. [Google Scholar] [CrossRef]
  31. IPCC. AR5 Synthesis Report: Climate Change 2014; Mach, K.J., Planton, S., Stechow, C.V., Eds.; ANNEX II: Glossary; IPCC: Geneva, Switzerland, 2014. [Google Scholar]
  32. Hyandye, C.; Lawence, W.M. A Markovian and cellular automata land-use change predictive model of the Usangu Catchment. Int. J. Remote Sens. 2017, 38, 64–81. [Google Scholar] [CrossRef]
  33. Chiang Mai Provincial Office, Strategic and Information for Provincial Development Unit. Briefing Information of Chiang Mai Province; Chiang Mai Provincial Office: Chiang Mai, Thailand, 2020. [Google Scholar]
  34. Royal Forest Department (RFD), Information and Communication Technology Center. Statistical Book of the Royal Forest Department 2019; Ministry of Natural Resources and Environment: Bangkok, Thailand, 2019. [Google Scholar]
  35. Department of Groundwater Resources (DGR), Bureau of Groundwater Conservation and Restoration. Activity No. 1 Report: Thailand Groundwater Situation Report, Project to Establish an Observation Network to Monitor the Situation of Groundwater, Fiscal Year 2015; Department of Groundwater Resources: Bangkok, Thailand, 2015. [Google Scholar]
  36. Jarurat, A. Study of Hydrogeology and Aquifer Classification for Potential Analysis and Sustainable Groundwater Development in the Chiang Mai Basin; Academic Report, No. BGCR.3/2008; Bureau of Groundwater Conservation and Restoration, Department of Groundwater Resources: Bangkok, Thailand, 2008. [Google Scholar]
  37. Taweelarp, S.; Khebchareon, M.; Saenton, S. Evaluation of Groundwater Potential and Safe Yield of Heterogeneous Uncon-solidated Aquifers in Chiang Mai Basin, Northern Thailand. Water 2021, 13, 558. [Google Scholar] [CrossRef]
  38. Wattananikorn, K.; Beshir, J.A.; Nochaiwong, A. Gravity interpretation of Chiang Mai Basin, Northern Thailand: Concentrating on Ban Thung Sieo area. J. Southeast Asian Earth Sci. 1995, 12, 53–64. [Google Scholar] [CrossRef]
  39. Asnachinda, P. Hydrogeochemistry of the Chiang Mai Basin, Northern Thailand. J. Asian Earth Sci. 1997, 15, 317–326. [Google Scholar] [CrossRef]
  40. Ridd, M.R.; Barber, A.J.; Crow, M.J. The Geology of Thailand; Geological Society: London, UK, 2011. [Google Scholar]
  41. Department of Groundwater Resources (DGR). Groundwater Potential Map of Chiang Mai Province, Scale 1:100,000; Ministry of Natural Resources and Environment: Bangkok, Thailand, 2017. [Google Scholar]
  42. Department of Groundwater Resources (DGR). Groundwater Resources Assessment of the Chiang Mai, Upper Chao Phraya, and Mae Klong Basins; Final Report; Ministry of Natural Resources and Environment: Bangkok, Thailand, 2005. [Google Scholar]
  43. Margane, A.; Tatong, T. Aspects of the hydrogeology of the Chiang Mai-Lamphun Basin, Thailand that are Important for the Groundwater Management. Z. Angew. Geol. 1999, 45, 188–197. [Google Scholar]
  44. Kiwduangta, B. Hydrostratigraphic Model of the Shallow Aquifer in the Vicinity of the Northern Region Industrial Estate Area, Lamphun Province. Master’s Thesis, Chiang Mai University, Chiang Mai, Thailand, 2012. [Google Scholar]
  45. Losiri, C. Land use change model and urban area prediction in the future. J. Soc. Sci. Srinakharinwirot Univ. 2016, 19, 340–357. [Google Scholar]
  46. Thai Meteorological Department (TMD). Daily Temperature Data from the 30-Years Period (1991–2020) in Chiang Mai Province, Mae Hong Son Province, Lamphun Province, Lam Pang Province, and Chiang Rai Province; Thai Meteorological Department: Bangkok, Thailand, 2021. [Google Scholar]
  47. Thai Meteorological Department (TMD). Daily Rainfall Data from the 30-Years Period (1991–2020) in Chiang Mai Province, and Its Influenced Areas; Thai Meteorological Department: Bangkok, Thailand, 2021. [Google Scholar]
  48. Royal Irrigation Department (RID). Daily Rainfall Data from the 30-Years Period (1991–2020) in Chiang Mai Province, and Its Influenced Areas; Royal Irrigation Department: Bangkok, Thailand, 2021. [Google Scholar]
  49. Land Development Department (LDD). Land Use Map (Level 1) in Chiang Mai Province (GIS), Scale of 1:25,000; Land Development Department: Bangkok, Thailand, 2020. [Google Scholar]
  50. Land Development Department (LDD). Report on soil survey for agriculture in Chiang Mai Province, Scale of 1:25,000; Academic Report No. 27/06/50; Land Development Department: Bangkok, Thailand, 2007. [Google Scholar]
  51. Department of Groundwater Resources (DGR). Final Report: The Study of Background Values of Heavy Metals in Groundwater, Chiang Mai and Lamphun Provinces; Ministry of Natural Resources and Environment: Bangkok, Thailand, 2019. [Google Scholar]
  52. Javadi, S.; Kardan Moghaddam, H.; Neshat, A. A new approach for vulnerability assessment of coastal aquifers using combined index. Geocarto Int. 2020, 37, 1681–1703. [Google Scholar] [CrossRef]
  53. Moghaddama, K.H.; Mohsen Pourreza-Bilondib, M.; Masoud Bahreini Motlagh, B.M. Evaluation of Hierarchical Analysis Method in Calibration of DRASTIC-LU Vulnerability Index (Study Area: Birjand Aquifer). Water Harvest. Res. 2021, 4, 121–132. [Google Scholar]
  54. Osborn, N.I.; Eckenstein, E.; Koon, K.Q. Vulnerability Assessment of Twelve Major Aquifers in Oklahoma; Technical Report 98-5; Oklahoma Water Resources Board: Oklahoma City, OK, USA, 1998; 29p. [Google Scholar]
  55. Department of Groundwater Resources (DGR). The Groundwater Quality Standard for Drinking Purpose According to the Notification of the Ministry of Natural Resources and Environment (2008); Ministry of Natural Resources and Environment: Bangkok, Thailand, 2008. [Google Scholar]
  56. Barber, N.L. Summary of Estimated Water Use in the United States in 2005; USGS Publications Warehouse: Reston, VA, USA, 2010. [Google Scholar] [CrossRef]
  57. Dubrovsky, N.M.; Burow, K.R.; Clark, G.M.; Gronberg, J.M.; Hamilton, P.A.; Hitt, K.J.; Mueller, D.K.; Munn, M.D.; Nolan, B.T.; Puckett, L.J.; et al. The Quality of our Nation’s Waters-Nutrients in the Nation’s Streams and Groundwater, 1992–2004. In U.S. Geological Survey Circular 1350; United States Geological Survey: Reston, VA, USA, 2010; p. 174. Available online: http://water.usgs.gov/nawqa/nutrients/pubs/circ1350 (accessed on 12 November 2023).
  58. Madison, R.J.; Brunett, J.O. Overview of the occurrence of nitrate in groundwater of the U.S. National Water Summary 1984-Water Quality Issues. U.S. Geol. Surv. Water-Supply Pap. 1985, 2275, 93–105. [Google Scholar]
  59. Condon, L.E.; Kollet, S.; Bierkens, M.F.P.; Fogg, G.E.; Maxwell, R.M.; Hill, M.C.; Fransen, H.-J.H.; Verhoef, A.; Van Loon, A.F.; Sulis, M.; et al. Global Groundwater Modeling and Monitoring: Opportunities and Challenges. Water Resour. Res. 2021, 57, e2020WR029500. [Google Scholar] [CrossRef]
Figure 1. Location of research area, Chiang Mai Province, with a total area of 20,107.06 sq.km. or 12,566,912.50 rais.
Water 16 00547 g001
Figure 2. Hydrogeological characteristics of Chiang Mai Province.
Water 16 00547 g002
Figure 3. Hydrogeologic cross-sections in lines A0–A1, B0–B1, C0–C1, and D0–D1 (see detail of Hydrogeologic Unit in Figure 2). (A) Hydrogeologic cross-sections in lines A0–A1; (B) Hydrogeologic cross-sections in lines B0–B1; (C) Hydrogeologic cross-sections in lines C0–C1; (D) Hydrogeologic cross-sections in lines D0–D1.
Water 16 00547 g003aWater 16 00547 g003b
Figure 4. Groundwater potential map of Chiang Mai Province, Thailand.
Water 16 00547 g004
Figure 5. Conceptual framework of risk assessment of groundwater resource vulnerability in Chiang Mai Province, Thailand.
Water 16 00547 g005
Figure 6. Monthly temperature data from the 30-year period (1991–2020) in Chiang Mai Province.
Water 16 00547 g006
Figure 7. Future temperature situations by the MIROC-ESM-CHEM model under the RCP8.5 scenario.
Water 16 00547 g007
Figure 8. Average, minimum, and maximum monthly rainfall data (mm.), from the 30-year period (1991–2020) in Chiang Mai Province.
Water 16 00547 g008
Figure 9. Future rainfall situations using the MIROC-ESM-CHEM model under the RCP8.5 scenario.
Water 16 00547 g009
Figure 10. Land-use patterns of Chiang Mai Province level 1 (2001, 2011, and 2020).
Water 16 00547 g010
Figure 11. Land-use patterns of baseline (2020) and future 50-year periods (2021–2070), using the CA_Markov Chain model and GIS-based techniques.
Water 16 00547 g011
Figure 12. Depth-to-water table (D) of baseline (2020) and future (2030–2070) periods, using the MIROC-ESM-CHEM model with the RCP8.5 scenario.
Water 16 00547 g012
Figure 13. Net recharge (R) of baseline (2020) and future (2030–2070) periods, using the MIROC-ESM-CHEM model with the RCP8.5 scenario.
Water 16 00547 g013
Figure 14. Point pollutions source (P) of baseline (2020) and future (2030–2070) periods.
Water 16 00547 g014
Figure 15. Distribution of groundwater nitrate (NO3) concentrations in the rainy season (September 2018 to November 2018) and the winter season (December 2018 to February 2019).
Water 16 00547 g015
Figure 16. Nitrate (NO3) calibration on baseline groundwater resource vulnerability (2020).
Water 16 00547 g016
Figure 17. Groundwater resources vulnerability of the baseline period (2020) and for the future period (2021–2070), using the MIROC-ESM-CHEM model with the RCP8.5 scenario.
Water 16 00547 g017
Table 1. Comparisons of the methodology of assessing the groundwater resources vulnerability of this research with the literature reviews.
Literature Review (References)Methodology of Assessing the Groundwater Resources VulnerabilityToolsStudy AreaLimitation
Original DRASTICModified DRASTIC
Aller et al. (1987) [11]7 indexes Overlay techniqueUSA.These assessments focus on simulating the susceptibility of groundwater aquifers to contamination from both natural conditions and anthropogenic activities. Notably, these studies primarily concentrate on current scenarios, neglecting any consideration of future scenarios.
Rahman (2008) [18]7 indexes ILWIS 3.0 model and GIS-based techniques using ArcView 3.2a GIS softwareAligarh, India
Shirazi et al. (2013) [19]7 indexes GIS-based techniques and remote sensingMelaka State, Malaysia
Zghibi et al. (2016) [20]7 indexes GIS-based techniquesTunisian Coastal Aquifer
Abdeslama et al. (2017) [21]7 indexes GIS-based techniques using ArcGISNortheast of Algeria
Rajput et al. (2020) [22]7 indexes GIS-based techniquesRajasthan, India
Mohammed et al. (2020) [23]7 indexes GIS-based techniquesBasara Basin, the Iraqi Kurdistan Region
Nurroh et al. (2020) [24]7 indexes GIS-based techniquesYogyakarta, Indonesia
Bera et al. (2022) [25]7 indexes AHP techniques and GIS-based techniquesSemi-arid Totko River Basin, India
Chilaule et al. (2023) [26]7 indexes GIS-based techniquesComarca de la Janda, Province of Cádiz, SpainThese assessments focus on simulating the susceptibility of groundwater aquifers to contamination from both natural conditions and anthropogenic activities. Notably, these studies primarily concentrate on current scenarios, neglecting any consideration of future scenarios.
Zhang et al. (2023) [27]7 indexes GIS-based techniquesTangshan City, a Coastal Area in China
Wei and Chi (2023) [28]7 indexes AHP techniques and GIS-based techniquesRemediation of Contaminated Sites in China (PRC)
Sadat-Noori and Ebrahimi (2016) [14]7 indexes7 indexes; using to calibrate and modify the original algorithmGIS-based techniques and simple statistical techniquesSaveh-Nobaran Plain, the Central IranThese assessments of the vulnerability of groundwater resources focus mainly on land-use pattern and/or anthropogenic activities (population density, etc.) indices, without considering future scenarios.
Jenifer and Jha (2018) [16]7 indexes9 indexes; adding two exogenous factors, namely: lineament density (LD), land-use and land cover (LU)GIS-based techniquesTiruchirappalli District, Tamil Nadu, India
Maqsoom et al. (2020) [17]7 indexes8 indexes; adding anthropogenic activity index (A)GIS-based techniques using ArcGIS 10.3 softwareKarakoram Highway (a Part of the CPEC Route (China-Pakistan Economic Corridor)
Zhang et al. (2022) [29]7 indexes11 indexes; adding four exogenous factors, namely: land-use type (L), aquifer thickness (T’), aquifer water potential (P’), and pollution source distance (D’)AHP techniques and GIS-based techniques using ArcGIS environmentNorthern part of Shifang City, Sichuan Province, China (PRC)The traditional DRASTIC model considers the influence of anthropogenic activities based to the current situation. In addition to the seven commonly used factors reflecting natural conditions, four additional evaluation factors—land-use type, aquifer thickness, aquifer water potential, pollution source distance—were considered. A new model, including the DRASTIC-LTPD and AHP-DRASTIC-LTPD models, was proposed, without considering future scenarios.
Lima et al. (2011) [12] 8 indexes (DRASTIC-P); adding land-use index (P) and/or the future agricultural expansion scenarios by Dyna-CLUE modelGIS-based techniquesDulce Creek Basin, the Southeast of the Bunos Aires City, ArgentinaThis assessment’s primary focus on land-use pattern indices under the current and future scenarios, without considering future climate changes.
Li and Merchant (2013) [13] 7 indexes (DRASTIL) except C; adding land-use index (L)LTM Model (Land Transformation Model), environmental conditions and GIS-based techniquesGreat Plains State, North Dakota, USA.The assessment of the vulnerability of groundwater resources noted that the groundwater vulnerability maps developed for this research indicate only the “risk” of groundwater pollution on a regional scale, but may not be used to interpret actual local groundwater contamination incidences, due to the site-specific factors, such as hydraulic fracturing for shale oil, which may cause drinking water contamination, not being considered.
Huang et al. (2017) [15] 8 indexes; adding land-use pattern index (L)LTM Model (Land Transformation Model) and GIS-based techniquesHunan, China (PRC)The assessment of groundwater vulnerability confirmed the depth-to-water table (DTW), and that the land-use patterns contribute differently to variations in groundwater vulnerability. Additionally, this study emphasizes the importance of generating an impact model of climate changes and anthropogenic activities on future ground-water resource vulnerability; this would directly link future DTW variations to climate change and associate land-use patterns with anthropogenic activities.
Mkumbo et al. (2022) [30] 8 indexes; adding land-use and land cover (LU/LC)AHP techniques and GIS-based techniques using ArcGIS environmentMorogoro Municipality, TanzaniaThis assessment of groundwater resource vulnera-bility focuses mainly on land use and landcover indexes, without considering future scenarios.
This Paper 9 indexes; adding 2 anthropogenic activities, namely: land-use pattern (L) and point source pollution (P)CA_Markov Chain Model (Cellular Automata and Markov Chain Model); and MIROC-ESM-CHEM Model under RCP8.5 Scenario; and GIS-based techniques using ArcGIS 10.5 softwareChiang Mai Province, ThailandA comprehensive review of the literature reveals that past reviews had a narrow focus, and lacked a real coverage of studies, as well as not utilizing state-of-the-art methods to deal with groundwater resource vulnerability. Consequently, this paper focuses on in-depth reviews, considering the best methods and approaches under climate change and land-use pattern changes, while using modern models for analyzing current (2020) scenarios and forecasting future (2070) scenarios.
Table 2. Analysis of future temperature situations with the MIROC-ESM-CHEM model under the RCP8.5 scenario.
MonthAverage Monthly Temperature (Celsius)
Obs.MIROC-ESM-CHEM under RCP8.5 Scenario; Year
1991–20202021–20302031–20402041–20502051–20602061–2070
January21.6221.8022.6217.5524.0921.37
February22.8622.7724.1521.8425.8724.87
March26.3826.5424.3527.8527.4829.48
April28.6929.1629.3829.2931.4432.53
May28.3831.2628.6133.0332.2029.84
June27.8531.6826.1429.8432.1629.70
July27.3328.5427.0227.8128.8629.16
August26.8327.0227.0328.7328.4229.94
September25.6326.5727.9128.9528.5529.82
October25.9725.3426.5427.4528.5029.15
November24.2322.5025.0424.9726.6327.20
December21.7119.5520.7522.6622.3925.05
Average25.6226.0625.8026.6628.0528.18
Diff. (Obs.-Model), °C 0.440.171.042.432.55
Percentage, % 1.710.674.069.479.96
Table 3. Analysis of future rainfall situations using the MIROC-ESM-CHEM model under the RCP8.5 Scenario.
MonthAverage Monthly Rainfall (mm.)
Obs.MIROC-ESM-CHEM under RCP8.5 Scenario; Year
1991–20202021–20302031–20402041–20502051–20602061–2070
January8.520.510.7411.110.970.28
February5.781.451.210.631.990.39
March18.975.8880.620.859.696.60
April53.9656.8437.6493.13114.9756.28
May160.4387.46202.9054.8082.21153.49
June126.3663.21209.01149.0066.25163.25
July160.07233.26162.12204.95274.34205.42
August205.82290.25321.52241.88280.01275.15
September183.10270.59225.09257.89161.14306.66
October103.42209.13135.72320.45238.75133.45
November34.9818.3235.3732.953.8534.92
December10.054.454.649.6115.983.27
Average Annual Rainfall1071.431241.361416.581377.251250.121339.16
Diff. (Model-Obs.), mm. 169.93345.15305.82178.69267.73
Percentage, % 15.8632.2128.5416.6824.99
Table 4. An analysis of the land-use patterns over a future 50-year period (2021–2070) using the CA_Markov Chain model and GIS-based techniques, covering the area of Chiang Mai Province, totaling 20,107.06 sq.km. or 12,566,912.50 rais.
Land-Use Pattern CategoriesLand-Use Pattern 1/,2/
202020302040
(sq.km.)%(sq.km.)%(sq.km.)%
1.
Agricultural Areas
4718.0623.464906.6124.405066.6825.20
2.
Community and Building Areas
792.203.94854.064.25901.164.48
3.
Industrial Areas
25.050.1225.760.1329.870.15
4.
Forest Areas
14,059.7269.9213,847.7868.8713,641.0667.84
5.
Water Body
193.680.96170.450.85158.480.79
6.
Miscellaneous Areas
318.351.58302.391.50309.811.54
Total Areas20,107.06100.0020,107.06100.0020,107.06100.00
Land-Use Pattern CategoriesLand-Use Pattern 1/,2/
205020602070
(sq.km.)%(sq.km.)%(sq.km.)%
1.
Agricultural Areas
5190.3325.815304.4526.385401.7726.87
2.
Community and Building Areas
984.164.891047.045.211104.865.49
3.
Industrial Areas
41.240.2144.560.2246.610.23
4.
Forest Areas
13,430.2566.7913,239.6965.8513,080.0765.05
5.
Water Body
148.270.74155.910.78152.660.76
6.
Miscellaneous Areas
312.811.56315.421.57321.091.60
Total Areas20,107.06100.0020,107.06100.0020,107.06100.00
Land-Use Pattern CategoriesLand-Use Pattern Change 1/,2/Ratio of Annual Change
2020–20302020–20702020–2070
(sq.km.)%(sq.km.)%(sq.km.)%
1.
Agricultural Areas
61.860.21683.713.4013.670.29
2.
Community and Building Areas
0.720.03312.651.556.250.79
3.
Industrial Areas
188.550.2521.570.110.431.72
4.
Forest Areas
−211.940.17−979.65−4.87−19.59−0.14
5.
Water Body
−23.23−0.37−41.02−0.20−0.82−0.42
6.
Miscellaneous Areas
−5.96−0.132.740.010.050.02
Notes: 1/ An analysis of the land-use patterns in a future 50-year period (2021–2070), using the CA_Markov Chain Model and a GIS-based technique; 2/ Area size is calculated by ArcGIS 10.5.
Table 5. Weights of each determining factor or weighting values for the new DRASTIC-LP model.
Main FactorWeighting ValuesIndex Score IntervalScore
  • Depth-to-water table (D) 1/
5 1/<1.50 m.10
1.50–4.50 m.9
4.51–9.00 m.7
9.01–15.00 m.5
15.01–22.50 m.4
22.51–30.00 m.3
30.01–50.00 m2
>50.00 m.1
2.
Net Recharge (R) 1/
4 1/<30.00 mm/year1
30.01–50.00 mm/year2
50.01–70.00 mm/year4
70.01–90.00 mm/year5
>90.00 mm/year6
3.
Aquifer Media (A) 1/
3 1/Fluvial Deposits Aquifer, Qfd9
Young Terrace Deposits Aquifer, Qyt9
Old Terrace Deposits Aquifer, Qot9
Semi-consolidated aquifer, Tsc6
Middle Korat Aquifers, Jmk6
Lower Korat Aquifer, TRJlk6
Lampang Aquifer, TRlp6
Permian Carbonate Rocks Aquifer, Pc7
Permian-Carboniferous Metasediments Aquifers, PCms6
Carboniferous Metasediments Aquifer, Cms6
Silurian-Devonian Metamorphic, SDmm3
Ordovician Limestone Aquifer, Ols8
Cambrian-Devonian Metamorphic Aquifer, DEmm3
Cambrian Metamorphic Aquifer, Emm3
Precambrian Metamorphic Aquifer, PEmm2
Granitic Aquifer, Gr4
Volcanic Aquifer, Vc3
4.
Soil Media (S) 1/
2 1/Clay consists of 40% or more of clay size particles, 45% or less of sand size particles, and less than 40% of silt size particles.3
Silt or silt loam4
Loam consists of 7–27% clay size particles, 28–50% silt size particles and less than 52% sand size particles5
Sand consists of 85% or more of sand size particles6
Terrace (slope complex)6
5.
Topography (Slope) (T) 1/
1 1/<2.00%10
2.01–6.00%9
6.01–12.00%5
12.01–18.00%3
>18.00%1
6.
Impact of Vadose Zone (I) 1/
5 1/Alluvial deposits unit consists of sand, gravel, silt, clay, laterite. They are fluvial deposits (Qfd); young terrace deposits (Qyt); old terrace deposits (Qot)9
Limestone unit consists of limestone and dolomitic limestone. They are Ordovician limestone (Ols) and Permian limestone (Pc)8
Sedimentary rock and metasediment units consist of sandstone, shale, conglomerate, mudstone, etc. They are semi-consolidated rock (Tsc), Korat rock (Jmk/TRJlk), Lampang rock (TRlp), Permian Carbonate rocks, Carboniferous metasediments rock (Cms)6
Metamorphic and igneous units are Silurian-Devonian rock (SDmm), Cambrian-Devonian rock (DEmm), Metamorphic rock (Emm), Precambrian metamorphic rock (PEmm), Granitic rock (Gr), Volcanic rock (Vc)4
7.
Hydraulic Conductivity of the Aquifer (C) 1/
3 1/<0.050 m/day1
0.051–0.100 m/day2
0.101–0.500 m/day3
0.501–1.000 m/day4
1.001–10.000 m/day7
>10.000 m/day8
8.
Land-use Pattern (L)
5Agricultural area8
Industrial area8
Water body8
Community and buildings area5
Miscellaneous area3
Forest area1
9.
Point Source (P)
5Landfill10
Sanitary landfill8
Factory8
Active mining related to heavy metal elements9
Active mining (industrial quarry)7
Non-active mining (old mine)6
Petrol/Gas station8
Wastewater treatment plant5
Notes: Ref: 1/ Aller et al. [11]
Table 6. Analysis of groundwater vulnerability by the New DRASTIC-LP model, comparing the rainfall behavior and land-use pattern situations of the baseline (2020) and future 10-year periods (2030, 2040, 2050, 2060, and 2070).
Contaminate ClassIndex ValuesNew DRASTIC-LPMIROC-ESM-CHEM Model 1/
Present (2020)RCP8.5 Scenario (2030)RCP8.5 Scenario (2040)
AreaAreaChangeAreaChange
(km2)%(km2)%%(km2)%%
Very Low<120.0014,789.4373.5515,166.7775.43+1.8815,679.5577.98+4.43
Low120.00–140.002066.2310.281708.128.50−1.781260.916.27−4.01
Moderate140.01–160.001090.135.421025.935.10−0.32863.564.29−1.13
High160.01–180.001718.648.551818.329.04+0.502031.1510.10+1.55
Very High>180.00442.632.20387.911.93−0.27271.891.35−0.85
Contaminate ClassIndex ValuesNew DRASTIC-LPMIROC-ESM-CHEM Model 1/
Present (2020)RCP8.5 Scenario (2050)RCP8.5 Scenario (2060)
AreaAreaChangeAreaChange
(km2)%(km2)%%(km2)%%
Very Low<120.0014,789.4373.5515,306.3176.12+2.5715,300.1176.09+2.54
Low120.00–140.002066.2310.281597.817.95−2.331545.017.68−2.59
Moderate140.01–160.001090.135.421025.265.10−0.321089.435.42−0.00
High160.01–180.001718.648.551831.989.11+0.561833.129.12+0.57
Very High>180.00442.632.20345.691.72−0.48339.391.69−0.51
Contaminate ClassIndex ValuesNew DRASTIC-LPMIROC-ESM-CHEM Model 1/
Present (2020)RCP8.5 Scenario (2070)
AreaAreaChange
(km2)%(km2)%%
Very Low<120.0014,789.4373.5514,900.3974.11+0.55
Low120.00–140.002066.2310.281890.649.40−0.87
Moderate140.01–160.001090.135.421136.325.65+0.23
High160.01–180.001718.648.551810.669.01+0.46
Very High>180.00442.632.20369.051.84−0.37
Note: 1/ MIROC-ESM-CHEM Model can simulate rainfall behavior across the 50-year period (2021–2070).
Table 7. Summary of methodological comparisons between this paper and other DRASTIC techniques: (a) the Original DRASTIC model (Aller et al. [11]); and (b) the Modified DRASTIC model.
Methodology of Assessing the Groundwater Resources VulnerabilityModified DRASTIC ModelOriginal DRASTIC Model
This Paper[12][13][14] 1/+2/[15][16] 2/[17] 2/[29] 1/+2/[30][11][18][19][20][21][22][23][24][25][26][27][28]
1.
Terms in Equation (Indexes)
9877898118777777777777
2.
Components of Equation
2.1.
D (Depth to Water)
2.2.
R (Net Recharge)
2.3.
A (Aquifer Media)
2.4.
S (Soil Media)
2.5.
T (Topography)
2.6.
I (Impact of Vadose Zone)
2.7.
C (Hydraulic Conductivity)
x
2.8.
L/P/LU/LC (Land-Use Pattern)
xxxxxxxxxxxxxx
2.9.
P (Point Source Pollution) 3/
xxxxxxxxxxxxxxxxxxxx
2.10.
A’/LD (Anthropogenic Activities) 3/
xxxxxxxxxxxxxxxxx
2.11.
T’ (Aquifer Thckness)
xxxxxxxxxxxxxxxxxxxx
2.12.
P’ (Aquifer Water Potential)
xxxxxxxxxxxxxxxxxxxx
2.13.
D’ (Pollution Sources Distance)
xxxxxxxxxxxxxxxxxxxx
3.
Climate Change Analysis
3.1.
MIROC-ESM-CHEM Model under RCP8.5 Scenario
xxxxxxxxxxxxxxxxxxxx
3.2.
GCMs Model under the B1, A1B, A2 Scenarios/RCP2.6, 4.5, 6.0, 8.5
xxxxxxxxxxxxxxxxxx
4.
Land-Use Patterns Change Analysis using CA_Markov Chain Model; LTMModel; or Dyna-CLUE Model
xxxxxxxxxxxxxxxxx
5.
Groundwater Risk Mapping
5.1.
GIS-based Techniques
x
5.2.
Overlay Techniques
xxxxxxxxxxxxxxxxxxx
6.
Predicting Future Groundwater Resources Vulnerability
xxxxxxxxxxxxxxxxx
Notes: 1/ = The modified DRASTIC model is used to calibrate and modify the original algorithm in order to obtain accurate results. 2/ = The original DRASTIC model is used to compare with the modified DRASTIC. 3/ = Point source pollutions are part of anthropogenic activities that affect the groundwater resources vulnerability. ✓ = yes; x = no.
Disclaimer/Publisher’s Note: The statements, opinions and data contained in all publications are solely those of the individual author(s) and contributor(s) and not of MDPI and/or the editor(s). MDPI and/or the editor(s) disclaim responsibility for any injury to people or property resulting from any ideas, methods, instructions or products referred to in the content.

