Article

Zeta Diversity Reveals the Small Wetland Complex Promotes Biodiversity

1
School of Life Science and Institute of Wetland Ecology, Nanjing University, Nanjing 210023, China
2
Ecology Research Institute of Changshu, Nanjing University, Changshu 210051, China
3
Ministry of Education’s Key Laboratory of Poyang Lake Wetland and Watershed Research, School of Geography and Environment, Jiangxi Normal University, Ziyang Road 99, Nanchang 330022, China
4
Taihu Lake National Wetland Park, Suzhou 215161, China
*
Authors to whom correspondence should be addressed.
Water 2024, 16(3), 476; https://doi.org/10.3390/w16030476
Submission received: 18 December 2023 / Revised: 19 January 2024 / Accepted: 29 January 2024 / Published: 31 January 2024
(This article belongs to the Topic Aquatic Environment Research for Sustainable Development)

Abstract

:
Small wetlands provide crucial ecosystem services but are facing widespread loss and degradation. At present, small wetland complexes provide an alternative avenue for conservation; we used a dataset to illustrate how zeta diversity can be assessed in a small wetland complex. The small wetland complex studied consisted of nine hydrologically connected ponds, and all the ponds were connected by narrow ditches. Data collected included the composition of both zooplankton and phytoplankton communities, water physicochemical parameters, and hydrological connectivity. Two ways in which connectivity affects biodiversity, dispersal filtration (path distance-controlled biological diffusion) and environmental filtration (environment-selected species), were quantified. As a result, (1) 46 zooplankton and 119 phytoplankton species were identified, with species richness distribution significantly affected by water properties (explained variances of 68% and 39%, respectively), reflecting significant environmental filtration, and (2) both zooplankton and phytoplankton showed zeta diversity distance decay (p < 0.001), reflecting significant dispersal filtration, and (3) relatively rare species dominated community turnover, in which environmental filtration was far stronger than dispersal filtration. Overall, the small wetland complex in this study was characterized by hydrological connectivity, which not only allowed moderate biological connectivity but also promoted the coexistence of diverse habitats and communities. We emphasize the applicability of zeta diversity for assessing small wetland complexes, further demonstrating the value of small wetland complexes in promoting biodiversity such as species richness and species turnover.

1. Introduction

Small wetlands, including ponds, pools, lochans, small lakes, and short rivers, have many functions, such as providing biological shelter [1], flood storage, water purification, climate regulation, and cultural value [2]. However, small wetlands are generally threatened by degradation or disappearance, mainly due to anthropogenic influences or development projects [3]. For instance, more than 2700 ponds in Xixi National Wetland Park in China are mostly isolated, have serious organic pollution, or are at risk of cyanobacterial blooms [4]. Similarly, ponds in England and Wales have been extensively degraded, and approximately 80% of them are of poor or very poor quality [5]. As small wetlands and their benefits are being lost, the conservation and management of small wetlands [6] resolution called on the contracting parties to identify and designate small wetlands and small wetland complexes for inclusion in the List of Wetlands of International Importance. The new concept of small wetland complexes is composed of numerous multifunctional small wetlands connected by water systems; moreover, they are spatially close and are located in the same ecological environment [7].
Connectivity is typically considered an ecological corridor and stepping stone in landscape ecology [8], and it can connect communities and alter the distribution of biodiversity [9]. Specifically, connectivity can indirectly affect plankton distribution through changes in environmental conditions [10], which can be interpreted as environmental filtering of community assembly in community ecology [11]. Moreover, connectivity directly affects the dispersal process of plankton [12], which can be understood as dispersal filtering of community assembly, i.e., species with strong dispersal ability can appear in more communities [11]. However, recent studies have tended to consider the effects of habitat or dispersal separately, such as the effect of salinity on plankton [13] and the distance dependence of larval dispersal [14]. Although Jeliazkov et al. [15] proposed an original framework to study the effect of the interaction between local pond conditions and pond connectivity, the filtration and diffusion effects are difficult to analyse simultaneously, as they tend to be interrelated under natural conditions.
Zeta diversity was introduced as a concept and metric that enables the calculation of how diversity is constructed across multiple spatial scales within the same conceptual framework [16]. The distinction between zeta diversity and existing measures of compositional change lies in three key aspects. Firstly, the zeta diversity raw values encompass all possible partitions within an assemblage consisting of all sites. Secondly, the information value of zeta diversity is derived from the manner and rate at which zeta values change across pairwise comparisons among n sites, either over time or distance. Lastly, it provides insights into the relative contributions of rare species versus increasingly common ones to turnover [16]. In short, zeta diversity provides a means of detecting the response of species (from rare to common) to environmental and distance changes [17]. In particular, this response can be decomposed into components describing the influences of both environmental and distance variables, similar to the distance decay of similarity [18]. Zeta diversity has been used to examine the contribution of habitat conditions to benthic communities at the watershed scale [19]. However, how to apply the zeta diversity approach in assessing the effects of connectivity on biodiversity has remained largely unexplored.
To analyse the effects of small wetland complexes on plankton community assembly, zeta diversity was applied to describe profiles of community assembly based on a dataset including 119 phytoplankton species and 46 zooplankton species (Figure 1). Two questions were addressed: (1) In a small wetland complex with initially homogenous ponds, can hydrological connectivity promote diverse habitats and communities? (2) How does connectivity affect environmental filtering and diffusion filtration in the plankton community assembly process?
This study evaluated the ecological effects of the small wetland complex from a biodiversity perspective, and thus, the results have application value for the conservation of natural small wetland complexes or wetland projects. This study is the first to emphasize the connectivity of small wetland complexes while also demonstrating the advantages of using zeta diversity to assess small wetland complexes.

2. Materials and Methods
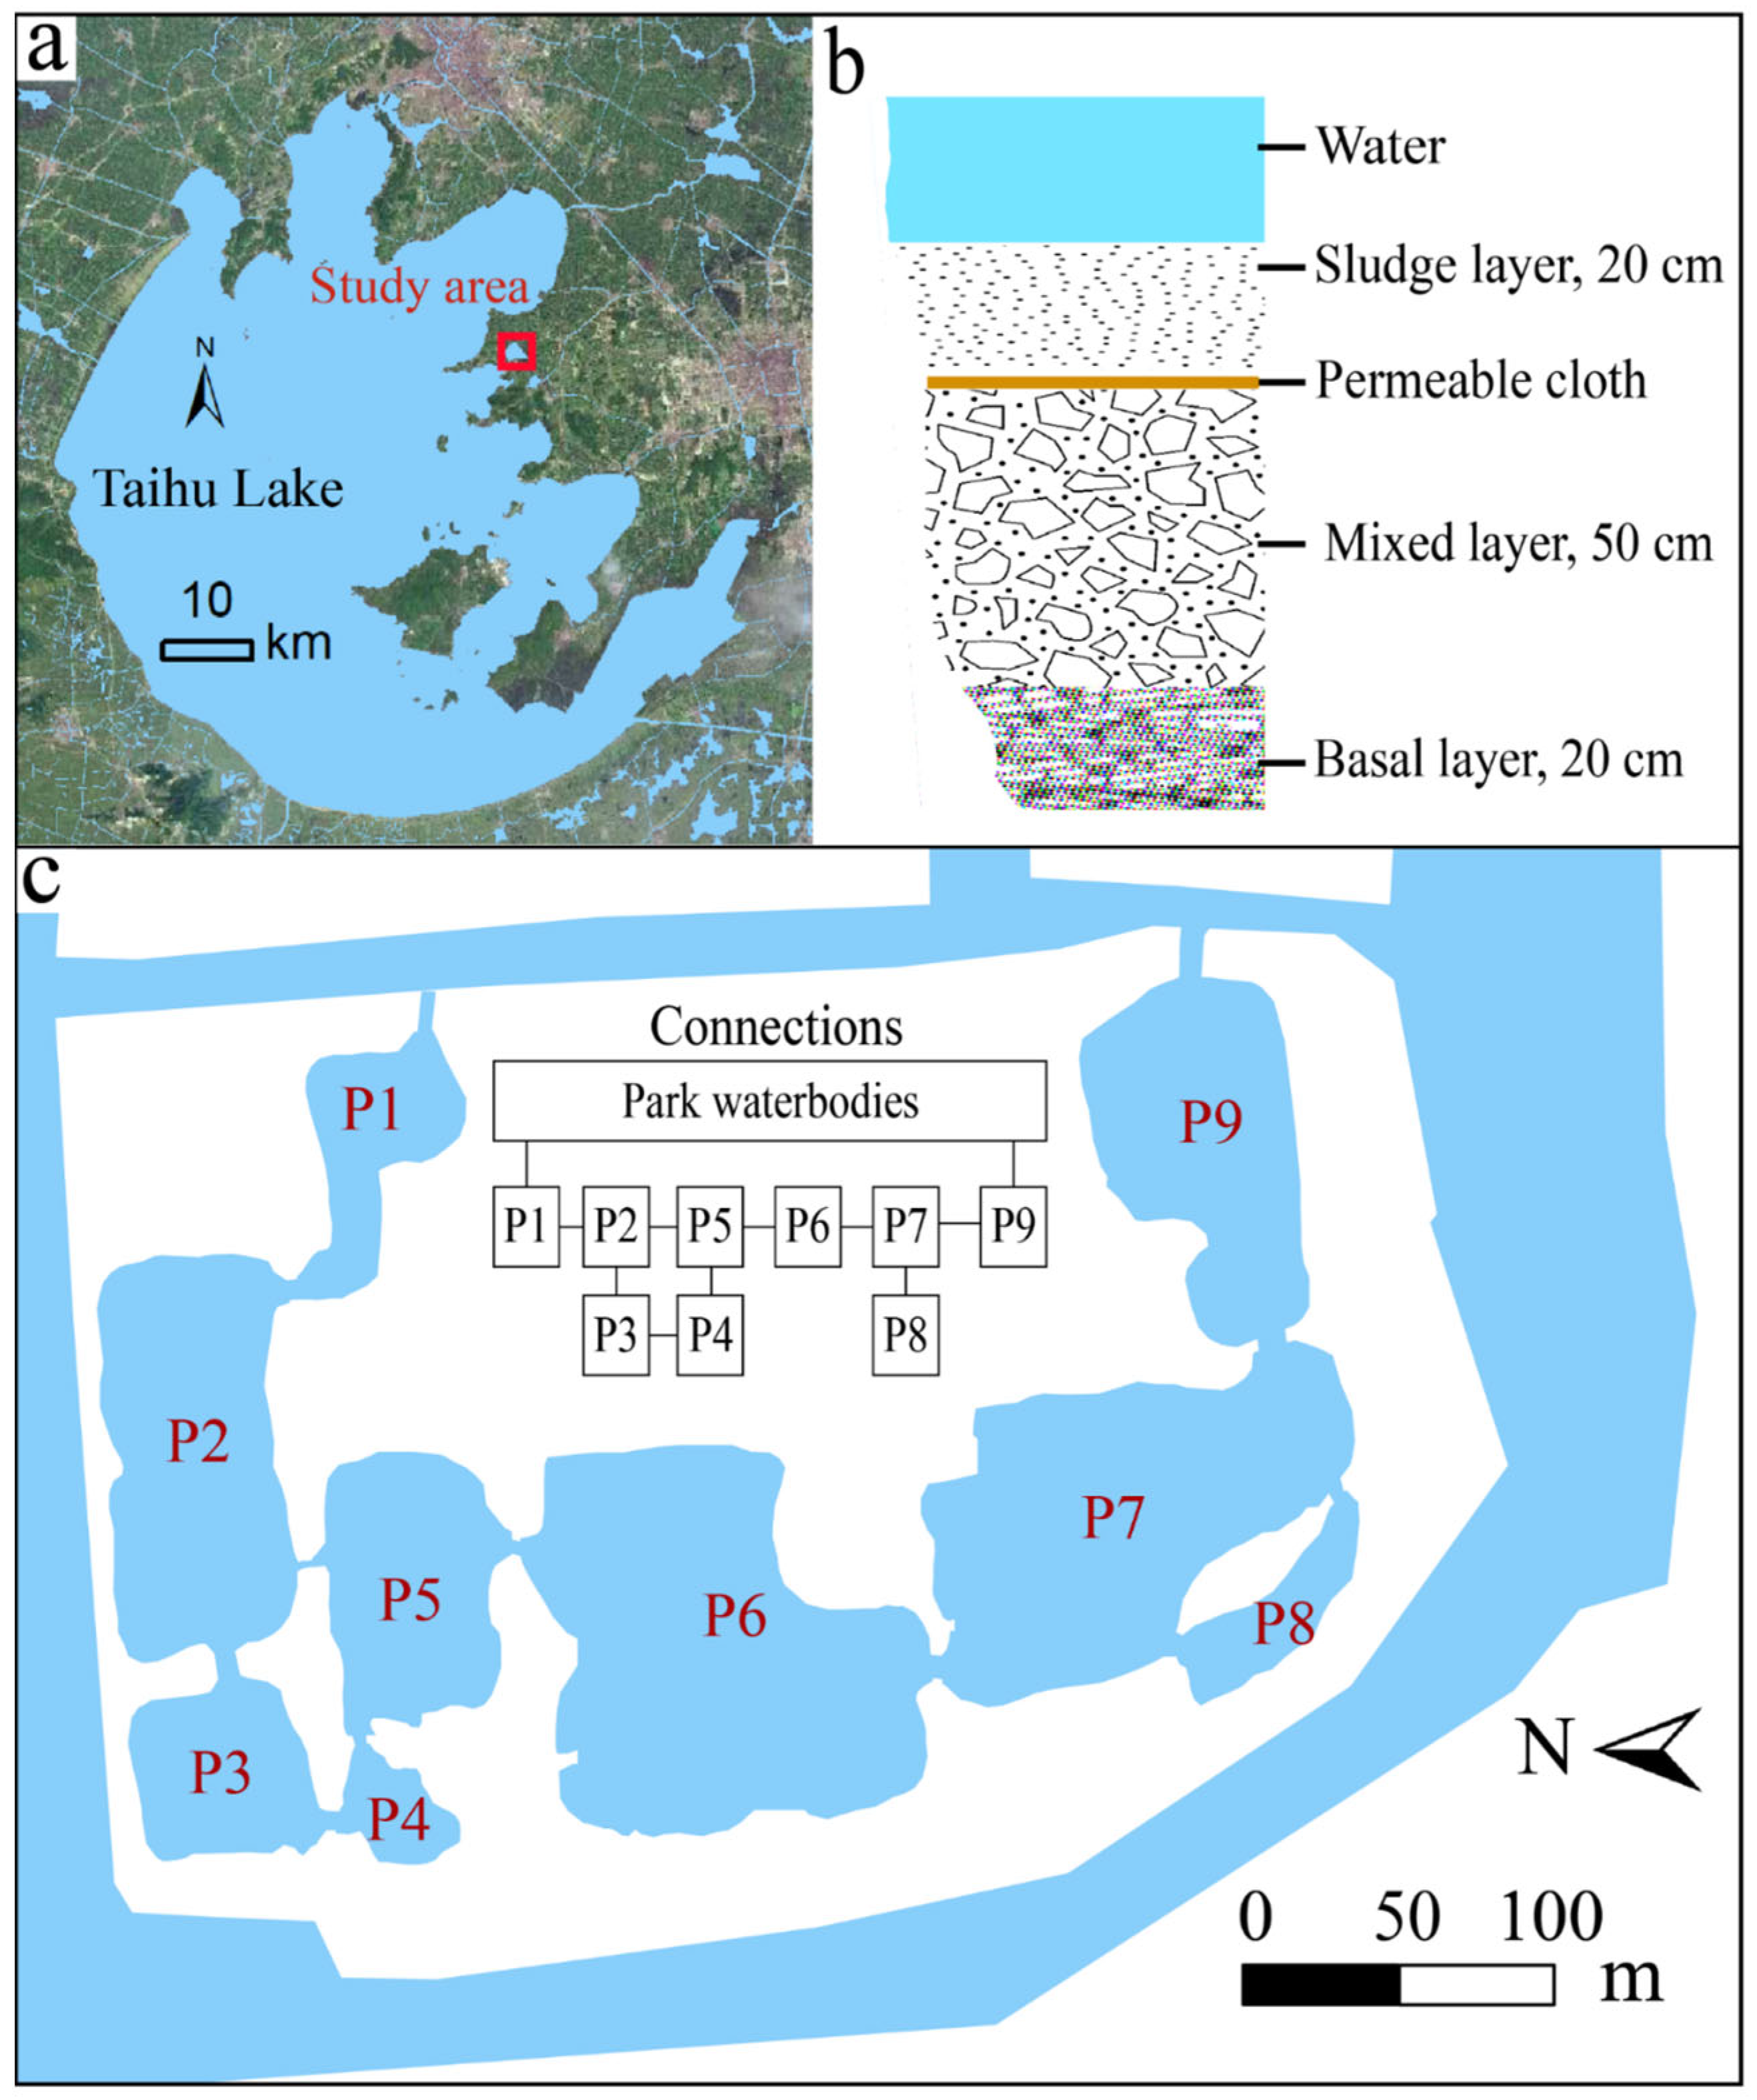
2.1. Study Area

In December 2009, the construction of a small wetland complex in Taihu Lake National Wetland Park (31°19′ N, 120°21′ E), China, was completed. The pond bottoms all had the same substrate layers (Figure 2b). Furthermore, water in each pond within the complex was taken from the same source, ensuring biological homogeneity and comparable water quality. Every connection consisted of a ditch 0.5~1.5 m deep and 2~5 m wide, and the waterbody was stationary except during unusually heavy rains or strong winds. The water level remained stable and waterbodies were completely isolated from Taihu Lake, and water exchange, including the transfer of nutrients and invasive cyanobacteria, did not occur.

2.2. Experimental Design and Sampling

The measured environmental variables fell into three categories: (1) geography, including pond perimeter, depth, area, area-to-perimeter ratio, and volume; (2) connectivity, including pond ditch number, shortest path to an outside body of water, and ditch number to an outside body of water; and (3) waterbody, including transparency, total phosphorus (TP), labile phosphate (labile P), total nitrogen (TN), ammonium nitrogen (ammonium N), temperature, oxidation-reduction potential (ORP), pH, dissolved oxygen (DO), and electrical conductivity (EC).
In August 2020, plankton samples were collected by dragging 25# nets (64 µm pore diameter; dragged 5~10 m horizontally, 2~4 times). Samples were transferred to brown plastic bottles and fixed with Lugol solution. Samples were collected by netting from three corners and the centre of each pond to create a mixed sample, and three independent replicates were obtained for every pond. The nets were washed with clean water between sampling efforts to prevent sample contamination. The inverted microscope method was used for species identification, which was mainly based on The Freshwater Algae of China—Systematics, Taxonomy and Ecology [20] and the Atlas of Freshwater Planktonic Algae in China [21]. The phytoplankton were treated with a 0.1 mL count frame under a 400-fold microscope, the zooplankton were treated with a 1 mL count frame under a 100-fold microscope, and all samples were averaged after 3 repetitions. Data from a Mavic Pro unmanned aerial vehicle (DJI, Shenzhen, China) were used to create a digital elevation model (DEM) (0.1 m resolution), and the geographic variables were calculated using ArcToolbox in ArcGIS 10.8. Flow rate and water depth were measured using an ADCP FlowQuest2000-AFA-BC (LinkQuest, San Diego, CA, USA). Transparency measurements were collected with a Secchi disc. Temperature, pH, ORP, DO, and EC were measured in the field with an AP-800 handheld metre (Aquaread, Broadstein, UK). In the field, 100 mL surface water (depth < 0.5 m) was collected from each pond using sterile bottles (3 replicates), and the TP, TN, labile P, and ammonium N were analysed using a DR2800 instrument (HACH, Loveland, USA) within 3 h of collection.

2.3. Data Analysis

To further consider the possible effects of phytoplankton composition changes on functional composition, the common adaptive features of phytoplankton were regrouped to simplify species complexity. Reynolds functional groups (RFGs) were applied to reclassify phytoplankton [22], and each RFG was classified to the species level. To compare plankton diversity turnover, the species-level data were organized into occupancy matrices based on frequency.
There is currently no targeted way to measure connectivity at the community scale [15]. However, it is advantageous that the connectivity of this small wetland complex is very simple, and only the cascade connectivity and the connectivity distance need to be considered. The cascade connectivity emphasizes a way of connecting one by one and mainly considers the stepping-stone effect [8], e.g., when plankton diffuses from one pond to a distant pond, the individual ponds they pass through become stepping stones. A simplified asymmetric eigenvector map was selected [23] to visually represent the number of stepping stones between any two ponds (Figure 2c). In contrast, the connectivity distance for zeta analysis was obtained by measuring the shortest path distance from the centres of each pair of ponds. To describe the relative isolation of the pond from external influences, the shortest path was drawn from the centre of each pond to the outside waterbody.
To evaluate the effect of connectivity on plankton richness patterns, variance decomposition analysis was used to compare the contributions of the three groups of environmental variables. Based on redundancy analysis (RDA), the response variables were the phytoplankton RFGS richness and taxonomic richness of phytoplankton and zooplankton; the explanatory variables were the environmental variables. Monte Carlo permutation tests followed by backward selection were used to remove the nonsignificant variables from each of the explanatory sets. The adjusted R2 of the RDA was used to screen variables for the variance decomposition analysis [24], and then a one-way analysis of variance (ANOVA) was performed to test the significance [10].
Zeta diversity was investigated because of its ability to capture all the diversity components produced by assemblage partitioning, including alpha diversity, beta diversity, and more [16]. Zeta diversity ( ζ i ) is the number of species shared by i number of sites, with i referred to as the zeta order, and higher zeta orders (i > 2) represent the contribution of increasingly common species (widespread, with large area of occupancy) to compositional change [16]. For a community with a total number of S species discovered in N sites, let species j occur in n j sites and let species j and k co-occur in n j k sites. The probability of species j occurring in i sites is P j i and the expected probability of species j and k co-occurring in i sites is P j k i , with C n i representing the binomial coefficient of n for chosen i; with the covariance C o v P j i ,   P k i . The mean and variance of zeta diversity from the all-sample selection scheme can then be calculated as E ζ i and V a r ζ i [25].
P j i = C n j i C j i
P j k i = C n j k i C j i
C o v P j i ,   P k i = P j k i P j i × P k i
E ζ i = j = 1 S P j i
V a r ζ i = j = 1 S j = 1 S C o v P j i ,   P k i  
Based on the conceptual framework and detailed demonstration provided by McGeoch et al. [25], the following metrics were selected to describe their representation in this study: (1) zeta order describes the number of communities included in the comparison; (2) zeta diversity decline describes the change in the number of shared species with increasing zeta order; (3) zeta ratio describes the probability of retaining a species of the same order of commonness in additional cases; and (4) zeta diversity decay describes the change in the number of species shared with increasing connectivity distance between communities for different zeta orders. Statistical analyses were performed with the package “Zetadiv” [17,25] in R 4.0.3.

3. Results

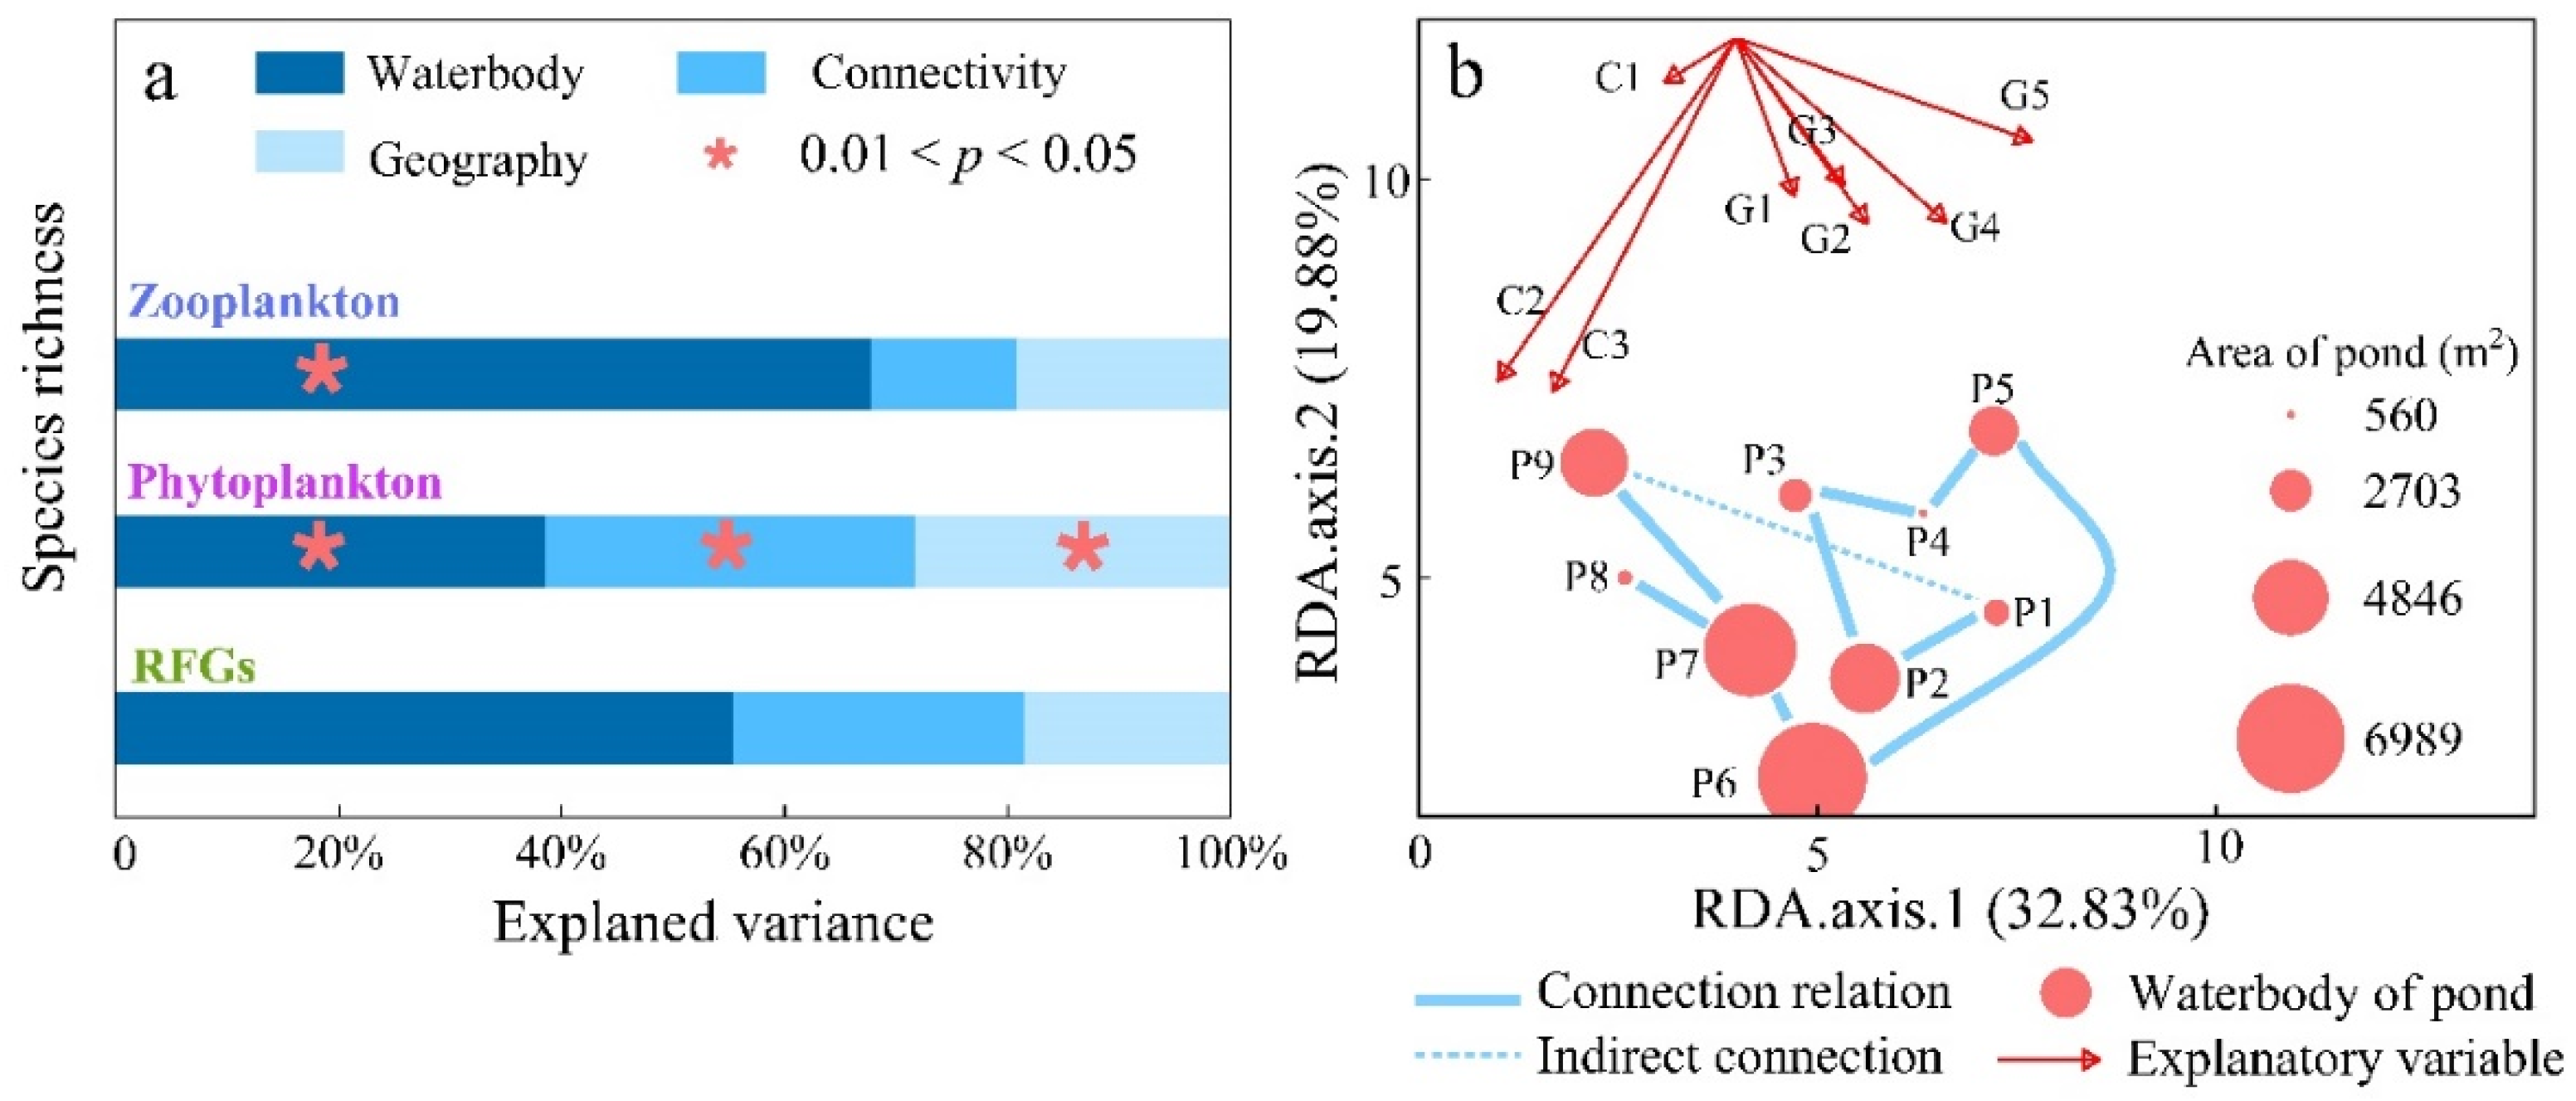
3.1. Connectivity Drives Habitat and Community Richness

To compare the differences among all ponds of the small wetland complex, the main drivers of plankton richness and water properties were analysed in these ponds. The small wetland complex is rich in phytoplankton and zooplankton, which have different responses to the waterbody, connectivity, and geography variables. The survey found 46 species of zooplankton and 119 species of phytoplankton, the latter of which were categorized into 20 RFGs. Zooplankton richness was mainly driven by water physicochemical parameters (explained variance = 68%, p < 0.05) (Figure 3a) and was not directly related to landform or connectivity. Phytoplankton were significantly affected by all environmental variable groups (waterbody: explained variance = 39%, p < 0.05; connectivity: explained variance = 33%, p < 0.05; geography: explained variance = 28%, p < 0.05) (Figure 3a). RFGs were rich in all communities and did not show a significant response to environmental data (Figure 3a).
The connectivity between the ponds and outside waterbodies affected the water quality, and the influence of pond area differences on the waterbody was basically excluded. First, connectivity and geography together explained 53% of the water property variation among ponds. In particular, C2 and C3 (distance and ditch number of the shortest path to the outside) had a greater influence (Figure 3b). Second, based on the similarity ordination of water properties, the actual connection and pond area were superimposed (Figure 3b). As the ponds nearest to or farthest from the outside water, P1, P5, P6, and P9 had more unique habitats (Figure 3b). These results showed that the pond water properties were influenced by geomorphic factors such as depth and perimeter, but connectivity played a major role in pond habitat diversification.

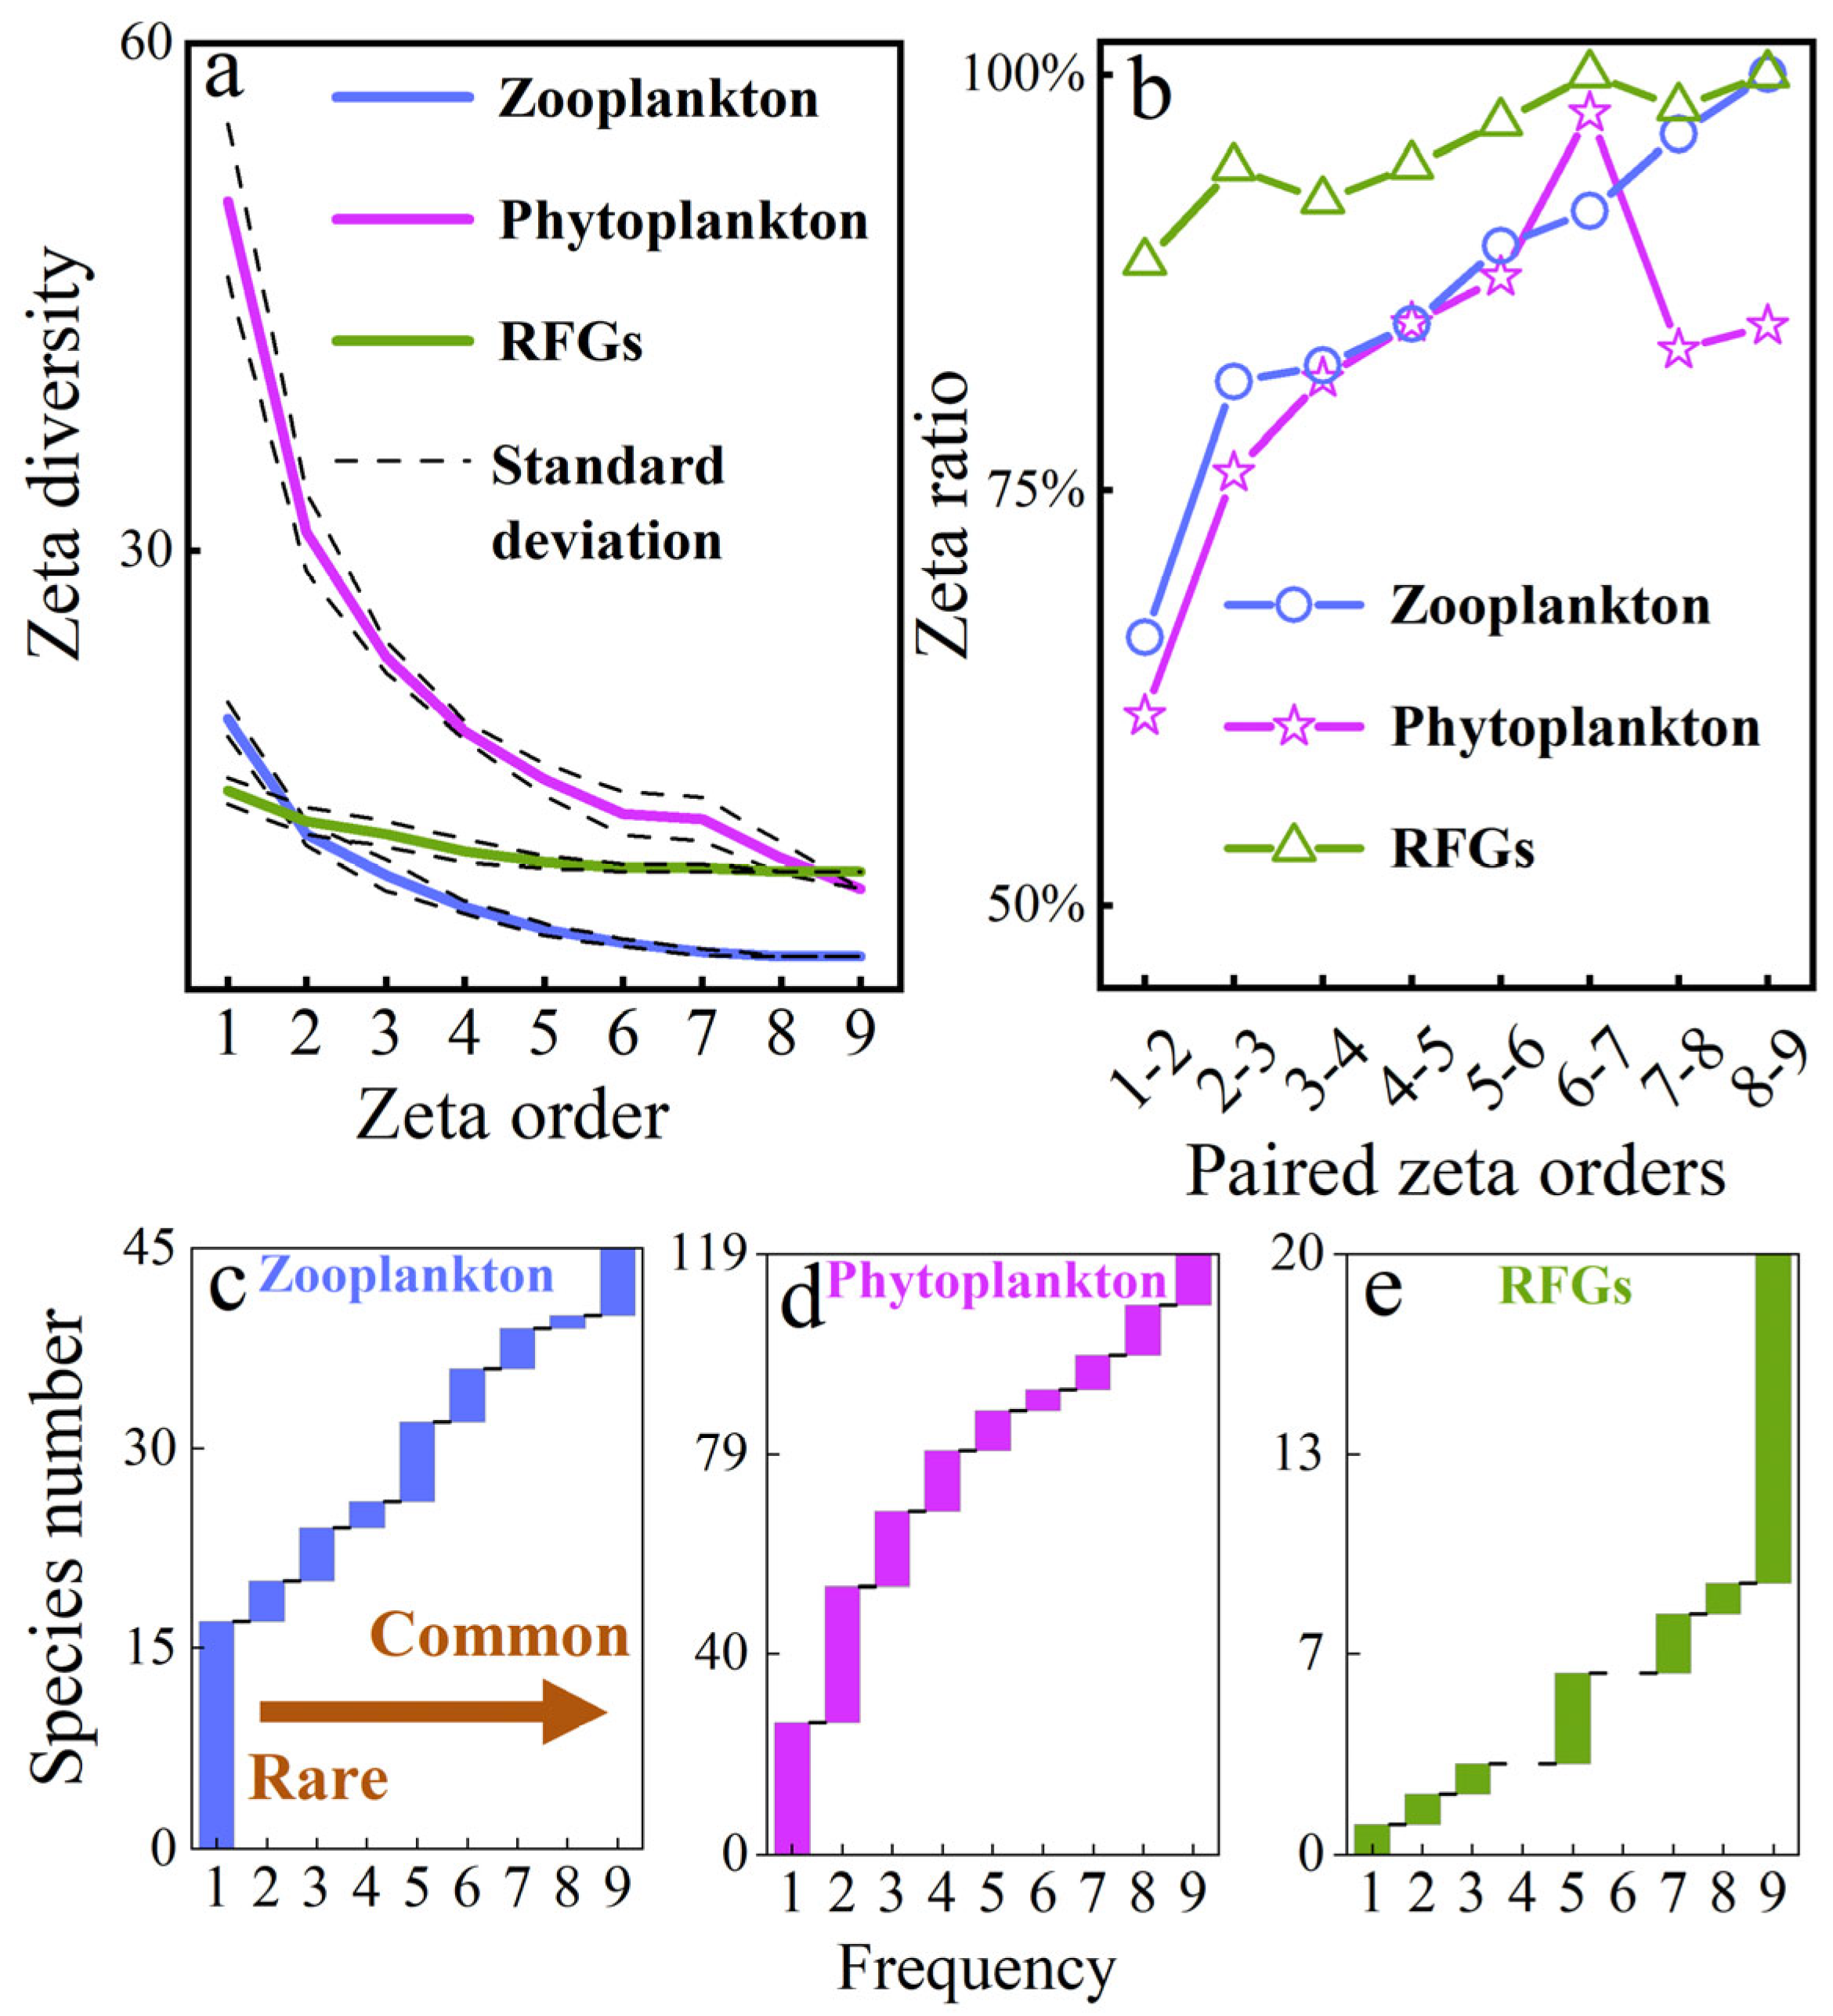
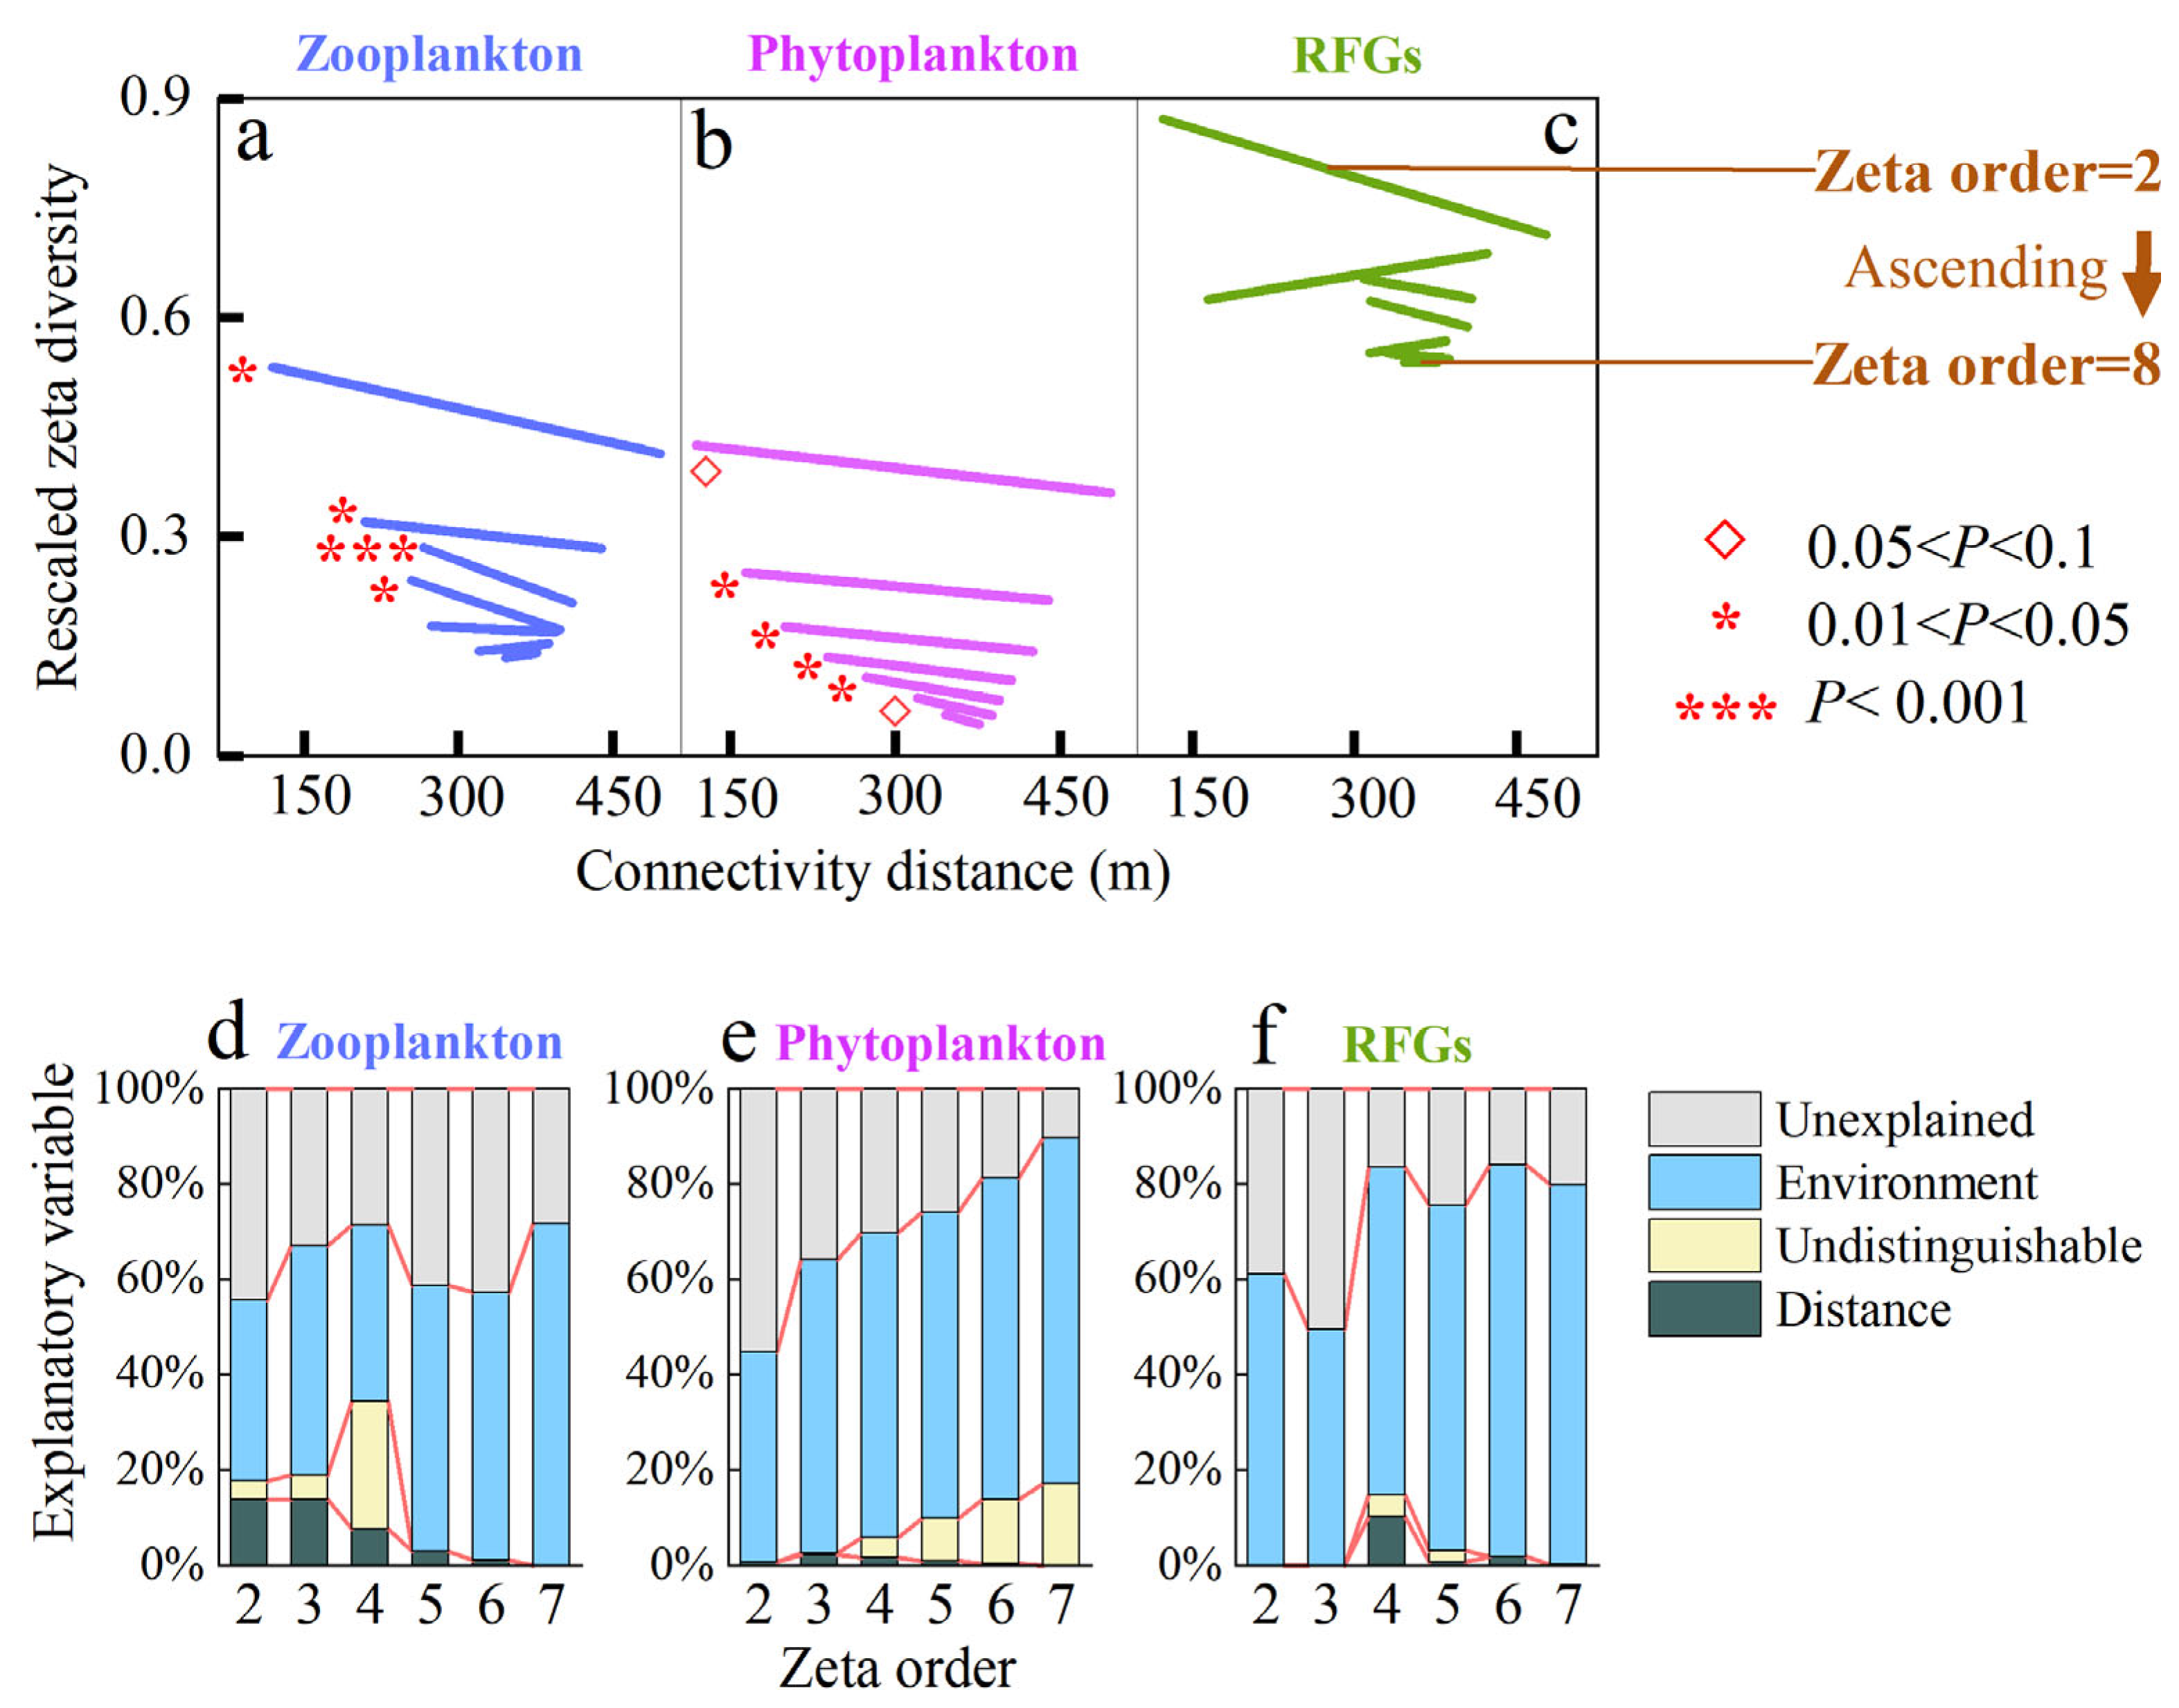
3.2. Connectivity Drives Species Turnover via Differential Mechanisms

Figure 4a,b shows the zeta diversity structures of plankton on continuous zeta order scales: the zeta ratio had a minimum value when zeta order = 1 and 2 and most plankton were relatively rare species (low-frequency occurrences) that contributed more to species turnover among communities. With the increase in zeta order (more communities were compared simultaneously), the zeta diversity of all plankton gradually declined, reflecting that phytoplankton, RFGs, and zooplankton had stable common species in all communities. Additionally, the zeta diversities of the zooplankton and phytoplankton declined in the first five zeta orders (Figure 4a), indicating that relatively rare species contributed more than common species to zeta diversity, which is consistent with the species frequency patterns in which rare species predominate (Figure 4c,d).
The zeta diversity of the RFGs decreased more slowly than that of phytoplankton and zooplankton with increasing zeta order (Figure 3a), reflecting the homogenization of the RFGs (Figure 4e). For phytoplankton and RFGs, rapid decreases in the ratios of zeta orders 7 and 8 (Figure 4b) were observed. Specifically, when 7 or 8 communities were taken as a whole (excluding 1 or 2 communities) in the process of calculating the zeta ratios, the zeta diversity values were strongly affected by species with frequencies of 1 or 2, indicating that rare species caused fast turnover of both phytoplankton and RFGs. Conversely, the zeta ratio of zooplankton continued to increase (Figure 4b), reflecting a more gradual composition turnover process.
To detect the correlation between distance and plankton species turnover, Figure 5 shows the variation trend of zeta diversity with increasing distance: both zooplankton and phytoplankton showed significant distance dependence, while RFGs did not respond significantly to distance. When the zeta order was [2,5], zooplankton had a distance-dependent effect (Figure 5a,d). When the zeta order was [4,5], the zeta diversity decreased strongly with increasing distance (Figure 5a), reflecting the strong dispersal filtration of connectivity on zooplankton. In contrast, phytoplankton showed a similar diversity decline trend, especially when significance was set to 0.1 (Figure 5b), and most orders showed stable dispersal filtrations. This result suggests that both rare and common phytoplankton species generally exhibit distance-dependent effects and that these effects have almost the same strength (Figure 5e). In contrast, RFGs did not show distance dependence at any scale (Figure 5c), indicating that distance restriction does not lead to functional group differentiation, at least within 500 m.

4. Discussion

4.1. Zeta Diversity Quantified the Effect of Connectivity on Community Assembly

Both zooplankton and phytoplankton richness were significantly correlated with habitat heterogeneity, but only phytoplankton richness correlated with connectivity. Related studies have analysed the distance dependence of plants [26], microbial communities associated with kelp [27], and fishes [28] but have not analysed the contribution of habitat heterogeneity. One of the main reasons is that connectivity directly limits plankton dispersal, but the effects of dispersal filtration are difficult to separate: the effects of dispersal on metacommunities can depend on environmental heterogeneity [29], or environmental heterogeneity can interact with the effects of dispersal. For instance, Limberger et al. [30] found evidence that the diversity of zooplankton was almost unaffected by trophic heterogeneity but was responsive to trophic interactions. In wadeable streams and non-wadeable rivers in the Danube basin, the zeta diversity of riverine fish suffers from faunal homogenization at zeta orders above seven, which revealed a new and so far undescribed response of native fish diversity to anthropogenic stressors; this indicated that the zeta diversity could significantly deepen our knowledge on patterns in freshwater fish biodiversity to multistressor effects [28].
In recent research, zeta diversity has provided a way to partition the effects of environment and distance: variation partitioning of zeta diversity over distance and environmental variables [16,25]. Here, a significant distance dependence was detected based on the zeta diversity decay (Figure 5a,b). Furthermore, connectivity distance independently explained some of the changes in diversity, especially for zooplankton (Figure 5d). In this study, the effects of environmental factors and dispersal filtering on zeta diversity were well delineated, supporting the further evaluation of the effects of connectivity on plankton.

4.2. The Small Wetland Complex Could Efficiently Enhance Species Richness

The small wetland complex has an important feature: within a limited protected area, connectivity can elongate the diffusion paths of biological and material flows. For example, the connectivity distance (547 m) was much longer than the horizontal distance (325 m) from P4 to P9 (Figure 2c); thus, the longer connectivity distance contributed to dispersal filtration and achieved one of the goals of the reserve design: to maximize biodiversity and minimize costs. If targets are set ambitiously, it is true that they may be unachievable in the short term due to a lack of funds and available land [31].
On the other hand, this study’s results demonstrated that the species richness of the small wetland complex study was more than double that of a single small wetland. Similarly, based on the multi-scale response of wetland bird assemblages to landscape patterns on a neotropical island, Fischer and Lindenmayer [32] showed that smaller patches contributed strongly to species accumulation curves. Importantly, although the enclosed ponds in the Xixi Wetland also promoted diverse phytoplankton communities [4], the ponds in the small wetland complex studied did not come at the cost of fragmentation. In contrast to directly protecting a large wetland area, the conservation of small wetland complexes involves the maintenance of multiple relatively independent small wetlands. Small wetland complexes can also coordinate their subsystems’ spatial connections [7], and they have the ability to promote diverse communities and, thus, improve conservation efficiency. Although large reserves are the necessary backbone of successful conservation [31], small wetland complex conservation or planning can be a valuable complement to conservation strategies.

4.3. The Ecological Effects of Connectivity May Benefit Rare Species Conservation
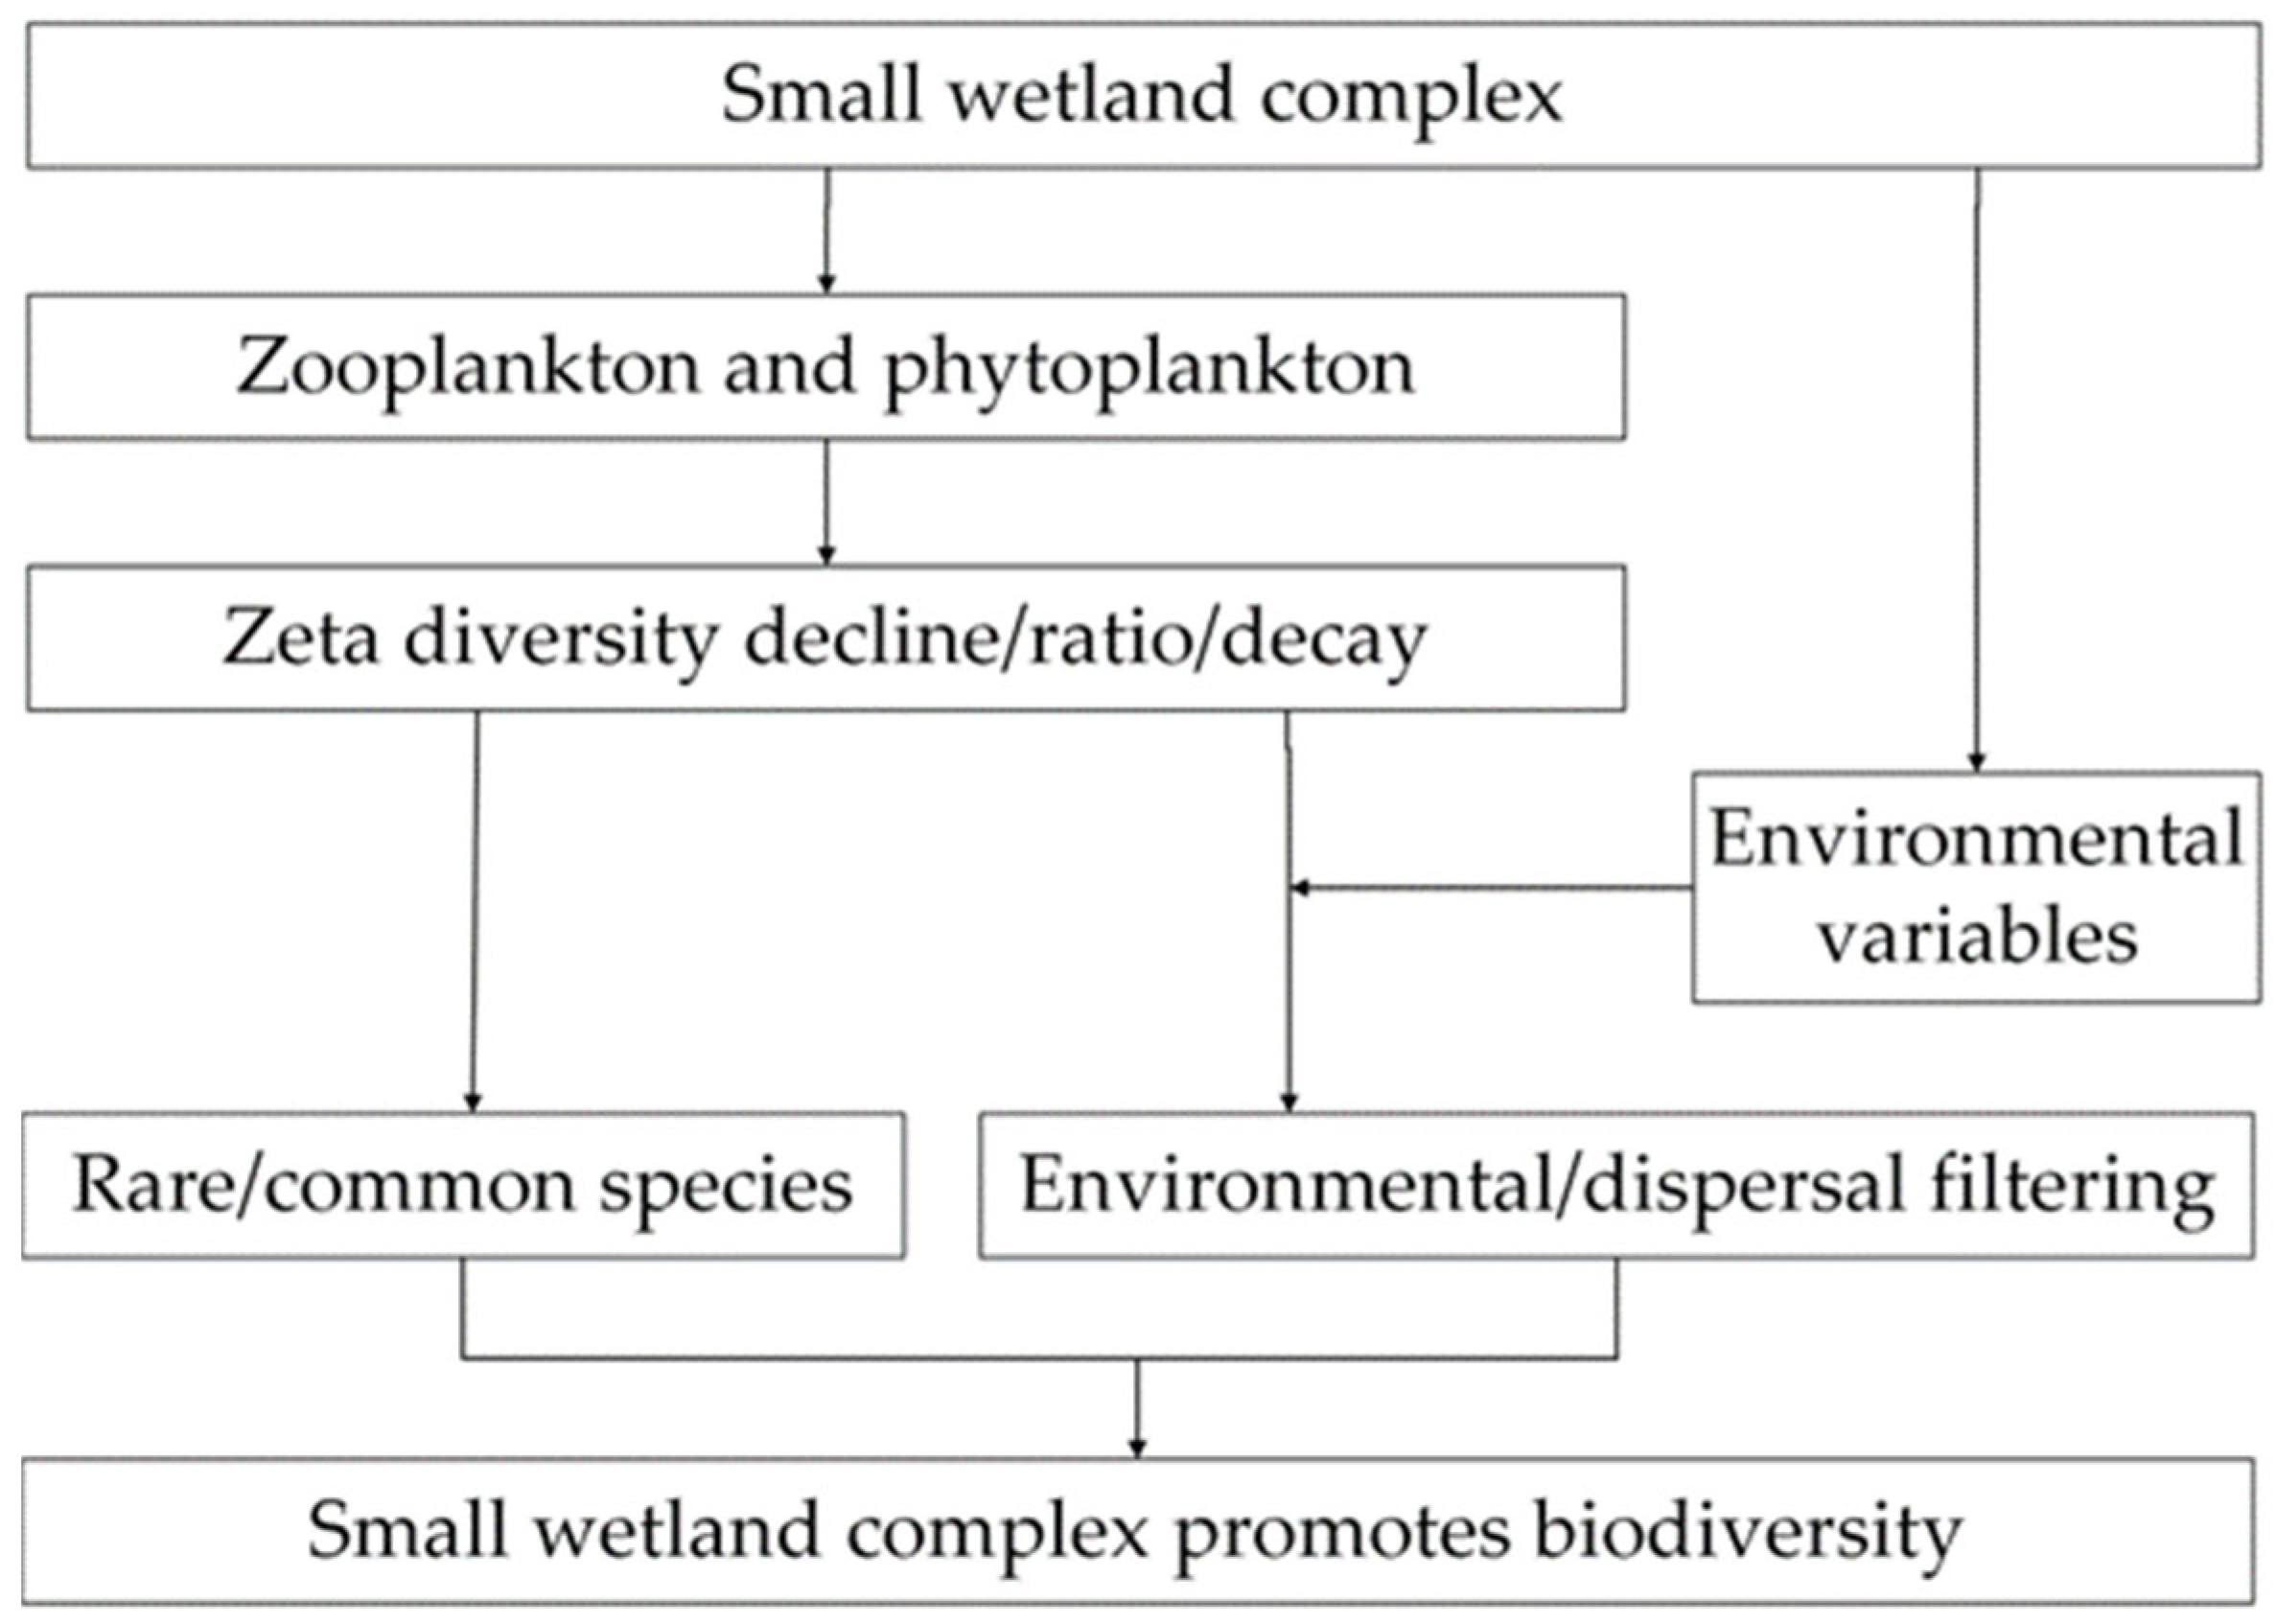
This study’s results are consistent with a previous study of planktonic diatom communities [24], which found that the local environment and connectivity were the main drivers of plankton biodiversity. In contrast to amphibian biodiversity at the landscape scale [15], the small wetland complex evaluated in this study did not significantly drive functional group turnover, possibly because the ponds were quite close together. Nonetheless, biodiversity at the species level responded significantly to connectivity. According to a study by Richardson et al. [1], small wetlands are critical for capturing rare and threatened species and their functional richness.
It is generally believed that connectivity management can prevent the degradation of small wetlands [33] and reduce extinction risks [34]. Singh et al. suggested helping to restore the inter-patch connectivity pathways and highlighted the ecological implications of connectivity and patch dynamics for developing sustainable wetland management plans [35]. In the same way, the Convention on Wetlands [6] called for an assessment of the connectivity and quality of small wetlands. In summary, the value of connectivity of small wetlands in terms of rare species conservation and richness is being increasingly recognized, and this information is relevant to conservation strategies, with the need to manage connectivity to protect biodiversity.

5. Conclusions

Small wetlands provide crucial ecosystem services but have not received enough attention. One of the important reasons is that scientific research on small wetlands is very scarce. The concept of small wetland complexes is a novel approach that holds the potential to accommodate diverse communities while simultaneously enhancing the conservation efficiency of small wetlands. This study investigated a pond-like small wetland complex encompassing plankton, waterbody properties, geography variables, and hydrological connectivity. The main conclusions are as follows.
  • The plankton community in the small wetland complex comprises 46 zooplankton and 119 phytoplankton species, with the species richness primarily influenced by the waterbody properties (p < 0.05). This suggests that the small wetland complex studied provides a diverse habitat capable of accommodating various types of plankton. Conversely, the impact of waterbody properties on plankton reflects an environmental filtering effect during community assembly.
  • Zeta diversity decay describes the distance-dependent effect of zooplankton and phytoplankton (p < 0.05), indicating that hydrological connectivity distance influences plankton zeta diversity. This phenomenon of distance attenuation reflects a dispersal filtering effect during community assembly.
  • Relatively rare species outnumber relatively common species in the small wetland complex, suggesting that increasing small wetlands facilitates capturing these relatively rare common species. Based on zeta diversity decline and ratio, rare species dominate community turnover, indicating their positive contribution to enhancing both species richness and zeta diversity within the small wetland complex.
  • Furthermore, comparing environmental filtration and dispersal filtration reveals that environmental filtration has a stronger influence than dispersal filtration in this small wetland complex.
Overall, zeta diversity is valuable for revealing the ecological processes of plankton community assembly in a small wetland complex, and it was used to (1) compare the contributions of relatively rare and common species to zeta diversity, (2) quantify the response of zeta diversity to continuous spatial distance, and (3) separate dispersal filtration and environmental filtration. This study further suggests that the connectivity management of small wetlands needs to consider hydrological connectivity, emphasizing that controlling the water flux to affect environmental gradients and controlling the path distance to affect biological diffusion would greatly improve the precise management level of small wetland conservation.

Author Contributions

J.C.: Study design, Data and sample collection, Sample measurement, Writing—original draft. F.Z.: Assisting sample collection and measurement. D.L.: Assisting sample collection. R.Z.: Assisting sample collection. X.L.: Manuscript revision. W.J.: Assisting sample collection. L.X.: Manuscript revision. S.A.: Study design, Manuscript revision. All authors have read and agreed to the published version of the manuscript.

Funding

This research was funded by Chaohu Basin Mountains, Waters, Forests, Fields, Lakes and Grassland Monitoring System Construction Project (Survey and Assessment Part) [2022BFAWZ02436], Research and demonstration of bird-friendly constructed wetland technology for treating aquaculture tailwater at heritage sites [HSDKT202310], and The Major Science and Technology Program for Water Pollution Control and Treatment of China [2017ZX07401003-02].

Data Availability Statement

The data are available from the corresponding author upon reasonable request.

Acknowledgments

We would like to thank Miao Zhang and Jiachen Shen for their assistance in the maintenance of the systems.

Conflicts of Interest

The authors declare that the research was conducted in the absence of any commercial or financial relationships that could be construed as a potential conflict of interest.

References

  1. Richardson, S.J.; Clayton, R.; Rance, B.D.; Broadbent, H.; McGlone, M.S.; Wilmshurst, J.M. Small wetlands are critical for safeguarding rare and threatened plant species. Appl. Veg. Sci. 2015, 18, 230–241. [Google Scholar] [CrossRef]
  2. Zhao, H.; Chen, J.Q.; Chen, X.; Xiong, Y.Y.; An, S.Q. Conservation and Management of Small and Micro Wetlands. Wetl. Sci. Manag. 2018, 14, 24–28. [Google Scholar]
  3. Dahl, T.E. Status and Trends of Prairie Wetlands in the United States 1997 to 2009; US Fish and Wildlife Service: Washington, DC, USA, 2014. [Google Scholar]
  4. Jia, X.H.; Wu, M.; Shao, X.X.; Jiang, K.Y. Community characteristics of phytoplanktons in closed ponds of Xixi wetland and related affecting factors. Chin. J. Ecol. 2010, 29, 1743–1748. [Google Scholar]
  5. Biggs, J.; Williams, P.; Whitfield, M.; Nicolet, P.; Weatherby, A. 15 years of pond assessment in Britain: Results and lessons learned from the work of Pond Conservation. Aquat. Conserv. Mar. Freshw. Ecosyst. 2005, 15, 693–714. [Google Scholar] [CrossRef]
  6. Convention on Wetlands. Report No. XIII.21: Conservation and Management of Small Wetlands. 2018. Available online: https://www.ramsar.org/document/resolution-xiii21-conservation-and-management-small-wetlands (accessed on 29 October 2018).
  7. Convention on Wetlands. Draft Resolution on Guidance on Conservation and Management of Small Wetlands. 2022. Available online: https://www.ramsar.org/document/sc59-doc244-draft-resolution-guidance-conservation-management-small-wetlands (accessed on 23 April 2021).
  8. Luo, Y.; Wu, J.; Wang, X.; Wang, Z.; Zhao, Y. Can policy maintain habitat connectivity under landscape fragmentation? A case study of Shenzhen, China. Sci. Total Environ. 2020, 715, 136829. [Google Scholar] [CrossRef] [PubMed]
  9. Perkin, J.S.; Gido, K.B.; Cooper, A.R.; Turner, T.F.; Osborne, M.J.; Johnson, E.R.; Mayes, K.B. Fragmentation and dewatering transform Great Plains stream fish communities. Ecol. Monogr. 2015, 85, 73–92. [Google Scholar] [CrossRef]
  10. Ginders, M.A.; Collier, K.J.; Duggan, I.C.; Hamilton, D.P. Influence of Hydrological Connectivity on Plankton Communities in Natural and Reconstructed Side-Arms of a Large New Zealand River. River Res. Appl. 2016, 32, 1675–1686. [Google Scholar] [CrossRef]
  11. Si, X.; Cadotte, M.W.; Davies, T.J.; Antonelli, A.; Ding, P.; Svenning, J.C.; Faurby, S. Phylogenetic and functional clustering illustrate the roles of adaptive radiation and dispersal filtering in jointly shaping late-Quaternary mammal assemblages on oceanic islands. Ecol. Lett. 2022, 25, 1250–1262. [Google Scholar] [CrossRef] [PubMed]
  12. Chust, G.; Villarino, E.; Chenuil, A.; Irigoien, X.; Bizsel, N.; Bode, A.; Broms, C.; Claus, S.; Fernandez de Puelles, M.L.; Fonda-Umani, S.; et al. Dispersal similarly shapes both population genetics and community patterns in the marine realm. Sci. Rep. 2016, 6, 28730. [Google Scholar] [CrossRef]
  13. Xiao, R.; Wang, Q.; Zhang, M.X.; Pan, W.B.; Wang, J.J. Plankton distribution patterns and the relationship with environmental gradients and hydrological connectivity of wetlands in the Yellow River Delta. Ecohydrol. Hydrobiol. 2020, 20, 584–596. [Google Scholar] [CrossRef]
  14. Salinas-de-Leon, P.; Jones, T.; Bell, J.J. Successful determination of larval dispersal distances and subsequent settlement for long-lived pelagic larvae. PLoS ONE 2012, 7, e32788. [Google Scholar] [CrossRef]
  15. Jeliazkov, A.; Lorrillière, R.; Besnard, A.; Garnier, J.; Silvestre, M.; Chiron, F. Cross-scale effects of structural and functional connectivity in pond networks on amphibian distribution in agricultural landscapes. Freshw. Biol. 2019, 64, 997–1014. [Google Scholar] [CrossRef]
  16. Hui, C.; McGeoch, M.A. Zeta diversity as a concept and metric that unifies incidence-based biodiversity patterns. Am. Nat. 2014, 184, 684–694. [Google Scholar] [CrossRef] [PubMed]
  17. Latombe, G.; Hui, C.; McGeoch, M.A. Multi-site generalised dissimilarity modelling: Using zeta diversity to differentiate drivers of turnover in rare and widespread species. Methods Ecol. Evol. 2017, 8, 431–442. [Google Scholar] [CrossRef]
  18. Nekola, J.C.; McGill, B.J. Scale dependency in the functional form of the distance decay relationship. Ecography 2014, 37, 309–320. [Google Scholar] [CrossRef]
  19. Simons, A.L.; Mazor, R.; Stein, E.D.; Nuzhdin, S. Using alpha, beta, and zeta diversity in describing the health of stream-based benthic macroinvertebrate communities. Ecol. Appl. 2019, 29, e01896. [Google Scholar] [CrossRef]
  20. Hu, H.J.; Wei, Y.X. The Freshwater Algae of China—Systematics, Taxonomy and Ecology; Scientific & Technical Publishers: Beijing, China, 2006. [Google Scholar]
  21. Weng, J.Z.; Xu, H.S. Atlas of Freshwater Planktonic Alage in China; Science & Technology Press: Beijing, China, 2010. [Google Scholar]
  22. Reynolds, C.S.; Huszar, V.; Kruk, C.; Naselli-Flores, L.; Melo, S. Towards a functional classification of the freshwater phytoplankton. J. Plankton Res. 2002, 24, 417–428. [Google Scholar] [CrossRef]
  23. Blanchet, F.G.; Legendre, P.; Borcard, D. Modelling directional spatial processes in ecological data. Ecol. Model. 2008, 215, 325. [Google Scholar] [CrossRef]
  24. Zorzal-Almeida, S.; Soininen, J.; Bini, L.M.; Bicudo, D.C. Local environment and connectivity are the main drivers of diatom species composition and trait variation in a set of tropical reservoirs. Freshw. Biol. 2017, 62, 1551–1563. [Google Scholar] [CrossRef]
  25. McGeoch, M.A.; Latombe, G.; Andrew, N.R.; Nakagawa, S.; Nipperess, D.A.; Roige, M.; Marzinelli, E.M.; Campbell, A.H.; Verges, A.; Thomas, T.; et al. Measuring continuous compositional change using decline and decay in zeta diversity. Ecology 2019, 100, e02832. [Google Scholar] [CrossRef] [PubMed]
  26. Wilson, H.D. Natural History of Banks Peninsula; Canterbury University Press: Christchurch, New Zealand, 2009. [Google Scholar]
  27. Thompson, P.A.; Bonham, P.; Waite, A.M.; Clementson, L.A.; Cherukuru, N.; Hassler, C.; Doblin, M.A. Contrasting oceanographic conditions and phytoplankton communities on the east and west coasts of Australia. Deep-Sea Res. Part Ii-Top. Stud. Oceanogr. 2011, 58, 645–663. [Google Scholar] [CrossRef]
  28. Eros, T.; Czegledi, I.; Toth, R.; Schmera, D. Multiple stressor effects on alpha, beta and zeta diversity of riverine fish. Sci. Total Environ. 2020, 748, 141407. [Google Scholar] [CrossRef]
  29. Leibold, M.A.; Holyoak, M.; Mouquet, N.; Amarasekare, P.; Chase, J.M.; Hoopes, M.F.; Holt, R.D.; Shurin, J.B.; Law, R.; Tilman, D.; et al. The metacommunity concept: A framework for multi-scale community ecology. Ecol. Lett. 2004, 7, 601–613. [Google Scholar] [CrossRef]
  30. Limberger, R.; Birtel, J.; Farias, D.D.S.; Matthews, B. Ecosystem flux and biotic modification as drivers of metaecosystem dynamics. Ecology 2017, 98, 1082–1092. [Google Scholar] [CrossRef]
  31. Carwardine, J.; Klein, C.J.; Wilson, K.A.; Pressey, R.L.; Possingham, H.P. Hitting the target and missing the point: Target-based conservation planning in context. Conserv. Lett. 2009, 2, 3–10. [Google Scholar] [CrossRef]
  32. Fischer, J.; Lindenmayer, D.B. Small patches can be valuable for biodiversity conservation: Two case studies on birds in southeastern Australia. Biol. Conserv. 2002, 106, 129–136. [Google Scholar] [CrossRef]
  33. Williams, P.; Biggs, J.; Crowe, A.; Murphy, J.; Nicolet, P.; Weatherby, A.; Dunbar, M. Countryside Survey: Ponds Report from 2007. 2010. Available online: https://www.ceh.ac.uk/our-science/projects/countryside-survey (accessed on 1 January 2010).
  34. Deane, D.C.; Fordham, D.A.; He, F.L.; Bradshaw, C.J.A. Future extinction risk of wetland plants is higher from individual patch loss than total area reduction. Biol. Conserv. 2017, 209, 27–33. [Google Scholar] [CrossRef]
  35. Singh, M.; Sinha, R.; Mishra, A.; Babu, S. Wetlandscape (dis)connectivity and fragmentation in a large wetland (Haiderpur) in west Ganga plains, India. Earth Surf. Process. Landf. 2022, 47, 1872–1887. [Google Scholar] [CrossRef]
Figure 1. Flow chart of the methodology.
Water 16 00476 g001
Figure 2. Location (a), substrate (b), and connections (c) of the small wetland complex. The nine ponds are labelled P1 to P9.
Water 16 00476 g002
Figure 3. (a) Variance decomposition analysis of plankton richness according to geography, connectivity, and waterbody properties. (b) Redundancy analysis (RDA) and actual connections of the waterbodies. The RDA eigenvectors related to geography and connectivity were rescaled and integrated. C1: ditch number of a pond; C2: ditch number to an outside waterbody; C3: shortest path to an outside waterbody; G1: area-to-perimeter ratio; G2: perimeter; G3: area; G4: volume; G5: depth.
Water 16 00476 g003
Figure 4. Zeta diversity decline (a) and zeta ratio (b); (ce) present species occurrence frequencies.
Water 16 00476 g004
Figure 5. (ac) are rescaled zeta diversity decay trends. For every zeta order, a generalized linear model (GLM) was used to fit the relationship between zeta diversity and connectivity distance. The slope of the line represents the rate of zeta diversity decay. (df) present explanatory variables for zeta diversity based on variance decomposition analysis. Undistinguishable connectivity usually reflects an interaction between connectivity distance and environmental factors but may also be due to either of these factors independently.
Water 16 00476 g005
Disclaimer/Publisher’s Note: The statements, opinions and data contained in all publications are solely those of the individual author(s) and contributor(s) and not of MDPI and/or the editor(s). MDPI and/or the editor(s) disclaim responsibility for any injury to people or property resulting from any ideas, methods, instructions or products referred to in the content.

