Article

Hydrochemical Characteristics and Indication to Geothermal Genesis of Low–Medium-Temperature Convection Geothermal Field in Yanshan Orogenic Basin, China

1
Chinese Academy of Geological Sciences, Beijing 100037, China
2
Key Laboratory of Shallow Geothermal Energy, Ministry of Natural Resources of the People’s Republic of China, Beijing 100195, China
3
Shanxi Geological Engineering Exploration Insitute Co., Ltd., Taiyuan 030024, China
4
Shanxi Key Laboratory for Exploration and Exploitation of Geothermal Resources, Taiyuan 030024, China
5
College of Oil and Gas Engineering, Chongqing University of Science & Technology, Chongqing 401331, China
6
Institute of Oceanology, Chinese Academy of Sciences, Qingdao 266071, China
7
College of Water Sciences, Beijing Normal University, Beijing 100875, China
*
Author to whom correspondence should be addressed.
Water 2024, 16(3), 433; https://doi.org/10.3390/w16030433
Submission received: 18 December 2023 / Revised: 11 January 2024 / Accepted: 15 January 2024 / Published: 29 January 2024

Abstract

:
The central part of the Zhangjiakou area is occupied by the Yanshan orogenic basin. A large number of piedmont faults developed over time, controlling the exposure of geothermal anomalies. The fluid chemistry characteristics and their influence on the heat generation mechanism of the medium- and low-temperature convective geothermal field in the area are not fully understood. In this study, the geothermal fluid was sampled and tested, and the hydrogeological background conditions were analyzed. The results show that the sulfate in geothermal fluid originates from the dissolution of gypsum or H2S oxidation in deep magma. The geothermal fluid in the faulted basin flows upward after deep circulation and interacts with shallow groundwater. The main source of geothermal fluid is atmospheric precipitation. The temperature of the hot reservoir is between 82 °C and 121 °C, and the depth of geothermal water circulation is more than 3200 m. It can be seen that the geothermal resources in this area are formed by the long-term contact of residual magma, geothermal heating and mechanical heating of neotectonic movement after atmospheric precipitation recharge.

1. Introduction

Geothermal water is the main geothermal resource used. Understanding the thermal mechanism is the key to sustainable development and utilization of resources [1,2]. The development and utilization of geothermal energy is of great significance to save energy as well as for the realization of emission reduction and the structural adjustment of energy consumption [3,4]. The low–medium-temperature convective geothermal system is widely distributed in North China. Because of their multi-staged structural evolution and complex structural features, determining the mechanical properties of faults through field observation is very difficult. In addition, these mechanical properties are often segmented. Controlled by neotectonic faults, the convection movement is strong [5,6,7]. Therefore, studying the formation mechanism, occurrence environment and circulation mechanism of geothermal resources is not only a prerequisite for guiding the sustainable development and utilization of geothermal resources, but also provides strong support for the overall ecological environment protection [8,9,10].
The research and interpretation of hydrogeochemical information such as the hydrochemical components and isotopic characteristics of fluids is an effective means to further expand our knowledge [11,12,13,14,15]. They can reveal the hydrochemical genesis mechanism, formation and evolution law and occurrence environment. Using the main and trace elements, hydrogen, oxygen and gas helium isotopes of geothermal fluids (>150 °C), it has been identified that the main source of the Rekeng geothermal system in the Eastern Himalayas is crustal deformation [16], but in India, the equivalent index analysis of geothermal fluids (<80 °C) indicates that it originates from geothermal gradient heating [17]. In the early years of this subject’s discovery, studies of hydrogen and oxygen isotopes in geothermal fluids in Tibet helped to identify their possible flow directions and sources of recharge [18]. Later on, the relationship between ion ratio and salinity was used to analyze the hydrodynamic environment of geothermal fluid in the Jiaodong area and its relationship with seawater recharge [19]. Studies on the distribution of environmental isotopes and hydrochemistry, including 14C, can clarify key geothermal cycle information such as residence time and circulation depth of conductive geothermal fluids in subsidence basins in the Gansu region [20]. In addition, various temperature scale calculations and scaling corrosion studies of geothermal water can evaluate the amount of geothermal resources and their availability in the region [21,22]. These previous works provide a research basis for exploring the geochemical origin of geothermal fluids, evaluating the quality of geothermal and related mineral resources, the thermodynamic activities and internal rheology of the relevant Earth’s crust.
At present, limited research has been conducted on the geothermal fields within the Yanshan orogenic basin in Zhangjiakou, and the genesis, occurrence environment, migration law of geothermal resources and the interrelationship between various thermal reservoirs are not fully understood [23,24]. It is difficult to scientifically and accurately guide the development of geothermal fields. This study has positive significance for clarifying the geological and geochemical characteristics of the geothermal system, systematically evaluating the potential of geothermal resources and promoting the geothermal research in this area.

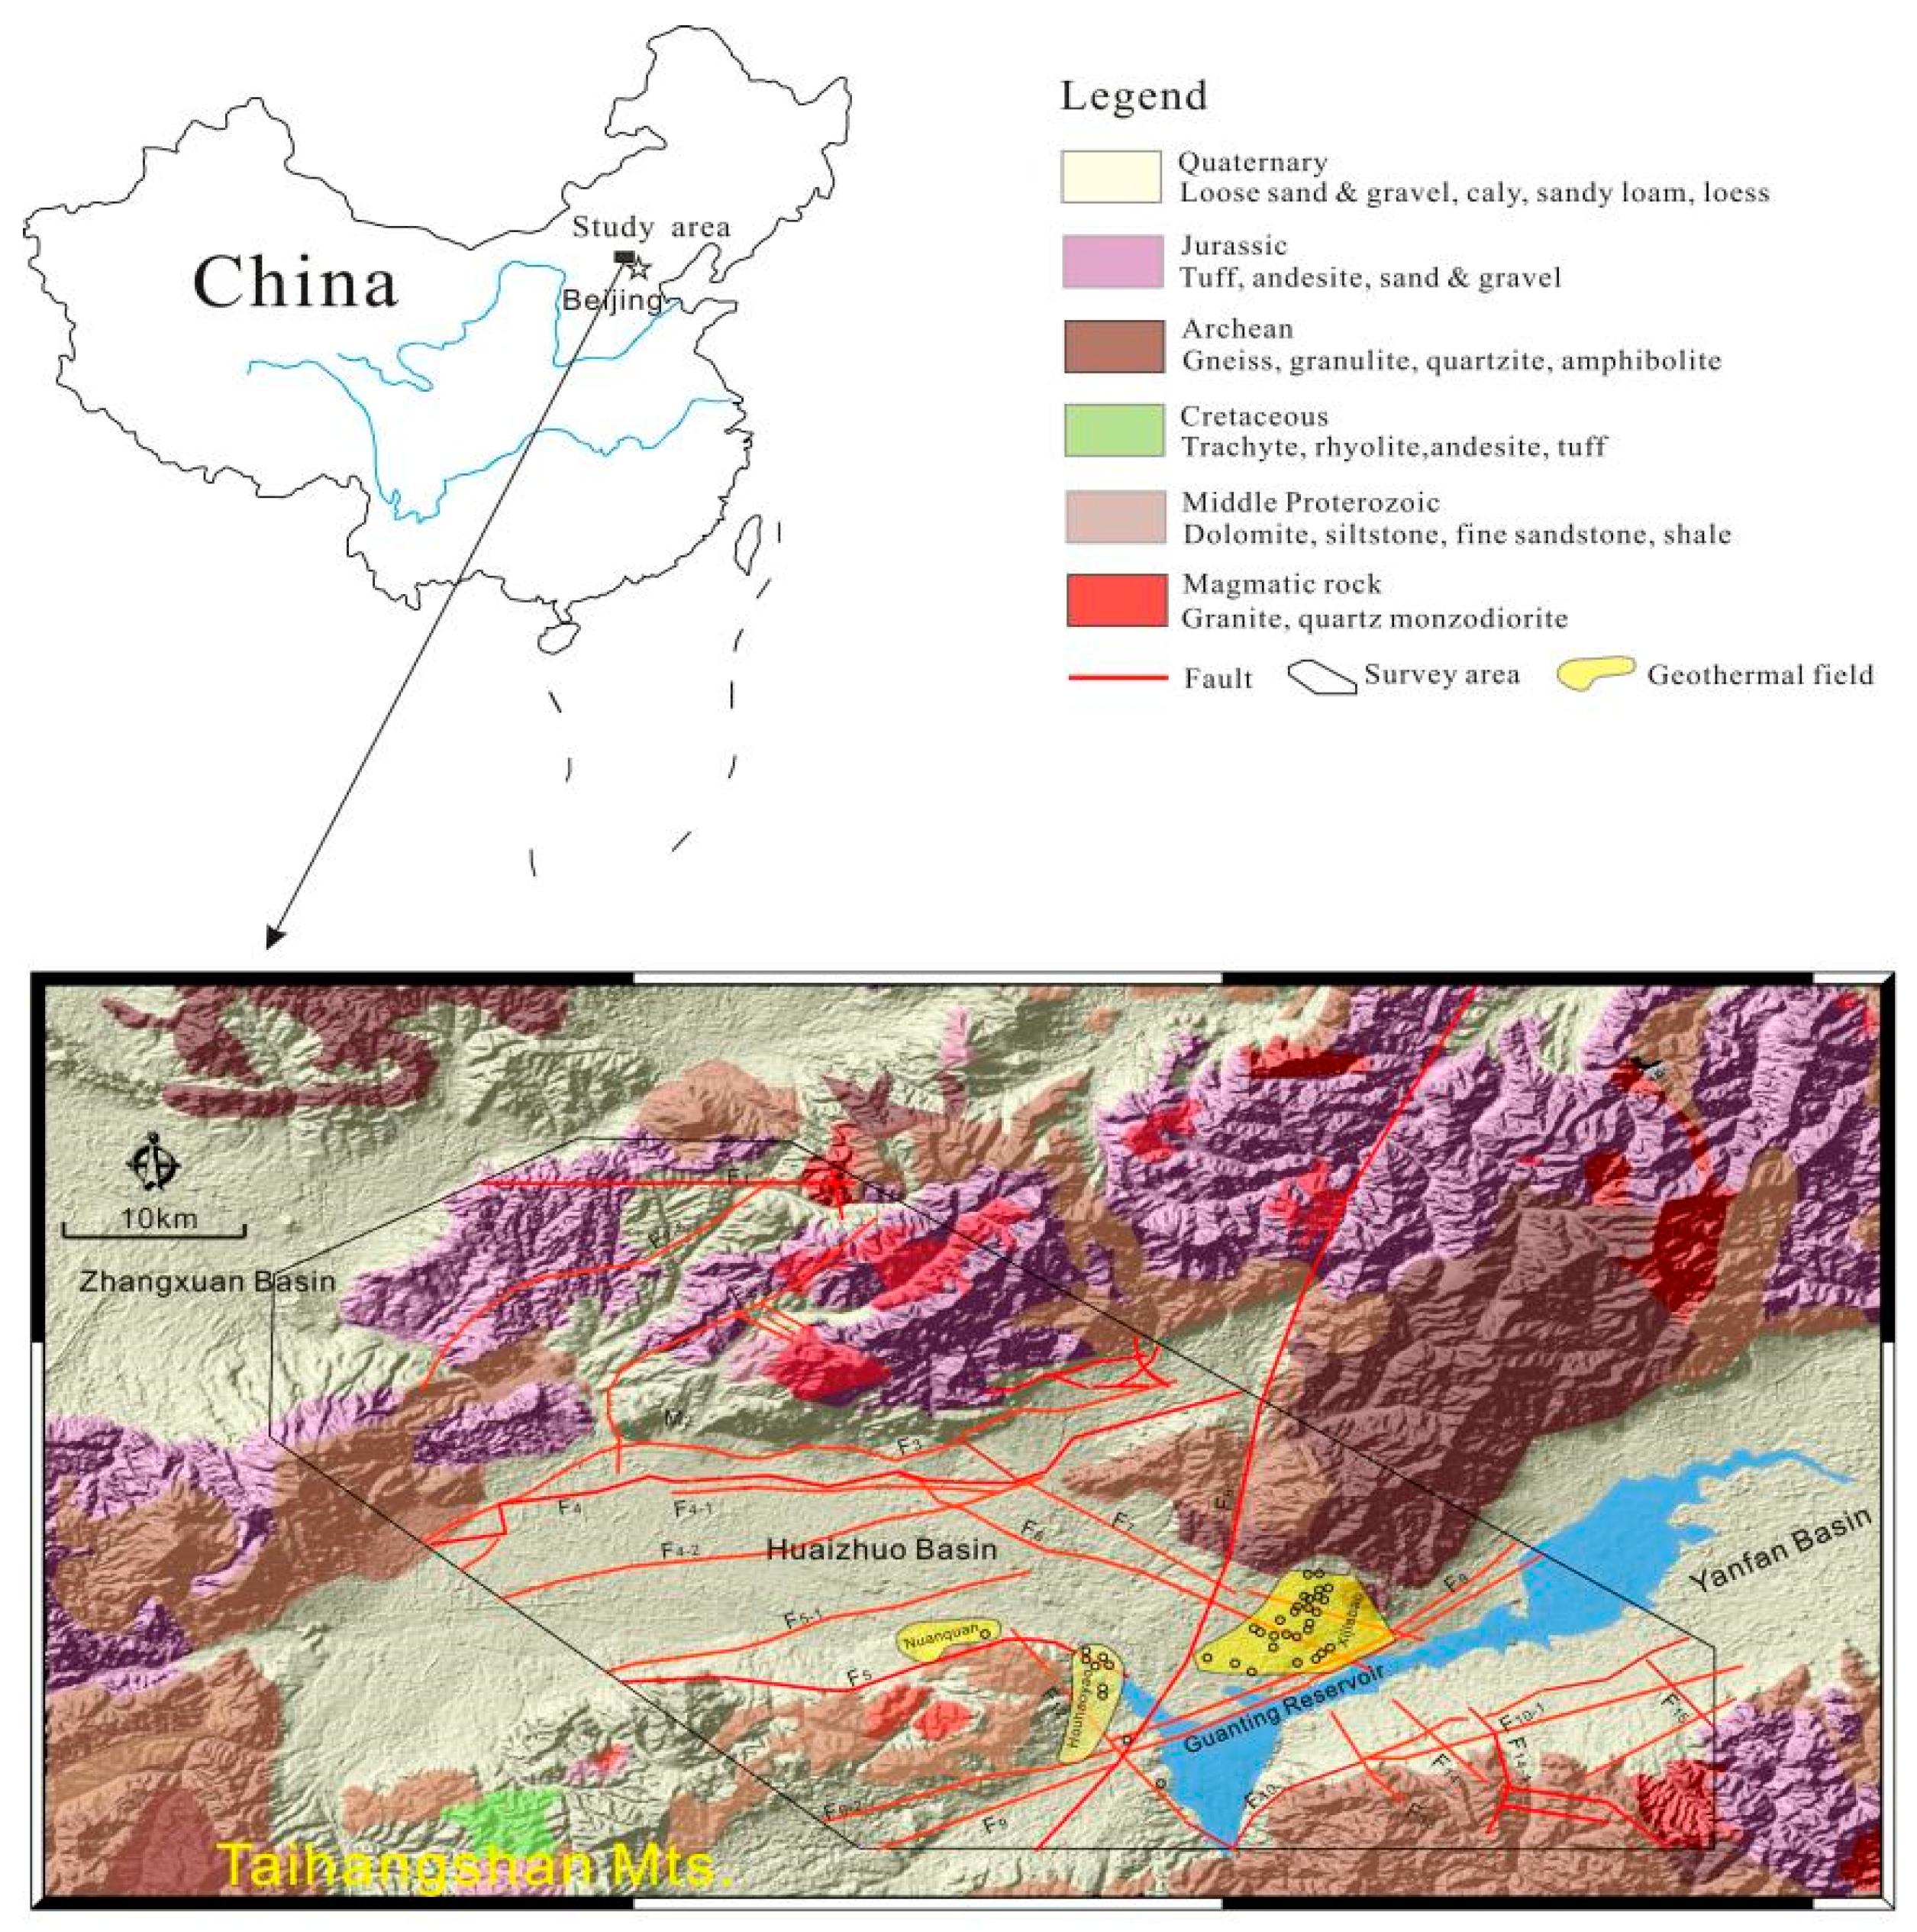
2. Regional Overview

The tectonic unit of Huailai County, Zhangjiakou City is located in the northern edge of North China (Figure 1). It includes three secondary tectonic units, the Inner Mongolia axis, the Yanshan platform fold belt and the Shanxi fault-uplift. The Shangyi, Chongli and Chicheng deep faults in the central part are separated between the Yanshan platform fold belt and the Inner Mongolia axis. Its north and south sides have experienced different geological development histories, showing very different geological tectonic characteristics [5,6].
The geological structure of this area is complex. The Paleozoic–Early Proterozoic ancient crystalline basement is dominated by fold deformation. The Middle and Late Proterozoic–Paleozoic are still dominated by inherited fold structures, followed by faults. Since the Mesozoic, it has been dominated by fault structures. The frame in the area is dominated by fractures mainly composed of three deep and large fault zones, the Kangbaoweichang fault, the Shangyi–Chongli–Chicheng fault, and the NNE-trending Dahenan–Daituo fault. Due to the strong and multi-stage tectonic changes, fault tectonic systems of different scales, different properties and different occurrences have been formed within their influence range. The magmatic activity in this region exhibits a robust intensity, forming an integral part of the magmatic activity belt within the tectonic framework of the Daxing’anling–Taihang mountains. Its primary period of occurrence is during the Mesozoic era, with its peak manifestation observed during the middle and late stages. The resultant magmatic rock formations from this epoch display characteristics such as extensive scale, widespread distribution, intricate morphologies and notable mineralization.
The temperature of exposed water in the thermal anomaly area of Houhaoyao geothermal field is 40–60 °C. The highest exposed water temperature is 89 °C. Hot water overflows the bedrock along the intersection of two sets of tectonic faults N30°W and N75°E in gneiss and fused tuff (J3), and exists in quaternary tertiary loose sedimentary layers. The hot springs here are located on the north side of the Guangling–Langshan fault in the east wing of the Qilu system [5,25]. At the intersection of the Qiutoushan–Wanjiayao fault of the Qilu system, the Yangjiashan fault of the Neocathaysian system and the Shizhuang fault of NW trending, fractures develop and rocks are broken. Hot water gushes out of bedrock along the tectonic fracture zone (Figure 2). The thermal anomaly of the Xijiabao geothermal field in Huailai is revealed by the civilians’ well and hot water wells. The water temperature is 42.5–60 °C. It is located on the northwest side of the intersection of the Guangling–Langshan Great Fault in the east wing of the Qilu system and the NNE-trending Huangjiachong hidden fault in the Neocathaysian system (Figure 2).

3. Data Acquisition

The sampling area is located in the Houhaoyao geothermal field, Xijiabao geothermal field and surrounding areas in Huailai County, Zhangjiakou City. A total of 64 samples were collected, including atmospheric precipitation, surface river water samples, reservoir water samples and 59 wellbore water samples (Figure 2). Temperature, pH, Eh and TDSs were monitored on site. The samples were filtered on site with a 0.22 μm filter membrane and collected in a 250 mL high-temperature-resistant PTFE bottle. Before sampling, the PTFE bottle was rinsed three times with the water sample to be taken. Three bottles of water samples were collected at each sampling point: one of which was added with premium pure HNO3 to reduce the pH to below 1 for cation analysis; one was untreated for anion and δD, δ18O isotope analysis; and one was retained as a spare. Among them, cations such as K+, Na+, Ca2+ and Mg2+ were detected via the ICP-OES method; anions such as HCO3, Cl, SO42− and F were analyzed through ion chromatography; and the balance error of anions and cations was controlled within 3%. Hydrogen and oxygen isotope tests were performed using a Thermo Scientific MAT 253 gas stable isotope mass spectrometer (Thermo Fisher Scientific, Waltham, MA, USA), and the error of hydrogen and oxygen isotope analysis was ±0.5‰ (Table 1)
According to previous studies, the quality assurance and quality control were controlled by method blanks, field duplicate samples and standard reference materials. The relative percent difference for chemical parameters identified in paired duplicate samples was all <10%. Blank samples were performed throughout all the experiments. To explicitly evaluate the analytical precision, all samples were determined in triplicate. Precision, expressed as relative standard deviation, was better than 10%.
The accuracy of the total analysis was assured using the certified values of the standard reference materials. ICP-1000 requires water as a substrate, and ICP-AES and ICP-MS require dilute nitric acid as a substrate. Therefore, ICP-AES and ICP-MS tested elements using the standard reference materials GNM-M33198-2013 (North Weiye Measurement Group Co. LTD., Beijing, China).and GNM-M28212-2013. (North Weiye Measurement Group Co. LTD., Beijing, China).Elements for ICP-1000 were tested using the standard reference material GNM-M07283-2013 (North Weiye Measurement Group Co. LTD., Beijing, China). HCO3 was tested using the standard reference material BWZ7242-2016 (North Weiye Measurement Group Co. LTD., Beijing, China).
The recoveries of Ca2+, K+, Na+, Mg2+, SO42−, Cl, HCO3, NH4+, Fe, Mn, Cu, Zn, NO3, NO2, F, Pb and As were 94.34, 101.23, 97.03, 90.29, 106.06, 954.03, 108.50, 95.90, 107.36, 98.77, 105.77, 101.80, 98.80, 101.00, 100.00%, 92.10 and 103.10%, respectively.
The groundwater in the area exhibits a temperature range of 12.4–82.0 °C, with a spatial distribution that demonstrates a decreasing pattern centered around the Hou-haoyao and Xijiabao geothermal fields. To effectively differentiate the geochemical characteristics of geothermal fluids, we categorized all samples based on their temperatures: high-temperature groundwater (HTG: >45 °C), medium-temperature groundwater (MTG: 25–45 °C) and low-temperature groundwater (LTG: <25 °C). This temperature grouping is only applicable to this study.

4. Results and Discussion

4.1. Hydrogeochemical Characteristics

The Houhaoyao geothermal field, in the south–central part of Zhuolu–Huailai Cenozoic fault basin, is located at the intersection of the Dahenan–Chicheng deep fault and Yuxian–Yanqing large fault. The underground hot water of the field spills out along the intersection of NW and NE faults through gneisses and fused tuff, and then appears in the Cenozoic pore aquifer. The average water temperature of geothermal wells is 49.5 °C, and the highest water temperature is 82 °C. The geothermal water is mostly SO4-Na-type water, while the underground cold water in the same area is HCO3-Ca-type water. The geothermal water is weakly alkaline with a pH of 8.17–8.78.
The Xijiabao geothermal field is located northeast of the Huailai–Zhuolu Cenozoic fault basin, north of the intersection of the Dahenan–Chicheng fault and Yuxian–Yanqing fault. The heat storage rocks are Archaean gneiss and Yanshanian granite, and quaternary sand and gravel also contain hot water. The middle- and high-temperature geothermal fluids are mainly distributed in the central and northeastern parts of China, mainly SO4-Na-type water, with the highest water temperature of 62 °C. The geothermal water less than 25 °C is distributed in the southern margin region, which is the result of mixing between the upwelling of deep hot water and the cold water near the surface. Most of the geothermal water is of HCO3-Na type.
The temperature range of geothermal fluids in the area is 45–82 °C, with an average of 54.53 °C, and they are mainly distributed in the center of the designated area of Houhaoyao and Xijiabao geothermal fields. The order of cation content is Na+ > Ca2+ > K+ > Mg2+, and the order of anionic content is SO42− > Cl > HCO3. The main hydrochemical type is SO4-Na. The distribution of chemical parameters of the low-temperature groundwater samples is obviously different from that of the high-temperature groundwater samples. The spatial distribution of the low-temperature groundwater is far away from the central delineation range of the geothermal field, and it is dominated by HCO3–Ca·Mg, HCO3·SO4-Na water (Figure 3 and Figure 4).
The total dissolved solids (TDSs) of geothermal fluid is 619–932 mg/L, while the TDSs of shallow groundwater is only 427 mg/L. The TDSs of geothermal fluid in the northeastern and central regions are higher than those in the southern marginal regions. The total hardness varies from 31 to 337 mg/L, and the total hardness of geothermal fluid in the central region is lower than that in the marginal region.
In geothermal fluids, SO42− and Cl concentrations have the greatest correlation with TDSs, and the correlation coefficients are 0.96 and 0.95, respectively. The correlation coefficient between Na+ and K+ concentrations and TDSs is more than 0.85. This indicates that the dissolution of albite, potash feldspar and related sulfate minerals is the main factor leading to the excessive TDSs of geothermal fluids. The average concentration of Na+ was 127.0 mg/L, and the correlation coefficients with Cl, SO42− and F were all higher than 0.9, while the correlation coefficients with Mg2+ concentration were negative. This indicates that the dissolution of salt rock occurred during the migration of geothermal fluid. The average concentration of K+ was 3.23 mg/L, which was highly correlated with SO42−, HSiO3 and F, indicating that the dissolution of potash feldspar occurred during the migration (Figure 5).
The hydrochemical characteristics of shallow surface water show a similar ion content (Figure 3, Figure 4 and Figure 5). The content of Mg2+ ions is much higher than that of groundwater, and the hydrochemical type is Na·Mg–Cl·HCO3·SO4. Compared with reservoir water, river water is closer to groundwater (Figure 4 and Figure 5), indicating that its chemical characteristics may be affected by groundwater recharge to a certain extent.
Based on the hydrochemical analysis of the temperature-based groups, the distribution characteristics of TDSs and various ion contents can be inferred from the deep circulation of geothermal water in this area and the characteristics of mixing and interaction with shallow cold water. The low-temperature groundwater samples are close to the dolomite. Combined with the distribution characteristics of dolomite, chert band dolomite and argillaceous dolomite in the strata of the study area, the source of the partial dolomite dissolution of HCO3 in shallow cold water is explained (Figure 6). High-temperature groundwater is found near anhydrite, and the medium-temperature groundwater is affected by the mixing of the two; additionally, its distribution is wide.
For anions with the highest content in high-temperature groundwater in this region, there are generally three sources of SO42−; some may come from precipitation (atmospheric origin), while others from the sulfate dissolution of gypsum or from the oxidation of reduced sulfur minerals such as pyrite [26]. Thus, it may indicate the source of sulfate gypsum dissolution (Figure 6a).
Generally, the dissolution of gypsum will increase the content of SO42− and Ca2+ ions in groundwater by Ca/SO4 to be equal to 1. However, the proportion of Ca/SO4 in the high-temperature sample is less than 1, which is also less than that of the low-temperature and high-temperature groundwater (Figure 6b). Combined with the significantly low content of Mg2+ in high-temperature geothermal water, it is speculated that the reason may be the precipitate of carbonate, dolomite and other minerals that leads to the significant decrease in Ca ion concentration. This prediction is consistent with the carbonate precipitation and alteration phenomenon of geothermal water in hot fields. The Eh values of high-temperature groundwater (−8.69–243 mV) are all negative, indicating that the groundwater is in a reducing environment, which is conducive to the transformation of SO42− into H2S by sulfate-reducing bacteria [27]:
2 C H 2 O + S O 4 2 H 2 S + 2 H C O 3
The organic carbon (CH2O) contained in organic matter is oxidized by HCO3 and SO42−, and the H2S generated via reduction does not appear in large quantities in this study area, mainly because H2S will be further oxidized and combined with the Fe in the formation to produce iron sulfide minerals (FeS, FeS2, etc.) or other sulfide minerals, or to organic sulfur forms that bind to organic matter [28,29].
The concentration of F in high-temperature groundwater is high (4.59–10.4 mg/L, with an average of 8.06 ± 0.36 mg/L), which may be related to the contact with fluorine-containing minerals in the process of groundwater migration (Figure 5 and Figure 6) such as fluorapatite, fluorite, phlogopite and so on. In addition, carbonate precipitation in high-temperature geothermal water can reduce Ca2+ concentration, increase fluorite dissolution and produce fluorine enrichment [30]. Combined with the significantly high content of SO42−, F and H2SiO3 (average value of 67.04 ± 3.63 mg/L) in the abovementioned high-temperature groundwater (Figure 5 and Figure 6), previous studies believe that the emergence of SO42− is formed by deep H2S dissolved water, and the emergence of F is caused by the influence of magma or hydrothermal fluid on hot water. Furthermore, H2SiO3 is generally believed to be related to SiO2 during magmatic migration. All of the above indicate that the formation of geothermal water is related to hydrothermal activity caused by deep magmatic source.
For the highest concentrations of Na+, the main source of Na/K-silicate minerals (albite and potash feldspar) in high-temperature groundwater may be the dissolution of Na/K-silicate minerals [21]:
2 N a A l S i 3 O 8 + 3 H 2 O + 2 C O 2 A l 2 ( S i 2 O 5 ) ( O H ) 4 + 4 S i O 2 + 2 N a + + 2 H C O 3
2 K A l S i 3 O 8 + 3 H 2 O + 2 C O 2 A l 2 ( S i 2 O 5 ) ( O H ) 4 + 4 S i O 2 + 2 K + + 2 H C O 3
The ratio of (Na+K)/HCO3 in low-temperature water ranged from 0.20 to 3.16 mmol:mmol and fluctuated around 1 mmol:mmol, indicating that the dissolution of albite and potassium feldspar contributed significantly to HCO3. The (Na + K)/HCO3 ratio (4.86–24.34 mmol:mmol) of high-temperature groundwater well above 1 is another evidence for the recrystallization of the carbonate mentioned above (Figure 7a). The regression analysis of Na+ and Cl of all groundwater samples shows that the slope of Na+/Cl = 4.38 (Figure 7b). The results indicate that the chloride ions contributed less to the geothermal water by locally retained saline or magma, because it is generally believed that magma can provide a large amount of chloride ions, and the dissolution of chlorine-containing minerals may be the main source of Cl [18]. In addition, the linear fitting of groundwater sample also explains the mixed interaction between geothermal high-temperature water and shallow cold water.

4.2. Source of Supply

The hydrogen and oxygen isotope characteristics of groundwater can be used to judge the origin of groundwater, determine the recharge conditions of groundwater, the relationship between atmospheric precipitation and surface water and groundwater, and understand the circulation path of groundwater [22,31,32,33]. The mean δ2Hvsmow values of low-, medium- and high-temperature groundwater in the region showed a decreasing trend: −77.39 ± 1.05‰ > −83.06 ± 0.86‰ > −86.99 ± 0.8‰. The mean δ18Ovsmow distribution of groundwater at low, medium and high temperature gradually decreased: −10.31 ± 0.15‰ > −11.06 ± 0.11‰ > −11.55 ± 0.1‰.
A hydrogen and oxygen isotope fitting curve of the geothermal fluid in the area shows that δ2H = 8.20δ18O + 7.83, which is parallel to the global atmospheric precipitation line obtained by the International Atomic Energy: δ2H = 8.17δ18O + 10.56 [34]. In addition, hydrogen and oxygen isotopes (δ18Ovsmow = −7.3 ‰, δ2Hvsmow = −52.9 ‰) of local meteoric water samples fall on the groundwater fitting curve (Figure 8), indicating that local groundwater is the main source of meteoric water [31]. The origin of atmospheric precipitation is also verified by the gas composition contained in geothermal fluids. According to the preliminary investigation of geothermal resources, N2 (97–99%) is the main gas escaping from aquifers in Houhaoyao and Xijiabao geothermal fields in Zhangjiakou, with a small amount of O2 (1–3%), indicating the close relationship between geothermal fluids and atmospheric precipitation.
The variation of δ2Hvsmow in groundwater mainly depends on recharge temperature and elevation, except for a few cases affected by the mixing mechanism. The variation of δ18Ovsmow value is due to the isotope exchange between water and rocks (such as oxygen-bearing rocks, limestones and silicates) during the process of water–rock interaction [8,35]. The samples of high-temperature groundwater and low-temperature groundwater fell in the same straight line, and did not show the phenomenon of “oxygen drift”, indicating that the proportion of groundwater that had strong water–rock interaction with oxygen-bearing surrounding rock and was laterally fed from a long distance through underground runoff was very low [36] (Figure 8). The phenomenon of “oxygen drift” is common in the hot water of high-temperature geothermal fields, which may also indicate that the heat storage temperature is not high, isotope exchange in water and rock is limited, or the surrounding rock itself is not high in 18O content [27]. The δ2Hvsmow and δ18Ovsmow of low-temperature groundwater are relatively more enriched than those of high-temperature groundwater samples, which indicates that the hot water is not derived from the meteoric precipitation similar to the shallow cold water, but from the meteoric precipitation with a higher elevation.
The higher the elevation, the lower the temperature and the smaller the δ2Hvsmow and δ18Ovsmow [32]. The medium-temperature groundwater sample is in the middle of the linear fitting curve due to the mixing between high-temperature and low-temperature groundwater (Figure 8). In addition, the reservoir samples in surface water (δ2Hvsmow = −37.57 ± 0.35 ‰, δ18Ovsmow = −3.33 ± 0.09 ‰) show that the stable isotopes of hydrogen and oxygen are affected by evaporation. Fluvial samples (δ2Hvsmow = −57.2 ‰, δ18Ovsmow = −7.1 ‰) were distributed between precipitation and groundwater, but deviated from the right of the fitting curve, suggesting that the fluvial samples were affected by both mixing and evaporation with groundwater.
The 87Sr/86Sr values of surface water and shallow groundwater in the area are higher (>0.710), and the difference is small, indicating that the strontium isotope of surface water is controlled by terrigenous clastic karst solution, and regional homogenization occurs (Figure 9). 87Sr/86Sr in the geothermal fluids of Houhaoyao and Xijiabao geothermal fields increased from north to south (<0.710), and the strontium isotope compositions of different hot spring areas were significantly different, indicating that geothermal water circulation paths of different geothermal systems were different from that of shallow groundwater. Therefore, the difference of strontium isotope composition in hot water reflects the difference in the mixing degree with shallow groundwater.

4.3. Supply Elevation Estimation

As the elevation increases, the temperature decreases and water vapor condenses continuously to produce precipitation. Isotope fractionation results in isotope dilution during the rising process of the cloud cluster, forming an elevation effect [37]. The recharge elevation can be inferred from the hydrogen and oxygen isotopes of groundwater:
H = δ G δ P k + h
where δ G : δ18O in samples; δ P : δ18O in meteoric precipitation, δ18Ovsmow = −7.3 ‰; k: elevation gradient of δ18O in precipitation, −2.076‰/100 m; h: sampling point elevation (m).
The recharge elevation range of the high-temperature groundwater is 1580–2305 m, which is basically consistent with the heights of the mountainous areas in the northwest and southeast of the geothermal field. It is speculated that the geothermal water recharge originates from the mountainous areas in the northwest and southeast of the study area, and circulates to the crust along the deep faults, forming shallow geothermal anomalies in the hot field. The recharge elevation of high-temperature groundwater is slightly larger than the corresponding range of low-temperature groundwater recharge elevation (1545–2197 m, 1291–2160 m). However, it is worth noting that in the analysis of geothermal water recharge area, the age of local geothermal water needs to be further analyzed [27].
The correction coefficients were calculated by comparing Pearson isotope mixing model with the matrix exchange model (Fontes–Garnier model) [38]:
q = δ 13 C D I C δ 13 C c a r b δ 13 C s o i l ε 13 C D I C C O 2 δ 13 C c a r b
q = m D I C m e a s m D I C c a r d + m D I C C O 2 e x c h m D I C m e a s
where δ 13 C D I C : 13C in groundwater; δ 13 C s o i l : 13C of CO2 in soil, −23‰; δ 13 C c a r b : 13C in calcite, 0‰; ε 13 C D I C C O 2 : enrichment coefficient between inorganic carbon and soil CO2.
The shallow groundwater (cold water) is generally younger than 1000 a B.P. The geothermal water with higher temperature is generally older than 8354 A B.P (Figure 10). The groundwater in geothermal wells in the northwest is obviously older than that in the southeast. The results indicate that the deep underground hot water migrated from northwest to southeast after upwelling near the surface and mixed with shallow groundwater during the migration process.

4.4. Thermal Reservoir Equilibrium State and Thermal Reservoir Temperature Estimation

Cationic temperature scale and SiO2 temperature scale are commonly used to estimate the heat storage temperature [31]. The Na-K-Mg ternary diagram can provide the correlation between the Na-K temperature scale and K-Mg temperature scale of geothermal water. The information about the equilibrium state between geothermal water and mineral sets including albitite, potash feldspar, muscovite and plagioclase is integrated [39]. Therefore, this study uses Na-K-Mg ternary diagram to judge the water–rock equilibrium state of the water sample. If the water sample is in the immature region, it is not suitable to estimate the heat storage temperature via a cationic temperature scale. Based on the physical and chemical characteristics of water samples in a complete equilibrium region and partial equilibrium region, the cationic temperature scale is a reasonable choice.
All the low-temperature groundwater and most of the medium-temperature groundwater are in the immature zone, only the high-temperature groundwater with temperatures greater than 45 °C and some medium-temperature groundwater samples are in the partial mature zone (Figure 11), so the cationic temperature scale can be used. In this study, a K-Mg geothermal temperature scale is used, because it has a high estimation effect on heat storage temperature >150 °C [40]:
t K M g = 4410 14 l g ( K 2 / M g ) 273.15
where t: temperature; K, Mg: ion mass concentration, mg/L.
The heat storage temperature of the high-temperature geothermal fluid in the mature water area is about 65.30–104.96 °C, with an average of 78.83 °C. The immature water may be disturbed by the interaction of cold water mixing during the rising process, which destroys the original mineral equilibrium state.
Quartz sandstone, feldspar quartz sandstone and shale are distributed in the area, and chalcedonization occurs under the action of hydrothermal alteration. Therefore, the thermal storage temperature of geothermal water is estimated by using a SiO2 geothermal temperature scale [41]:
t S i O 2 = 1309 5.19 lg S i O 2 273.15
where t: thermal storage temperature; SiO2: mass concentration of dissolved SiO2, mg/L.
The heat storage temperature estimated using the SiO2 temperature scale is 82.19–121.30 °C, with an average value of 102.22 °C, and is slightly higher than the estimated value of the K-Mg geothermal temperature scale.

4.5. Estimation of Geothermal Water Circulation Depth

In the north and east of the later Haoyao and Xijiabao hot fields, there exists a huge thickness of the upper Jurassic Zhangjiakou Formation (J3z) fused tuff, which formed on the fold-hardened basement in the late Mesozoic era with strong faulting activity, forming the basement of the basin, which may have a certain relationship with the formation of hot water. Each group of fault structures is developed in this area. Some deep and large faults cut deep into the upper mantle, extend far, and have the characteristics of multi-period activity. They form a group of fracture zones with equal strike, which are good channels for connecting the upper mantle and various rocks. Through the carrier of water, the magmatic waste heat upwelled along the fracture zone and diffused along the connected faults, forming geothermal anomaly areas in the relatively closed area.
The following equation is used to estimate the circulation depth of geothermal water [42]:
H = K × t r t c + h
where H is the groundwater circulation depth (m); K is the low temperature gradient, at 2.5 °C/100 m; tr is thermal storage temperature, whereby the mean values of the above two methods are selected 90.53 °C; tc is the perennial mean temperature in the recharge area, at 9.6 °C; and h is the depth of the thermostatic zone, at 25 m.
The circulating depth of geothermal fluid in two geothermal fields can reach more than 3200 m. The depth of geothermal fluid circulation in this area can be indirectly confirmed by the visible distance of the Guangling–Langshan fault in the south of Retian, which is more than 1500 m [23].

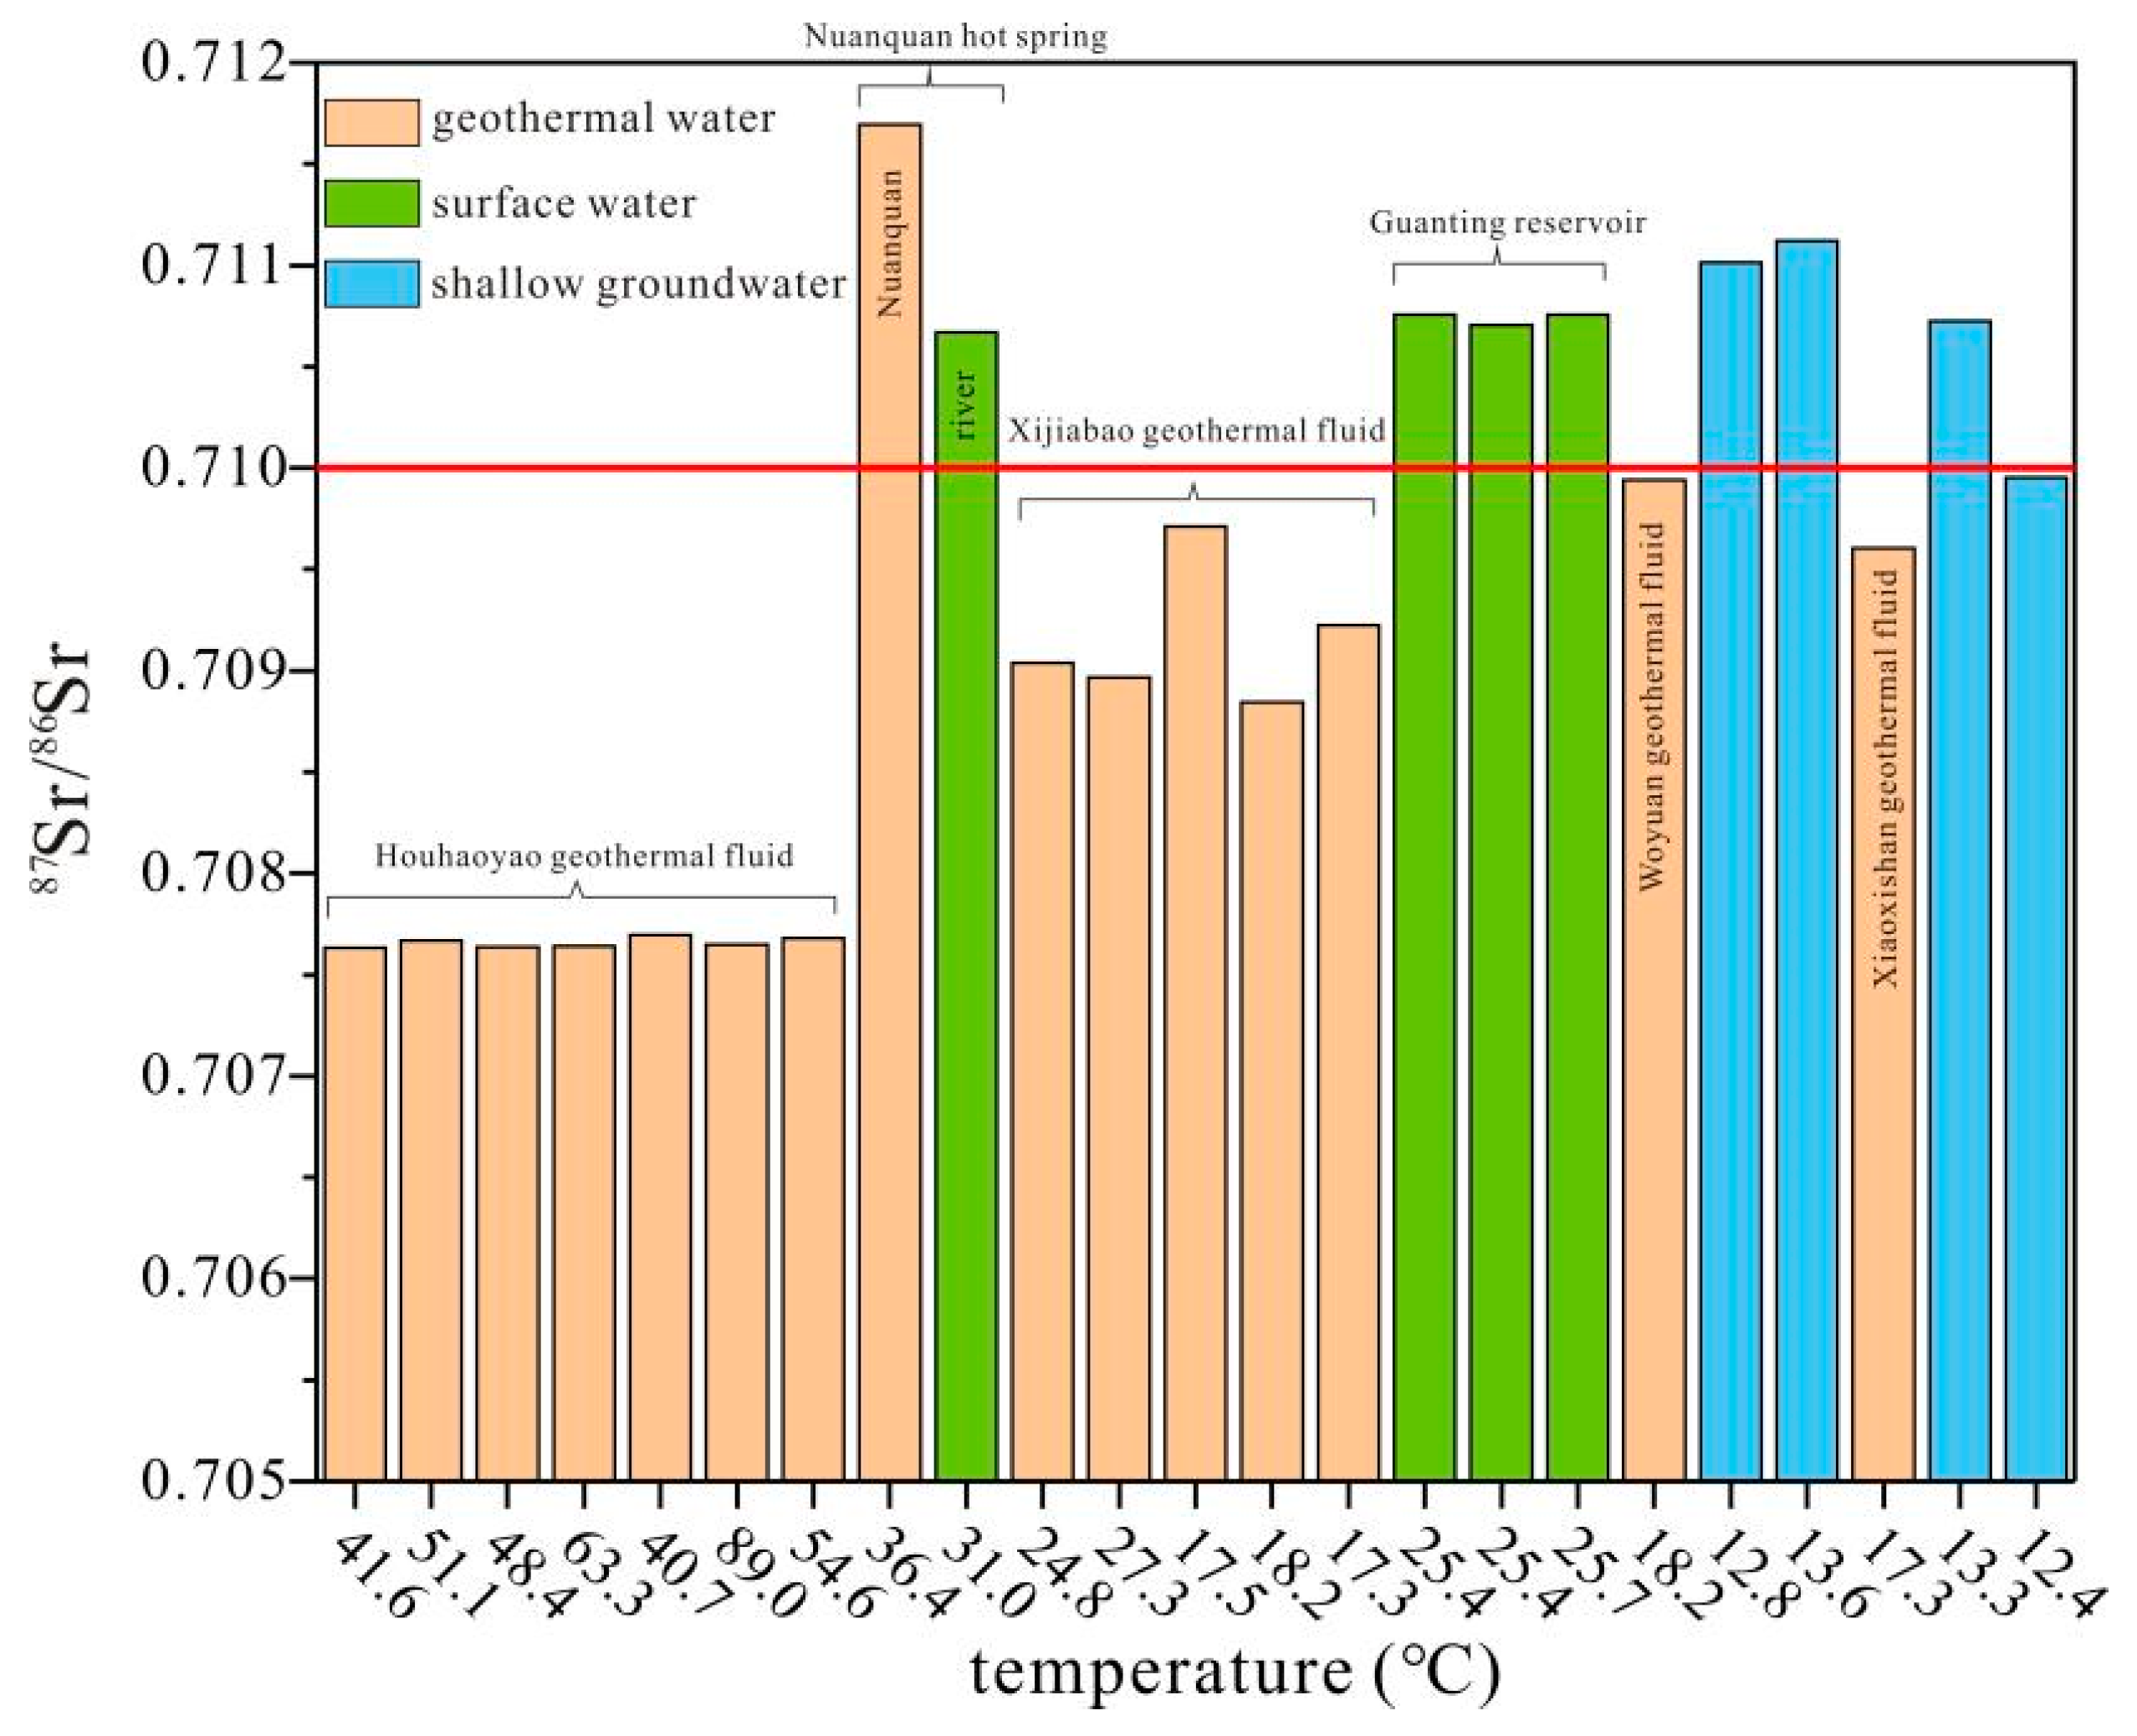
4.6. Indication of Geothermal Origin

Xijiabao and Houhaoyao geothermal fields share the same geothermal geological background: DahaiTuo complex granitic body and the surrounding secondary small rock body were formed in the late Yanshanian magmatic activity. The compound intersection of deep and large faults determines the distribution of geothermal fields (geothermal anomaly areas and points). The derived sub-fault structure controls the morphological characteristics of geothermal fields (geothermal anomaly areas and points). Magmatic activity determines the temperature at which groundwater hot water is produced. The neotectonic movement promoted the emergence of hot water.
Meteoric water infiltrates underground and the fault structure is the main channel connecting the deep heat source and water source. In the deep circulation process of geothermal fluids, the fluid receives heat conduction and accumulation from heat flow deep underground and continuously upwells from a reduction environment to bedrock fissure heat storage in a shallow oxidation environment, either through a thermal fracture zone or rock mass contact zone. Gypsum dissolution or H2S oxidation from a deep magma source results in a high content of SO42− in geothermal fluids. In the process of migration, some of the thermal fluids well up and connect with the shallow aquifer, forming a recharge to the quaternary pore aquifer, then disperse, mix and interact with the shallow cold water, eventually leading to a temperature rise in the Cenozoic pore aquifer within a certain range alongside the formation of shallow pore heat reservoir. The changes in temperature gradient, ion concentration and REDOX conditions are accompanied by the dissolution of feldspar and the precipitation of carbonate and dolomite (Figure 12). Therefore, the fluid chemical characteristics of middle–low-temperature geothermal fields reflect the environmental formation and development of geothermal resources to a certain extent.

5. Conclusions

Based on the sample collection and analysis of the typical geothermal field’s thermal fluid, regional background groundwater and surface water in the coupled basin in the Yanshan orogenic belt, the hydrochemical characteristics and genetic mechanism of the uplifted mountain belt’s thermal storage geothermal system are identified. The results of the geothermal chemical temperature scale show that the storage temperature is between 82 and 121.30 °C, and the depth of geothermal water circulation is more than 3200 m. The main source of geothermal fluid is atmospheric precipitation. The hydrochemical characteristics of geothermal fluids indicate that, in the process of deep circulation, atmospheric precipitation receives heat conduction and accumulation from the ground’s heat flow in deep formation, and then flows into the bedrock fissure heat reservoir through the thermal fracture zone or the rock mass contact zone, and finally receives conduction and convection heat accumulation during migration. Some hot water upwelling is connected with the shallow aquifer, mixes with cold water, and carries out heat exchange, forming a shallow-pore-type heat storage. In the bedrock bulge area, due to the high thermal conductivity, the heat is absorbed via the thermal refraction effect. The research results can provide basic support and services for the exploitation and utilization of local geothermal resources.

Author Contributions

Conceptualization, J.L.; Methodology, W.Y. and Y.X.; Data curation, M.W.; Resources, M.W.; Writing—original draft, W.Y. and Y.X.; Writing—review & editing, Y.X., X.G., J.G. and Y.Z.; Project administration, C.Z. All authors have read and agreed to the published version of the manuscript.

Funding

This work was jointly supported by the National Natural Science Foundation of China (grant numbers: 42102289), Shanxi Key Laboratory for Exploration and Exploitation of Geothermal Resources (grant numbers: SX202204) and the Key Laboratory of Shallow Geothermal Energy, Ministry of Natural Resources of the People’s Republic of China (grant numbers: KLSGE202302-04).

Data Availability Statement

The data that support the findings of this study are available from the corresponding author, upon reasonable request.

Conflicts of Interest

Authors Meihua Wei and Changsheng Zhang were employed by Shanxi Geological Engineering Exploration Insitute Co., Ltd. The remaining authors declare that the research was conducted in the absence of any commercial or financial relationships that could be construed as a potential conflict of interest.

References

  1. Kong, Y.; Pang, Z.; Shao, H.; Kolditz, O. Optimization of Well-Doublet Placement in Geothermal Reservoirs Using Numerical Simulation and Economic Analysis. Environ. Earth Sci. 2017, 76, 118. [Google Scholar] [CrossRef]
  2. Wang, G.; Zhang, W.; Liang, J.; Lin, W.; Liu, Z.; Wang, W. Evaluation of Geothermal Resources Potential in China. Acta Geosci. Sinica 2017, 38, 449–459. [Google Scholar] [CrossRef]
  3. Mallapaty, S. How China Could Be Carbon Neutral by Mid-century. Nature 2020, 586, 482–483. [Google Scholar] [CrossRef]
  4. Hu, Z.; Xu, T.; Feng, B.; Yuan, Y.; Li, F.; Feng, G.; Jiang, Z. Thermal and Fluid Processes in a Closed-Loop Geothermal System Using CO2 as a Working Fluid. Renew. Energ. 2020, 154, 351–367. [Google Scholar] [CrossRef]
  5. Yuan, W.; Zhang, D.; Zhang, Y.; Gao, J.; Liu, T.; Zhai, H.; Jin, G.; Wang, G.; Zhang, B. Performance of MultiWell Exploitation and Reinjection in a Small-Scale Shallow Geothermal Reservoir in Huailai County. Front. Earth Sci. 2021, 9, 786389. [Google Scholar] [CrossRef]
  6. Yuan, W.; Lei, X.; Liu, T.; Wang, S.; Xing, Y.; Zhu, R.; Yang, F.; Zhang, D.; Gao, J.; Zhang, B. Mechanism and Prediction of Geothermal Resources Controlled by Neotectonics in Mountainous Areas: A Case Study of Southeastern Zhangjiakou City, China. Front. Earth Sci. 2022, 10, 787156. [Google Scholar] [CrossRef]
  7. Liu, M.; He, T.; Wu, Q.; Guo, Q. Hydrogeochemistry of Geothermal Waters from Xiongan New Area and Its Indicating Significance. Earth Sci. 2020, 45, 2221–2233. Available online: https://kns.cnki.net/kcms/detail/42.1874.P.20191113.164.002.html (accessed on 4 October 2023).
  8. Zhao, J.; Zhang, W.; Ma, F.; Zhu, X.; Zhang, H.; Wang, G. Geochemical characteristics of the geothermal fluid in the Rongcheng geothermal field, Xiong’an New Area. Acta Geol. Sin. 2020, 94, 1991–2001. [Google Scholar] [CrossRef]
  9. Moore, J.P.; Walsh, J.J. Quantitative Analysis of Cenozoic Faults and Fractures and Their Impact on Groundwater Flow in the Bedrock Aquifers of Ireland. Hydrogeol. J. 2021, 29, 2613–2632. [Google Scholar] [CrossRef]
  10. Xing, Y.; Wang, H.; Li, J.; Teng, Y.; Zhang, B.; Li, Y.; Wang, G. Chemical field characteristics of geothermal water in Xiong’an New Area, and analysis on the influencing factors. Geol. China 2022, 49, 1711–1722. Available online: http://kns.cnki.net/kcms/detail/11.1167.P.20211026.1819.002.html (accessed on 4 October 2023).
  11. Zhai, Y.; Wang, J.; Teng, Y.; Zuo, R. Hydrogeochemical and isotopic evidence of groundwater evolution and recharge in aquifers in Beijing Plain, China. Environ. Earth Sci. 2013, 69, 2167–2177. [Google Scholar] [CrossRef]
  12. Vaselli, O.; Higueras, P.; Nisi, B.; María Esbrí, J.; Cabassi, J.; Martínez-Coronado, A.; Tassi, F.; Rappuoli, D. Distribution of Gaseous Hg in the Mercury Mining District of Mt. Amiata (Central Italy): A Geochemical Survey Prior the Reclamation Project. Environ. Res. 2013, 125, 179–187. [Google Scholar] [CrossRef]
  13. Hanson, M.C.; Oze, C.; Horton, T.W. Identifying Blind Geothermal Systems with Soil CO2 Surveys. Appl. Geochem. 2014, 50, 106–114. [Google Scholar] [CrossRef]
  14. Pinti, D.L.; Castro, M.C.; Lopez-Hernandez, A.; Han, G.; Shouakar-Stash, O.; Hall, C.M.; Ramírez-Montes, M. Fluid circulation and reservoir conditions of the los humeros geothermal field (lhgf), mexico, as revealed by a noble gas survey. J. Volcanol. Geotherm. Res. 2017, 333, 104–115. [Google Scholar] [CrossRef]
  15. Rodríguez, F.; Pérez, N.M.; Melián, G.V.; Padrón, E.; Hernández, P.A.; Asensio-Ramos, M.; Padilla, G.D.; Barrancos, J.; D’Auria, L. Exploration of Deep-Seated Geothermal Reservoirs in the Canary Islands by Means of Soil CO2 Degassing Surveys. Renew. Energ. 2021, 164, 1017–1028. [Google Scholar] [CrossRef]
  16. Tian, J.; Pang, Z.; Guo, Q.; Wang, Y.; Li, J.; Huang, T.; Kong, Y. Geochemistry of geothermal fluids with implications on the sources of water and heat recharge to the Rekeng high-temperature geothermal system in the Eastern Himalayan Syntax. Geothermics 2018, 74, 92–105. [Google Scholar] [CrossRef]
  17. Das, P.; Maya, K.; Padmalal, D. Hydrochemistry, geothermometry and origin of the low temperature thermal springs of South Konkan region, India. Geothermics 2021, 90, 101997. [Google Scholar] [CrossRef]
  18. Zheng, S.; Zhang, Z.; Ni, B.; Hou, F.; Shen, M. Hydrogen and Oxygen Isotopic Studies of Thermal Waters in Xizang. Acta Sci. Nat. Univ. Pekin. 1982, 1, 99–106. [Google Scholar] [CrossRef]
  19. Shi, M.; Zhang, J.; Yin, X.; Yang, N.; Jiang, H. Hydrochemistry characteristic analysis of low- medium temperature convective geothermal resources in Jiaodong Peninsula. Acta Geol. Sin. 2019, 93, 138–148. [Google Scholar] [CrossRef]
  20. Zhang, L.; Ding, H.; Zhang, J.; Wang, Y.; Tian, L. Hydrochemistry and environmental isotopic characteristics and formation ages analysis of geothermal fluids in Gansu Province. Arid. Land Geogr. 2020, 43, 1496–1504. [Google Scholar]
  21. Song, M.; Gong, L.; Wang, X.; Meng, S.; Lv, L.; Liu, Y. Study on chemical characteristics and scale corrosion of geothermal water in fuping county. Geol. Rev. 2020, 66, 146–148. [Google Scholar] [CrossRef]
  22. Xing, Y.; Yu, H.; Liu, Z.; Li, J.; Liu, S.; Han, S.; Wang, G. Study on ChemicalGenesis of Deep Geothermal Fluid in Gaoyang Geothermal Field. Front. Earth Sci. 2022, 9, 787222. [Google Scholar] [CrossRef]
  23. Wei, H. A Discussion on Geothermal Resource in Zhangjiakou. Coal Geol. China 2006, 4, 38–41. [Google Scholar]
  24. Wang, W.; Li, G.; Li, H.; Hou, J.; Fang, W.; Yang, F. Hydrogeochemical characteristics and origin of the geothermal fluid in Tangquan area, Hebei Province. Geol. China 2013, 40, 1935–1941. [Google Scholar]
  25. Qi, B.S.; Feng, C.J.; Tan, C.X.; Zhang, P.; Meng, J. Application of comprehensive geophysical-drilling exploration to detect the buried North Boundary active Fault Belt of Yanqing-Fanshan Basin in Sangyuan Town, Beijing-Zhangjiakou area. Geol. China 2019, 46, 468–481. [Google Scholar] [CrossRef]
  26. André, L.; Manceau, J.C.; Bourbon, P.; Wuilleumier, A. Cyclic variations of sulfate and boron concentrations and isotopes in deep groundwaters in the Aquitaine Basin, France. Appl. Geochem. 2020, 123, 104818. [Google Scholar] [CrossRef]
  27. Lin, Y.; Gao, L.; Li, S.; Wang, Z.; Ye, Z.; Chen, J.; Yang, Z. Hydrogeochemical characteristics and source identification of geothermal waters in Jiangmen, Guangdong Province. Environ. Chem. 2020, 39, 512–523. Available online: https://kns.cnki.net/kcms/detail/11.1844.x.20200327.1040.052.html (accessed on 10 October 2023).
  28. Seal, R.R. Sulfur Isotope Geochemistry of Sulfide Minerals. Rev. Mineral. Geochem. 2006, 61, 633–677. [Google Scholar] [CrossRef]
  29. Olivier, B.; Lorine, B.; Alexis, D.; Julien, F.; Mathieu, P.; Thierry, L.; Eliot, C.; Nicolas, L.; Christophe, P.; Benjamin, W.; et al. Iron-oxidizer hotspots formed by intermittent oxic–anoxic fluid mixing in fractured rocks. Nat. Geosci. 2020, 13, 149–155. [Google Scholar] [CrossRef]
  30. Alekseyev, V.A.; Kochnova, L.N.; Cherkasova, E.V.; Tyutyunnik, O.A. Possible reasons for elevated fluorine concentrations in groundwaters of carbonate rocks. Geochem. Int. 2010, 48, 68–82. [Google Scholar] [CrossRef]
  31. Li, C.; Chen, Z.; Wang, G.; Jin, T.; Li, Y.; Luo, T.; Mao, T. Geochemical Characteristics and Origin of Geothermal Water in Southeastern Guizhou, China. Bull. Mineral. Petrol. Geochem. 2020, 39, 614–625. [Google Scholar] [CrossRef]
  32. Zhao, J. Study on the Spatial Structure of Deep Thermal Storage and the Process of Hydrothermal Differentiation in Xiong’an New Area. Ph.D. Thesis, Chinese Academy of Geological Sciences, Beijing, China, 2020. [Google Scholar]
  33. Liu, C.; Wang, W.; Zhang, G.; Zhu, H.; Wang, J.; Guo, Y. Hydrochemical and Isotope (18O, 2H and 3H) Characteristics of Karst Water in Central Shandong Province: A Case Study of the Pingyi-Feixian Region. Minerals 2022, 12, 154. [Google Scholar] [CrossRef]
  34. Zheng, S.; Hou, F.; Ni, B. Hydrogen and Oxygen Isotopic Studies of Atmospheric Precipitation in Our Country. Chin. Sci. Bull. 1983, 13, 801–806. [Google Scholar]
  35. Ni, G.; Zhang, H.; Wei, Y.; Hu, Y. Hydrogeochemical and Isotope Characteristics of Geothermal Fluid in Sichuan. Adv. New Renew. Energy 2016, 4, 184–194. Available online: https://kns.cnki.net/kcms/detail/44.1698.tk.20160623.1636.020.html (accessed on 15 October 2023).
  36. Zhang, B.; Xu, J.; Ma, Z.; Shen, Z.; Qi, L. Analysis on groundwater supply sources using hydrogen and oxygen isotope data—A case study of Yanggu-Qihe salient, northwestern Shandong, China. Geol. Bull. China 2010, 29, 603–609. [Google Scholar]
  37. Chen, L. Isotopic characteristic Analysis of Hydrogen—Oxygen Environment in Geothermal Water in Fujian Province. Geol. Fujian 2019, 38, 61–68. [Google Scholar]
  38. Clark Ian, D.; Peter, F. Environmental Isotopes in Hydrogeology; CRC Press: Boca Raton, FL, USA, 1997. [Google Scholar] [CrossRef]
  39. Giggenbach, W.F. Geothermal solute equilibria. Derivation of Na-K-Mg-Ca geoindicators. Geochim. Et Cosmochim. Acta 1988, 52, 2749–2765. [Google Scholar] [CrossRef]
  40. Wang, J.; Qiu, N. Methods on studies of paleogeotemperature on sedimentary basins with oil and gas. Prog. Geophys. 1992, 4, 46–62. [Google Scholar]
  41. Pirlo, M.C. Hydrogeochemistry and geothermometry of thermal groundwaters from the Birdsville Track Ridge, Great Artesian Basin, South Australia. Geothermics 2004, 33, 743–774. [Google Scholar] [CrossRef]
  42. Zhang, B. Hydrogeochemical Characteristics and Formation Conditions of the Geothermal Water in Northwestern Shandong Province. Ph.D. Thesis, China University of Geosciences, Beijing, China, 2011. [Google Scholar]
Figure 1. Location of the study area.
Water 16 00433 g001
Figure 2. Location of geothermal fields and distribution of sampling points.
Water 16 00433 g002
Figure 3. Schoeller diagram (a) and Piper trine diagram (b) of geothermal fluid samples in the area.
Water 16 00433 g003
Figure 4. Langelier–Ludwig diagram of geothermal fluid and surrounding water bodies.
Water 16 00433 g004
Figure 5. Box distribution of main hydrochemical components of geothermal fluid and surface water (lowercase letters indicating significant differences, and outliers were marked with ‘+’ symbols).
Water 16 00433 g005
Figure 6. Distribution of Ca/(Ca+Mg) vs. HCO3/(HCO3+SO4) ((a) mineral dissolution indicator for major ions source) and Ca2+ vs. SO42− ((b) source proxy for sulfate gypsum dissolution) of geothermal fluids.
Water 16 00433 g006
Figure 7. Distributions of Na+K vs. HCO3 ((a) indicating the contribution of albite and potassium feldspar dissolution to HCO3) and Na vs. Cl ((b) the chloride ions source apportionment proxy in geothermal water) of geothermal fluids.
Water 16 00433 g007
Figure 8. Distribution of δ2H vs. δ18O of geothermal fluids.
Water 16 00433 g008
Figure 9. Comparison of 87Sr/86Sr of geothermal fluid, surface water and shallow groundwater.
Water 16 00433 g009
Figure 10. Age comparison of geothermal fluid, surface water and shallow groundwater.
Water 16 00433 g010
Figure 11. The Giggenbach ternary Na-K-Mg diagram of water samples in the study area (worldwide used tool for geothermal solute equilibria, and in orders to be applicable for a wide range of salinity and relative concentrations, cations are expressed as Na/1000, K/100 and Mg0.5).
Water 16 00433 g011
Figure 12. Schematic diagram of chemical genesis model of thermal fluid in geothermal field.
Water 16 00433 g012
Table 1. Main water quality index and test method of geothermal fluids.
Serial NumberTest IndexUnitTest SiteTest Method (Instrument)
1pHNoneFieldPortable Multi-parameter Fast Water Quality Analyzer (HANNA-HI9828, Melrose, MA, USA)
2TDSmg/LFieldPortable Multi-parameter Fast Water Quality Analyzer
3CODmg/LFieldPortable Multi-parameter Fast Water Quality Analyzer
4Total hardnessmg/LFieldPortable Multi-parameter Fast Water Quality Analyzer
5Ca2+mg/LIndoorInductively Coupled Plasma Emission Spectrometer
(ICP-AES, Waltham, MA, USA)
6K+mg/LIndoorInductively Coupled Plasma Emission Spectrometer
7Na+mg/LIndoorInductively Coupled Plasma Emission Spectrometer
8Mg2+mg/LIndoorInductively Coupled Plasma Emission Spectrometer
9SO42−mg/LIndoorIon Chromatograph
(ICP-1000, Waltham, MA, USA)
10HCO3mg/LIndoorIon Chromatograph
11Clmg/LIndoorIon Chromatograph
12NH4+mg/LIndoorIon Chromatograph
13Femg/LIndoorInductively Coupled Plasma Emission Spectrometer Method (ICP-AES, Waltham, MA, USA)
14Mnmg/LIndoorInductively Coupled Plasma Mass Spectrometry
(ICP-MS, Waltham, MA, USA)
15Cumg/LIndoorInductively Coupled Plasma Mass Spectrometry
16Znmg/LIndoorInductively Coupled Plasma Mass Spectrometry
17NO3mg/LIndoorIon Chromatograph
(ICP-1000, Waltham, MA, USA)
18NO2mg/LIndoorIon Chromatograph
19Fmg/LIndoorIon Chromatograph
20Pbmg/LIndoorInductively Coupled Plasma Mass Spectrometry
21Asmg/LIndoorInductively Coupled Plasma Mass Spectrometry
Disclaimer/Publisher’s Note: The statements, opinions and data contained in all publications are solely those of the individual author(s) and contributor(s) and not of MDPI and/or the editor(s). MDPI and/or the editor(s) disclaim responsibility for any injury to people or property resulting from any ideas, methods, instructions or products referred to in the content.

