Article

Differential Impacts of Road De-icers on Freshwater Bacterial Communities

1
Department of Biology, Queen’s University, Kingston, ON K7L 3N6, Canada
2
School of Environmental Studies, Queen’s University, Kingston, ON K7L 3N6, Canada
*
Authors to whom correspondence should be addressed.
Water 2024, 16(3), 426; https://doi.org/10.3390/w16030426
Submission received: 30 December 2023 / Revised: 23 January 2024 / Accepted: 25 January 2024 / Published: 28 January 2024
(This article belongs to the Special Issue Aquatic Ecotoxicology and Environmental Contamination)

Abstract

:
Concern about salt levels in freshwater habitats receiving road de-icer runoff has inspired the development of “eco-friendly” formulations that are intended to be less toxic to aquatic organisms, but few experiments have determined that these products are environmentally benign. Mesocosms containing lake water were established for 6 weeks to compare traditional road salt with two newer de-icers, one an inorganic mixture of chloride salts and the second of beet extract and brine. Amplicon sequencing and algal blocking sequences facilitated the identification of differentially impacted bacterial taxa. Ironically, although there was only a minor effect on bacterial structure at high road-salt concentrations, there was an increased relative abundance of salt-resistant genera in the mixed-salt formulation. After amendment with the beet brine de-icer, there was a turnover of taxa coincident with a 68-fold decrease in dissolved oxygen, with decreased diversity and displacement by anaerobic genera indicating a shift across a threshold to a new, apparently stable state, suggesting mesocosm recovery was unlikely. Overall, although we applaud the sentiment behind the formulation of less-damaging “eco-friendly” de-icers, they appear to have more negative environmental impacts than the traditional road salt that they were made to replace.

Graphical Abstract

1. Introduction

Traditionally, salt has been prized for preserving and tanning and for facilitating the chemical revolution with the production of bleach, alkali, and batteries. Indeed, salt was so valued that it precipitated social unrest for centuries, including the Italian state salt war, the Moscow salt riot, the British salt tax, and the Indian salt march. In contrast, today’s cheap and abundant salt supplies mean that only considering Canada and the USA, ~25 million tonnes are cast yearly on roads and similar infrastructure to serve as temporary de-icers [1,2]. Salt (NaCl) applications to improve winter transportation safety started in the 1940s, but in the last three decades concerns about the environmental costs have mounted since chloride brine disrupts roadside vegetation, pollutes ground water and aquatic ecosystems, as well as impacts biodiversity, food webs, and trophic interactions [3,4,5,6,7]. In turn, governments have issued freshwater guidelines for chloride pollution with limits set at 120 and 230 mg/L for chronic toxicity levels in Canada and the USA, respectively, with the corresponding levels for acute toxicity at 640 and 860 mg/L [8,9]. To address these concerns and reduce chloride pollution, NaCl has been mixed with chlorides of calcium and magnesium, as well as organics, such as the products from sugar beet refining. Although the effects of these “green” or commercially claimed “eco-friendly” de-icer alternatives have been used for toxicity tests on aquatic species, e.g., [10,11], little has been done to compare the effects of these formulations to traditional NaCl applications. In addition, investigations into the impact of these de-icers on bacterial communities that form the basis of the aquatic food chain are important. Indeed, such experiments are timely prior to larger-scale deployment of these newer de-icers so as to help mitigate environmental costs and allay public concerns that have long been associated with salt.
As indicated, there are multiple impacts of chloride amendment to aquatic ecosystems [12]. Studies have indicated that cyanobacteria thrive in high salt conditions, but nutrient acquisition decreases in macrophytes, and decreases in denitrification can contribute to eutrophication, together reflecting a change in community composition [13,14,15]. The range of de-icer-mediated effects as well as those associated with agricultural practices and urbanisation, together with their socio-economic consequences, have been termed freshwater-salinization syndrome [16,17]. The limited investigations conducted on the newer commercial de-icers formulated with less NaCl do not allay all concerns, however. For example, an “eco-label” de-icer containing NaCl, MgCl2, CaCl2, and sodium acetate was compared to traditional NaCl road salt. Although the newer product had a similar ice-melting efficacy and was less damaging to concrete, after exposure of the zooplanktonic Daphnia magna, or water flea, for 48 h, NaCl had an LC50 > 4.5 g/L (the concentration at which 50% of the organisms died), but the salt mixture LC50 was a concerning 1.8–3.5 g/L [18]. Similar results were also seen in tests with four different zooplankton species [11]. In contrast, 10 days of exposure to one of three commercial de-icers including NaCl, or “eco-friendly”-labelled de-icer formulations containing NaCl-CaCl2 -MgCl2 or NaCl supplemented with beet juice, resulted in Chironomus dilutus midge larvae LC50s (~6 g/L) that did not significantly differ among salt treatments [10]. Again, when other salt and beet juice de-icer formulations were added to outdoor mesocosms, there was no reduction in mosquito emergence compared to NaCl controls, but the beet juice amendment did show a decrease in dissolved oxygen that was thought to be a potential risk for aquatic organisms [19].
Since global cycles of nutrients as well as the aquatic food web depend on microbial communities, there is an urgency to investigate the impacts of de-icers on these, and to perhaps also resolve conflicting evidence on their effects on different metazoans. Changes in microbiota in soil communities subject to road salt runoff have been noted, including more than a four-fold relative increase in sequences corresponding to halophiles and a more than doubling of those associated with cyanobacteria [20]. Impacts of de-icers on more strictly aquatic bacterial ecosystems are even less studied, but some research suggests that there may not be cause for concern. For example, lake water samples that were amended for two weeks with road snow contaminated with salt in order to mimic snowmelt runoff, showed increases in the relative abundance of only a few taxa that were just minor representatives in unamended controls, most notably Psychrobacter, a cold tolerant genus [21]. Contrary to the latter report, however, anecdotal evidence points to thick biofilm growth in streams from de-icers, with some studies suggesting that such dense blankets could damage aquatic communities [22,23]. Airport de-icers are heterogenous and include organic compounds as well as salts. It has been suggested that degradation of airport de-icers by aquatic heterotrophic bacteria results in depleted oxygen levels contributing to ecosystem dysfunction, and it has been further argued that such studies anticipate an overall negative impact of commercial road de-icers containing organic materials [24].
Accordingly, the overall aim of this research was to compare the effects on the aquatic microbiota of a traditional NaCl de-icer with two newer de-icers, one an inorganic mixture of NaCl, CaCl2 and MgCl2 salts and the second with beet extract added to NaCl brine. Amplicon sequencing paired with blocking sequences corresponding to algal DNA allowed the identification of bacterial-community taxa that were relatively affected by the respective de-icers. In a companion study [25], planktonic invertebrate populations were monitored, enabling a unique opportunity to link de-icers with the food web and aquatic-system functioning. There are consequences to the increasing use of supposedly “eco-friendly” road de-icers, and this research should serve as a cautionary tale.

2. Materials and Methods

2.1. De-Icers

Three de-icers were tested, representing both traditional, as well as two classes of alternative de-icers available in North America [26,27]. Commercial brands were selected so that the research would be directly relevant to the public, but there are some disadvantages due to the lack of preciseness in the stated formulations because of proprietary concerns under the Canadian Hazardous Product Regulations [28]. King Brand™ road salt (hereafter known as road salt, abbreviated as S) is a traditional NaCl (50–100%) de-icer with silica filler (Sika Canada, Pointe-Claire, PQ, Canada). Master Melt™ (hereafter termed mixed inorganic and abbreviated to M) is a mix of salts (~8.5% NaCl, ~16% CaCl2, ~3.5% MgCl2, ~72% water) (Pollard Highway Products, Harrow, ON, Canada) and is used in eastern Ontario cities including Kingston and Cornwall, and on 400-series highways in eastern Ontario, Canada, as an alternative to road salt. The other, Fusion 2330™, is a blend of NaCl and refined beet sugars (referred to as organic or beet brine and abbreviated to B, consisting of ~17% NaCl; ~25% beet sugars; ~58% water) (Eco Solutions, Milton, ON, Canada), and is used in major metropolitan areas such as Toronto, Montreal, Calgary, and Winnipeg, Canada. For experimental manipulations, the chloride concentration for each of the de-icers was determined, with the nominal and actual chloride concentrations differing by an average of −4.4%.

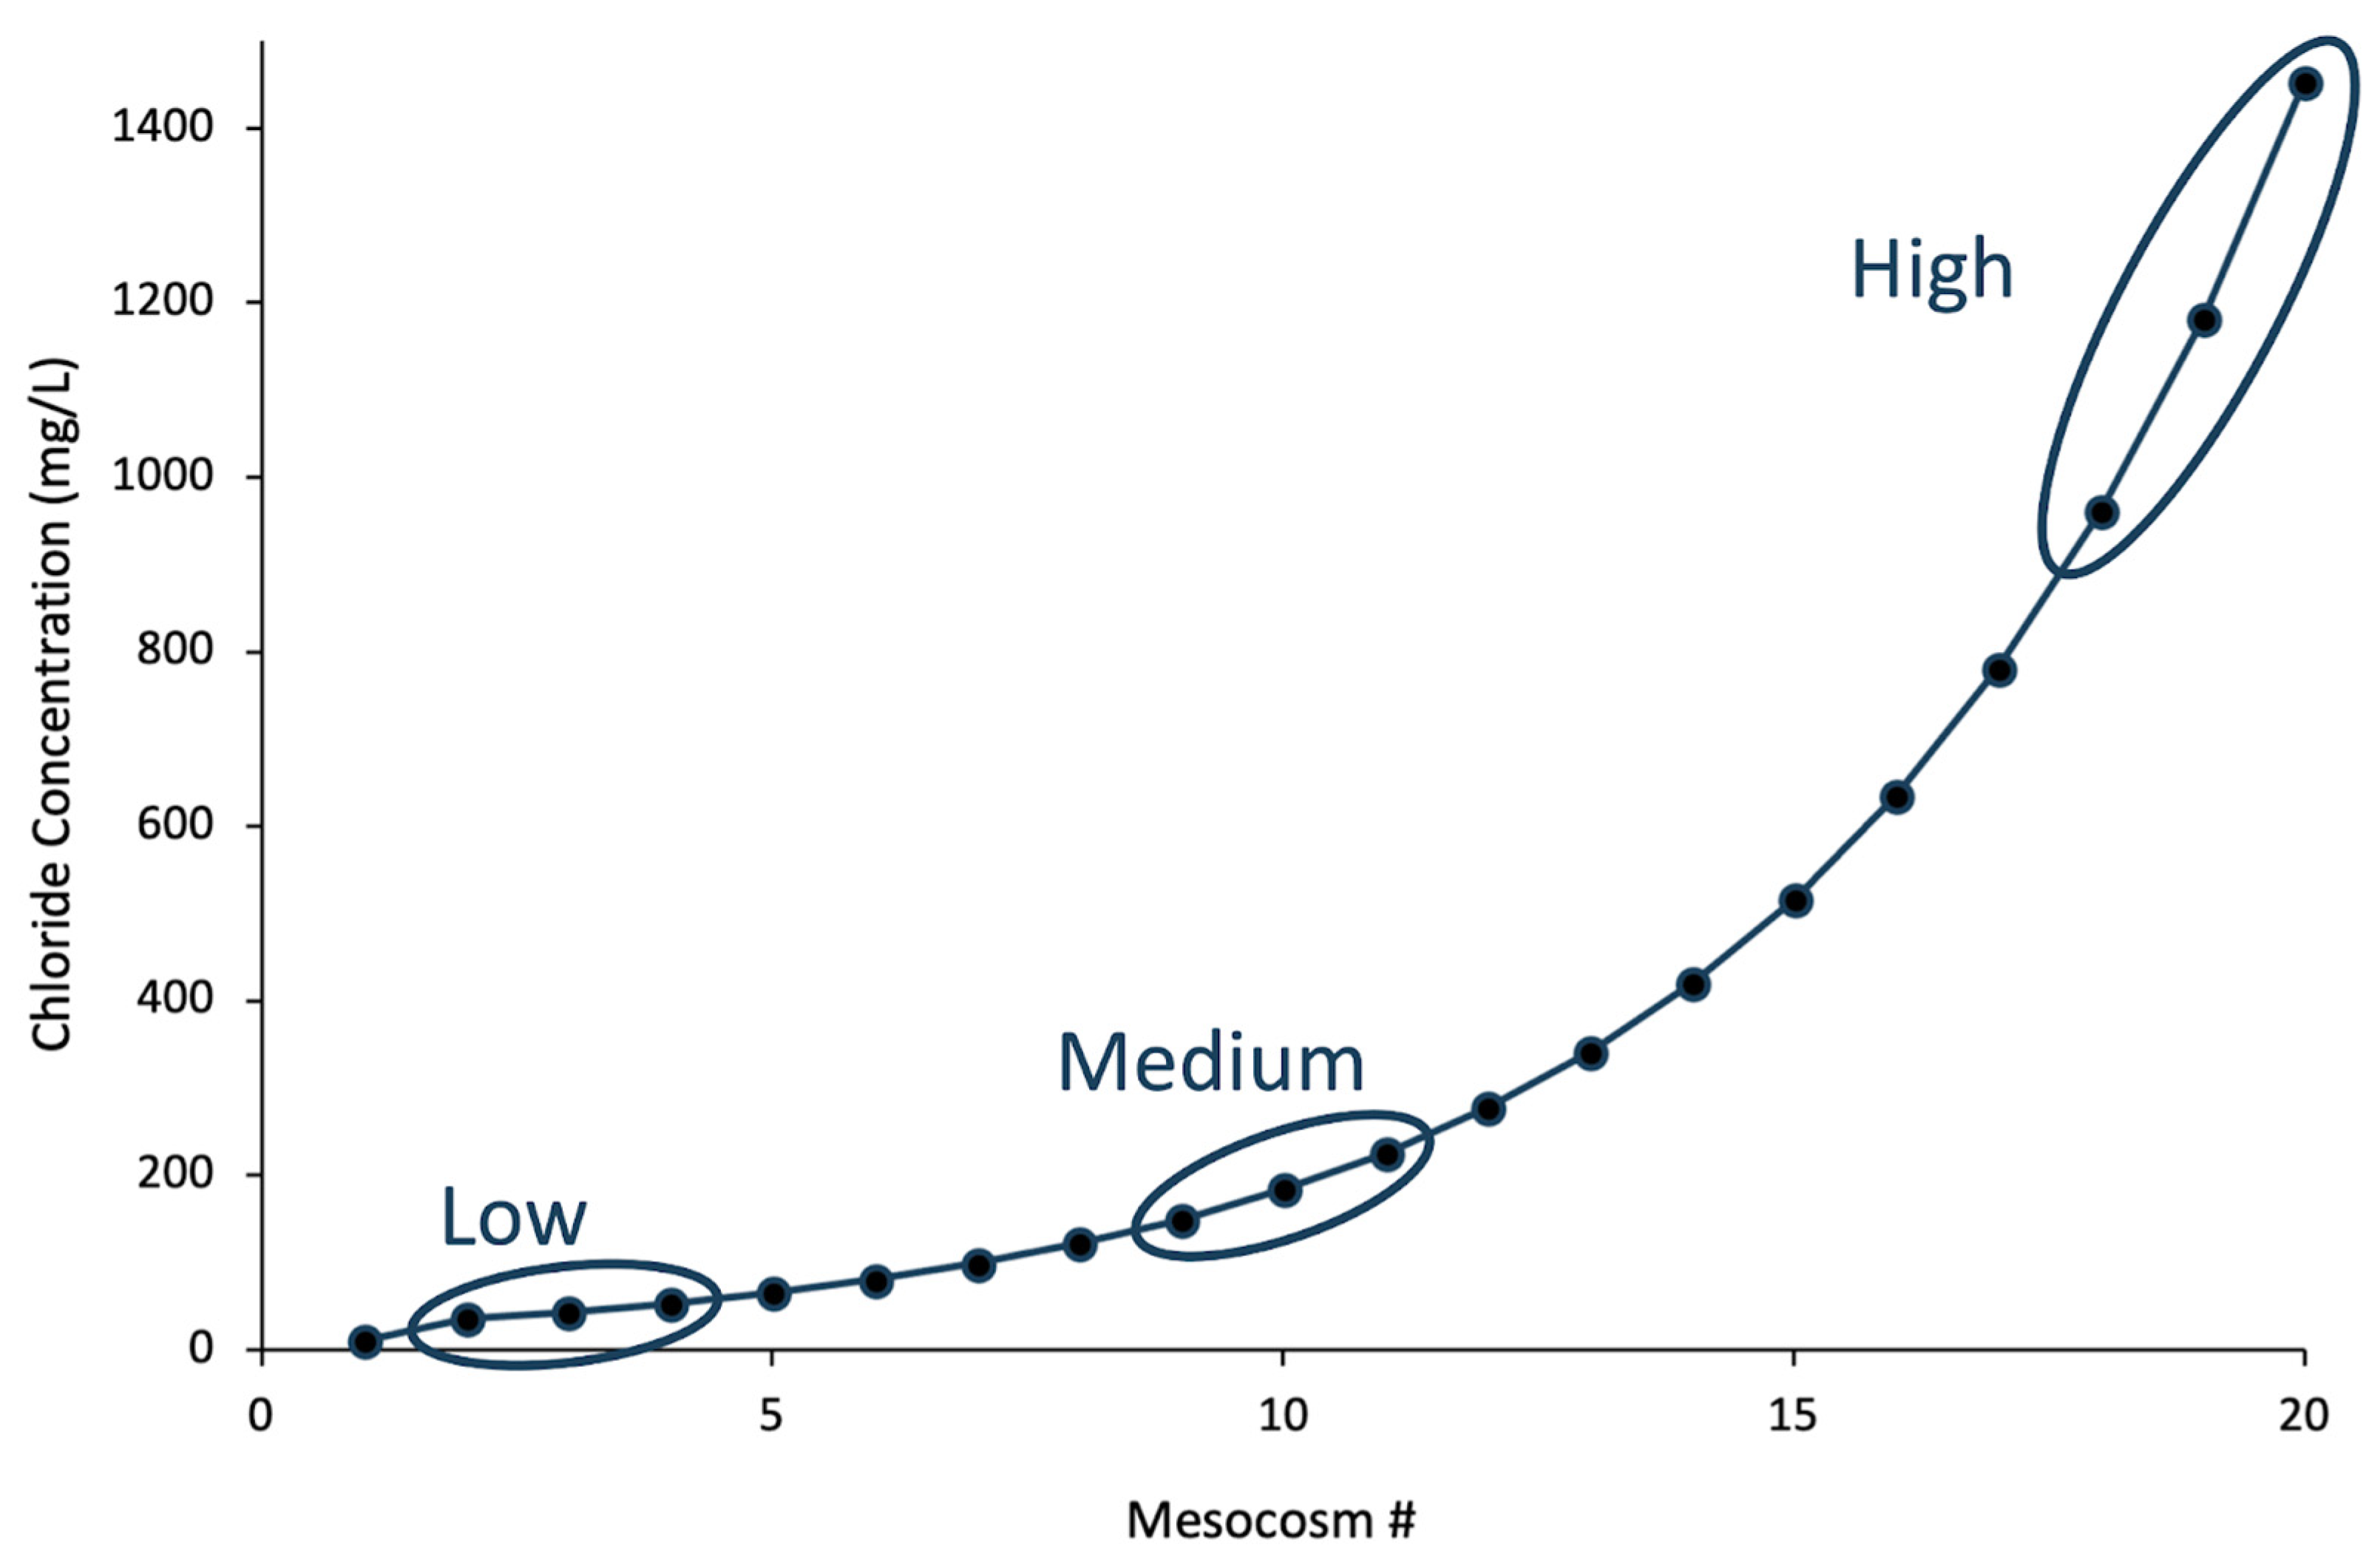
2.2. Aquatic Mesocosms

Mesocosms (n = 60) were made by filling 200 L black cylindrical containers (77 cm diameter × 53 cm height) with 180 L of filtered (80 μm mesh, allowing very small zooplankton and most phytoplankton to pass through) freshwater pumped from Lake Opinicon, adjacent to Queen’s University Biological Station, Ontario, Canada (QUBS; 44°34′01.2′′ N 76°19′30.0′′ W). Lake Opinicon has resorts, cottages, and other residential properties, country roads, as well as conservation lands adjacent to the lake, which has a surface water concentration of ~6 mg chloride ions per L (Cl/L). During the experimental period (16 June−26 July 2022), the ambient daytime mesocosm water temperature ranged from 13 °C to 22 °C, with a mean of 18.7 °C. Evaporation and rainfall were roughly equivalent so no additional water was added. Although the daylight varied over the 6-week period, and some shade was provided by adjacent vegetation, overall, in 24 h, there was light on average for 15 h 10 min. The mesocosms were covered with 1 mm screens to prevent insect access and initially left undisturbed for 6 days which allowed phytoplankton abundance to increase. Zooplankton were collected from 6 local lakes using an 80 μm net towed through an equivalent amount of water that was used to fill all mesocosms. All mesocosms received 1.2 L of high-density zooplankton, added randomly in aliquots of 400 mL. Mesocosms were left undisturbed for two more days before adding the de-icers. A regression-based experimental design was used with controls at 6 mg Cl/L and the three de-icers across 19 nominal chloride concentrations (35–1453 mg Cl/L; Figure 1). Such a large range spanned environmentally relevant concentrations that can be >1000 mg Cl/L and well over both chronic and acute toxicity levels in Ontario surface waters [8,29,30], with the number of de-icer amendments increased at low concentrations to facilitate response detection at concentrations lower than the Canadian Water Quality Guidelines chronic levels [8].
A gradient design for the treatment groups allowed the identification of non-linear effects [31], and the random assignment of the treatment for each mesocosm reduced bias based on the position. One day after the addition of the de-icers, samples (75 mL) from each mesocosm were filtered (50 μm mesh), with the filtrate analysed for Cl and major cations (sodium; [Na+], calcium [Ca2+], magnesium [Mg2+], and potassium [K+]) using ion chromatography and inductively coupled plasma optical emission spectroscopy, respectively (Queen’s University Analytical Services Unit; ASU). After one week, and subsequently at one-week intervals, 4.01 mg monosodium phosphate (NaH2PO4) and 85.92 mg of ammonium nitrate (NH4NO3) (both Sigma-Aldrich, St. Louis, MO, USA) were added to each mesocosm. These weekly additions represented 35% of the measured nutrient values of Lake Opinicon water and accounted for the daily loss of ~5% of nitrogen and phosphorus due to sedimentation and periphyton growth on mesocosm walls [32]. Each mesocosm was also assessed weekly at mid-depth for their temperature and dissolved oxygen (DO) using a YSI Pro 20 probe (YSI Inc., Yellow Springs, OH, USA) as well as specific conductance (YSI Pro 30 probe; YSI Inc., Yellow Springs, OH, USA). The specific conductance (µS/cm at 25 °C), along with the ASU-determined Cl levels were used to establish the relationship between Cl and specific conductivity, with the relationship quantified using orthogonal regression [25]. Onset temperature and light loggers (HOBO, Cape Cod, MA, USA) were placed in 13 of the mesocosms (4 in S and M, 5 in B) and on the adjacent ground for the recording of temperature and light (lux).
Samples (100 mL from 500 mL collected using an opaque bottle) were taken weekly at ~20 cm below the surface of each mesocosm and were used for an independent assessment of pH (Orion 3-Star Benchtop pH metre; Thermo Fisher Scientific, Waltham, MA, USA). A portion of those samples were then used for chlorophyll a (chl a) assessment. Briefly, within 24 h of collection, the water sample (250 mL) was filtered through rough glass fibre (G4 grade, 1.2 μm pore size; Thermo Fisher Scientific), with the filters then wrapped in aluminium foil and frozen at −18 °C until chl a extraction. After extraction in methanol for 24 h, chl a concentrations were measured using a TD-700 fluorometer (Turner Designs, San Jose, CA, USA). Freezing-point depression estimates were made for control, low (43.6 mg Cl/L), medium (186 mg Cl/L) and high (1199 mg Cl/L) nominal concentrations of each of the three de-icers (see Section 2.3 below).

2.3. Community Sampling

Water was sampled for microbiota at the end of the 6-week experiment. Since a gradient design for each of the treatment groups was optimal for the zooplankton analysis, a post hoc sampling protocol was followed for the bacterial analysis consisting of sampling water from each mesocosm treated with the nominal low-chloride concentrations (35, 43, and 53 mg Cl/L) for each of the three de-icers. Each 15 mL sample was filtered (50 μm mesh) into a sterile tube and pooled to make a composite sample (45 mL) from a single de-icer to provide a mean nominal concentration of 43.6 Cl/mg/mL. This procedure was repeated twice to provide triplicate samples at low treatment concentrations (L), and repeated for the other two de-icers. Likewise, this procedure was used for medium (149, 183, and 226 mg Cl/L; mean 186 mg Cl/L) and high (961, 1182, and 1453 mg/L; mean 1199 mg Cl/L) nominal concentrations of each de-icer (designated M and H, respectively), for a total sample number of 27 (Figure 1). In addition, there were three control mesocosms that were not amended with de-icers (CT). The triplicate samples (control: CT; low, medium and high concentrations of road salt: LS, MS, and HS, respectively; low, medium, and high concentrations of mixed-salt de-icer: LM, MM, and HM, respectively; low, medium, and high concentrations of beet brine de-icer: LB, MB, and HB, respectively) were kept on ice during the brief transit from QUBS to the laboratory and immediately frozen at −80 °C. The tubes were then shipped frozen to a commercial lab for DNA extraction and sequencing.

2.4. DNA Extraction and Sequencing

MR DNA (www.mrdnalab.com, Shallowater, TX, USA) extracted DNA, completed 16S rRNA gene amplicon sequencing, and initiated the sequence analysis. The 16S rRNA gene V3–V4 variable region primer, D-Bact-0341-b-S-17 (5′-CCTACGGGNGGCWGCAG-3′), and the reverse primer, 799R (5′-CMGGGTATCTAATCCKGTT-3′), were used to minimise amplification of plastid DNA from the mesocosms [33]. To further decrease the probability of the recovery of non-bacterial DNA, the blocking primer, mPNA (5′-GGCAAGTGTTCTTCGGA-3′), for mitochondrial contamination, and pPNA (5′-GGCTCAACCCTGGACAG-3′) for plastid contamination, both from the V4 region, were employed [34]. A polymerase chain reaction (PCR) was undertaken for 30 cycles using HotStarTaq Plus Master Mix Kit (Qiagen, Hilden, Germany) under the following conditions: 95 °C for 5 min, followed by 95 °C for 30 s, 53 °C for 40 s, and 72 °C for 60 s and then elongated at 72 °C for a final 10 min. Visualisation of the products on 2% agarose gels assessed amplification success using relative band intensity. DNA was purified using Ampure XP beads before using the amplicons for Illumina DNA-library preparation. Sequencing was performed at MR DNA on a MiSeq NovaSeq 6000 platform (Illumina Inc., San Diego, CA, USA) for 16S rRNA genes following the manufacturer’s guidelines.

2.5. Data Processing and Statistical Analyses

Amplicon sequence variants (ASVs) were identified using standard procedures in QIIME2 [35] using MR DNA. After de-multiplexing reads with demux, a total of 1,666,438 forward and reverse reads were denoised using DADA2. In brief, DADA2 joins sequences, performs quality filtering, and removes chimeras. The resulting ASVs were assigned taxonomic classification using a reference tree produced with SATé-Enabled Phylogenetic Placement (SEPP). The fragment-insertion function in QIIME2 was used to create a phylogenetic tree of ASVs identified using DADA2. Fragments that could not be inserted into the phylogeny were removed from the feature table. After all processing steps in QIIME2, the final feature table contained 3040 ASVs across the 30 samples. The ASV table, phylogenetic tree, taxonomic classification, and metadata were then analysed in R Statistical Software (v4.1.1) [36] using the phyloseq package [37].
Shannon’s diversity index and Chao 1 diversity index were calculated in phyloseq to assess alpha diversity in the sample [38,39]. A one-way ANOVA with a post hoc Tukey HSD test was executed to determine whether differences in de-icers or their concentrations had significant impacts on microbial communities. All model assumptions of homogeneity of variance and normality were met. Tukey post hoc tests were performed to identify which specific treatment groups showed significant differences in Shannon diversity. Beta diversity was assessed using weighted UniFrac dissimilarity distance to measure community dissimilarity among the treatment groups. Weighted UniFrac dissimilarity matrices were used for principal coordinate analyses (PCoA) and plots were made in R using ggplot2. Differential abundance testing was performed using ANCOM-BC (v2.2.1) [40] to determine significantly differentially abundant taxa between treated and control mesocosms. ASVs were first merged with microbial families prior to the analysis, and global test results were interpreted to identify microbial families that showed differences in abundance between at least two treatment groups. Heat maps were generated by displaying log-fold changes in differences in bias-corrected abundances for the different microbial families when compared to CT. Additional differential abundance tests were performed on select genera of interest (Flavobacterium and Devosia). ASVs were merged according to genus, and ANCOM-BC tests were performed in the same manner as the family-level tests.
In addition to the bacterial analysis, R Statistical Software (v4.1.1) [36] was also used to analyse the mesocosm data with the following packages: dplyr (v1.1.0) was used for data manipulation [41], ggplot2 (v3.4.2) was used for producing visualizations [42,43], mgcv (v1.8-42) was used for modelling and smoothing data [44,45], car (v3.1-2) was used for regression models [46,47], MuMIn (v1.47-5) was used for model selection [48], and MASS (v7.3-60) was used for linear model estimation [49,50]. Linear models (LM), generalised linear models (GLM), and generalised additive models (GAM) were used to model responses to chloride. The Akaike information criterion corrected for small sample sizes (AICc) function from the MuMIn package (v1.47-5) was used to calculate and to select the model with the lowest AICc value [48]. If two models were within two AICc units of each other, the minimum adequate model (MAM) or the model with the least number of explanatory terms was used. GAMs were used to model the ecological data with statistical assumptions viewed with the “gam.check” function from mgcv (v1.8-42) [44,45], as well as assessment of residual quantile–quantile plots, histograms of residuals, residual vs. linear predictor plots, and response vs. fitted values plots, as well as checking the convergence and k-index. Code and scripts for the non-bacterial analyses are available in File S1.

3. Results

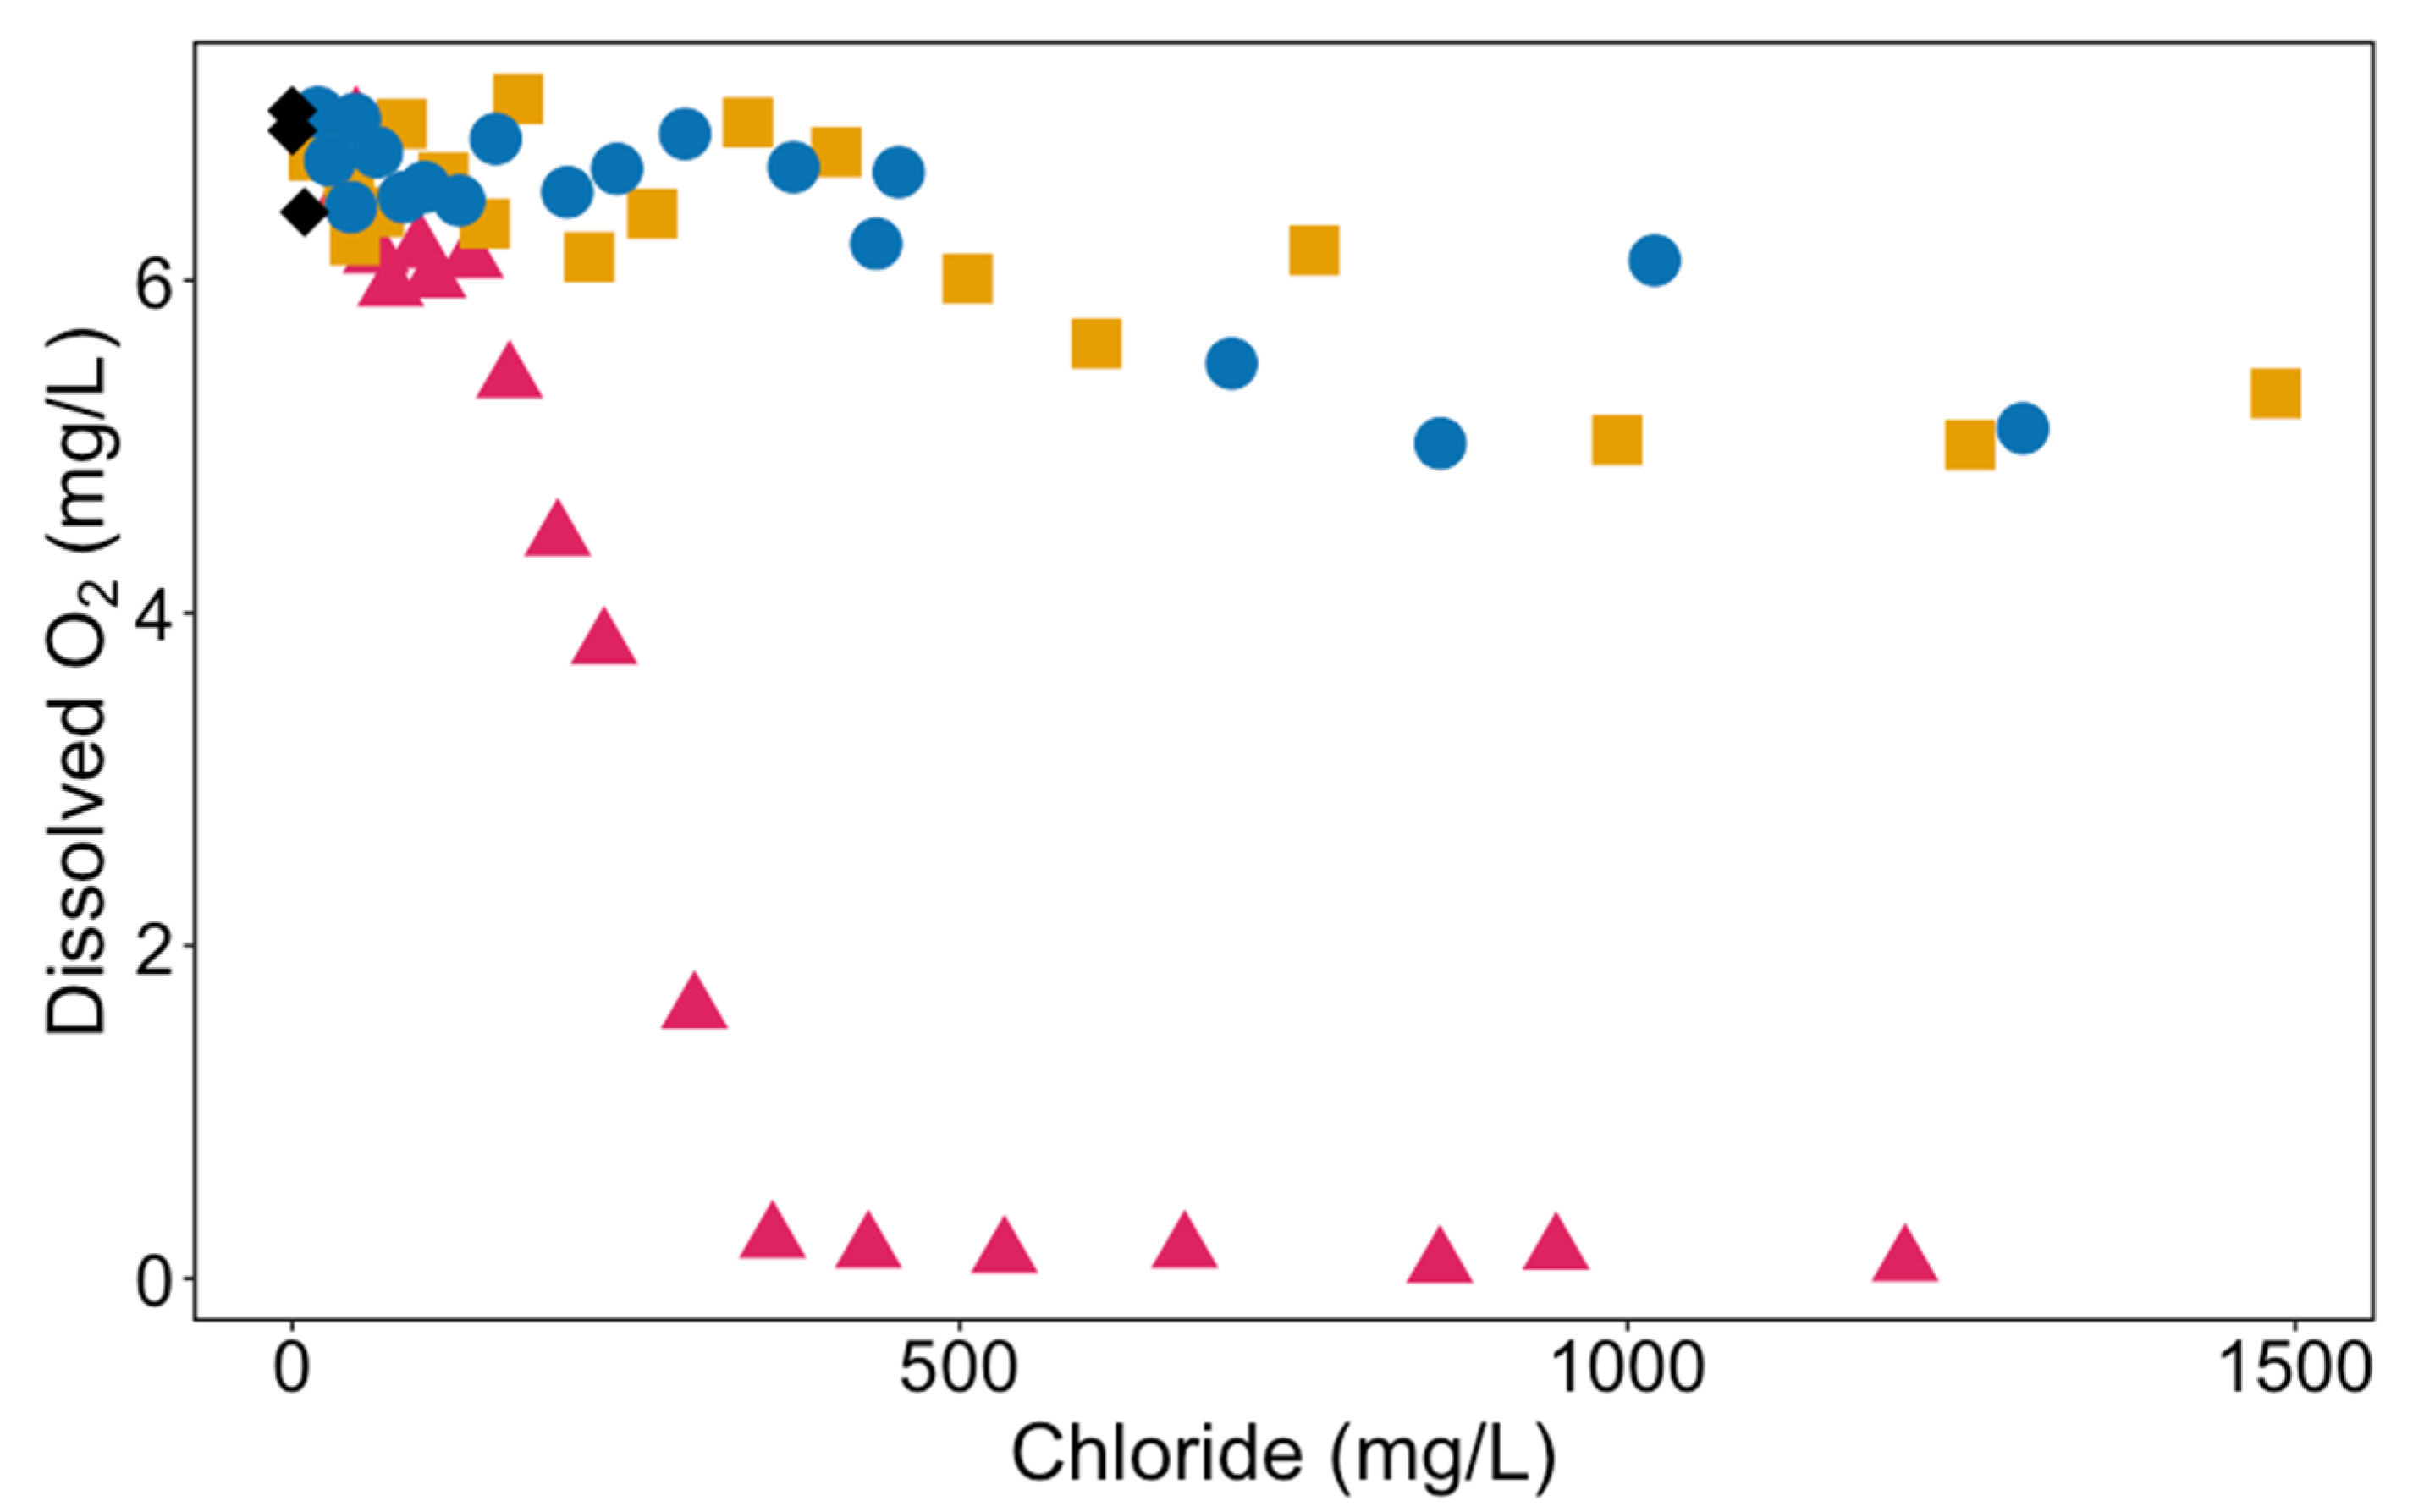
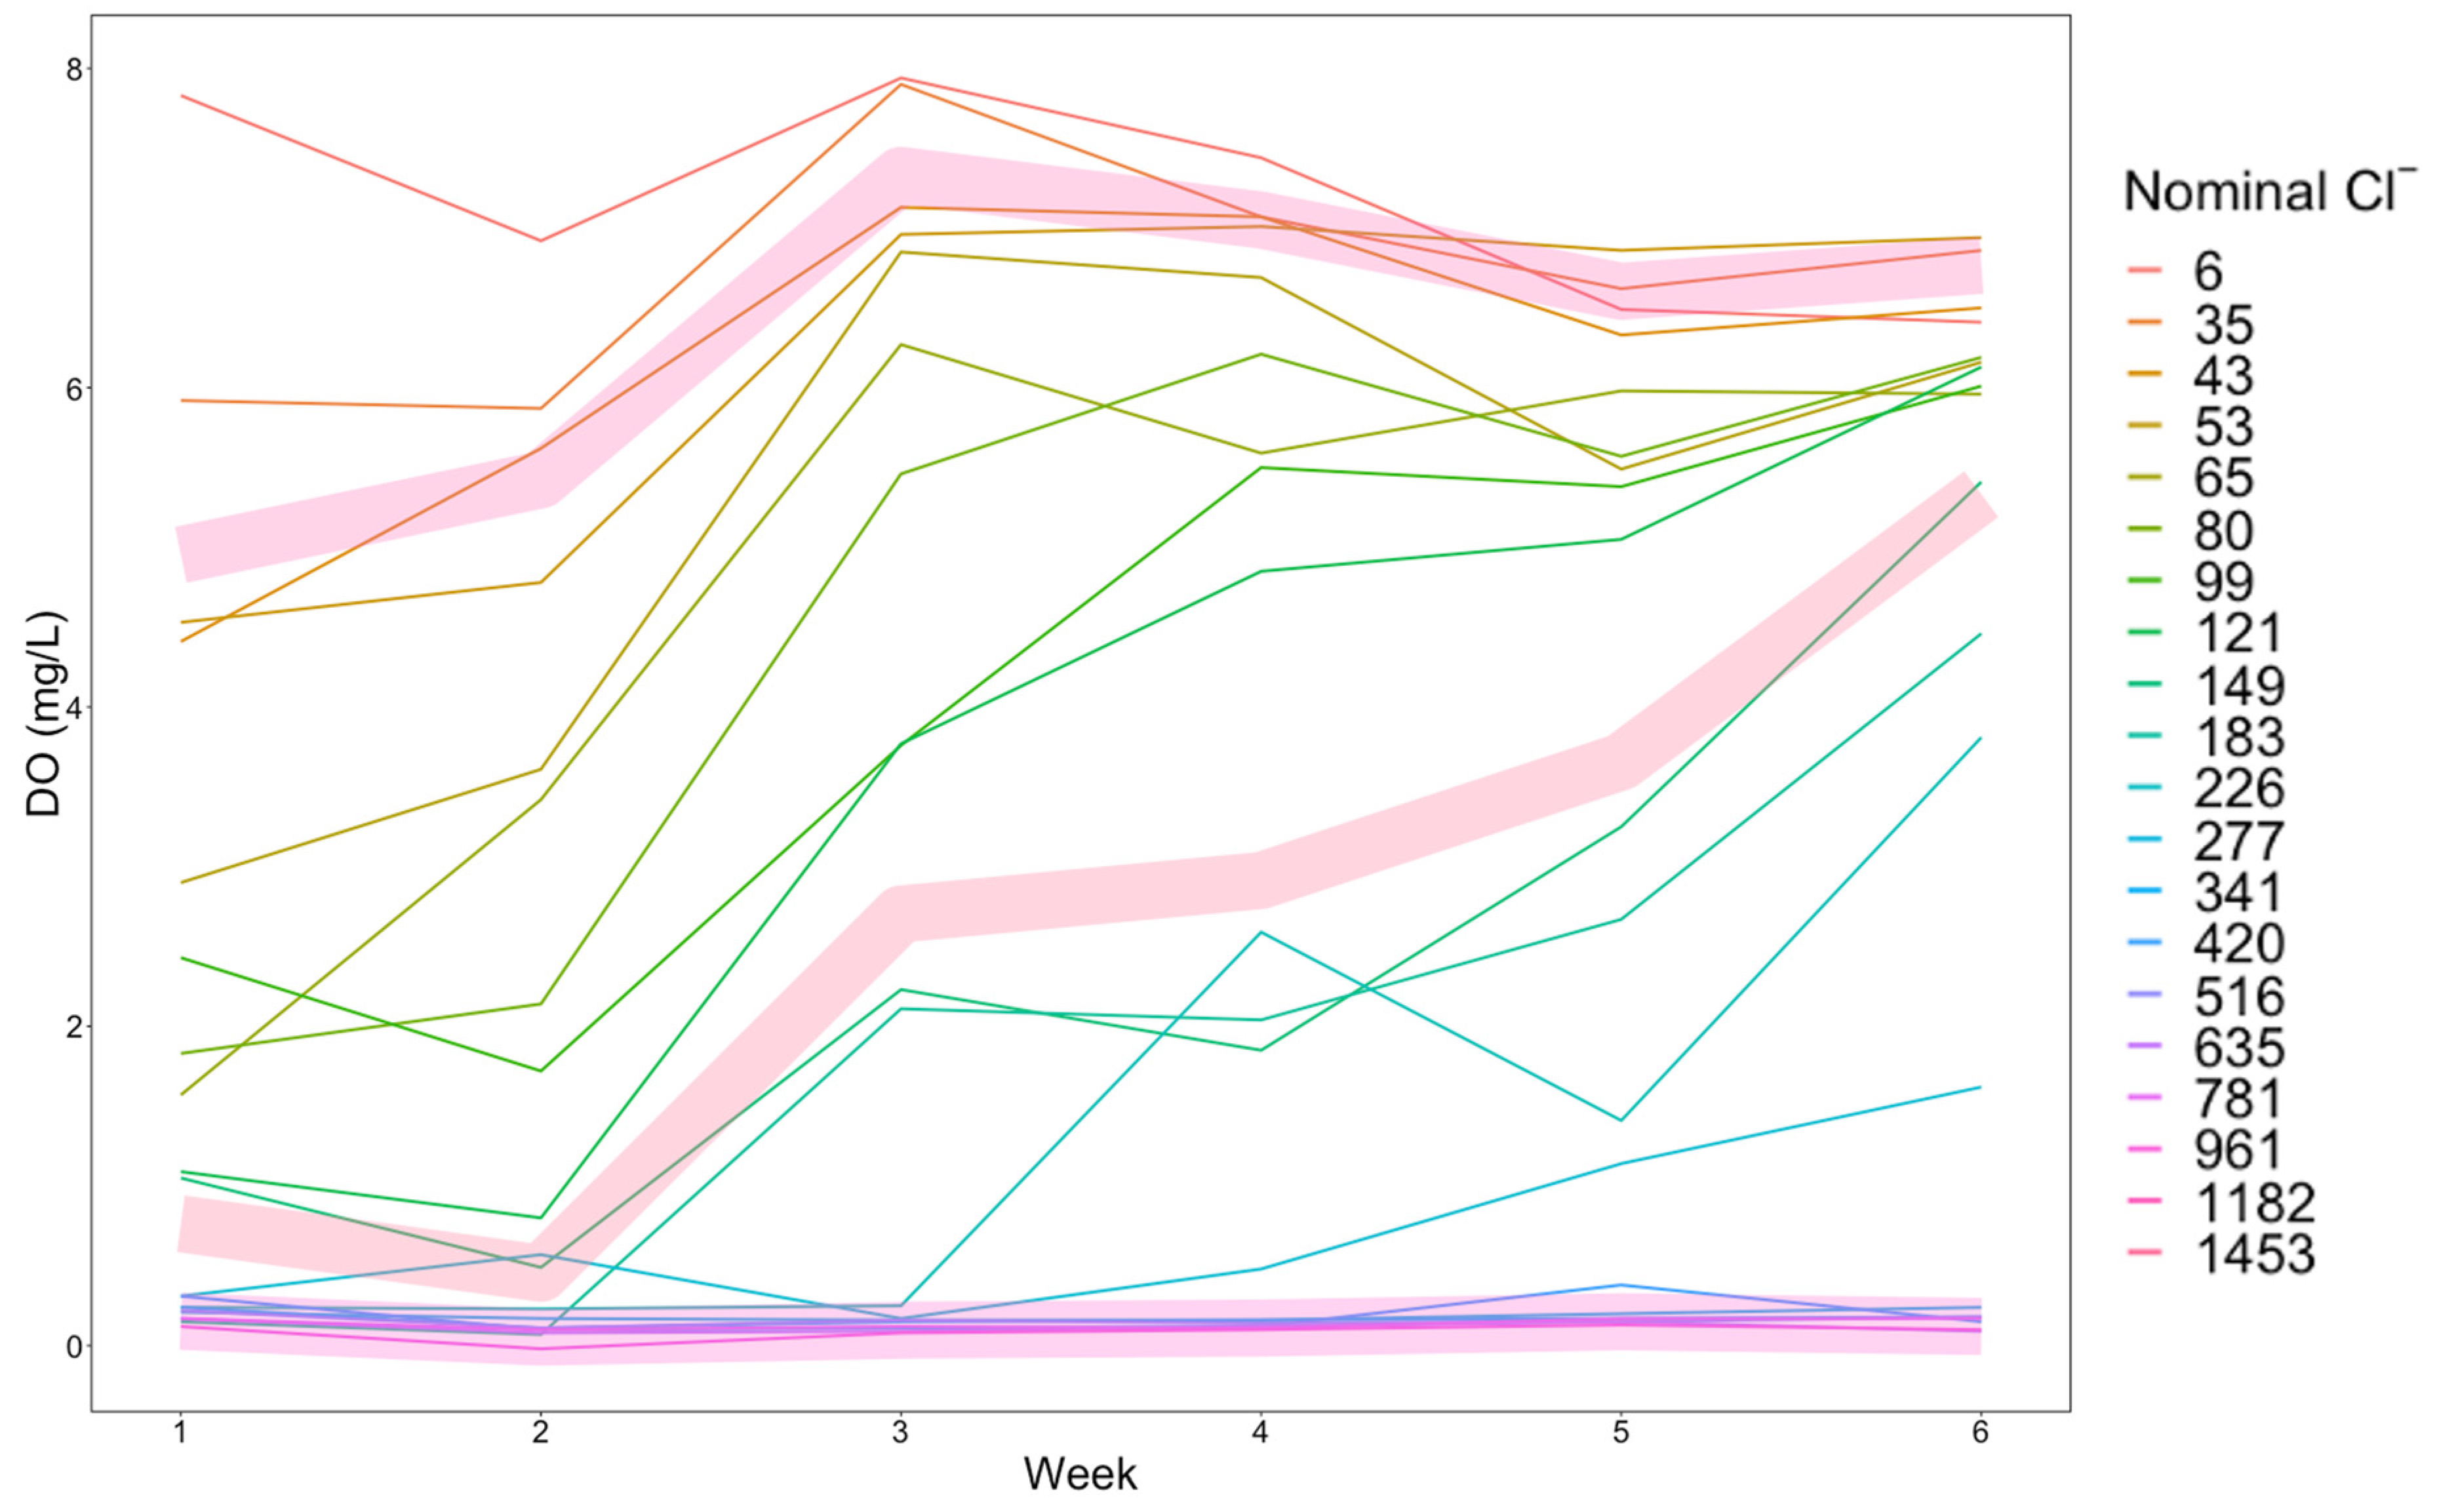
3.1. Properties of the De-Icer-Amended Mesocosms

After establishment, mesocosms were monitored weekly for several physical parameters. There was a linear relationship between the specific conductivity and the initial chloride concentrations for each of the de-icer treatments (R2 values of the linear model relationships for S, M, and B de-icers were 0.997, 0.992, and 0.991, respectively). Predictably, experimentally determined cation concentrations showed a linear relationship with increasing calculated Cl concentrations (Figure 1) in the mesocosms (i.e., Na+ in all the de-icers, Ca2+ and Mg2+ in M, or K+ in B) (Figure S1). Over the experimental period, conductivity remained as anticipated with higher values in mesocosms containing the higher concentrations of de-icers (Figure S2). Temperature varied predictably with the weather. The pH decreased with respect to controls (from ~7.4 to 7.2 and 6.7) in S and M de-icers, respectively, at higher de-icer concentrations, but did not show a concentration-dependent change in the B-amended mesocosms (Figure S2). By the end of the 6-week treatment, however, the pH of the control mesocosms were elevated by about half a pH unit relative to the starting pH, with high concentrations of S and M de-icers showing little or no change, but with high B concentrations, at a pH of ~6.5. Mesocosms with substantive B de-icer additions were visually darker than controls and those containing the other de-icers. Most notably, depending on the nature and concentration of the de-icer amendments, DO levels in the mesocosms showed striking differences (Figure 2). At high Cl levels in the S- and M-containing mesocosms, there was a small decrease (from an initial ~8 mg/L to ~5 mg/L) in DO over the course of the six-week experimental-treatment period compared to controls (from ~8 mg/L to ~7 mg/L). However, at the highest B concentrations, the DO was 68-fold lower (~0.1 mg/L) than CT, and it remained low over the entire 6-week period (Figure 2 and Figure 3). In addition, change in the DO profile correlated with the B de-icer concentration and treatment week (Figure 3).
Figure 2. Dissolved oxygen concentration (mg/L) in week 6 of the experimental treatment, and plotted against experimentally determined chloride concentration (mg/L) for each de-icer-treatment group. Black diamonds represent the control conditions; blue circles represent the road salt treatment (S); orange squares represent the mixed inorganic treatment (M); and red triangles represent the beet organic treatment (B).
Water 16 00426 g002
Figure 3. Dissolved oxygen concentration (DO; mg/L) in each of the mesocosms over the course of the experimental treatment weeks and plotted against the nominal chloride concentration (mg/L). The top thin line represents the control showing the lake chloride concentration at 6 mg/L, with the bottom 19 lines representing the organic beet brine de-icer-treatment groups at increasing nominal concentrations of the de-icer until the highest chloride concentration at 1453 mg/L (bottom line). The thick pink lines represent the mean DO plotted over the treatment period, representing from top to bottom, mesocosms with low, medium, and high concentrations of de-icer (corresponding to average experimental chloride concentrations of 39, 165, and 1005 mg/L, respectively). At the end of the 6-week treatment period, 16S rRNA amplicon sequencing was completed on triplicate samples representing low, medium, and high de-icer concentrations. As a proxy for phytoplankton biomass, chl a concentration (mg/L) was used. At the conclusion of the 6-week experimental period, mesocosms amended with high concentrations of S as well as M de-icers showed higher chl a concentrations (Figure 4). Compared to control mesocosms, chl a concentrations increased 6.2-fold and 3.4-fold for S and M de-icers, respectively. In contrast, at high Cl concentrations of the B de-icer, there was no change in the chl a concentration, relative to the controls.
Water 16 00426 g003
Figure 4. Chlorophyll a concentration (mg/L) plotted against the experimentally determined chloride concentration (mg/L) for each experimental de-icer at the end of the 6-week experimental treatment. Black diamonds represent controls; blue circles represent the road salt de-icer treatment; orange squares represent the mixed-salt inorganic treatment; and red triangles represent the beet organic treatment. Two beet de-icer mesocosms (420 mg/L and 516 mg/L) were recorded with over 0.55 ug/L chlorophyll a, well outside the 95% confidence intervals. These mesocosms were not included in those used to produce low, medium, and high samples for each of the de-icers, but are shown here as open red triangles. Trend lines in the appropriate treatment colours with shading indicate the 95% confidence intervals associated with the appropriate line.
Water 16 00426 g004

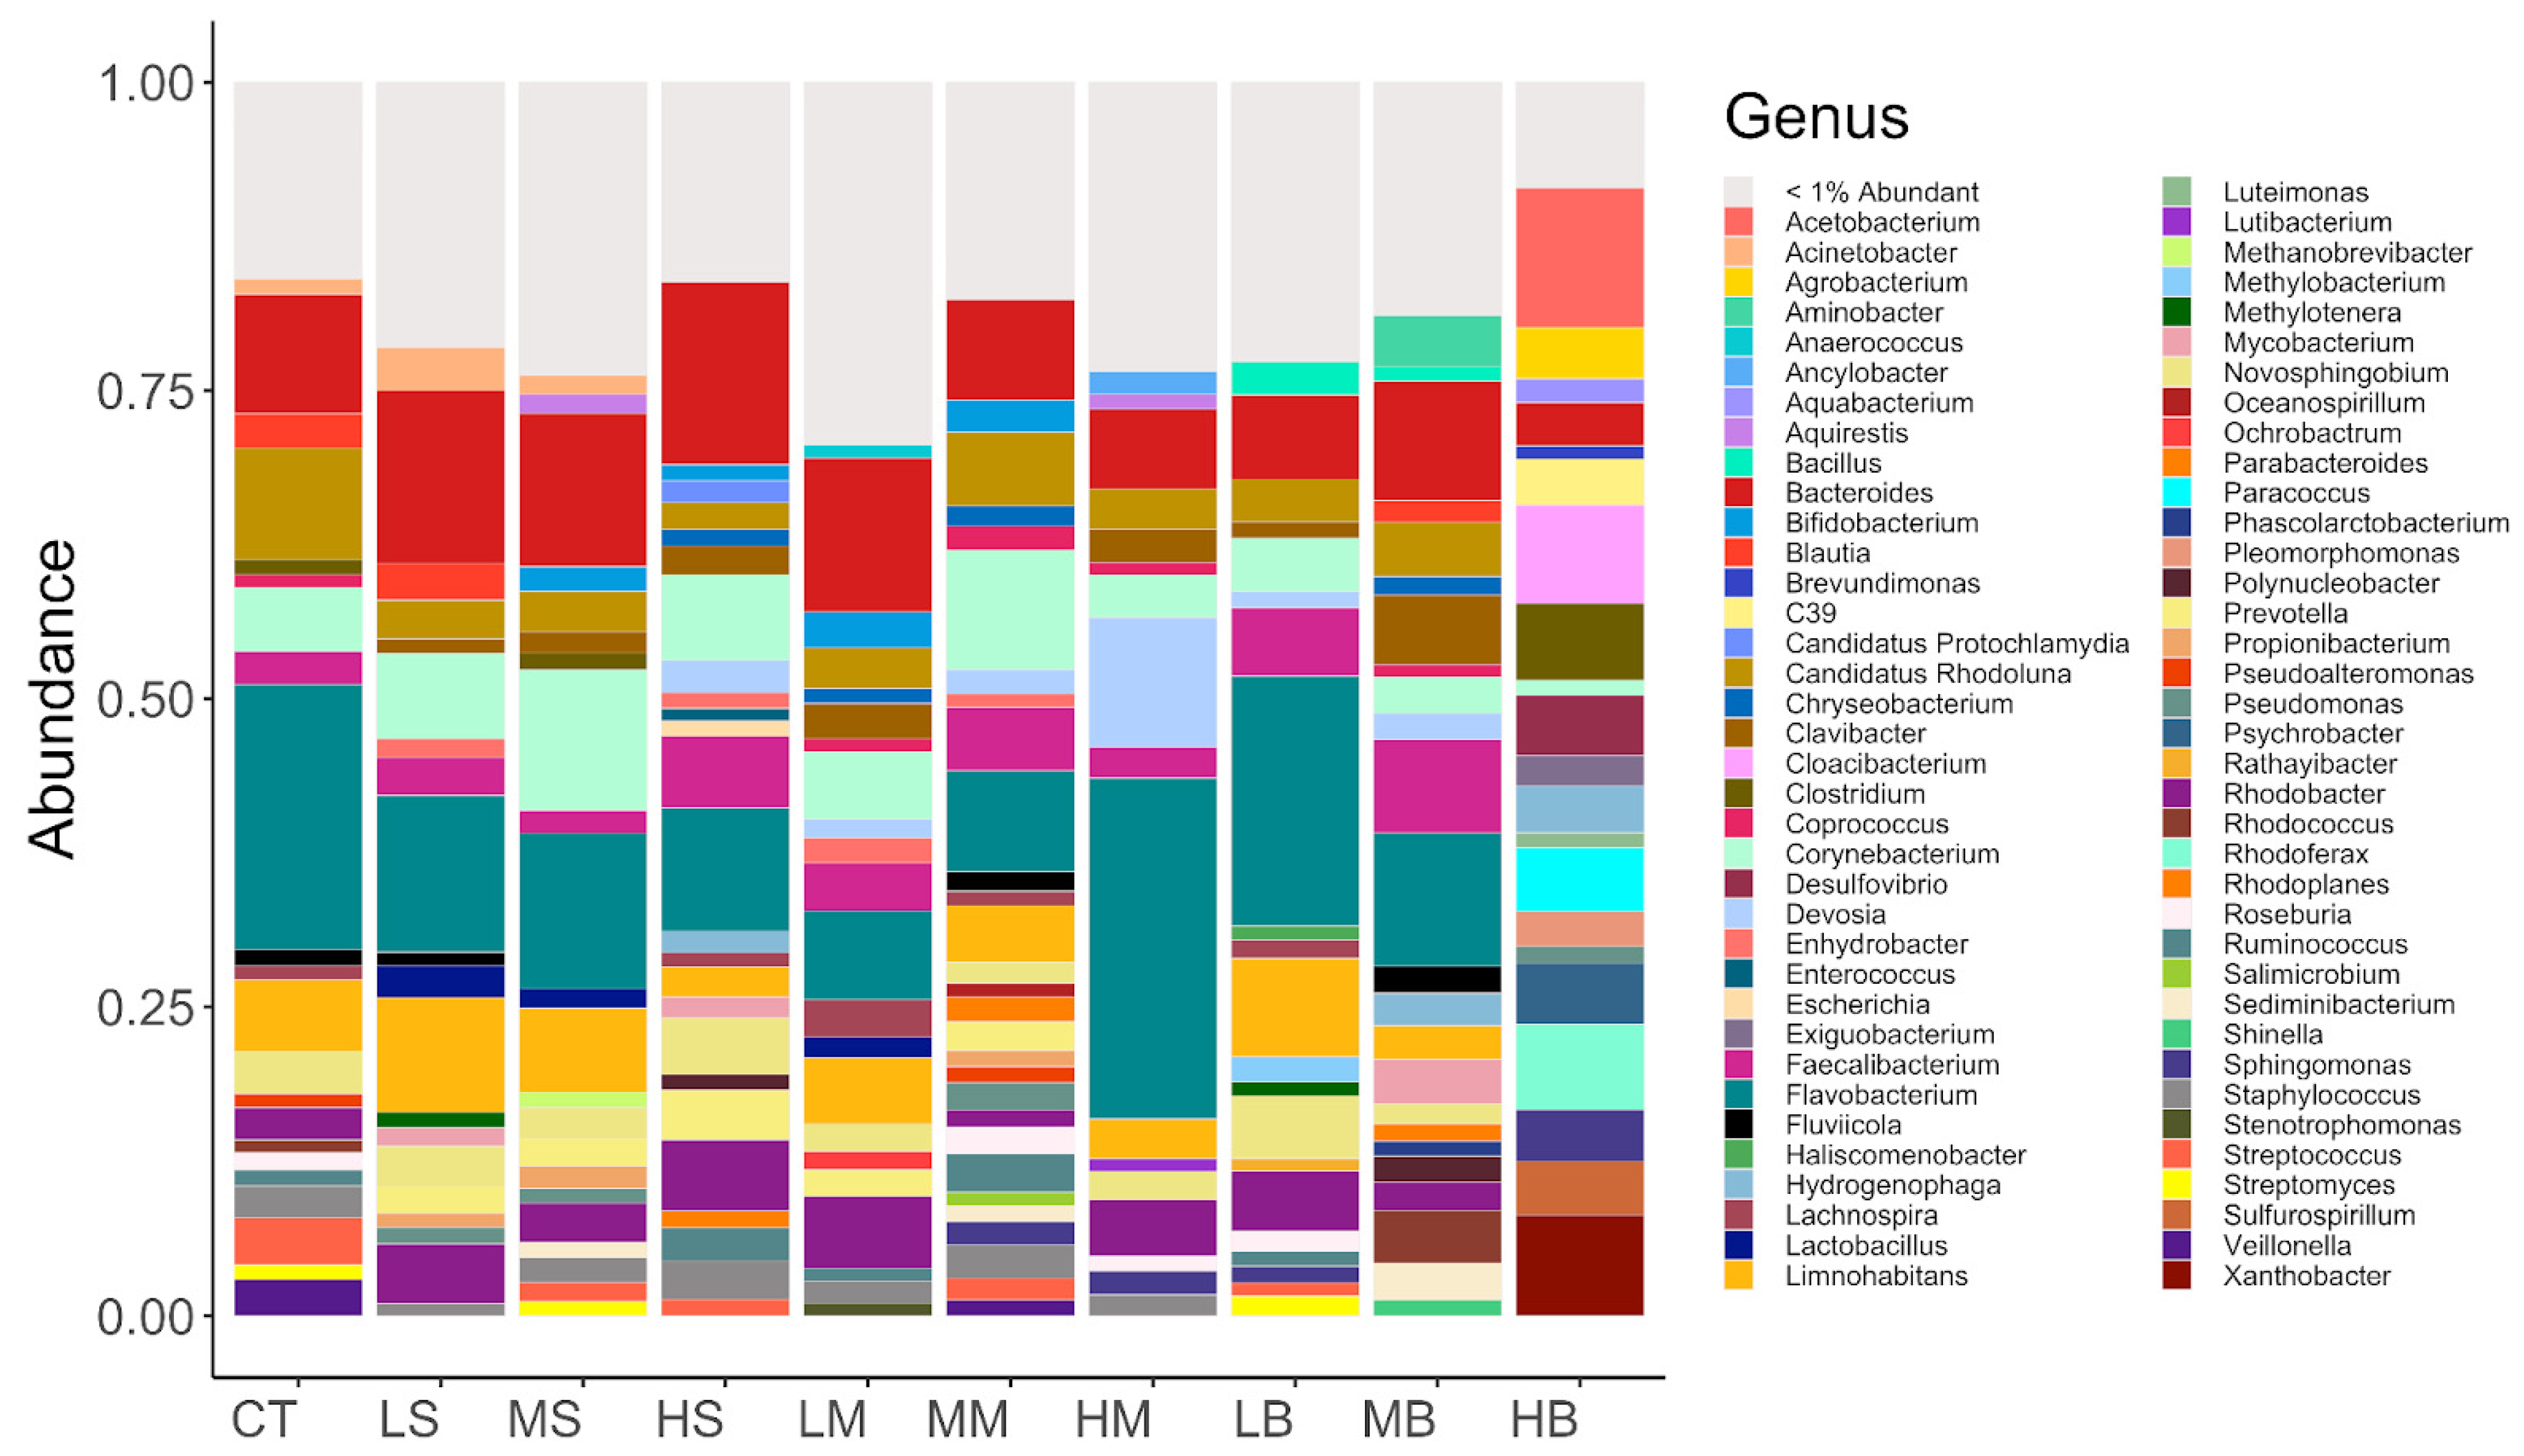
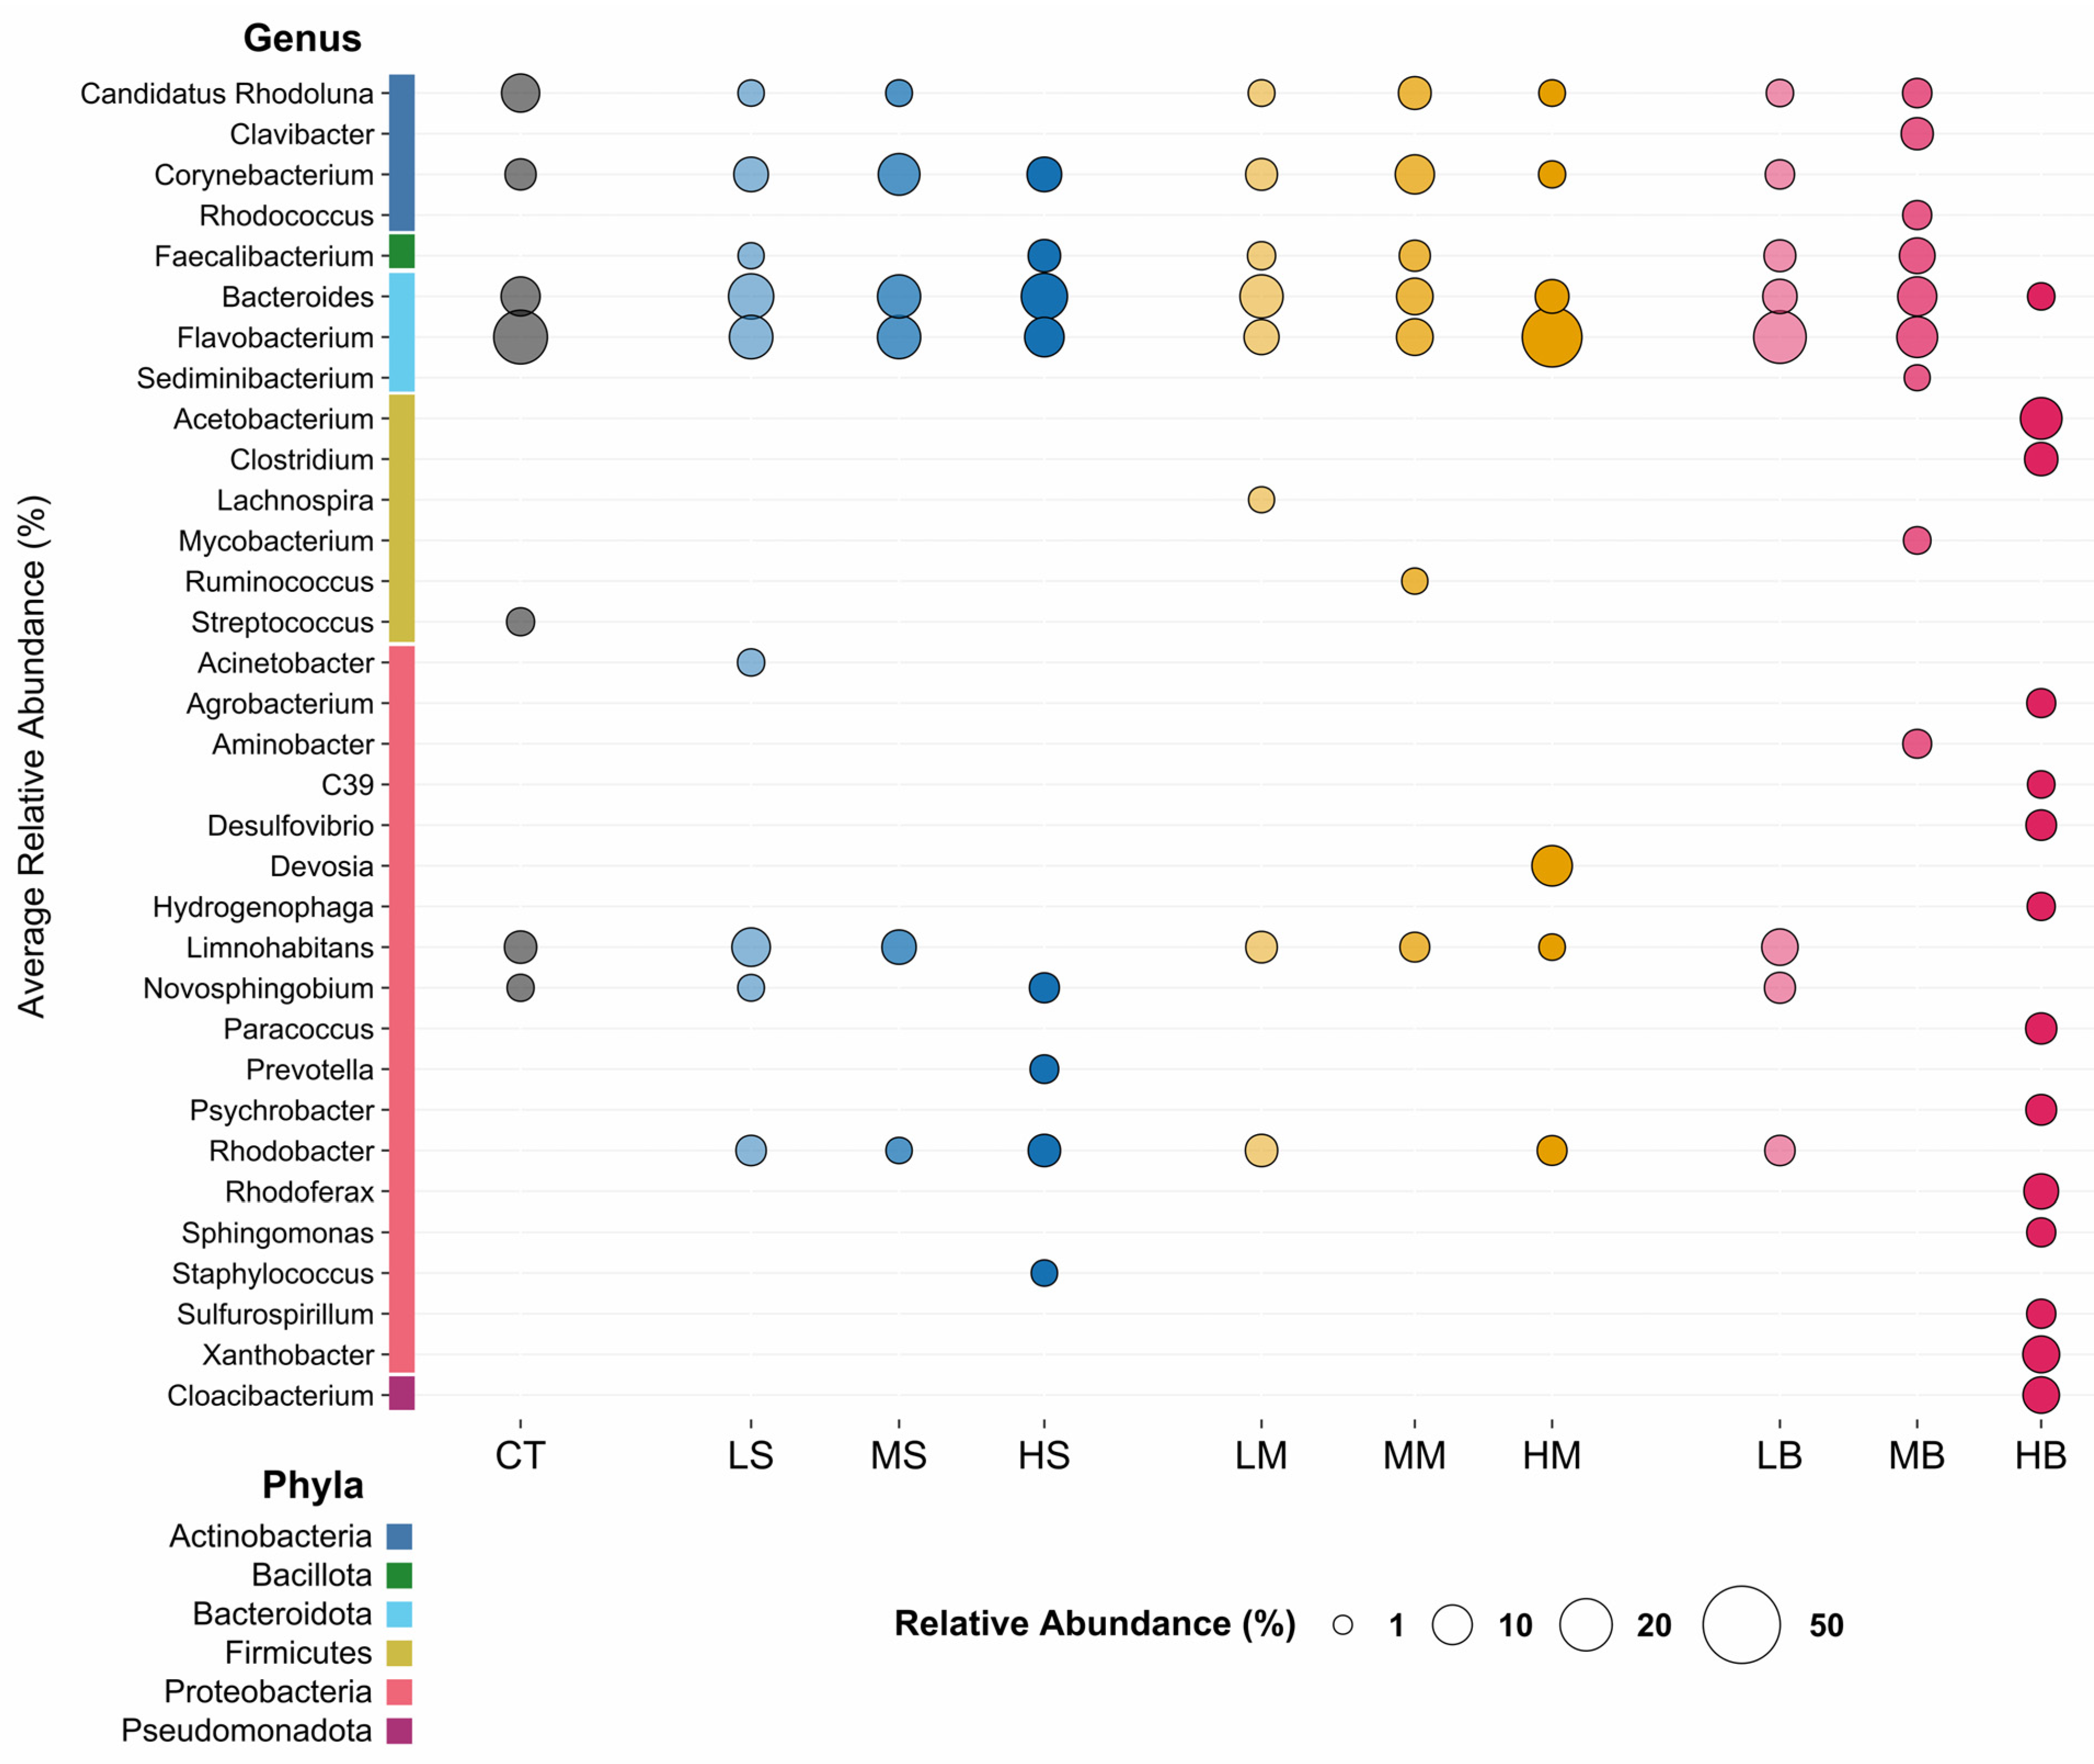
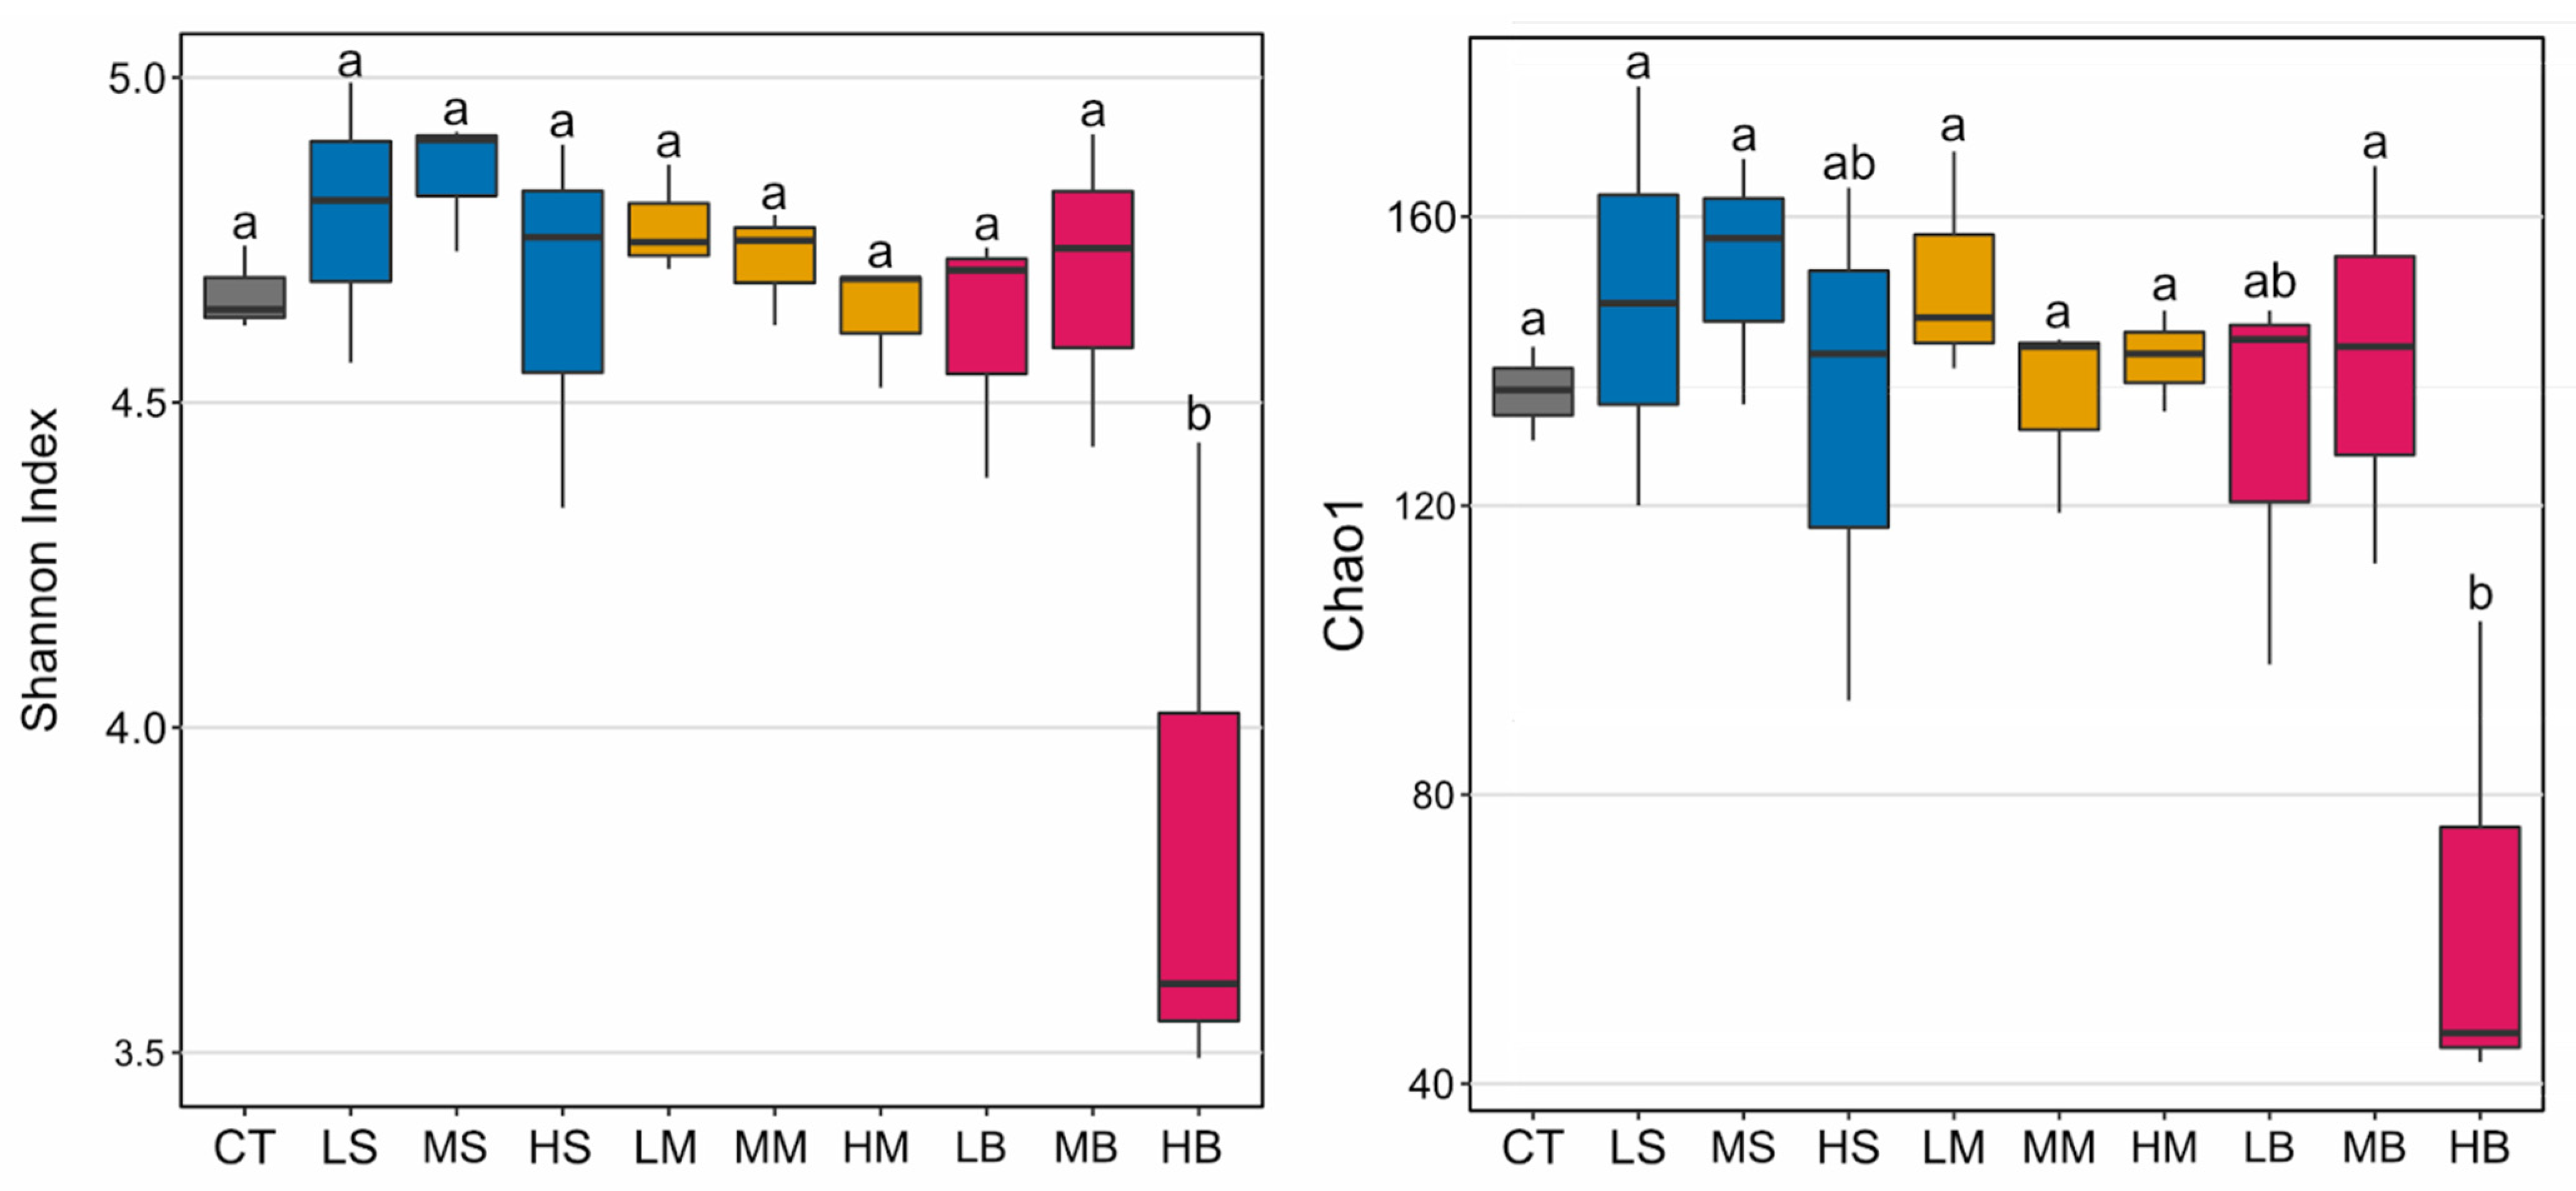
3.2. Microbiota in the De-icer-Amended Mesocosms

To estimate the osmotic impact of the different de-icers at different concentrations, experimental depression of the freezing point was determined, corresponding to the mean de-icer concentrations used for the microbiota analysis. Control samples had no measurable freezing-point depression as well as the majority of the three de-icer samples (LS, MS, HS, LM, MM, LB and MB). The mean freezing point decreased marginally at 0.2 and 0.6 °C for HM and HB, respectively.
The identification of 3040 unique ASVs corresponded to 73 unique genera (at >1% relative abundance) among all samples. It can be challenging to recover taxonomic information for bacteria in a background of algal DNA since chloroplast sequences share homology with bacterial 16S rRNA gene sequences. Previously in analogous situations, we used peptide nucleic acid plastid clamps with other bacterial 16S rRNA primers in amplicon protocols, but 99% of the sequences still returned plastid DNA [51,52]. The procedure used here resulted in only 0.03% of the ASVs corresponding to chloroplast sequences and demonstrated that the judicious selection of V3–V4 16S rRNA gene primers [33], in conjunction with the deployment of algal blockers, was successful. Only 0.26% of the ASVs were identified as archeal reads, underscoring the recovery of bacterial sequences.
Taxonomic assessment of mean relative abundance (>1%) in the different mesocosm communities were generally similar between CT and the low de-icer-amended mesocosms (LS, LM and LB) at various taxonomic divisions including genera (Figure 5 and Figure S3). Sequences corresponding to bacterial taxa (at a relative abundance > 3%) and shown with their phylum affiliations (Figure 6) have been previously reported from freshwater lakes, e.g., [53,54,55].
These taxa were present in CT and all of the de-icer-amended mesocosms, except in HB, and included lake genera Candidatus (Ca.) Rhodoluna, Corynebacterium, Flavobacterium, Limnohabitans, Novosphingobrum, and Rhodobacter. Sequences corresponding to the faecal indicator bacteria, Escherichia coli and Enterococcus species were not observed (at a relative abundance of >3%); however, Bacteroides and Faecalibacterium, other indicators of human and agricultural contamination in lakes [56], were found in the majority of the mesocosms, and generally comprised an average relative abundance of 9.8% and 4.2%, respectively. Notably, these two taxa were not apparent in the HB treatment group (Figure 6). For the most part, bacterial communities likely reflected the initial lake consortium, except for HB and some taxa in the HM samples. The HM microbiota were distinguished with an increase in the relative abundance of sequences corresponding to Flavobacterium (ANCOM-BC genus result: p < 0.0001, W = 257.37) and Devosi (ANCOM-BC genus result: p < 0.0001, W = 257.03), the latter of which also increased, but to a lesser extent, in the HS and MB microcosms. In the HB samples, there was a 21.5-fold reduction in the relative abundance of Flavobacterium sequences compared to CT (ANCOM-BC genus result: p < 0.0001, W = 257.37), as well as the relative increase in abundance of sequences characteristic of anaerobic or facultative anaerobic genera including Acetobacterium, Agrobacterium, Clostridium, Desulfovibrio, Hydrogenophaga, and Paracoccus (Figure 6). Curiously, the relative abundance of the faecal indicator and anaerobe, Bacteroides, decreased in relative abundance in HB compared to CT; however, since its relative abundance was also decreased in HS and HM compared to LS and LM samples, this taxon may be disadvantaged at high salt concentrations.

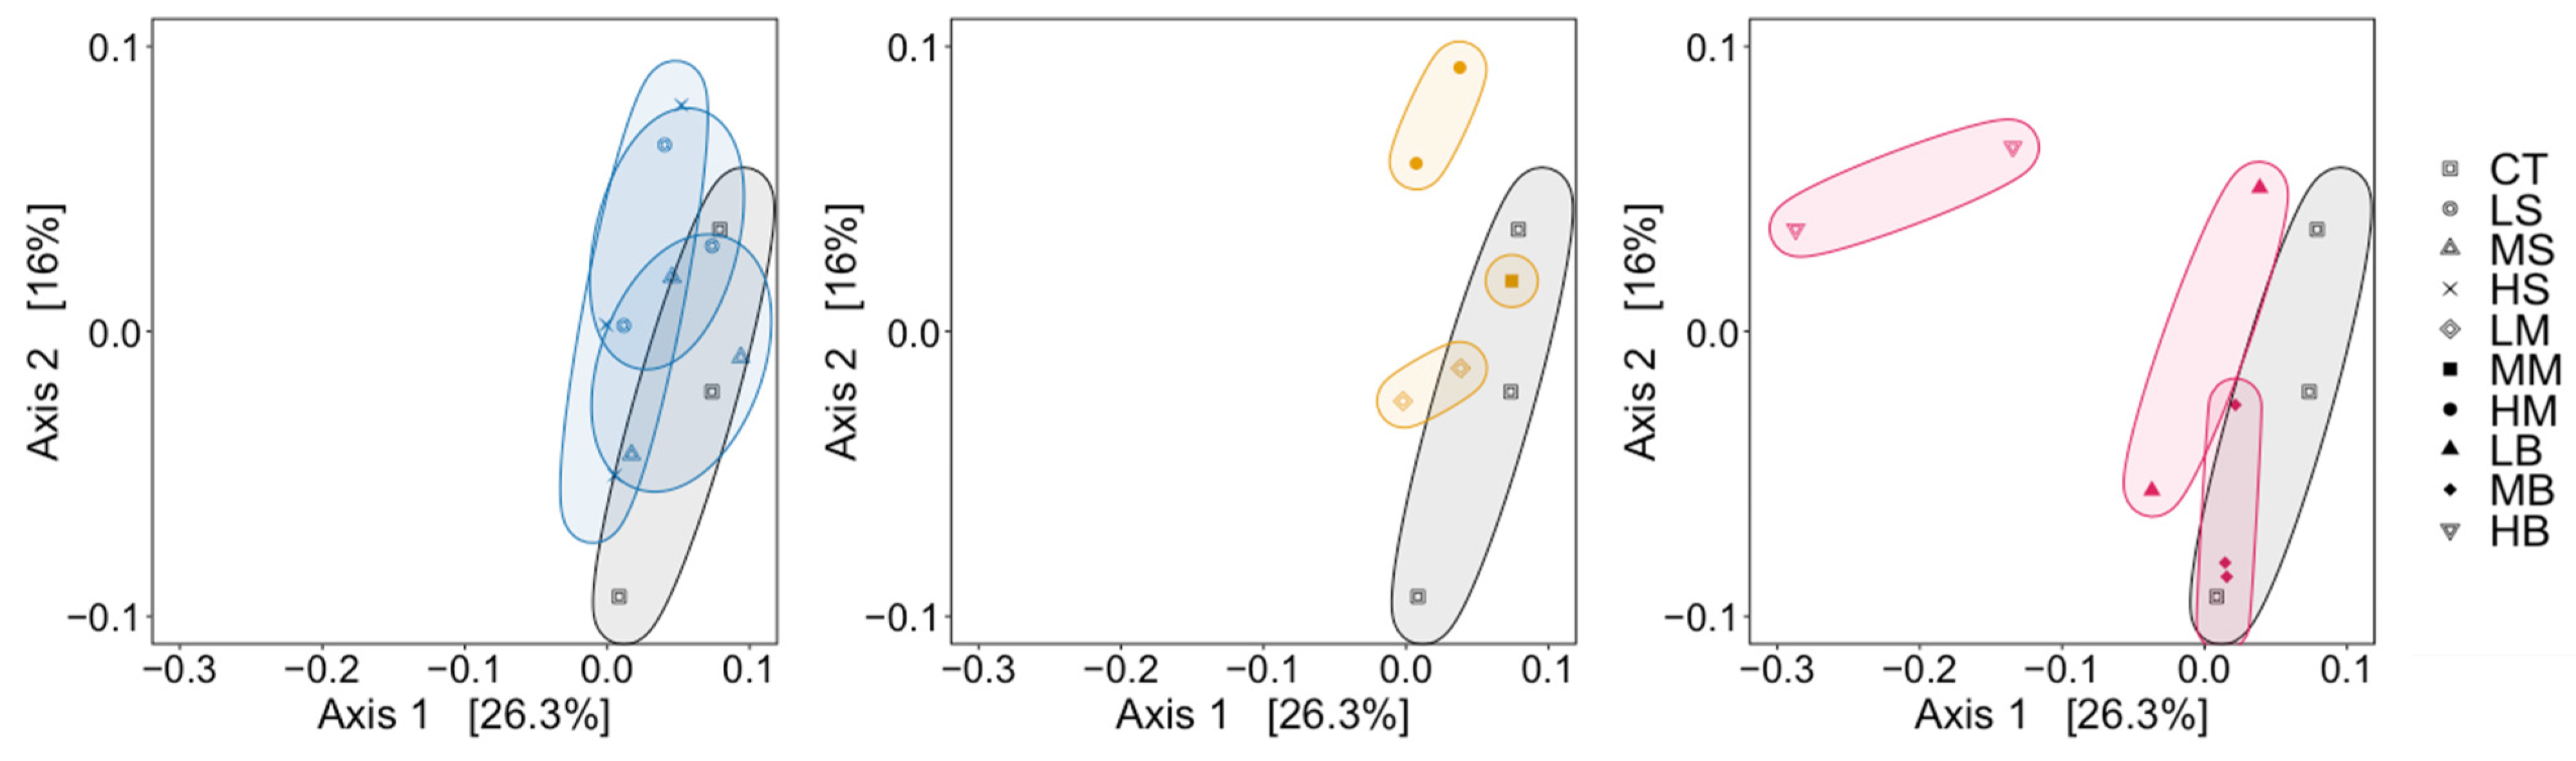
3.3. Dissimilarity Comparisons with Different De-Icers

Shannon’s diversity metric incorporates both the number of taxa and their relative abundance and showed that the road salt treatments remained largely unchanged between the L, M, and H concentrations and CT samples (Figure 7). There was a decrease from an average of 4.67 in CT (and 4.61 in the LB and 4.69 in the MB treatments) to an average of 3.84 in the HB samples. Overall, the latter sample showed the greatest decrease and the only significant change (F value = 4.51, p < 0.002) in alpha diversity compared to CT samples with a 17.6% decrease. Similar results were seen in Chao1 community diversity metrics (which estimate total number of taxa) with relatively insignificant effects, save for the HB samples, which showed an average Chao1 measure of 64.7 compared to 135.6 in CT (p < 0.05), (Figure 7).
Microbiota in the CT, LS, MS, HS, LM, MM, LB, and MB samples shared overlapping ellipses on the PCoA biplot with only HM and HB appearing distinctly (Figure 8 and Figure S4). A total of 63 families showed significant (adjusted p values ≤ 0.05) differences in abundances across treatments according to the global results of the ANCOMBC (Figure S3). The largest differences were observed between CT population compositions compared to HB samples. Alpha diversity showed a variance of 0.03 between the three de-icers at L concentrations, and variances of 0.02 and 0.25 in M and H samples, respectively (Figure 7). For the most part then, high concentrations of the “eco-friendly” de-icers appeared to impact the relative abundance of bacteria that were already present in the lake water.

4. Discussion

Outdoor mesocosm experiments offer a near-ideal experimental paradigm in the testing of contaminants of concern, since they simulate natural environments and allow investigations of complex aquatic communities, rather than single species [57,58]. The understanding of bacterial-community structure in this investigation was facilitated by the judicious selection of primers as well as a blocking sequence that increased the probability that polymerases would use bacterial 16S rRNA gene sequences as templates and not chloroplast DNA. To our knowledge, this combination of primers and blockers have not been previously utilised, but it has allowed the successful assessment of the impact of three different de-icers on bacterial populations. A companion study of these same mesocosms on planktonic invertebrate communities then offered an opportunity for insight into the effect of the different de-icers on the aquatic food web.

4.1. Little Change in Mesocosms after Amendment with Road Salt

Chloride concentration was expected to be a significant driver in mesocosms amended with traditional road salt de-icers, as was previously hypothesised when comparing remote and urban salinized lakes, and which showed that 16S rRNA gene sequence operational taxonomic unit (OTU) distinctions correlated with conductivity and chloride groupings [21]. However, in the lake with the same Cl concentration as our control mesocosm, the majority of taxa were unidentified (50% of the OTUs), as well as in the lake with road salt run-off (149 mg/L at 60% OTUs). It was reported that the relative proportion of Psychrobacter, a genus with salt-resistant members, increased from being rare in the control lake samples to ~9% relative abundance in their melted snow, salt-impacted lake water [21], but this taxon remained below 1% relative abundance in our MS samples with a similar salt concentration. Thus, overall, phylogenetic comparisons with this earlier study are not practical. Nevertheless, in our samples, there was no significant change in the S-amended bacterial community even over the greater (~200-fold) Cl experimental concentration range, as evidenced by PCoA ordinations based on Shannon’s diversity, and at the level of individual genera. Previously, microbial diversity has been reported to be higher in saline lakes compared to freshwater lakes, but this effect has more recently been attributed to lower nutrient availability [59,60]. Since nutrients were added to all mesocosms on a weekly basis at approximately one-third of the nitrogen and phosphate levels in the lake from which water was pumped, this must have been sufficient to counter any apparent increase in Shannon’s diversity.
Individual genera showed few changes in the HS mesocosms, apart from modest decreases in the relative abundance of Ca. Rhodoluna and Limnohabitans, corresponding to minor increases in the relative abundance of rarer genera found in CT samples. The former genus is considered a freshwater taxon, possibly explaining its decline in the HS samples [61]. Notably, Limnohabitans can form symbiotic associations with Daphnia, and several reports including the companion study, noted that mesocosms amended with high concentrations of road salt de-icers showed declines in Daphnia species [25,62,63]. Previously, increases in salt concentration in mesocosms from ~25 to 1500 mg Cl/L were also reported to be associated with declines in zooplankton populations, including cladocerans and copepods that graze on phytoplankton [64,65]. Thus, it is possible that the 6.2-fold increase in chl a in the high S treatments also reflected the negative impact on zooplankton grazers, which in this case appeared to have had only a minor impact on the relative abundance of Limnohabitans in the HS community.

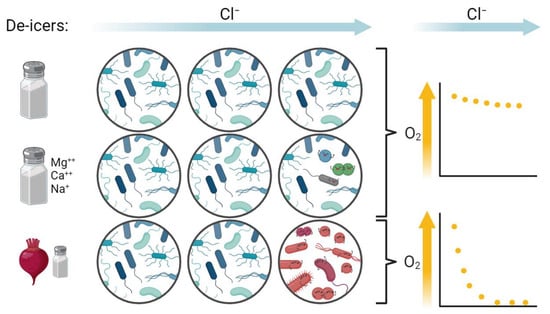
4.2. Shifts in Microbiota at High Concentrations of “Eco-Friendly” De-Icers

In high Cl treatment groups, M-amended mesocosms showed half the increase in chl a compared to the S treatments, possibly due to the associated 50% decline in cladoceran zooplankton grazers at 242 mg Cl/L, and/or the increased abundance of phytoplankton that proliferate in relatively higher salinities [25]. The mixture of several cations (Mg2+, Na+ and Ca2+) in the M formulation might be equally or less toxic than Na+ alone to aquatic invertebrates, according to previous reports [18,66]. Certainly, here, there appeared to be no significant impact to bacterial structure in LM and MM samples. However, although not significant with diversity metrics, at the higher HM concentrations there was some alteration in the community at least as judged using distinctions in the PCoA and phylogenetic analyses (Figure 5, Figure 6 and Figure 8). The source of the salts used in the M de-icer is unknown, but the relative abundance of Flavobacterium increased by ~⅓ to 28% in HM samples over that found in CT samples. Notably, sequences corresponding to Flavobacterium represent ~19% of the DNA found in supermarket-sourced marine salt as well as black salt, and thus this taxon is relatively salt resistant, reasonably explaining its increased dominance, but it could also be a contaminant in the M formulation, with these bacteria showing long-term viability [67,68]. Similarly, the differential abundance analysis showed that the family Xanthobacteraceae had an 8-fold log increase in HM, with the saline-tolerant facultative methylotroph, Ancylobacter, being a major contributor to this change [69]. The relative abundance of Devosia, another Gram− bacterium, was also increased in the HM samples, with members of this taxon known to tolerate brackish conditions [70]. Devosia can be associated with green algae which is consistent with its increased abundance as the chl a levels increased 3.4-fold, serving as a diazotroph by fixing nitrogen, but it can also facilitate the maintenance of ion homeostasis, which may be significant in the mixed salts of the “eco-friendly” de-icer [71,72]. Since members of Devosia can be halophilic and this genus was found at the highest relative abundance in the HM samples, we cannot exclude that it too was a contaminant in the M de-icer formulation. However, the presence of this taxon, at least at low relative abundance in other samples including HS and MB, argues against this. Regardless, the overall modest shifts in taxa associated with the HM treatment suggest that this de-icer, possibly in combination with the lower mesocosm pH, appears to be somewhat more toxic to freshwater bacteria than the HS treatment.
In contrast to bacterial-structure similarity in the majority of the mesocosms (LS, MS, HS, LM, MM, LB, MB) and to a lesser extent in HM, the bacterial community showed a major shift in the HB sample. The irony is that this de-icer, similar to other commercial organic products, is touted as an alternative to road salt and CaCl2 de-icer formulations since it is less corrosive to concrete and is also thought to be less toxic to aquatic organisms. In contrast to the mesocosms amended with high concentrations of S or M de-icers where the chl a concentrations increased several fold, chl a levels in B de-icers were unchanged at the end of the 6-week experimental treatment (Figure 4). Similar to the S- and M-amended mesocosms, phytoplankton production might have been expected to increase at high Cl concentrations, especially since there was a reduction in phytoplankton grazers [25]. However, phytoplankton proliferation could be at least partially counteracted by the darker colour of the de-icer. The relative abundance of Rhodobacter decreased in HB compared to LB and MB samples, and this genus includes members capable of anoxygenic photosynthesis, which would be vulnerable to decreased light. In addition to these changes, the organic material in the de-icer resulted in levels of [K+] that were about 5-fold higher in mesocosms amended with higher B concentrations compared to high concentrations of the S and M formulations. Worldwide, there are few regulations on the levels of K ions in lake water but the HB treatment samples were lower than the natural surface water guidelines for [K+] of 10 mg/L in some jurisdictions, e.g., [73]. Although K ions are critical for the regulation of bacterial pH, osmolarity, signalling, and protein synthesis, high [K+] can result in osmotic stress, resulting in physiological changes in Gram+ bacteria in particular, which can then increase their osmotic potential through the accumulation of compatible solutes [74]. Lake Gram− bacteria such as Flavobacterium, Limnohabitans, Novosphingobrum, and Rhodobacter could then be more vulnerable, and although this question should be addressed in the future, there is evidence that the K ions in beet and beet brine de-icers can disrupt osmoregulation at least in amphipods and planktonic crustaceans, as well as accumulate in larval mussels [75,76].
Although the relatively high [K+], as well as the lower light levels and slightly acidic pH, could present challenges to some lake bacteria, the 68-fold decrease in DO at high levels of the B de-icer was the most striking change (Figure 2). Organic inputs and de-icers formulated with agricultural waste products including beet extracts are well known to result in a high biochemical-oxygen demand when metabolised by microorganisms [77]. Indeed, oxygen levels decreased from 6.8 mg/L in CT to 0.10 mg/L in the HB mesocosms, equivalent to 3.1 µmol/L and classified as suboxic conditions [78]. At such low levels of oxygen, it is not surprising that aerobes, found in CT as well as samples from mesocosms amended with lower concentrations of de-icers and present in temperate lakes, including Ca. Rhodoluna, Corynebacterium, Flavobacterium, Limnohabitans, Novosphingobrum and Rhodobacter, were almost completely displaced by anaerobic or facultative anaerobic genera including Acetobacterium, Agrobacterium, Cloacibacterium, Clostridium, Desulfovibrio, Hydrogenophaga, Paracoccus and Rhodoferax, as well as those thriving in low-oxygen environments, or the microaerophilic Xanthobacter and Sulfurospirillum, and some species of Sphingomonas and Psychrobacter. These genera have all been reported in marine or other saline environments, so they would be viable at the Cl levels in the HB treatment groups. Some of these heterotrophs are physiologically interesting with two of the anaerobic genera, Acetobacterium and Desulfovibrio, forming a symbiotic association for the efficient reduction of sulphate, coincident with the alleviation of CO inhibition [79]. Fermentation of the organic matter in the mesocosms presumably allows Hydrogenophaga to conduct hydrogen oxidation, and denitrification in Paracoccus and C39 (Rhodocyclaceae). Electron acceptors, nitrate and sulphur compounds, for Sulfurospirillum and C39, would be present in HB mesocosms similar to other eutrophic, and urban polluted waterways [80,81,82,83]. Notably, some of the genera identified using their rRNA gene sequences are of practical interest in efforts to anaerobically convert food waste, particularly with high salt levels, into biogas [84,85].

4.3. Implications for Aquatic Food Webs, Prospects, and Practical Considerations

The rationale for formulating “eco-friendly” de-icers with brine and refined beet sugars appears reasonable since the low-molecular-weight organic molecules along with the NaCl contribute to freezing-point depression and consequently their utility in transportation routes. However, the ecological effects of this organic and ion pollution stimulated heterophilic bacterial growth and simultaneously depleted DO, directly affecting the ecosystem, as well as attenuating light levels that in turn possibly impacted phytoplankton, which again could result in an effect on the food web. Although the alternative inorganic de-icer, M, appeared to be less toxic than B, at high levels it still disrupted the bacterial community, possibly due to other cations. In the companion study, both of these newer de-icers were toxic to zooplankton and decreased total abundance [25]. Grazing cladocerans as a group were sensitive to the salinity of S, M, and B de-icers but were most susceptible to the B treatment, whereas the omnivorous cyclopoid copepods, some of which can tolerate low DO [86,87], did relatively better in the B-amended mesocosms, presumably due to the increased nutrients supporting higher trophic levels. Rotifer populations were relatively unimpacted by the de-icer amendments.
It is generally assumed that although the addition of organic by-products such as beet or corn extracts to de-icers can decrease DO and lead to ecosystem disruption, it is temporary until heterophilic bacteria ferment the product, e.g., [26]. This could be true for lower concentrations of organic materials since the DO in the mesocosms making up the LB samples recovered three weeks after the start of the experiments, and after 6 weeks DO increases moved towards control levels in the mesocosms contributing to the MB samples (Figure 3). These model ecosystems with lower Cl levels, therefore, appeared to be resistant to permanent change; given sufficient time, recovery with a return to the CT bacterial community might be expected. However, there was no indication of any DO increase in the mesocosms contributing to the HB samples over the 6-week monitoring period. Worryingly, mesocosms amended with lower B concentrations, at levels significantly less than government-set acute toxicity thresholds [8,9], also did not recover with respect to DO over the course of the experiment. We thus posit that at high concentrations of this de-icer, the ecosystem shifted across a threshold to a new stable state and bacterial-community diversity decreased to the point where recovery of the HB mesocosms may be unlikely without intervention. Although some examples of environmental changes that orchestrate a dramatic shift to a new state, reinforced by positive feedback mechanisms, do not satisfy rigorous criteria, freshwater lake monitoring and experimental laboratory treatments are compelling [88,89,90,91]. Here, the identification of DO-compatible taxa including mutualistic relationships in the HB samples suggests a new ecological paradigm. Although legacy sediments and continuous input in shallow freshwater lakes could presumably buffer such impact, a cautious recommendation to avoid ecosystem disruption would be to monitor lakes heavily impacted by anthropogenic amendments for Cl and DO to ensure that the tipping point is not reached. Monitoring change with zooplankton is intensive, but depending on the group may not be sufficiently sensitive, and assessments of bacterial structures are important but may not provide sufficient warning of impending turnover.
Despite the overall warming of our planet, climate change is associated with increasingly frequent freeze–thaw cycles, and this, along with urbanisation, will inevitably result in a need for more de-icer applications along transportation routes, resulting in predictably greater run-off. Although we applaud the sentiment behind the replacement of traditional road salt with less-environmentally-damaging or “eco-friendly” de-icers, it is important to sound the alarm that the alternative de-icers used here, and particularly the organic beet brine de-icer, appears to have more negative impacts than the traditional road salts that they were intended to replace. Even road salt is not the answer with freshwater-salinity syndrome being of increasing concern [16,17]. Ultimately, it is unfortunate that the skirmishes and anguish over salt that have occurred for over 450 years are not over yet.

Supplementary Materials

The following supporting information can be downloaded at: https://www.mdpi.com/article/10.3390/w16030426/s1, File S1: All scripts and code used; Figure S1: Mesocosm cation concentrations against chloride concentrations; Figure S2: Mesocosm conductivity changes; Figure S3: Heat map of differentially abundant microbial families in mesocosms. Figure S4: Single PCoA biplot based on Shannon diversity.

Author Contributions

Conceptualization and methodology, T.A.M., S.E.A. and V.K.W.; investigation: T.A.M.; formal analysis, T.A.M., C.L.J. and T.H.; data curation, T.A.M. and C.L.J.; writing—original draft preparation, V.K.W. and T.A.M.; writing—review and editing, T.A.M., S.E.A., C.L.J., T.H. and V.K.W.; supervision, S.E.A. and V.K.W. All authors have read and agreed to the published version of the manuscript.

Funding

This research was funded by Natural Sciences and Engineering Research Council (Canada) Discovery grants to S.E.A. and V.K.W.

Data Availability Statement

The data presented in this study are openly available in the European Bioinformatics Institute (EBI) European Genome-Phenome Archive (ENA) database under study accession number ERP155670 and project accession number PRJEB70767 at https://www.ebi.ac.uk/ena/browser/view/PRJEB70767 (uploaded on 30 November 2023).

Acknowledgments

The authors acknowledge the continued support of Scot Dowd of MR DNA (Shallowater, TX) and G. diCenzo (Queen’s University) for making V.K.W. welcome in his laboratory. T.A.M. also thanks Corbin Montminy for field assistance.

Conflicts of Interest

The authors declare no conflicts of interest.

References

  1. Environment and Climate Change Canada. Code of Practice for the Environmental Management of Road Salts. 2004. Available online: https://canadagazette.gc.ca/rp-pr/p1/2004/2004-04-03/pdf/g1-13814.pdf (accessed on 18 August 2023).
  2. Bolen, W.P. Mineral Commodity Summaries, January 2022. U.S. Geological Survey. 2022. Available online: https://pubs.usgs.gov/periodicals/mcs2022/mcs2022-salt.pdf (accessed on 22 November 2023).
  3. D’Itri, F.M. Chemical Deicers and the Environment; Lewis Publishers: Boca Raton, FL, USA, 1992. [Google Scholar]
  4. Findlay, S.E.G.; Kelly, V.R. Emerging indirect and long-term road salt effects on ecosystems. Ann. N. Y. Acad. Sci. 2011, 1223, 58–68. [Google Scholar] [CrossRef] [PubMed]
  5. Nazari, M.H.; Mousavi, S.Z.; Potapova, A.; McIntyre, J.; Shi, X. Toxicological impacts of roadway deicers on aquatic resources and human health: A Review. Water Environ. Res. 2021, 93, 1855–1881. [Google Scholar] [CrossRef]
  6. Haake, D.M.; Krchma, S.; Meyners, C.W.; Virag, R. Impacts of urbanization on chloride and stream invertebrates: A 10-year citizen science field study of road salt in stormwater runoff. Integr. Environ. Assess. Manag. 2022, 18, 1667–1677. [Google Scholar] [CrossRef]
  7. Wersebe, M.J.; Weider, L.J. Resurrection genomics provides molecular and phenotypic evidence of rapid adaptation to salinization in a keystone aquatic species. Proc. Natl. Acad. Sci. USA 2023, 120, e2217276120. [Google Scholar] [CrossRef] [PubMed]
  8. Canadian Council of Ministers of the Environment. Canadian Water Quality Guidelines for the Protection of Aquatic Life: Chloride. 2011. Available online: https://ccme.ca/fr/res/2011-chloride-ceqg-scd-1460-en.pdf (accessed on 18 August 2023).
  9. US EPA. Ambient Water Quality Criteria for Chloride. 1988. Available online: https://www.epa.gov/sites/default/files/2018-08/documents/chloride-aquatic-life-criteria-1988.pdf (accessed on 18 August 2023).
  10. Nutile, S.A.; Solan, M.E. Toxicity testing of “eco-friendly” de-icing formulations using Chironomus dilutus. Environ. Pollut. 2019, 246, 408–413. [Google Scholar] [CrossRef] [PubMed]
  11. Szklarek, S.; Górecka, A.; Salabert, B.; Wojtal-Frankiewicz, A. Acute toxicity of seven de-icing salts on four zooplankton species—Is there an “eco-friendly” alternative? Ecohydrol. Hydrobiol. 2022, 22, 589–597. [Google Scholar] [CrossRef]
  12. Hintz, W.D.; Relyea, R.A. A review of the species, community, and ecosystem impacts of road salt salinisation in fresh waters. Freshwater Biol. 2019, 64, 1081–1097. [Google Scholar] [CrossRef]
  13. Lancaster, N.A.; Bushey, J.T.; Tobias, C.R.; Song, B.; Vadas, T.M. Impact of chloride on denitrification potential in roadside wetlands. Environ. Pollut. 2016, 212, 216–223. [Google Scholar] [CrossRef]
  14. Szklarek, S.; Górecka, A.; Wojtal-Frankiewicz, A. The effects of road salt on freshwater ecosystems and solutions for mitigating chloride pollution—A review. Sci. Total Environ. 2021, 805, 150289. [Google Scholar] [CrossRef]
  15. Pan, Y.; She, D.; Shi, Z.; Cao, T.; Xia, Y.; Shan, J. Salinity and high pH reduce denitrification rates by inhibiting denitrifying gene abundance in a saline-alkali soil. Sci. Rep. 2023, 13, 2155. [Google Scholar] [CrossRef]
  16. Kaushal, S.S.; Likens, G.E.; Pace, M.L.; Utz, R.M.; Haq, S.; Gorman, J.; Grese, M. Freshwater salinization syndrome on a continental scale. Proc. Natl. Acad. Sci. USA 2018, 115, E574–E583. [Google Scholar] [CrossRef]
  17. Kaushal, S.S.; Reimer, J.E.; Mayer, P.M.; Shatkay, R.R.; Maas, C.M.; Nguyen, W.D.; Boger, W.L.; Yaculak, A.M.; Doody, T.R.; Pennino, M.J.; et al. Freshwater salinization syndrome alters retention and release of chemical cocktails along flowpaths: From stormwater management to urban streams. Freshw. Sci. 2022, 41, 420–441. [Google Scholar] [CrossRef]
  18. Lee, B.D.; Choi, Y.S.; Kim, Y.G.; Kim, I.S.; Yang, E.I. A Comparison Study of Performance and Environmental Impacts of Chloride-Based Deicers and Eco-Label Certified Deicers in South Korea. Cold Reg. Sci. Technol. 2017, 143, 43–51. [Google Scholar] [CrossRef]
  19. Schuler, M.S.; Relyea, R.A. Road Salt and organic additives affect mosquito growth and survival: An emerging problem in wetlands. Oikos 2018, 127, 866–874. [Google Scholar] [CrossRef]
  20. Pecher, W.T.; Emad Al Madadha, M.; DasSarma, P.; Ekulona, F.; Schott, E.J.; Crowe, K.; Gut, B.S.; DasSarma, S. Effects of road salt on microbial communities: Halophiles as biomarkers of road salt pollution. PLoS ONE 2019, 14, e0221355. [Google Scholar] [CrossRef] [PubMed]
  21. Fournier, I.B.; Lovejoy, C.; Vincent, W.F. Road salt versus urban snow effects on lake microbial communities. Microorganisms 2022, 10, 803. [Google Scholar] [CrossRef]
  22. Strayer, D.L.; Dudgeon, D. Freshwater biodiversity conservation: Recent progress and future challenges. J. N. Am. Benthol. Soc. 2010, 29, 344–358. [Google Scholar] [CrossRef]
  23. Pereda, O.; Solagaistua, L.; Atristain, M.; de Guzmán, I.; Larrañaga, A.; von Schiller, D.; Elosegi, A. Impact of wastewater effluent pollution on stream functioning: A whole-ecosystem manipulation experiment. Environ. Pollut. 2020, 258, 113719. [Google Scholar] [CrossRef]
  24. Nott, M.A.; Driscoll, H.E.; Takeda, M.; Vangala, M.; Corsi, S.R.; Tighe, S.W. Advanced biofilm analysis in streams receiving organic deicer runoff. PLoS ONE 2020, 15, e0227567. [Google Scholar] [CrossRef]
  25. Martin, T. Assessing the Effects of “Eco-Friendly” Road De-Icer Alternatives on Freshwater Plankton Communities. Masters Thesis, Queen’s University, Kingston, ON, Canada, 2023. Available online: https://qspace.library.queensu.ca/items/626de799-3360-451f-ae79-358914273be8 (accessed on 25 December 2023).
  26. Fay, L.; Shi, X. Environmental impacts of chemicals for snow and ice control: State of the knowledge. Water Air Soil Pollut. 2012, 223, 2751–2770. Available online: https://go.gale.com/ps/i.do?p=AONE&u=anon~62105e98&id=GALE|A360119818&v=2.1&it=r&sid=googleScholar&asid=1b29bb16 (accessed on 10 December 2023). [CrossRef]
  27. Kelly, V.R.; Findlay, S.E.; Weathers, K.C. Road Salt: The Problem, the Solution, and How to Get There; Cary Institute of Ecosystem Studies: Millbrook, NY, USA, 2019. [Google Scholar]
  28. Health Canada. Hazardous Products Regulations, 2019. Available online: https://laws-lois.justice.gc.ca/PDF/SOR-2015-17.pdf (accessed on 18 August 2023).
  29. Sorichetti, R.J.; Raby, M.; Holeton, C.; Benoit, N.; Carson, L.; DeSellas, A.; Diep, N.; Edwards, B.A.; Howell, T.; Kaltenecker, G.; et al. Chloride trends in Ontario’s surface and groundwaters. J. Great Lakes Res. 2022, 48, 512–525. [Google Scholar] [CrossRef]
  30. Lawson, L.; Jackson, D.A. Salty summertime streams—Road salt contaminated watersheds and estimates of the proportion of impacted species. Facets 2021, 6, 317–333. [Google Scholar] [CrossRef]
  31. Kreyling, J.; Schweiger, A.H.; Bahn, M.; Ineson, P.; Migliavacca, M.; Morel-Journel, T.; Christiansen, J.R.; Schtickzelle, N.; Larsen, K.S. To replicate, or not to replicate—That is the question: How to tackle nonlinear responses in ecological experiments. Ecol. Lett. 2018, 21, 1629–1638. [Google Scholar] [CrossRef] [PubMed]
  32. Downing, A.L.; Brown, B.L.; Perrin, E.M.; Keitt, T.H.; Leibold, M.A. Environmental fluctuations induce scale-dependent compensation and increase stability in plankton ecosystems. Ecology 2008, 89, 3204–3214. [Google Scholar] [CrossRef] [PubMed]
  33. Hanshew, A.S.; Mason, C.J.; Raffa, K.F.; Currie, C.R. Minimization of chloroplast contamination in 16S rRNA gene pyrosequencing of insect herbivore bacterial communities. J. Microbiol. Methods 2013, 95, 149–155. [Google Scholar] [CrossRef] [PubMed]
  34. Fitzpatrick, C.R.; Lu-Irving, P.; Copeland, J.; Guttman, D.S.; Wang, P.W.; Baltrus, D.A. Chloroplast sequence variation and the efficacy of peptide nucleic acids for blocking host amplification in plant microbiome studies. Microbiome 2018, 6, 144. [Google Scholar] [CrossRef] [PubMed]
  35. Bolyen, E.; Rideout, J.R.; Dillon, M.R.; Bokulich, N.A.; Abnet, C.C.; Al-Ghalith, G.A.; Caporaso, J.G. Reproducible, interactive, scalable and extensible microbiome data science using QIIME 2. Nat. Biotechnol. 2019, 37, 852–857. [Google Scholar] [CrossRef] [PubMed]
  36. R Core Team. R: A Language and Environment for Statistical Computing; R Foundation for Statistical Computing: Vienna, Austria, 2021; Available online: https://www.R-project.org/ (accessed on 21 July 2023).
  37. McMurdie, P.J.; Holmes, S. Phyloseq: An R Package for Reproducible Interactive Analysis and Graphics of Microbiome Census Data. PLoS ONE 2013, 8, e61217. [Google Scholar] [CrossRef] [PubMed]
  38. Shannon, C.E.; Weaver, W. The Mathematical Theory of Communication; University of Illinois Press: Urbana, IL, USA, 1949. [Google Scholar]
  39. Chao, A. Nonparametric estimation of the number of classes in a population. Scand. J. Stat. 1984, 11, 265–270. Available online: https://www.jstor.org/stable/4615964 (accessed on 16 December 2023).
  40. Lin, H.; Peddada, S.D. Analysis of compositions of microbiomes with bias correction. Nat. Commun. 2020, 11, 3514. [Google Scholar] [CrossRef]
  41. Wickham, H.; François, R.; Henry, L.; Müller, K.; Vaughan, D. dplyr: A Grammar of Data Manipulation (R Package Version 1.1.0). 2023. Available online: https://CRAN.R-project.org/package=dplyr (accessed on 21 July 2023).
  42. Wickham, H. ggplot2: Elegant Graphics for Data Analysis; Springer: New York, NY, USA, 2016; ISBN 978-3-319-24277-4. Available online: https://ggplot2.tidyverse.org (accessed on 21 July 2023).
  43. Wickham, H.; Chang, W.; Henry, L.; Pedersen, T.L.; Takahashi, K.; Wilke, C.; Woo, K.; Yutani, H.; Dunnington, D. ggplot2: Create Elegant Data Visualisations Using the Grammar of Graphics (R Package Version 3.4.1). 2023. Available online: https://cran.r-project.org/web/packages/ggplot2/ggplot2.pdf (accessed on 21 July 2023).
  44. Wood, S. Fast stable restricted maximum likelihood and marginal likelihood estimation of semiparametric generalized linear models. J. R. Stat. Soc. Ser. B Stat. Methodol. 2011, 73, 3–36. [Google Scholar] [CrossRef]
  45. Wood, S. Mixed GAM Computation Vehicle with Automatic Smoothness Estimation. R Package Version 1.8-42. Available online: https://cran.r-project.org/web/packages/mgcv/mgcv.pdf (accessed on 21 July 2023).
  46. Fox, J.; Weisberg, S. An R Companion to Applied Regression, 3rd ed.; Sage: Thousand Oaks, CA, USA, 2019; Available online: https://socialsciences.mcmaster.ca/jfox/Books/Companion/ (accessed on 21 July 2023).
  47. Fox, J.; Weisberg, S.; Price, B. Car: Companion to Applied Regression. R Package Version 3.1-1. 2023. Available online: https://cran.r-project.org/web/packages/car/index.html (accessed on 21 July 2023).
  48. Bartoń, K. MuMIn: Multi-Model Inference. R Package Version 1.46.0. 2022. Available online: https://CRAN.R-project.org/package=MuMIn (accessed on 21 July 2023).
  49. Venables, W.N.; Ripley, B.D. Modern Applied Statistics with S; Springer: New York, NY, USA, 2002; ISBN 0-387-95457-0. Available online: https://www.stats.ox.ac.uk/pub/MASS4/ (accessed on 21 July 2023).
  50. Ripley, B. MASS: Support Functions and Datasets for Venables and Ripley’s MASS. R Package Version 7.3-58.2. 2023. Available online: https://cran.r-project.org/web/packages/MASS/index.html (accessed on 21 July 2023).
  51. McKnight, M.M.; Qu, Z.; Copeland, J.K.; Guttman, D.S.; Walker, V.K. A practical assessment of nano-phosphate on soybean (Glycine max) growth and microbiome establishment. Sci. Rep. 2020, 10, 9151. [Google Scholar] [CrossRef]
  52. Juurakko, C.L.; diCenzo, G.C.; Walker, V.K. Cold acclimation in Brachypodium is accompanied by changes in above-ground bacterial and fungal communities. Plants 2021, 10, 2824. [Google Scholar] [CrossRef]
  53. Newton, R.J.; Jones, S.E.; Eiler, A.; McMahon, K.D.; Bertilsson, S. A guide to the natural history of freshwater lake bacteria. Microbiol. Mol. Biol. 2011, 75, 14–49. [Google Scholar] [CrossRef]
  54. Kurilkina, M.I.; Zakharova, Y.R.; Galachyants, Y.P.; Petrova, D.P.; Bukin, Y.S.; Domysheva, V.M.; Blinov, V.V.; Likhoshway, Y.V. Bacterial community composition in the water column of the deepest freshwater Lake Baikal as determined by next-generation sequencing. FEMS Microbiol. Ecol. 2016, 92, fiw094. [Google Scholar] [CrossRef]
  55. Ferrera, I.; Sarmento, H.; Priscu, J.C.; Chiuchiolo, A.; González, J.M.; Grossart, H.P. Diversity and distribution of freshwater aerobic anoxygenic phototrophic bacteria across a wide latitudinal gradient. Front. Microbiol. 2017, 8, 175. [Google Scholar] [CrossRef]
  56. Paruch, L.; Paruch, A.M.; Eiken, H.G.; Sørheim, R. Faecal pollution affects abundance and diversity of aquatic microbial community in anthropo-zoogenically influenced lotic ecosystems. Sci. Rep. 2019, 9, 19469. [Google Scholar] [CrossRef] [PubMed]
  57. Stewart, R.I.; Dossena, M.; Bohan, D.A.; Jeppesen, E.; Kordas, R.L.; Ledger, M.E.; Meerhoff, M.; Moss, B.; Mulder, C.; Shurin, J.B.; et al. Mesocosm experiments as a tool for ecological climate-change research. Adv. Ecol. Res. 2013, 48, 71–181. [Google Scholar] [CrossRef]
  58. Cañedo-Argüelles, M.; Hawkins, C.P.; Kefford, B.J.; Schäfer, R.B.; Dyack, B.J.; Brucet, S.; Buchwalter, D.; Dunlop, J.; Frör, O.; Lazorchak, J.; et al. Saving freshwater from salts. Science 2016, 351, 914–916. [Google Scholar] [CrossRef] [PubMed]
  59. Lozupone, C.A.; Knight, R. Global patterns in bacterial diversity. Proc. Natl. Acad. Sci. USA 2007, 104, 11436–11440. [Google Scholar] [CrossRef]
  60. Yue, L.; Kong, W.; Ji, M.; Liu, J.; Morgan-Kiss, R.M. Community response of microbial primary producers to salinity is primarily driven by nutrients in lakes. Sci. Total Environ. 2019, 696, 134001. [Google Scholar] [CrossRef]
  61. Hahn, M.W. Description of seven candidate species affiliated with the phylum Actinobacteria, representing planktonic freshwater bacteria. Int. J. Syst. Evol. Microbiol. 2009, 59, 112. [Google Scholar] [CrossRef]
  62. Peerakietkhajorn, S.; Kato, Y.; Kasalický, V.; Matsuura, T.; Watanabe, H. Betaproteobacteria Limnohabitans strains increase fecundity in the crustacean Daphnia magna: Symbiotic relationship between major bacterioplankton and zooplankton in freshwater Ecosystem. Environ. Microbiol. 2016, 18, 2366–2374. [Google Scholar] [CrossRef]
  63. Salcher, M.M.; Šimek, K. Isolation and cultivation of planktonic freshwater microbes Is essential for a comprehensive understanding of their ecology. Aquat. Microb. Ecol. 2016, 77, 183–196. [Google Scholar] [CrossRef]
  64. Hintz, W.D.; Arnott, S.E.; Symons, C.C.; Greco, D.A.; McClymont, A.; Brentrup, J.A.; Weyhenmeyer, G.A. Current water quality quidelines across North America and Europe do not protect lakes from salinization. Proc. Natl. Acad. Sci. USA 2022, 119, e2115033119. [Google Scholar] [CrossRef] [PubMed]
  65. Hébert, M.P.; Symons, C.C.; Cañedo-Argüelles, M.; Arnott, S.E.; Derry, A.M.; Fugère, V.; Beisner, B.E. Lake salinization drives consistent losses of zooplankton abundance and diversity across coordinated mesocosm Eexperiments. Limnol. Oceanogr. 2023, 8, 19–29. [Google Scholar] [CrossRef]
  66. Erickson, R.J.; Mount, D.R.; Highland, T.L.; Hockett, J.R.; Hoff, D.J.; Jenson, C.T.; Norberg-King, T.J.; Peterson, K.N. The acute toxicity of major ion salts to Ceriodaphnia dubia. II. Empirical relationships in binary salt mixtures. Environ. Toxicol. Chem. 2017, 36, 1525–1537. [Google Scholar] [CrossRef] [PubMed]
  67. Satari, L.; Guillén, A.; Latorre-Pérez, A.; Porcar, M. Beyond archaea: The table salt bacteriome. Front. Microbiol. 2021, 12, 714110. [Google Scholar] [CrossRef]
  68. Shoemaker, W.R.; Jones, S.E.; Muscarella, M.E.; Behringer, M.G.; Lehmkuhl, B.K.; Lennon, J.T. Microbial population dynamics and evolutionary outcomes under extreme energy limitation. Proc. Natl. Acad. Sci. USA 2021, 118, e2101691118. [Google Scholar] [CrossRef]
  69. Dixon, J.L.; Sargeant, S.; Nightingale, P.D.; Colin Murrell, J. Gradients in microbial methanol uptake: Productive coastal upwelling waters to oligotrophic gyres in the Atlantic Ocean. ISME J. 2013, 7, 568–580. [Google Scholar] [CrossRef] [PubMed]
  70. Bell, T.A.; Prithiviraj, B.; Wahlen, B.D.; Fields, M.W.; Peyton, B.M. A lipid-accumulating alga maintains growth in outdoor, alkaliphilic raceway pond with mixed microbial communities. Front. Microbiol. 2016, 6, 1480. [Google Scholar] [CrossRef] [PubMed]
  71. Byappanahalli, M.N.; Nevers, M.B.; Przybyla-Kelly, K.; Ishii, S.; King, T.L.; Aunins, A.W. Great lakes cadophora harbors phylogenetically diverse nitrogen-fixing microorganisms. Environ. DNA 2019, 1, 186–195. [Google Scholar] [CrossRef]
  72. Monjezi, N.; Yaghoubian, I.; Smith, D.L. Cell-free supernatant of Devosia sp. (Strain SL43) mitigates the adverse effects of salt stress on soybean (Glycine max L.) seed vigor index. Front. Plant Sci. 2023, 14, 1071346. [Google Scholar] [CrossRef]
  73. Bureau of Indian Standards (BIS). Bureau of Indian Standards Specification for Drinking Water. 2003. Available online: https://law.resource.org/pub/in/bis/S06/is.10500.1991.pdf (accessed on 10 December 2023).
  74. Sleator, R.D.; Hill, C. Bacterial osmoadaptation: The role of osmolytes in bacterial stress and virulence. FEMS Microbiol. Rev. 2002, 26, 49–71. [Google Scholar] [CrossRef] [PubMed]
  75. Gillis, P.L.; Salerno, J.; Bennett, C.J.; Kudla, Y.; Smith, M. The relative toxicity of road salt alternatives to freshwater mussels; Examining the potential risk of eco-friendly de-icing products to sensitive aquatic species. ACS ES&T Water 2021, 1, 1628–1636. [Google Scholar] [CrossRef]
  76. Picinic, B.; Durant, A.; Donini, A. Effect of salt and brine-beet juice de-Icer on osmoregulatory physiology of the freshwater smphipod Hyalella azteca (Saussure, 1858) (Amphipoda: Hyalellidae). J. Crustacean Biol. 2022, 42, ruac025. [Google Scholar] [CrossRef]
  77. Terry, L.G.; Conaway, K.; Rebar, J.; Graettinger, A.J. Alternative deicers for winter road maintenance—A review. Water Air Soil Pollut. 2020, 231, 394. [Google Scholar] [CrossRef]
  78. Berg, J.S.; Ahmerkamp, S.; Pjevac, P.; Hausmann, B.; Milucka, J.; Kuypers, M.M.M. How low can they go? Aerobic respiration by microorganisms under apparent anoxia. FEMS Microbiol. Rev. 2022, 46, fuac006. [Google Scholar] [CrossRef]
  79. van Houten, R.T.; Lettinga, G. Biological Sulphate Reduction with Synthesis Gas: Microbiology and Technology. In Immobilized Cells: Basics and Applications; Buitelaar, R.M., Bucke, C., Tramper, J., Wijffels, R.H., Eds.; Elsevier: Amsterdam, The Netherlands, 1996. [Google Scholar] [CrossRef]
  80. Jankowski, K.; Schindler, D.E.; Horner-Devine, M.C. Resource availability and spatial heterogeneity control bacterial community response to nutrient enrichment in lakes. PLoS ONE 2014, 9, e86991. [Google Scholar] [CrossRef]
  81. Newton, R.J.; McLellan, S.L. A unique assemblage of cosmopolitan freshwater bacteria and higher community diversity differentiate an urbanized estuary from oligotrophic Lake Michigan. Front. Microbiol. 2015, 6, 1028. [Google Scholar] [CrossRef]
  82. Goris, T.; Diekert, G. The Genus Sulfurospirillum. In Organohalide-Respiring Bacteria; Adrian, L., Löffler, F., Eds.; Springer: Berlin/Heidelberg, Germany, 2016. [Google Scholar] [CrossRef]
  83. Wang, Y.; Guo, M.; Li, X.; Liu, G.; Hua, Y.; Zhao, J.; Huguet, A.; Li, S. Shifts in microbial communities in shallow lakes depending on trophic states: Feasibility as an evaluation index for eutrophication. Ecol. Indic. 2022, 136, 108691. [Google Scholar] [CrossRef]
  84. Qu, X.; Zeng, H.; Gao, Y.; Mo, T.; Li, Y. Bio-hydrogen production by dark anaerobic fermentation of organic wastewater. Front. Chem. 2022, 10, 978907. [Google Scholar] [CrossRef] [PubMed]
  85. Sharma, P.; Bano, A.; Singh, S.P.; Dubey, N.K.; Chandra, R.; Iqbal, H.M. Recent advancements in microbial-assisted remediation strategies for toxic contaminants. Clean. Chem. Eng. 2022, 2, 100020. [Google Scholar] [CrossRef]
  86. Davis, J.C. Minimal dissolved oxygen requirements of aquatic life with emphasis on Canadian species: A review. J. Fish. Res. Board Can. 1975, 32, 2295–2332. [Google Scholar] [CrossRef]
  87. Breitburg, D.L.; Loher, T.; Pacey, C.A.; Gerstein, A. Varying effects of low dissolved oxygen on trophic interactions in an estuarine food web. Ecol. Monogr. 1997, 67, 489–507. [Google Scholar] [CrossRef]
  88. Schaeffer, M.; Carpenter, S.; Foley, J.; Folke, C.; Walker, B. Catastrophic shifts in ecosystems. Nature 2001, 413, 591–596. [Google Scholar] [CrossRef] [PubMed]
  89. Li, Y.; Liu, Y.; Zhao, L.; Hastings, A.; Guo, H. Exploring change of internal nutrients cycling in a shallow lake: A dynamic nutrient driven phytoplankton model. Ecol. Model. 2015, 313, 137–148. [Google Scholar] [CrossRef]
  90. Janssen, A.B.G.; Hilt, S.; Kosten, S.; de Klein, J.J.M.; Paerl, H.W.; van de Waal, D.B. Shifting states, shifting services: Linking regime shifts to changes in ecosystem services of shallow lakes. Freshw. Biol. 2020, 66, 1–12. [Google Scholar] [CrossRef]
  91. Fujita, H.; Ushio, M.; Suzuki, K.; Abe, M.S.; Yamamichi, M.; Iwayama, K.; Canarini, A.; Hayashi, I.; Fukushima, K.; Fukuda, S.; et al. Alternative stable states, nonlinear behavior, and predictability of microbiome dynamics. Microbiome 2023, 11, 63. [Google Scholar] [CrossRef]
Figure 1. A gradient design was selected to establish 20 mesocosms with an increasing experimentally determined chloride concentration, ranging from 6 mg Cl/L (lake water controls) to a nominal 1453 mg Cl/L for each of three de-icers. The chloride concentration, pH, temperature and dissolved oxygen were monitored weekly, and nutrients were maintained at levels just below those reported for regional lakes. To establish triplicate samples for DNA analyses, aliquots (indicated by the blue circles) were taken three times from each of three mesocosms amended with low concentrations of each de-icer for a nominal mean of 43.6 Cl/mg/mL (experimental mean of 30 mg Cl/L for the road salt de-icer, 30 mg Cl/L for the mixed-salt de-icer and 39 mg Cl/L for the beet brine de-icer), medium concentrations for a nominal mean of 186 mg Cl/L (experimental mean of 161 mg Cl/L for the road salt de-icer, 179 mg Cl/L for the mixed-salt de-icer and 165 mg Cl/L for the beet brine de-icer) and high concentrations for a nominal mean of 1199 mg Cl/L (experimental mean of 1059 mg Cl/L for the road salt de-icer, 1245 mg Cl/L for the mixed-salt de-icer and 1005 mg Cl/L for the beet brine de-icer). Three mesocosms (6 mg Cl/L) that did not contain de-icers served as controls for a total of 30 samples used for DNA purification. Physical properties and zooplankton assessments were completed for all 60 individual mesocosms.
Water 16 00426 g001
Figure 5. Stacked bar graph showing the mean relative abundance of reads (≥1%) observed for different genera associated with lake water sampled from mesocosms after 6 weeks of amendment with low (L), medium (M), and high (H) concentrations of three different de-icers, including road salt (S), a mixed-salt inorganic treatment (M), a beet organic treatment (B), and no treatment (control; CT). The upper beige portions of the bars includes all genera that made up less than 1% of the total data set.
Water 16 00426 g005
Figure 6. Bubble plots showing the mean relative abundance of reads (≥ 3%) observed for different genera and their phylum associations found in lake water sampled from mesocosms after 6 weeks of amendment with three different de-icers, including road salt (S, blue bubbles), mixed-salt treatment (M, orange), beet organic treatment (M, red), and no treatment controls (CT, dark grey bubbles) with each de-icer at low (L), medium (M), and high (H) concentrations, indicated by an increasing colour intensity, respectively. Phyla associations are shown as different colours along the Y-axis with Actinobacteria in blue, Bacillota in green, Bacteroidota in cyan, Firmicutes in gold, Proteobacteria in pink, and Pseudomonadota in purple. Genera corresponding to <3% average relative abundance are not shown.
Water 16 00426 g006
Figure 7. Alpha diversity metrics of Shannon diversity (left panel) and Chao1 assessment of community evenness and richness (right panel), respectively. Black boxes and associated whiskers represent controls (CT), blue represents the road salt de-icer treatments (S), orange represents the mixed-salt inorganic treatments (M), and red represents the beet organic treatments (B), at low (L), medium (M), and high (H) concentrations of each de-icer. Small letters above the box whiskers display significance groupings for p < 0.01 and p < 0.05 for Shannon diversity and Chao1, respectively, as determined with one-way ANOVA and post hoc Tukey’s HSD tests.
Water 16 00426 g007
Figure 8. PCoA biplot based on Shannon diversity of ASVs ≥ 0.1% relative abundance, showing the impact of road salt in triplicate samples representing mesocosms amended at three different concentrations of three different de-icers. Samples included low (L), medium (M), and high (H) concentrations of road salt (S; left panel blue ellipses, with open circles for L, open triangles for M and x symbols for H), mixed inorganic salts (M; middle panel orange ellipses, with open triangles for L, filled boxes for M and filled circles for H), as well as organic beet samples (B; right panel red ellipses, with filled triangles for L, filled diamonds for M and the nabla for H). Controls (CT) containing no added de-icers are represented by grey ellipses with open grey box symbols in each panel. These sub-plots are derived from a single biplot shown in Figure S4 but separated here to facilitate comparisons with the different de-icers.
Water 16 00426 g008
Disclaimer/Publisher’s Note: The statements, opinions and data contained in all publications are solely those of the individual author(s) and contributor(s) and not of MDPI and/or the editor(s). MDPI and/or the editor(s) disclaim responsibility for any injury to people or property resulting from any ideas, methods, instructions or products referred to in the content.

