Article

Evaluating the Application of Chitosan-Based Sorbents for the Solid-Phase Adsorption Toxin Tracking of Microcystins in Irrigation Water

by
Glynn K. Pindihama
1,*,
Mugera W. Gitari
1,2,
Rabelani Mudzielwana
1 and
Ntakadzeni E. Madala
3
1
Environmental Remediation and Nano Sciences Research Group, Department of Geography & Environmental Sciences, Faculty of Science, Engineering and Agriculture, University of Venda, Thohoyandou 0950, South Africa
2
Department of Chemical Sciences and Technology, School of Chemistry and Material Sciences, Technical University of Kenya, Haile Selassie Avenue, Nairobi P.O. Box 52428-00200, Kenya
3
Department of Biochemistry and Microbiology, Faculty of Science, Engineering and Agriculture, University of Venda, Private Bag X5050, Thohoyandou 0950, South Africa
*
Author to whom correspondence should be addressed.
Water 2024, 16(1), 41; https://doi.org/10.3390/w16010041
Submission received: 15 November 2023 / Revised: 12 December 2023 / Accepted: 19 December 2023 / Published: 21 December 2023
(This article belongs to the Special Issue Removal of Micropollutants in Water)

Abstract

:
In this study, a gluteraldehyde-crosslinked chitosan (ChGLA) hydrogel and a glutaraldehyde-crosslinked chitosan–multiwalled carbon nanotubes composite (ChMWCNT) were synthesized to be used as substrates in the solid-phase adsorption toxin tracking (SPATT) sampling of microcystins (MCs) in irrigation water. The synthesized samplers were tested for their efficiency by deploying them in four farm dams and two canals for 48 h in January 2022 and in July 2022. Grab samples were collected during deployment and retrieval of the samplers for comparison. Sequential extraction using 100% methanol was used to extract MCs from the samplers, followed by enzyme-linked immunosorbent assay (ELISA) analysis for total MCs and liquid chromatography–mass spectrometry (LC-MS) for individual MC congeners (MC-LR, -RR, and -YR). The mean levels of dissolved total MCs detected by the samplers were as follows: ChMWCNT 0.754 (±1.085) µg g−1, ChGLA 0.420 (±0.546) µg g−1; and these were comparable to the Diaion® HP-20 resin: 0.602 (±0.627) µg g−1 of material. The mean level of MCs detected in the grab samples was 0.868 (±1.358) ug L−1. Significantly higher levels of MCs were detected in July compared to the January sampling by the two newly developed samplers. With regards to the detection of MC-LR, -RR, and -YR, no statistical differences were reported among the three samplers (ChGLA, ChMWCNT, and Diaion® HP-20) for five of the six sampling points (one-way ANOVA at a 0.05 level of significance). The levels of detection of MCs by the substrates were in the order MC-YR > -LR > -RR. Strong positive correlations between the grab samples and the ChGLA and ChMWCNT samplers suggested better suitability of the two chitosan-based sorbents for monitoring MCs in the study area compared to the Diaion® HP-20 resin. Overall, the two new sorbents showed potential for use in SPATT to monitor the presence of MCs in the agricultural waters tested, and they could represent economical and environmentally friendly options compared to the synthetic aromatic resins.

Graphical Abstract

1. Introduction

Globally, human-induced factors have increased the intensity, frequency, duration, and geographic range of blooms of toxic cyanobacteria [1,2], and this has huge ramifications for human health and ecology. Incidences of toxic cyanobacterial blooms and poisoning of domestic animals and wildlife due to cyanotoxins have been reported in various parts of South Africa [3]. Reports have also shown that dams such as those at Vaal and Hartbeespoort are dominated by toxic cyanobacteria such as Dolichospermum and Microcystis sp. [4]. Toxic blooms present a threat to the South African population, since water derived from the impacted reservoirs is mainly used for drinking [3] and irrigation purposes [5].
Microcystins (MCs) remain the most frequently reported and abundant cyanotoxins [1,6], with about 246 variants having been recorded in fresh waters globally [6]. MCs are known to be hepatotoxins, but they have recently been recognized as reprotoxins and neurotoxins as well [6]. Their mode of action is through the inhibition of the protein serine/threonine phosphatases (PP1 and PP2A) in cells (Roué et al., 2018) [7]. Exposure to cyanotoxins can be direct or indirect: direct through drinking water, recreational activities, and inhalation through contaminated aerosols; and indirect through the ingestion of contaminated foods [2]. Considering the long-term toxicity of MCs, the World Health Organization (WHO) established a provisional limit of 1 µg L−1 for MC-LR in drinking water [8] and set 0.04 μg kg−1 of body weight (BW) of MC-LR Kg−1 body weight (BW) as the tolerable daily intake (TDI) in food [9,10,11].
Considering the severity and prevalence of these toxins in both fresh and marine water systems, their monitoring and surveillance is of importance. Traditional sampling of MCs and other cyanotoxins relies on discrete (“grab”) sampling at a specific point in space and time [12]. The limitations of such a sampling technique include its inability to cater for the rising intensity of these toxins, along with the spatial and temporal variability of these toxins in cyanobacteria-infested water bodies [2]. Due to the drawbacks of discrete sampling, numerous passive/integrated sampling techniques have been developed and applied for monitoring MCs.
Of these passive sampling techniques, the solid-phase adsorption toxin tracking (SPATT) sampler, first applied by MacKenzie et al. [13]., remains the most common and widely used integrated sampling technique for cyanobacterial toxins [2]. SPATT is a sensitive and relatively simple technique for monitoring cyanotoxins in aquatic environments [13,14,15]. The technique involves leaving small bags packed with an adsorbent suspended in the water column to adsorb the toxins over a predetermined period of time. Thereafter, the bags are removed from the water and the toxins are recovered through extraction, followed by analysis of the toxins to provide data on the levels of the extracellular toxins dissolved in the water over a given period of time.
Although passive sampling has been successfully used several times to monitor microalgal toxins using different bulk polymeric sorbents, such as Oasis HLB, Strata-X, Bond Elut C18, and HP-20 sorbent (Zendong et al., [16], most of the applied sorbents are quite costly to buy since they are synthetic. Most of these polymeric sorbents are three-dimensional and manufactured to be rigid and have a large surface area. Details on the various sorbents mainly applied in the solid-phase extraction of these compounds can be found in the work of Mashile and Nomngongo [17].
On the other hand, chitin and its deacetylated product chitosan are the world’s second-most-abundant natural polymers after cellulose [18], as well as the most abundant amino polysaccharides [19]. As a sorbent, chitosan possesses advantages due to its ease of availability and lower cost. It is a nontoxic, biocompatible, and hydrophilic adsorbent that is obtained from natural resources. In addition, chitosan has a high affinity for a variety of pollutants, ranging from metal ions to organic compounds [20].
The use of chitosan (either on its own, in combination, or modified) for the sorption of MCs has recently been studied mainly for water purification purposes—for example, studies by Gomez-Maldonado et al. and Tran et al. [21,22]. However, its application as a passive sampling sorbent for MCs in SPATT has not been explored. In our previous work [23], we successfully developed and determined the mechanisms of adsorption and desorption for a composite of glutaraldehyde-crosslinked chitosan and multiwalled carbon nanotubes (ChMWCNT), and we assessed its applicability in SPATT for monitoring MCs in water under laboratory conditions. In our previous work [23], chitosan was successfully crosslinked with glutaraldehyde to give it better stability in the aqueous environment, and the insertion of multiwalled carbon nanotubes significantly improved the material’s pore volume, pore sizes, and surface area.
The present study aimed at evaluating the field applicability of a glutaraldehyde-crosslinked chitosan (ChGLA) hydrogel and a composite of glutaraldehyde-crosslinked chitosan and multiwalled carbon nanotubes (ChMWCNT) in SPATT samplers to monitor MCs in agricultural waters. The synthesized samplers’ performance in this regard was compared to that of the commercially available resin Diaion® HP-20, and physicochemical parameters that could influence the performance of the samplers and the occurrence of MCs were also monitored.

2. Materials and Methods

2.1. Chemical and Reagents

Chitosan was purchased from Rochelle Chemicals as a flaked material, with a deacetylation percentage of approximately 57.72%. Glutaraldehyde (GLA) and acetic acid were also purchased from Rochelle Chemicals and were all analytical reagent grade. Hydroxyl-functionalized multiwalled carbon nanotubes (MWCNTs; average diameter: 10–20 nm; purity: >98%) were supplied by SabiNano (Pty) Ltd., Johannesburg, South Africa. Synthetic styrene–divinylbenzene adsorbent resin (Diaion® HP-20) was supplied by Rochelle Chemicals (Johannesburg, South Africa). Deionized (DI) water (≥18 MΩ cm resistivity) sourced from a Milli-Q water purification system (Merck Millipore, Darmstadt, Germany) was used to prepare all solutions for the experiments. Nylon mesh with a 95-100 micron pore size was purchased from Ecotao Enterprises (Stanger, South Africa).

2.2. Preparation of Glutaraldehyde-Crosslinked Chitosan Hydrogel

Chitosan (1 g) was dissolved in 50 mL of 1% v/v acetic acid for 12 h to allow for complete dissolution. Thereafter, glutaraldehyde (2% (v/v)) was slowly added to the solution as a crosslinking agent under mechanical stirring (50 rpm), until the formation of a gel. The formed hydrogel was then freeze-dried at −48 °C under a constant vacuum of 44 μmHg (constant vacuum of 44 μmHg using a Telstar Lyoquest Freeze Dryer, Terrassa, Spain). This was then followed by grinding using a mortar and pestle, and then by sieving through a 250 µm sieve to ensure that the material in the SPATT bags was of ≥250 µm diameter, so as to prevent leaching.

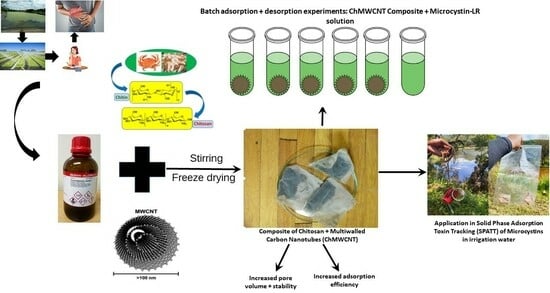
2.3. Preparation of the Glutaraldehyde-Crosslinked Chitosan and Multiwalled Carbon Nanotubes Composite

Chitosan (1 g) was dissolved in 50 mL of 1% v/v acetic acid for 12 h to allow for complete dissolution. Thereafter, multiwalled carbon nanotubes (MwCNT) (10% wt) and glutaraldehyde (2% (v/v)) as a crosslinking agent were added to the solution under mechanical stirring (50 rpm) until the formation of a gel. The gel was then freeze-dried for 48 h at −48 °C under a constant vacuum of 44 μmHg (Telstar Lyoquest Freeze Dryer, Terrassa, Spain). The freeze-dried material was then ground to a powder, followed by sieving through a 250 µm sieve to ensure that the material in the SPATT bags was of ≥250 µm diameter (to prevent leaching). The two newly synthesized sorbents (ChGLA and ChMWCNT) were characterized using scanning electron microscopy (SEM), Fourier-transform infrared (FTIR) spectroscopy, and Brunauer–Emmett–Teller (BET) theory in our previous work [23].

2.4. Construction of SPATT Bags

The SPATT bags were constructed using nylon mesh with approximately 95–100-micron pore size. The nylon mesh cloth was sewn on 3 sides using an electric sewing machine to form an open bag of 60 mm width. The SPATT bags were filled with 3 g (dry weight) of Diaion® HP-20 and 0.2 g of ChGLA and ChMWCNT per bag, and then sewn on the fourth side to form a 60 × 60 mm bag (Figure 1). The SPATT bags were activated by soaking them in 100% methanol for 48 h. The methanol was then rinsed off with deionized water by incubating the SPATT bags inside a beaker with 500 mL of deionized water (Milli-Q). The SPATT bags were then placed in Ziploc bags with deionized water covering the resin to prevent it from drying out, stored in a cooler box with ice, and transported to the field for deployment.

2.5. Laboratory Exposures

To gain insight into the approximate number of days the samplers take to become saturated, eighteen one-liter amber bottles (nine for CHMWCNT and nine for Diaion® HP-20) were filled with raw, unfiltered Roodeplaat Dam water with a total MC concentration of 7.79 ± 1.69 µg L−1. The raw dam water had a mean pH of 8.84 ± 0.71, EC of 346 ± 13.87 µs cm−1, TDS of 234 ± 23.52 mg L−1, turbidity of 34.05 ± 16.04 NTU, and mean total MC concentration of 7.79 ± 1.69 µg L−1. SPATT bags containing ChMWCNT and Diaion® HP-20 were suspended in each bottle, and three samplers (SPATT bags) were removed from each treatment after 24, 48, and 72 h; the residual concentration of MCs was monitored at each of those three intervals.
The bottles containing the samplers were continuously agitated at 100 rpm using a reciprocal shaker for the duration of the experiment, and light illumination was kept at a minimum throughout the duration of the experiment. Individual samplers were removed daily, rinsed with distilled water and, refrigerated in sealed Ziploc bags. Water samples (5 mL) were also taken daily and kept at −20 °C so that they could be analyzed later for total MCs using the enzyme-linked immunosorbent assay (ELISA) method.

2.6. Field Deployment of SPATT Samplers

The constructed SPATT samplers were deployed in the field at the Roodeplaat and Hartbeespoort Dam sites and points indicated in Figure 2. The samplers were deployed at six points: two irrigation canals and four farm dams. Three points (R1, R2, and R3) were selected for the Roodeplaat site and three (H1, H2, and H3) were selected for the Hartbeespoort site (the sampling points are described in Table 1). At all of the selected sites, the water is used to irrigate vegetables and other crops for human consumption, thus presenting an indirect route of human exposure to MCs through the ingestion of MC-contaminated food.
Six SPATT samplers (two containing each of the sorbents: ChGLA, ChMWCNT, and Diaion® HP-20) were deployed for 2 days (based on the findings of the laboratory exposure study in Section 3.2) at each sampling point (total of 36 samplers). Sampling was conducted from the 10 January 2022 to the 13 January 2022, and then again from the 12 July to the 15 July 2022. The SPATT samplers were clamped onto plastic embroidery hoops and were protected by wire and plastic cages to prevent them from being damaged by fish and other aquatic organisms. The samplers were secured with a rope at a depth of 0.5–1 m (Figure 3) and were attached to weights in the form of mugs/metal bolts to give them weight and keep them suspended in the water column. Figure 3 shows the configuration of the samplers prior to and after their deployment.
Grab samples were also collected using 100 mL amber bottles at the time of the samplers’ deployment and retrieval. Upon their retrieval, the SPATT bags were unclamped from the embroidery hoops and rinsed with field water and then with deionized water to remove silt and debris. The samplers were then placed in labelled Ziploc bags and stored in a cooler box with ice for transportation to the laboratory, and they were stored in a fridge at 4 °C until MC extraction and analysis.

2.7. Toxin Extraction and Analysis from the SPATT Samplers

The SPATT samplers were taken from the fridge and rinsed with deionized water before extraction. The SPATT bags were cut open using a pair of scissors, and the material was decanted into 15 mL glass centrifuge tubes for the extraction of MCs from the sorbents. MCs were extracted from the sorbents following a modified version of the method used by Kudela [12]. Sequential extraction with 100% and 80% methanol was used to extract MCs from the respective sorbents. To extract the MCs from the sorbents, 10 mL of 100% methanol (for ChGLA and ChMWCNT) and 80% methanol (for Diaion® HP-20) was added to the sorbent in a glass centrifuge tube and sonicated for 5 min. After sonication, the extracts were centrifuged (Hermle Z 366 centrifuge, Wehingen, Germany) at 1750 rpm for 15 min. After centrifugation, the resulting supernatant was collected. This entire process (i.e., adding 10 mL of the homogenization solvent through collecting the supernatant after centrifugation) was repeated three times, with the two preceding extractions being 5 mL each for each sample and the resulting supernatants pooled afterwards. The combined extracts were evaporated to dryness at 50 °C using an electric water bath, under a stream of nitrogen gas. The dried samples were then resuspended in 1 mL of Milli-Q water (or diluted accordingly to be within the 0–5 µg L−1 range of the ELISA test kits used).
Both the grab samples and the samplers’ eluents were analyzed for total MCs using the commercial ELISA test kits supplied by EUROFINS (Kit Lot No: 19I1120:PN 520011), following the manufacturer’s instructions. The total dissolved MC concentrations in SPATT bags were determined using Equation (1):
Total   dissolved   MCs   ( µ g   g 1   resin ) = ( M C s   c o n c   µ g / L e x t r a c t ) × ( 0.004   L   e x t r a c t V O L ) 3   g   r e s i n
where MCs conc (µg L−1) is the total concentration of microcystins extracted from the SPATT bag’s resin, extract volume is the amount (4 mL) of solvent (deionized water) used to resuspend the dried samples, and 3 g is the dry weight of Diaion® HP-20 resin used in the SPATT bags (0.2 g for ChGLA and ChMWCNT).
The levels of MCs (-LR, -RR, and -YR) adsorbed and desorbed by the samplers and in the grab samples were determined using a Shimadzu triple-quadrupole LC–MS/MS system (model LCMS-8045, Shimadzu Corporation, Japan).

Chromatographic Conditions

A triple-quadrupole LC–MS/MS system (model LCMS-8045, Shimadzu Corporation, Japan) was used to quantify the MCs (-LR, -RR, and -YR) using a Shim-pack Velox SP-C18 column (2.7 µm, dimensions: 2.1 × 100 mm) (Shimadzu, Japan). The mobile phases were 0.1% formic acid (FA) in water (A) and 0.1% FA in acetonitrile (B), with 10 µL set as the injection volume. A 5 min binary gradient method with an elution profile of 2% B (0.4 min), linear gradient to 70% B (3.1 min), 100% B (0.5 min) and, finally, 2% B (1 min), was used with a flow rate of 0.5 mL min−1.
The interface conditions of the LCMS-8045 were set as follows: ESI interface temperature of 300 °C, DL temperature of 235 °C, nebulizing gas flow of 3 L min−1, drying gas flow of 10 L min−1, and heating gas flow of 10 L min−1. The interface voltage was set to 3.0 kV for positive (ES+) electrospray.
Equation (2) was used to determine the concentrations of MCs in the samples:
C o n c   i n   s a m p l e   ( µ g / L ) = C o × V o l   o f   e x t r a c t   u s e d   ( L ) V o l u m e   o f   s a m p l e   u s e d   ( L )
where C o = the concentration of the samples determined from the calibration curve (µg L−1)

2.8. Physicochemical Parameters

Physicochemical parameters such as pH, total dissolved solids (TDS), electrical conductivity (EC), salinity, temperature, turbidity, and dissolved oxygen (DO) were recorded in situ from the irrigation canals/farm dams at each site. The pH, EC, TDS, temperature, salinity, and DO were monitored using a rugged dissolved oxygen (RDO) electrode attached to a Thermo Scientific meter (Singapore). Turbidity was monitored using a TB200 portable turbidimeter (model #TB200-10). The instruments were calibrated following the manufacturers’ instructions prior to use. Samples for nutrients (e.g., nitrates and dissolved orthophosphates) and chlorophyll a were collected at the beginning of the SPATT samplers’ deployment. Levels of nutrients were determined using a Spectro-quant® Merck Pharo 100 model No: 07531-45 (Merck KGaA 64293 Darmstadt, Germany) and the photometric test kits supplied by Merck (Germany). Chlorophyll a was used to estimate the phytoplankton biomass in water samples as described by Lawton et al. [24].

3. Results and Discussion

3.1. Laboratory Exposure in SPATT Bag Format

The findings of the laboratory trial in Figure 4a show that both adsorbents were saturated within 24 h when exposed to field water. It is important to note that the resin Diaion® HP-20 retained the MCs throughout the 72 h period of exposure, whereas the ChMWCNT composite seemed to leach the adsorbed MCs, as indicated by the decline in the recovered MCs as the time of exposure was increased (from 24 h to 72 h).
With regard to the residual MC levels in the water upon exposure to the samplers, Figure 4b shows that from an initial MC concentration of ≈9 µg L−1, all of the MCs were adsorbed by the samplers within 24 h of exposure to the Diaion® HP-20 resin. In bottles in which the field water was exposed to the ChMWCNT-loaded samplers, the MC levels in the bottles gradually reduced from an initial concentration of ≈6.59 µg L−1 to ≈2 µg L−1 after 72 h of exposure. The differences in the two treatments could be attributed to the huge differences in the masses of the adsorbent used, with 3 g having been used for Diaion® HP-20 and 0.2 g for ChMWCNT, since the composite is less dense and bulky compared to Diaion® HP-20 and, hence, the SPATT bags could not be loaded with more adsorbent material.
In a similar study, Wood et al. [25] investigated the applicability of a range of sorbents for the uptake of the alkaloid anatoxin-a (ATX) in SPATT format. When 1 g of each of the substrates was exposed to 10 µg L−1 of ATX, all four substrates (powdered activated carbon (PAC), Strata-X, AG 50W-X4, and Amberlite IRP-64) were saturated within 24 h, with the weak cation exchanger Amberlite IRP-64 being saturated after just 8 h [25].

3.2. Levels of MCs Detected by the SPATT Samplers

Despite the laboratory study having shown that the samplers were saturated after 24 h, the samplers with the three sorbents (ChGLA, ChMWCNT, and Diaion® HP-20) were deployed for 48 h in the field. The assumption was that the field water had a lower MC load compared to the water used for the laboratory trials, since the study sites had received excessive rains prior to the first field visit. The findings of the field monitoring confirmed that the field water at both sites had traces of MCs (below 1 µg L−1 for five of the sampling points and approximately 4 µg L−1 at one sampling point, R3) (Table 2). The levels of MCs in the grab samples were below the 1 µg L−1 guideline used by the South African National Standards (SANS) 241 [26] and the (WHO, 1998 [27]) at all of the sampling stations, except for one (station R3). However, South Africa does not have guidelines for MCs in agricultural waters, and the water that we monitored is used for agricultural purposes.
Table 3 shows the levels of MCs detected by the different samplers and over the two sampling periods. Significantly higher levels of MCs were detected in July compared to the January sampling by the two newly developed samplers (ChGLA and ChMWCNT) and the Diaion® HP-20 resin, but no differences were reported in the grab samples (Mann–Whitney test at the 0.05 level of significance).
Importantly, despite the low levels of MCs found in the grab samples, all three types of samplers detected significant levels of MCs, with all of the samples needing at least a 10-factor dilution to be within the 0–5 µg L−1 range for the ELISA test used for quantification, thus proving that SPATT increases the likelihood of detecting MCs in instances where ordinary grab sampling would have missed them. Figure 5 shows that the Diaion® HP-20 and ChMWCNT samplers detected MCs better than the ChGLA, even though there were no statistically significant differences in the mean levels of MCs detected by the three samplers (ANOVA at the 0.05 level of significance). What was apparent was the higher detection levels of ChMWCNT at highly alkaline sampling points (H3 and R3) (see Table 4) compared to the Diaion® HP-20, which detected MCs better at sampling points H2 and R1, which had slightly neutral mean pH values of 8.1 ± 0.6 and 7.4 ± 0.7, respectively. These findings suggest that pH could be a factor in the performance of the samplers.
Water pH is known to significantly influence the adsorption processes, since the pH determines the surface charge of the adsorbent and the ionization degree and speciation of the adsorbate. All of this has a direct impact on the electrostatic interactions. According to El Bouaidi et al. [28], the adsorption of MC-LR has been demonstrated to increase with a decrease in pH (from 8 to 2.5). Under acidic conditions, the weak acidic functional groups of MCs are presumed to become available for adsorption [28], and this probably explains the significantly higher adsorption of the Diaion® HP-20 at site H2, which had waters with slightly neutral pH values. With regards to the chitosan-based substrates, the amino groups in the chitosan polymer are known to protonate as -NH3+ in neutral conditions, and the MC-LR has two carboxylate (-COO) groups under such conditions for electrostatic interactions to take place.
In addition, the pH of any water body normally increases due to the presence of productive blooms, as a result of the cyanobacteria taking up the dissolved carbon dioxide; thus, pH levels above 8 are common under such circumstances [29]. This higher productivity increases the likelihood of having higher concentrations of MCs available for adsorption by the sorbents in water bodies with such high pH levels. However it is worth noting the unavailability of studies that look into the effects of pH on the adsorption of other congeners of MCs by chitosan and by other substrates.

Samplers’ Adsorption of Different MCs

With regards to the adsorption and desorption of MC-LR, -RR, and -YR, Figure 6A–C show the levels of the three MC congeners detected by the samplers. Our findings indicate that there were no statistical differences reported in any of the congeners at five of the six sampling points (one-way ANOVA at the 0.05 level of significance). Statistical significant differences in the detection of MCs by the samplers were only reported for sampling point H2 for MC-LR and -RR, where Diaion® HP-20 detected much higher levels of the toxins compared to the other two samplers. Figure 6 shows that the levels of detection of MCs by the chitosan-based samplers were in the order MC-YR > -LR > -RR. The Diaion® HP-20 resin seemed to detect MC-YR better compared to the newly synthesized chitosan-based sorbents, but no statistically significant differences were reported (one-way ANOVA at the 0.05 level of significance).
The adsorption mechanisms of the sorbents (ChGLA and ChMWCNT) are explained in detail in our previous work [23]. The adsorption of MCs onto chitosan can be explained by the chemical structures of these two compounds. Chitosan has linear polysaccharide chains and possesses numerous amino groups that are easily available for chemical interactions. Figure 7a shows the chemical structure of completely deacetylated chitosan, and Figure 7b shows the general chemical structure of MCs. In neutral solutions, the amino groups on the chitosan chain protonate as -NH3+, and the two carboxylate groups (-COO) in the MCs’ structure make it possible for electrostatic interactions to take place. In addition, the two molecules (chitosan and MCs) also have numerous sites for hydrogen bonds to form between them [21].
Figure 8A–C show the patterns of MC-LR, -RR, and -YR detection across the sampling points by the three samplers and by grab sampling. No definitive pattern/correlation could be observed for the detection of MC-LR and MC-YR, but a clear trend/pattern was observed for the detection of MC-RR by all three samplers and by grab sampling. The differences in the adsorption patterns of the different MCs can also be explained in terms of their polarities. Although these MCs may be similar in structure, they have different amino acids, e.g., MC-RR has arginine and arginine, whereas MC-LR has leucine and arginine [30]. Arginine, being a more polar amino acid compared to leucine, would make MC-RR more polar and a preferred adsorbate onto the samplers’ active sites, hence the more regular pattern in its adsorption by the three samplers tested.

3.3. Physicochemical Parameters Monitored

Among the physicochemical parameters monitored in situ and ex situ during the sampling period were EC (µs/cm), TDS (ppm), pH, DO (mg L−1), temp °C, turbidity (NTU), phosphates (mg L−1), nitrates (mg L−1), and chlorophyll a (µg L−1) (Table 4). With regards to EC and TDS, the water from the Hartbeespoort site exceeded the DWAF [31] guideline for irrigation waters. The pH of the water from both sites was slightly alkaline and exceeded the DWAF [31] thresholds at two sampling points from the Hartbeespoort site and one sampling point from the Roodeplaat site. Table 4 shows that four of the six points (two from each site) exceeded the 5 mg L−1 DWAF [31] threshold for nitrates. The phosphate levels for all of the sampling points were within the Food and Agriculture Organization (FAO)’s guideline thresholds [32].
The concentration of chlorophyll a present in water is usually directly related to the amount of algae living in the water. Generally, concentration levels of chlorophyll a above 10 µg L−1 result in eutrophication, which ultimately increases the likelihood and growth rate of cyanobacterial blooms in the aquatic ecosystem [33]. With regards to chlorophyll a, one sampling point (H3) at the Hartbeespoort site and all three points at the Roodeplaat site had chlorophyll a levels above the 10 µg L−1 threshold, implying the possibility of a heavy presence of cyanobacteria in these waters.
With regards to DO, healthy water generally has dissolved oxygen concentrations above 6.5–8 mg L−1. When high levels of cyanobacteria are present in a water body, the biological condition of the water resource may also be degraded, as the condition that allows for cyanobacterial growth is typically high in nutrients and low in dissolved oxygen. Five of the six sampled sites (except R1) had DO levels below the 6.5 mg L−1 threshold for healthy waters, thus implying conditions suitable for cyanobacterial dominance.

3.4. Correlation of Physicochemical Parameters and Microcystin Levels

Table 5 shows the Pearson’s correlation coefficients between the physicochemical parameters monitored and MCs in the SPATT samplers and grab samples. Strong positive correlations were found between TDS and EC, pH and DO, phosphate levels and DO, phosphate levels and pH, nitrate levels and EC, and nitrate levels and TDS. Dissolved oxygen (DO) was the only parameter to be strongly positively correlated with the total MC levels detected in the grab samples. With regards to the ChGLA and ChMWCNT samplers, DO and pH were the only parameters to be positively correlated with the MC levels detected by these samplers, whilst negative correlations were found between phosphate and nitrate levels and the MC levels detected by these samplers. No physicochemical parameters were positively correlated with the MC levels detected by Diaion® HP-20, but a negative correlation was found between Diaion® HP-20 and water temperature.
With regards to the MC levels detected by the samplers themselves, there was a correlation between the MC levels detected by the ChGLA and ChMWCNT samplers, and the MC levels detected in the grab samples were also positively correlated with these two synthesized samplers (clear detection patterns depicted in Figure 9).
The MC levels detected by Diaion® HP-20 were not correlated with any of the other samplers or grab samples. The ChMWCNT composite showed superiority and higher affinity for the different congeners of MCs, as demonstrated in Figure 6, due to its superior pore sizes [23]. The two composites (ChGLA and ChMWCNT) have similar functional groups, hence the positive correlation in their detection of MCs. In addition, the fact that the chitosan-based sorbents correlated well with the total MCs in the grab samples also seems to suggest that they give a better indication of MCs in the sampled water bodies compared to Diaion® HP-20, which, according to the findings, was affected by the water temperature.
In this study, chlorophyll a was not correlated with the MC levels detected by any of the samplers or sampling methods used. Similarly, De la Cruz et al. [34] did not find any correlation of microcystins and the presence of cyanobacteria with physicochemical parameters such as pH, DO, EC, temperature, or soluble phosphate and nitrate. Importantly, De la Cruz et al. [34] monitored constructed urban watershed retention ponds, which are smaller manmade water bodies comparable to the farm dams and canals monitored in this study [30]. However, depending on the length of storage and the frequency of water usage, the dynamics of the composition of the water in the farm dams could be directly impacted by the dynamics in the dams supplying them.
Contrary to our findings, Howard et al. [35] monitored lakes, reservoirs, and coastal lagoons and found that chlorophyll a was a statistically significant predictor of the MC levels detected by SPATT samplers using the resin Diaion® HP-20. Kudela [12] also found algae biomass as chlorophyll a to be the best single predictor for MC loads in Pinto Lake (USA) in both grab and SPATT samplers using Diaion® HP-20. Unlike larger bodies like the lakes monitored by Kudela and Howard et al., smaller water bodies such as farm dams and fast-flowing canals do not have additional factors such as sediments that act as sinks for nutrients to support cyanobacteria in different seasons [12,35].
In addition, negative correlations were found between the MC levels in ChGLA and ChMWCNT and both nitrate and phosphate levels in this study. Both phosphates and nitrates were not positively correlated with any other physicochemical parameters or MC levels detected by the samplers or the grab method. Howard et al. [35] also did not find any statistically significant relationship between the MC levels detected by the Diaion® HP-20 SPATT samplers and any of the environmental predictors that they monitored, such as alkalinity, nutrients, elevation, conductivity, and temperature. Conversely, Kudela [12] found total dissolved nitrogen (TDN) to be significantly correlated with toxin concentrations in both grab and SPATT samplers. The negative correlation between nitrates/phosphates and MC levels detected by the newly synthesized sorbents will need further investigation, as this might be an indication of these two anions competing with MCs for the same binding sites on the adsorbents.
With regards to DO, it is one of the most important parameters indicating the health of a water body or system. Cyanobacterial blooms are normally associated with low DO levels. In this study, even though some of the sites recorded low DO levels, there was no correlation between DO levels and chlorophyll a levels. In contrast to our findings, Okogwu and Ugwumba found cyanobacterial biomass to be strongly negatively correlated with DO, and they attributed this to the high levels of degradation of cyanobacteria as the cells die following a bloom, resulting in depletion of oxygen and reduced pH [36].
Moderate-to-strong positive correlations were reported for DO vs. MC levels in the ChGLA, ChMWCNT, and grab samples (Table 5). Cyanobacteria are normally associated with low DO; the positive correlation here could be attributed to the fact that two of our six sampled points were canals, where the water is mobile (hence the increased aeration and DO in the canals), while the other four were farm dams where the water was not kept for long, thus promoting aeration. The MCs detected in such points (canals) are likely to have been transported from other areas like the supplying reservoirs/dams (Hartbeespoort and Roodeplaat Dams), where the water is stagnant, promoting the proliferation of HABs and the resultant toxins.

4. Conclusions

In this study, we tested the applicability of a glutaraldehyde-crosslinked chitosan hydrogel (ChGLA) and a composite of glutaraldehyde-crosslinked chitosan and multiwalled carbon nanotubes (ChMWCNT) for detecting MCs in solid-phase adsorption toxin tracking (SPATT) in irrigation water. The levels of MCs detected by the samplers were 0.754 (±1.085) µg g−1 for ChMWCNT and 0.420 (±0.546) µg g−1 for ChGLA, and these were comparable to the value of 0.602 (±0.627) µg g−1 for the commercial resin Diaion® HP-20. The developed samplers (ChGLA and ChMWCNT) detected higher MC levels in July 2022 compared to the January 2022 sampling. The two samplers also detected the three congeners of MCs (MC-LR, -RR, and -YR) relatively well compared to the commonly used Diaion® HP-20. The levels of detection of MCs by the samplers were in the order MC-YR > -LR > -RR. Strong positive correlations between the grab samples and the ChGLA and ChMWCNT samplers suggested better suitability of the two chitosan-based sorbents for monitoring the study area compared to the Diaion® HP-20 resin.
Based on these findings, it can be concluded that SPATT using the synthesized chitosan-based adsorbents has the potential to be applied as an early-warning tool for the presence of MCs in agricultural waters. Since chitosan is a readily available material, the use of these sorbents would also be an economical and environmentally friendly option compared to the traditionally used synthetic aromatic resins.

Author Contributions

G.K.P.: conceptualization, methodology, data curation, writing—original draft, writing—review and editing, investigation; M.W.G.: conceptualization, methodology, data curation, supervision, funding acquisition, investigation, resources; writing—original draft, writing—review and editing; R.M.: methodology, data curation, writing—original draft, writing—review and editing; N.E.M.: data acquisition/sample analysis, writing—review and editing. All authors have read and agreed to the published version of the manuscript.

Funding

Funding for this study was granted by the South African Water Research Commission (WRC), Project No: K5/2972.

Data Availability Statement

The data used in this study are available upon request from the corresponding author.

Acknowledgments

The authors would like to acknowledge the Department of Nutrition (Faculty of Health Sciences) at the University of Venda for the use of the Shimadzu High-Performance Liquid Chromatography Triple-Quadrupole Mass Spectrometer (LCMS-8045).

Conflicts of Interest

The authors declare no conflict of interest.

References

  1. Jaša, L.; Sadílek, J.; Kohoutek, J.; Straková, L.; Maršálek, B.; Babica, P. Application of passive sampling for sensitive time-integrative monitoring of cyanobacterial toxins microcystinsin drinking water treatment plants. Water Res. 2019, 153, 108–120. [Google Scholar] [CrossRef] [PubMed]
  2. Wang, P.; Du, B.; Smith, J.; Lao, W.; Wong, C.S.; Zeng, E.Y. Development and field evaluation of the organic-diffusive gradients in thin-films (o-DGT) passive water sampler for microcystins. Chemosphere 2022, 287, 132079. [Google Scholar] [CrossRef] [PubMed]
  3. Matthews, M.W.; Bernard, S. Eutrophication and cyanobacteria in South Africa’s standing water bodies: A view from space. S. Afr. J. Sci. 2015, 111, 1–8. [Google Scholar] [CrossRef] [PubMed]
  4. Sirunda, J.; Oberholster, P.; Wolfaardt, G.; Botes, M.; Truter, C. The assessment of phytoplankton dynamics in two reservoirs in southern africa with special reference to water abstraction for inter-basin transfers and potable water production. Water 2021, 13, 3045. [Google Scholar] [CrossRef]
  5. Pindihama, G.K.; Gitari, M.W. Cyanobacterial toxins: An emerging threat in South African irrigation water. Water Environ. J. 2020, 34, 506–516. [Google Scholar] [CrossRef]
  6. Lance, E.; Lepoutre, A.; Savar, V.; Robert, E.; Bormans, M.; Amzil, Z. In situ use of bivalves and passive samplers to reveal water contamination by microcystins along a freshwater-marine continuum in France. Water Res. 2021, 204, 117620. [Google Scholar] [CrossRef]
  7. Roué, M.; Darius, H.T.; Viallon, J.; Ung, A.; Gatti, C.; Harwood, D.T.; Chinain, M. Application of solid phase adsorption toxin tracking (SPATT) devices for the field detection of Gambierdiscus toxins. Harmful Algae 2018, 71, 40–49. [Google Scholar] [CrossRef]
  8. Buratti, F.M.; Manganelli, M.; Vichi, S.; Stefanelli, M.; Scardala, S.; Testai, E.; Funari, E. Cyanotoxins: Producing organisms, occurrence, toxicity, mechanism of action and human health toxicological risk evaluation. Arch. Toxicol. 2017, 91, 1049–1130. [Google Scholar] [CrossRef]
  9. Zhao, H.; Qiu, J.; Fan, H.; Li, A. Mechanism and application of solid phase adsorption toxin tracking for monitoring microcystins. J. Chromatogr. A 2013, 1300, 159–164. [Google Scholar] [CrossRef]
  10. Miller, A.; Russell, C. Food crops irrigated with cyanobacteria-contaminated water: An emerging public health issue in Canada. Environ. Health Rev. 2017, 60, 58–63. [Google Scholar] [CrossRef]
  11. Miller, A.; Russell, C.; Wiens, M. Irrigating Food Crops With Water Containing Cyanobacteria Blooms; National Collaborating Centre for Environmental Health: Vancouver, BC, USA, 2017; pp. 1–9. Available online: http://www.ncceh.ca/sites/default/files/Irrigating_Food_Crops_Water_Containing_Cyanobacteria-Oct_2017.pdf (accessed on 30 June 2022).
  12. Kudela, R.M. Characterization and deployment of Solid Phase Adsorption Toxin Tracking (SPATT) resin for monitoring of microcystins in fresh and saltwater. Harmful Algae 2011, 11, 117–125. [Google Scholar] [CrossRef]
  13. MacKenzie, L.; Beuzenberg, V.; Holland, P.; McNabb, P.; Selwood, A. Solid phase adsorption toxin tracking (SPATT): A new monitoring tool that simulates the biotoxin contamination of filter feeding bivalves. Toxicon 2004, 44, 901–918. [Google Scholar] [CrossRef]
  14. Piletska, E.V.; Villoslada, F.N.; Chianella, I.; Bossi, A.; Karim, K.; Whitcombe, M.J.; Piletsky, S.A.; Doucette, G.J.; Ramsdell, J.S. Extraction of domoic acid from seawater and urine using a resin based on 2-(trifluoromethyl)acrylic acid. Anal. Chim. Acta 2008, 610, 35–43. [Google Scholar] [CrossRef]
  15. Pizarro, G.; Escalera, L.; González-Gil, S.; Franco, J.M.; Reguera, B. Growth, behaviour and cell toxin quota of Dinophysis acuta during a daily cycle. Mar. Ecol. Prog. Ser. 2008, 353, 89–105. [Google Scholar] [CrossRef]
  16. Zendong, Z.; Herrenknecht, C.; Abadie, E.; Brissard, C.; Tixier, C.; Mondeguer, F.; Séchet, V.; Amzil, Z.; Hess, P. Extended evaluation of polymeric and lipophilic sorbents for passive sampling of marine toxins. Toxicon 2014, 91, 57–68. [Google Scholar] [CrossRef]
  17. Mashile, G.P.; Nomngongo, P.N. Recent Application of Solid Phase Based Techniques for Extraction and Preconcentration of Cyanotoxins in Environmental Matrices. Crit Rev Anal Chem 2017, 47, 119–126. [Google Scholar] [CrossRef]
  18. Gang, D.D.; Deng, B.; Lin, L.S. As(III) removal using an iron-impregnated chitosan sorbent. J. Hazard. Mater. 2010, 182, 156–161. [Google Scholar] [CrossRef]
  19. Crini, G. Recent developments in polysaccharide-based materials used as adsorbents in wastewater treatment. Prog. Polym. Sci. 2005, 30, 38–70. [Google Scholar] [CrossRef]
  20. Gonçalves, J.O.; Santos, J.P.; Rios, E.C.; Crispim, M.M.; Dotto, G.L.; Pinto, L.A.A. Development of chitosan based hybrid hydrogels for dyes removal from aqueous binary system. J. Mol. Liq. 2017, 225, 265–270. [Google Scholar] [CrossRef]
  21. Gomez-Maldonado, D.; Filpponen, I.; Vega Erramuspe, I.B.; Johansson, L.; Mori, M.F.; Jayachandra Babu, R.; Waters, M.N.; Peresin, M.S. Development of a β-cyclodextrin-chitosan polymer as active coating for cellulosic surfaces and capturing of microcystin-LR. Surf. Interfaces 2022, 33, 102192. [Google Scholar] [CrossRef]
  22. Tran, Q.N.; Jin, X.; Doan, N.Q.H. Enhanced removal of extracellular microcystin-LR using chitosan coagulation-ultrafiltration: Performance and mechanisms. J. Environ. Chem. Eng. 2022, 10, 107902. [Google Scholar] [CrossRef]
  23. Pindihama, G.K.; Gitari, M.W.; Mudzielwana, R.; Madala, N.E. Development of a chitosan-multi-walled carbon nanotubes composite for application in solid-phase adsorption toxin tracking of microcystins. S. Afr. J. Sci. 2023, 119, 1–9. [Google Scholar] [CrossRef]
  24. Lawton, L.; Marsalek, B.; Padisák, J.; Ingrid, C. Chapter 12. Determination of Cyanobacteria. In Toxic Cyanobacteria in Water: A Guide to Their Public Health Consequences, Monitoring and Management; WHO: Geneva, Switzerland, 1999. [Google Scholar]
  25. Wood, S.A.; Holland, P.T.; MacKenzie, L. Development of solid phase adsorption toxin tracking (SPATT) for monitoring anatoxin-a and homoanatoxin-a in river water. Chemosphere 2011, 82, 888–894. [Google Scholar] [CrossRef]
  26. South African National Standard 241-1; Drinking Water Standard. SABS Standard Division: Pretoria, South Africa, 2011; pp. 1–46, ISBN 978-0-626-26115-3.
  27. World Health Organization. Cyanobacterial Toxins: Microcystin-LR in Drinking Water, Guidelines for Drinking-Water Quality, Addendum to Vol. 2. Health Criteria and Other Supporting Information, 2nd ed.; World Health Organization: Geneva, Switzerland, 1998. [Google Scholar]
  28. El Bouaidi, W.; Enaime, G.; Loudiki, M.; Yaacoubi, A.; Douma, M.; Ounas, A.; Lübken, M. Adsorbents Used for Microcystin Removal from Water Sources: Current Knowledge and Future Prospects. Processes 2022, 10, 1235. [Google Scholar] [CrossRef]
  29. Schmidt, J.R.; Wilhelm, S.W.; Boyer, G.L. The fate of microcystins in the environment and challenges for monitoring. Toxins 2014, 6, 3354–3387. [Google Scholar] [CrossRef]
  30. Pavagadhi, S.; Tang, A.L.L.; Sathishkumar, M.; Loh, K.P.; Balasubramanian, R. Removal of microcystin-LR and microcystin-RR by graphene oxide: Adsorption and kinetic experiments. Water Res. 2013, 47, 4621–4629. [Google Scholar] [CrossRef]
  31. DWAF. Water Quality Guidelines Volume 4 Agricultural Use: Irrigation Department of Water Affairs and Forestry. 1996; Volume 4. Available online: http://www.dwa.gov.za/IWQS/wq_guide/edited/Pol_saWQguideFRESHIrrigationvol4.pdf (accessed on 30 June 2023).
  32. Ayers, R.S.; Westcot, D.W. Water Quality for Agricultura FAO 29; Food and Agriculture Organization of the United Nations: Rome, Italy, 1985. [Google Scholar]
  33. Kansas Department of Health and Environment (KDHE). Chlorophyll A Criteria for Public Water Supply Lakes or Reservoirs; Kansas Department of Health and Environment: Topeka, KS, USA, 2011. [Google Scholar]
  34. de la Cruz, A.; Logsdon, R.; Lye, D.; Guglielmi, S.; Rice, A.; Kannan, M.S. Harmful Algae Bloom Occurrence in Urban Ponds: Relationship of Toxin Levels with Cell Density and Species Composition. J. Earth Environ. Sci. 2017, 25, 704–726. [Google Scholar]
  35. Howard, M.D.A.; Nagoda, C.; Kudela, R.M.; Hayashi, K.; Tatters, A.; Caron, D.A.; Busse, L.; Brown, J.; Sutula, M.; Stein, E.D. Microcystin prevalence throughout lentic waterbodies in coastal southern California. Toxins 2017, 9, 231. [Google Scholar] [CrossRef]
  36. Okogwu, O.I.; Ugwumba, A.O. Cyanobacteria abundance and its relationship to water quality in the Mid-Cross river floodplain, Nigeria. Rev. Biol. Trop. 2009, 57, 33–43. [Google Scholar]
Figure 1. Sorbents in SPATT bags: (a) commercial Diaion® HP-20; (b) synthesized ChGLA; (c) synthesized ChMWCNT.
Water 16 00041 g001
Figure 2. Location of the sampling points and sites for the SPATT samplers’ deployment.
Water 16 00041 g002
Figure 3. SPATT samplers’ configuration for field deployment.
Water 16 00041 g003
Figure 4. (a) Residual MC levels in the bottles with SPATT samplers with Diaion® HP-20 and ChMWCNT over time. (b) MCs adsorbed by the sorbents in the SPATT samplers (µg g−1-material) over time when exposed to field water during laboratory trials.
Water 16 00041 g004
Figure 5. Total MC levels adsorbed by the three samplers (in µg g−1-adsorbent) over the 2 days.
Water 16 00041 g005
Figure 6. MC levels adsorbed by the three samplers (in µg g−1-adsorbent) over the 2 days: (A) MC-LR; (B) MC-RR; (C) MC-YR. Data labelled with different small letters (a–c) differ significantly at p < 0.05 in each bar (n = 3).
Water 16 00041 g006
Figure 7. Chemical structures of (a) chitosan and (b) microcystin.
Water 16 00041 g007
Figure 8. Comparison of the levels of MCs adsorbed by the SPATT samplers vs. the grab samples: (A) MC-LR, (B) MC-RR, and (C) MC-YR.
Water 16 00041 g008
Figure 9. Levels of MCs detected by SPATT samplers vs. grab samples.
Water 16 00041 g009
Table 1. Description of sampling points.
SiteSampling PointDescription
HartbeespoortH1Farm dam
H2Canal
H3Farm dam
RoodeplaatR1Canal
R2Farm dam
R3Farm dam
Table 2. Summary statistics of MCs detected in the irrigation water monitored by grab sampling.
ParameterSampling Point
H1H2H3R1R2R3
MC grab (µg L−1)Min0.1120.1440.1780.0990.1263.316
Max0.5970.1730.9100.1300.4934.037
Mean ± SD0.28 ± 0.220.15 ± 0.010.66 ± 0.340.12 ± 0.010.25 ± 0.173.75 ± 0.31
Table 3. Comparison of the levels of MCs detected by each method over the two sampling periods.
MonthGrab
(µg·L−1)
ChGLA
(µg·g−1)
ChMWCNT (µg·g−1)Diaion® HP-20 (µg·g−1)
January 20220.812 ± 1.2420.116 ± 0.0950.139 ± 0.1050.108 ± 0.072
July 20220.897 ± 1.4650.603 ± 0.6271.062 ± 1.2260.849 ± 0.637
p-Value0.4940.0193 *0.0273 *0.0129 *
Note: * significant at the 0.05 level (Mann–Whitney test).
Table 4. Summary statistics of the physicochemical parameters of the irrigation water monitored.
ParameterSampling PointDWAF (1996b)
H1H2H3R1R2R3
EC (us/cm)Min434.8414.1395.2325.1330.1262.70 *–400.0
Max818.7463.1592.4369.4335.9296.5
Mean ± SD678.9 * ± 212.2445.0 * ± 26.9462.8 * ± 112.3352.3 ± 23.8332.8 ± 2.9274.9 ± 18.8
TDS (mg/L)Min213.6203.4194.2159.8162.3129.20 *–260.0
Max401.7227.4290.8181.5165.1145.8
Mean ± SD333.2 * ± 103.9218.5 ± 13.2227.3 ± 55.0173.1 ± 11.7163.6 ± 1.4135.2 ± 9.2
pHMin7.887.58.046.947.948.736.5 *–8.4
Max8.938.659.038.138.599.23
Mean ± SD8.5 * ± 0.58.1 ± 0.68.7 * ± 0.57.4 ± 0.78.3 ± 0.38.9 * ± 0.3
DO (mg/L)Min8.95.449.652.357.3413.49n.a.
Max10.2711.3914.379.4211.9514.9
Mean ± SD9.7 ± 0.78.6 ± 3.012.5 ± 2.57.0 ± 4.010.3 ± 2.614.4 ± 0.8
Temp °CMin16.0416.416.713.814.614.7n.a.
Max36.52630.120.22929.6
Mean ± SD23.3 ± 11.419.7 ± 5.421.2 ± 7.716.0 ± 3.619.5 ± 8.220.3 ± 8.1
Turbidity (ntu)Min31.374.729.459.3421.8627.73n.a.
Max71.259.288011.8335.2836.14
Mean ± SD49.3 ± 20.36.5 ± 2.454.6 ± 25.310.3 ± 1.328.3 ± 6.732.5 ± 4.3
Phosphates (mg/L)Min00.800.40.400–2 **
Max0.6811.051.081.20.73
Mean ± SD0.2 ± 0.40.9 ± 0.10.4 ± 0.60.8 ± 0.40.9 ± 0.40.2 ± 0.4
Nitrates (mg/L)Min380750<5 * (as inorganic N)
Max16105866
Mean ± SD10.3 * ± 6.79.0 * ± 1.03.0 ± 2.67.3 * ± 0.65.7 * ± 0.62.0 ± 3.5
Chlo a (mg/L)Min0.9627021.2524.66522.8076.665n.a.
Max18.73519.25356.20421.326108.8535.84
Mean ± SD8.0 ± 9.46.6 ± 10.940.5 ± 17.711.3 ± 8.854.3 ± 47.420.1 ± 14.7
Notes: * Department of Water Affairs and Forestry [28]; ** Food and Agriculture Organization (FAO) guidelines of 1985 [29]. n.a.= no applicable standards.
Table 5. Pearson’s correlation coefficients between the physicochemical parameters monitored and MCs in the SPATT samplers used.
EC (us/cm)TDS (mg/L)pHDO (mg/L)Temp °CTurbidity (ntu)PO42− (mg/L)NO32− (mg/L) Chlo a (mg/L)Grab (µg/L)ChGLA (µg/g)ChMWCNT (µg/g)HP-20 (µg/g)
EC (us/cm)--
TDS (mg/L)1.000 **--
pH0.1300.130--
DO (mg/L)−0.213−0.2130.755 **--
Temp °C0.0140.014−0.188−0.237--
Turbidity (ntu)0.1170.1170.4340.4390.326--
PO42− (mg/L)−0.234−0.234−0.723 **−0.622 **0.469 *−0.454--
NO32− (mg/L)0.692 **0.692 **−0.122−0.496 *−0.179−0.3420.088--
Chlo a (mg/L)−0.226−0.2260.3770.383−0.3240.234−0.329−0.290--
Grab (µg/L)−0.465−0.4650.500 *0.630 **0.0230.197−0.404−0.585 *0.005--
ChGLA (µg/g)−0.366−0.3660.540 *0.692 **−0.4030.103−0.605 *−0.575 *0.3130.784 **--
ChMWCNT (µg/g)−0.406−0.4060.551 *0.690 **−0.3560.296−0.638 **−0.660 **0.3080.764 **0.978 **--
HP-20 (µg/g)−0.272−0.272−0.0460.192−0.572 *−0.398−0.108−0.033−0.0540.0170.0900.159--
Notes: chlorophyll a; ** correlation is significant at the 0.01 level (2-tailed); * correlation is significant at the 0.05 level (2-tailed).
Disclaimer/Publisher’s Note: The statements, opinions and data contained in all publications are solely those of the individual author(s) and contributor(s) and not of MDPI and/or the editor(s). MDPI and/or the editor(s) disclaim responsibility for any injury to people or property resulting from any ideas, methods, instructions or products referred to in the content.

