
Occurrence, Distribution, and Sources of Aliphatic and Cyclic Hydrocarbons in Sediments from Two Different Lagoons along the Red Sea Coast of Saudi Arabia
 ,
,
Abstract
:1. Introduction
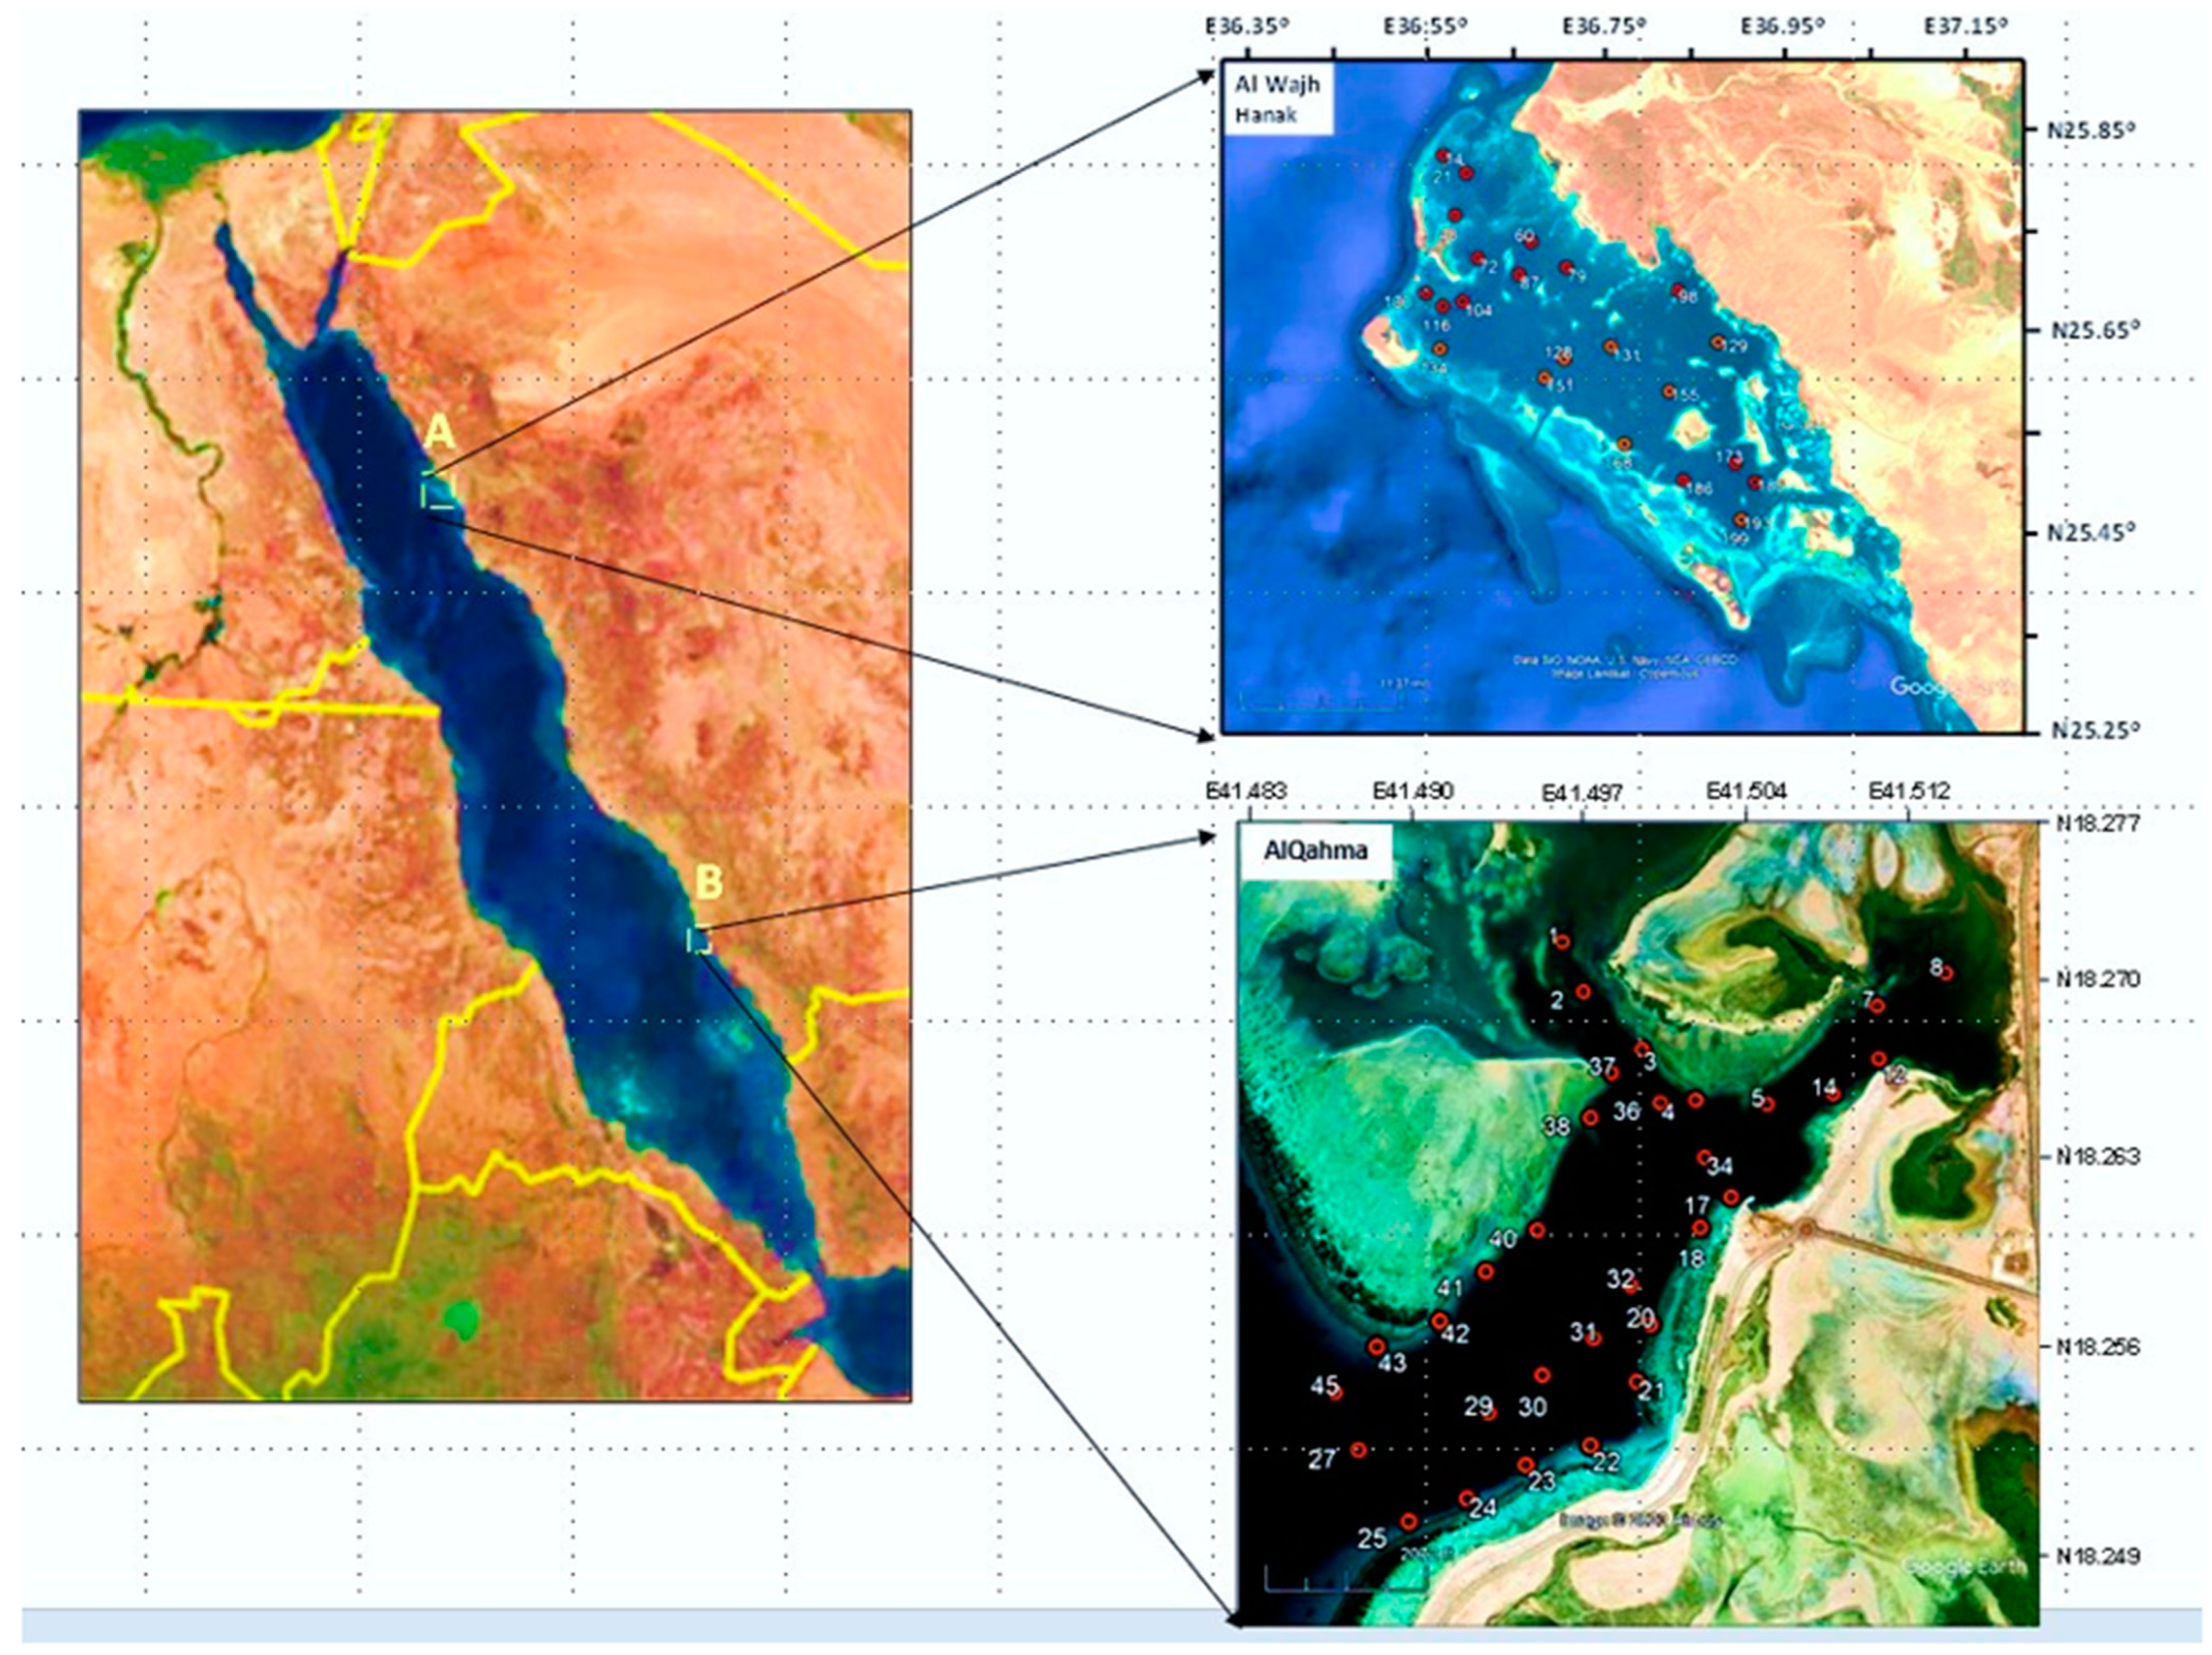
2. Study Areas
3. Materials and Methods
3.1. Sample Collection
3.1.1. Extraction of Sediment Samples
3.1.2. Instrumental Analysis
3.1.3. Identification and Quantification
3.1.4. Quality Control
4. Results and Discussion
4.1. n-Alkanes
4.2. Hopanes and Steranes
4.3. n-Alkanoic Acids
4.4. n-Alkanols
4.5. Polycyclic Aromatic Hydrocarbons (PAHs)
4.6. Plasticizers
4.7. Natural versus Anthropogenic Sources
5. Conclusions
Supplementary Materials
Author Contributions
Funding
Data Availability Statement
Acknowledgments
Conflicts of Interest
References
- Price, A.R. Characteristics and assessment of critical and other marine habitats in the ROPME sea area and the Red Sea. In Proceedings of the ROPME Workshops on Coastal Area Development; UNEP Regional Seas Report and Studies. Regional Organization for the Protection of the Marine Environment: Granada, Kuwait, 1998; pp. 57–71. [Google Scholar]
- DeCarlo, T.M.; Carvalho, S.; Gajdzik, L.; Hardenstine, R.S.; Tanabe, L.K.; Villalobos, R.; Berumen, M.L. Patterns, drivers, and ecological implications of upwelling in coral reef habitats of the southern Red Sea. J. Geophys. Res. Ocean. 2021, 126, e2020JC016493. [Google Scholar] [CrossRef]
- Bosworth, W. Geological evolution of the Red Sea: Historical background, review, and synthesis. In The Red Sea: The Formation, Morphology, Oceanography and Environment of a Young Ocean Basin; Springer: Berlin/Heidelberg, Germany, 2015; pp. 45–78. [Google Scholar]
- Rasul, N.M.; Stewart, I.C.; Vine, P.; Nawab, Z.A. Introduction to Oceanographic and Biological Aspects of the Red Sea; Springer: Berlin/Heidelberg, Germany, 2019. [Google Scholar]
- Almahasheer, H.; Serrano, O.; Duarte, C.M.; Arias-Ortiz, A.; Masque, P.; Irigoien, X. Low carbon sink capacity of Red Sea mangroves. Sci. Rep. 2017, 7, 9700. [Google Scholar] [CrossRef] [PubMed]
- Almahasheer, H.; Aljowair, A.; Duarte, C.M.; Irigoien, X. Decadal stability of Red Sea mangroves. Estuar. Coast. Shelf Sci. 2016, 169, 164–172. [Google Scholar] [CrossRef]
- Almahasheer, H.; Duarte, C.M.; Irigoien, X. Phenology and Growth dynamics of Avicennia marina in the Central Red Sea. Sci. Rep. 2016, 6, 37785. [Google Scholar] [CrossRef] [PubMed]
- Bruckner, A.W.; Dempsey, A.C. The status, threats, and resilience of reef-building corals of the Saudi Arabian Red Sea. In The Red Sea: The Formation, Morphology, Oceanography and Environment of a Young Ocean Basin; Springer: Berlin/Heidelberg, Germany, 2015; pp. 471–486. [Google Scholar]
- Riegl, B.M.; Bruckner, A.W.; Rowlands, G.P.; Purkis, S.J.; Renaud, P. Red Sea coral reef trajectories over 2 decades suggest increasing community homogenization and decline in coral size. PLoS ONE 2012, 7, 38396. [Google Scholar] [CrossRef]
- Hamylton, S. Hyperspectral remote sensing of the geomorphic features and habitats of the Al Wajh Bank reef system, Saudi Arabia, Red Sea. In Seafloor Geomorphology as Benthic Habitat; Elsevier: Amsterdam, The Netherlands, 2012; pp. 357–363. [Google Scholar]
- Atta, C.J.; Coker, D.J.; Sinclair-Taylor, T.H.; DiBattista, J.D.; Kattan, A.; Monroe, A.A.; Berumen, M.L. Conspicuous and cryptic reef fishes from a unique and economically important region in the northern Red Sea. PLoS ONE 2019, 14, 0223365. [Google Scholar] [CrossRef]
- Thadi, S. Preferential Hydrodynamic, Geomorphological, and Vegetation Ecology Conditions for Turtle Nesting; Al Wajh Bank, Saudi Arabia. Master’s Thesis, Delft University of Technology, Delft, The Netherlands, 2021. [Google Scholar]
- Zhan, P.; Krokos, G.; Gittings, J.A.; Raitsos, D.E.; Guo, D.; Papagiannopoulos, N.; Hoteit, I. Physical forcing of phytoplankton dynamics in the Al-Wajh lagoon (Red Sea). Limnol. Oceanogr. Lett. 2022, 7, 373–384. [Google Scholar] [CrossRef]
- Friedman, G.M. Geology and geochemistry of reefs, carbonate sediments, and waters, Gulf of Aqaba (Elat), Red Sea. J. Sediment. Res. 1968, 38, 895–919. [Google Scholar]
- Tournois, J.; Darnaude, A.M.; Ferraton, F.; Aliaume, C.; Mercier, L.; McKenzie, D.J. Lagoon nurseries make a major contribution to adult populations of a highly prized coastal fish. Limnol. Oceanogr. 2017, 62, 1219–1233. [Google Scholar] [CrossRef]
- Tamborski, J.; Beek, P.; Rodellas, V.; Monnin, C.; Bergsma, E.; Stieglitz, T.; Beck, A. Temporal variability of lagoon–sea water exchange and seawater circulation through a Mediterranean barrier beach. Limnol. Oceanogr. 2019, 64, 2059–2080. [Google Scholar] [CrossRef]
- Mignucci, A.; Forget, F.; Villeneuve, R.; Derridj, O.; McKindsey, C.W.; McKenzie, D.J.; Bourjea, J. Residency, home range and inter-annual fidelity of three coastal fish species in a Mediterranean coastal lagoon. Estuar. Coast. Shelf Sci. 2023, 292, 108450. [Google Scholar] [CrossRef]
- Green, A.J.; Jenkins, K.M.; Bell, D.; Morris, P.J.; Kingsford, R.T. The potential role of waterbirds in dispersing invertebrates and plants in arid Australia. Freshw. Biol. 2008, 53, 380–392. [Google Scholar] [CrossRef]
- Tavares, D.C.; Guadagnin, D.L.; Moura, J.F.; Siciliano, S.; Merico, A. Environmental and anthropogenic factors structuring waterbird habitats of tropical coastal lagoons: Implications for management. Biol. Conserv. 2015, 186, 12–21. [Google Scholar] [CrossRef]
- Samaraweera, M.; Chandrajith, R.; Jayasena, N. Birds of different feeding habits as biomonitors for trace elements in a wetland of the Central Asian Flyway, Sri Lanka. Chemosphere 2022, 306, 135602. [Google Scholar] [CrossRef] [PubMed]
- Viaroli, P.; Bartoli, M.; Giordani, G.; Naldi, M.; Orfanidis, S.; Zaldivar, J.M. Community shifts, alternative stable states, biogeochemical controls and feedbacks in eutrophic coastal lagoons: A brief overview. Aquat. Conserv. Mar. Freshw. Ecosyst. 2008, 18, 105–117. [Google Scholar] [CrossRef]
- Danovaro, R.; Pusceddu, A. Biodiversity and ecosystem functioning in coastal lagoons: Does microbial diversity play any role? Estuar. Coast. Shelf Sci. 2007, 75, 4–12. [Google Scholar] [CrossRef]
- Duvat, V. Coastal protection structures in Tarawa atoll, Republic of Kiribati. Sustain. Sci. 2013, 8, 363–379. [Google Scholar] [CrossRef]
- Tognin, D.; D’Alpaos, A.; Marani, M.; Carniello, L. Marsh resilience to sea-level rise reduced by storm-surge barriers in the Venice Lagoon. Nat. Geosci. 2021, 14, 906–911. [Google Scholar] [CrossRef]
- Inácio, M.; Barboza, F.R.; Villoslada, M. The protection of coastal lagoons as a nature-based solution to mitigate coastal floods. Curr. Opin. Environ. Sci. Health 2023, 34, 100491. [Google Scholar] [CrossRef]
- Rushdi, A. Lipid Tracers in Coastal Sediments of the Northwestern Arabian/Persian Gulf: Characteristics, Sources, Distribution, and Possible Ecological Impacts. In The Arabian Seas: Biodiversity, Environmental Challenges and Conservation Measures; Jawad, L.A., Ed.; Springer: Cham, Switzerland, 2021. [Google Scholar]
- Cecinato, A.; Bacaloni, A.; Romagnoli, P.; Perilli, M.; Balducci, C. Molecular signatures of organic particulates as tracers of emission sources. Environ. Sci. Pollut. Res. 2022, 29, 65904–65923. [Google Scholar] [CrossRef]
- Derrien, M.; Yang, L.; Hur, J. Lipid biomarkers and spectroscopic indices for identifying organic matter sources in aquatic environments: A review. Water Res. 2017, 112, 58–71. [Google Scholar] [CrossRef] [PubMed]
- Burd, A.B.; Frey, S.; Cabre, A.; Ito, T.; Levine, N.M.; Lønborg, C.; Long, M.; Mauritz, M.; Thomas, R.Q.; Stephens, B.M. Terrestrial and marine perspectives on modeling organic matter degradation pathways. Glob. Chang. Biol. 2016, 22, 121–136. [Google Scholar] [CrossRef] [PubMed]
- Stern, G.A.; Macdonald, C.R.; Carvalho, P.C.; Wolfe, T.; Ferraz, F. Baseline levels and characterization of hydrocarbons in surface marine sediments along the transportation corridor in Hudson Bay: A multivariate analysis of n-alkanes, PAHs and biomarkers. Sci. Total Environ. 2023, 855, 158718. [Google Scholar] [CrossRef] [PubMed]
- Luo, G.; Yang, H.; Algeo, T.J.; Hallmann, C.; Xie, S. Lipid biomarkers for the reconstruction of deep-time environmental conditions. Earth-Sci. Rev. 2019, 189, 99–124. [Google Scholar] [CrossRef]
- Liu, L.Y.; Wang, J.Z.; Wong, C.S.; Qiu, J.W.; Zeng, E.Y. Application of multiple geochemical markers to investigate organic pollution in a dynamic coastal zone. Environ. Toxicol. Chem. 2013, 32, 312–319. [Google Scholar] [CrossRef] [PubMed]
- Fernandes, G.M.; Martins, D.A.; Dos Santos, R.P.; de Santiago, I.S.; Nascimento, L.S.; Oliveira, A.H.; Yamamoto, F.Y.; Cavalcante, R.M. Levels, source appointment, and ecological risk of petroleum hydrocarbons in tropical coastal ecosystems (northeast Brazil): Baseline for future monitoring programmes of an oil spill area. Environ. Pollut. 2022, 296, 118709. [Google Scholar] [CrossRef] [PubMed]
- Turner, N.R.; Renegar, D.A. Petroleum hydrocarbon toxicity to corals: A review. Mar. Pollut. Bull. 2017, 119, 1–16. [Google Scholar] [CrossRef]
- Jahan, S.; Strezov, V. Effect of shipping on the distribution of trace elements and petroleum hydrocarbons in the coastal basins of Australia: A review. Mar. Freshw. Res. 2019, 71, 794–809. [Google Scholar] [CrossRef]
- Guo, W.; Wang, X.; Liu, S.; Kong, X.; Wang, P.; Xu, T. Long-term petroleum hydrocarbons pollution after a coastal oil spill. J. Mar. Sci. Eng. 2022, 10, 1380. [Google Scholar] [CrossRef]
- El Nemr, A.; El-Sikaily, A.; Khaled, A.; Said, T.O.; Abd-Alla, A.M. Determination of hydrocarbons in mussels from the Egyptian Red Sea coast. Environ. Monit. Assess. 2004, 96, 251–261. [Google Scholar] [CrossRef]
- AL-LIHAIBI, S. Petroleum hydrocarbons in sediments from Jeddah coast of Saudi Red Sea following the 1996 fuel oil spill. Science 2000, 11, 27–41. [Google Scholar] [CrossRef]
- Shimy, T.M. Marine pollution as indicated by oil accumulated on clams collected from the western coasts of the Red Sea, Egypt. Energy Sources 1997, 19, 153–161. [Google Scholar] [CrossRef]
- Huynh, B.Q.; Kwong, L.H.; Kiang, M.V.; Chin, E.T.; Mohareb, A.M.; Jumaan, A.O.; Basu, S.; Geldsetzer, P.; Karaki, F.M.; Rehkopf, D.H. Public health impacts of an imminent Red Sea oil spill. Nat. Sustain. 2021, 4, 1084–1091. [Google Scholar] [CrossRef] [PubMed]
- Shetaia, Y.M.; Mohamed, T.M.; Farahat, L.A.; ElMekawy, A. Potential biodegradation of crude petroleum oil by newly isolated halotolerant microbial strains from polluted Red Sea area. Mar. Pollut. Bull. 2016, 111, 435–442. [Google Scholar] [CrossRef]
- Alhudhodi, A.H.; Alduwais, A.K.; Aldhafeeri, Z.M.; Al-Shamsi, M.A.S.; Alharbi, B.H. Contamination assessment of mangrove ecosystems in the red sea coast by polycyclic aromatic hydrocarbons. Int. J. Environ. Res. Public Health 2022, 19, 5474. [Google Scholar] [CrossRef]
- Tolosa, I.; Mesa, M.; Alonso-Hernandez, C. Steroid markers to assess sewage and other sources of organic contaminants in surface sediments of Cienfuegos Bay, Cuba. Mar. Pollut. Bull. 2014, 86, 84–90. [Google Scholar] [CrossRef]
- Davenport, J.; Davenport, J.L. The impact of tourism and personal leisure transport on coastal environments: A review. Estuar. Coast. Shelf Sci. 2006, 67, 280–292. [Google Scholar] [CrossRef]
- de Oliveira, A.H.B.; Fernandes, G.M.; Dos Santos, F.R.; de Almeida, N.M.; Nogueira, T.R.; de Quadros Melo, D.; Martins, L.L.; Cavalcante, R.M.; do Nascimento, R.F.; Reddy, C.M. Insights about levels and source appointment of petroleum hydrocarbons in Brazilian semi-arid coastal: Baseline status assessment for ocean decade targets. Environ. Sci. Pollut. Res. 2023, 30, 58002–58018. [Google Scholar] [CrossRef]
- Rushdi, A.I.; El-Mubarak, A.H.; Simoneit, B.R.; Goni, M.A.; Qurban, M.A.; Bazeyad, A.Y.; Al-Mutlaq, K.F. Natural and anthropogenic sources of extractable organic matter in sediments from the coastal zone of the Arabian Gulf in Saudi Arabia. Arab. J. Geosci. 2022, 15, 1446. [Google Scholar] [CrossRef]
- Rushdi, A.I.; Al-Mutlaq, K.F.; Simoneit, B.R.T.; Al-Azri, A.; DouAbul, A.A.Z.; Al-Zarban, S.; Al-Yamani, F. Characteristics of lipid tracers to the Arabian Gulf by run-off from rivers and atmospheric dust transport. Arab. J. Geosci. 2010, 3, 113–131. [Google Scholar] [CrossRef]
- Chalastani, V.I.; Manetos, P.; Al-Suwailem, A.M.; Hale, J.A.; Vijayan, A.P.; Pagano, J.; Williamson, I.; Henshaw, S.D.; Albaseet, R.; Butt, F. Reconciling tourism development and conservation outcomes through marine spatial planning for a Saudi Giga-Project in the Red Sea (The Red Sea Project, Vision 2030). Front. Mar. Sci. 2020, 7, 168. [Google Scholar] [CrossRef]
- Rushdi, A.I.; Rasul, N.M.; Bazeyad, A.; Dumenden, R. Distribution and sources of hydrocarbon compounds in sediments from Obhur Lagoon: Red Sea coast of Saudi Arabia. In Oceanographic and Biological Aspects of the Red Sea; Springer: Cham, Switzerland, 2019; pp. 133–146. [Google Scholar]
- Rushdi, A.I.; El-Mubarak, A.H.; Simoneit, B.R.T.; Goni, M.A.; Qurban, M.A.; Bazeyad, A.Y.; Al-Otaibi, M.T.; Muhammed, Z.N. Levels, spatial distributions, and provision of petroleum hydrocarbons and phthalates in sediments from Obhur lagoon, Red Sea coast of Saudi Arabia. Environ. Geochem. 2023. [Google Scholar] [CrossRef]
- Rushdi, A.I.; Simoneit, B.R.T.; DouAbul, A.A.Z.; Al-Mutlaq, K.F.; El-Mubarak, A.H.; Qurban, M.; Goni, M.A. Occurrence, distribution and sources of polar lipid tracers in sediments from the Shatt al-Arab River, Iraq—Polar compounds. Sci. Total Environ. 2014, 471, 180–192. [Google Scholar] [CrossRef] [PubMed]
- Rushdi, A.I.; DouAbul, A.A.; Simoneit, B.R.; El-Mubarak, A.H.; Al-Mutlaq, K.F.; Qurban, M.A.; Goni, M.A. Nonpolar lipid tracers in sediments from the Shatt al-Arab River of Iraq and the northwestern Arabian Gulf. Arab. J. Geosci. 2014, 7, 5495–5508. [Google Scholar] [CrossRef]
- Saleh, A.M.S. Toward an Extraordinary Ecotourism Destination on the Shoreline of Aseer Region, Kingdom of Saudi Arabia. Doctoral Dissertation, Illinois Institute of Technology, Chicago, IL, USA, 2022. [Google Scholar]
- Rushdi, A.I.; DouAboul, A.A.; Mohammed, S.S.; Simoneit, B.R.T. Distribution and sources of extractable organic matter in the Mesopotamian wetland marsh sediments of Iraq: I—Aliphatic lipids. Environ. Geol. 2006, 50, 857–866. [Google Scholar] [CrossRef]
- Simoneit, B.R.T. Application of molecular marker analysis to vehicular exhaust for source reconciliation. Int. J. Environ. Anal. Chem. 1985, 22, 203–233. [Google Scholar] [CrossRef]
- Bouloubassi, I.; Fillaux, J.; Saliot, A. Hydrocarbons in surface sediments from the Changjiang (Yangtze River) Estuary, East China Sea. Mar. Pollut. Bull. 2001, 42, 1335–1346. [Google Scholar] [CrossRef]
- El Nemr, A.; El-Sadaawy, M.M.; Khaled, A.; El-Sikaily, A. Distribution patterns and risks posed of polycyclic aromatic hydrocarbons contaminated in the surface sediment of the Red Sea coast (Egypt). Desalin. Water Treat. 2014, 52, 7964–7982. [Google Scholar] [CrossRef]
- Wang, X.C.; Sun, S.; Ma, H.Q.; Liu, Y. Sources and distribution of aliphatic and polyaromatic hydrocarbons in sediments of Jiaozhou Bay, Qingdao, China. Mar. Pollut. Bull. 2006, 52, 129–138. [Google Scholar] [CrossRef]
- Neves, P.A.; Costa, P.G.; Portz, L.C.; Garcia, M.R.; Fillmann, G. Levels and sources of hydrocarbons in the Patos Lagoon estuary and Cassino Beach mud bank (South Atlantic, Brazil): Evidence of transference between environments. Environ. Monit. Assess. 2023, 195, 484. [Google Scholar] [CrossRef]
- Shirneshan, G.; Bakhtiari, A.R.; Memariani, M. Distribution and origins of n-alkanes, hopanes, and steranes in rivers and marine sediments from Southwest Caspian coast, Iran: Implications for identifying petroleum hydrocarbon inputs. Environ. Sci. Pollut. Res. 2016, 23, 17484–17495. [Google Scholar] [CrossRef]
- Tsapakis, M.; Dakanali, E.; Stephanou, E.G.; Karakassis, I. PAHs and n-alkanes in Mediterranean coastal marine sediments: Aquaculture as a significant point source. J. Environ. Monit. 2010, 12, 958–963. [Google Scholar] [CrossRef] [PubMed]
- Bray, E.E.; Evans, E.D. Distribution of n-paraffins as a clue to recognition of source beds. Geochim. Cosmochim. Acta 1961, 22, 2–15. [Google Scholar] [CrossRef]
- Mazurek, M.A.; Simoneit, B.R.T. Characterization of biogenic and petroleum derived organic matter in aerosols over remote, rural and urban areas. In Identification and Analysis of Organic Pollutants in Air; Kieth, L.H., Ed.; American Chemical Soc Symp. Ann Arbor Science/Butterworth Publishers: Woburn, MA, USA, 1984; pp. 353–370. [Google Scholar]
- Simoneit, B.R.T. The organic chemistry of marine sediments. In Chemical Oceanography, 2nd ed.; Riley, J.P., Chester, R., Eds.; Academic Press: New York, NY, USA, 1978; pp. 233–311. [Google Scholar]
- Zhang, Z.; Zhao, M.; Eglinton, G.; Lu, H.; Huang, C.-Y. Leaf wax lipids as paleovegetational and paleoenvironmental proxies for the Chinese Loess Plateau over the last 170 kyr. Quat. Sci. Rev. 2006, 25, 575–594. [Google Scholar] [CrossRef]
- Ficken, K.J.; Li, B.; Swain, D.E.; Eglinton, G. An n-alkanes proxy for the sedimentary input of submerged/floating fresh water aquatic macrophytes. Org. Geochem. 2000, 31, 745–749. [Google Scholar] [CrossRef]
- Diefendorf, A.F.; KH, F.; Wing, S.L. A comparison of terpenoid and leaf fossil vegetation proxies in Paleocene and Eocene Bighorn Basin sediments. Org. Geochem. 2014, 71, 30–42. [Google Scholar] [CrossRef]
- Simoneit, B.R.T. Organic matter of troposphere—V: Application of molecular analysis to biogenic emissions into troposphere for source reconciliations. J. Atmos. Chem. 1989, 8, 251–275. [Google Scholar] [CrossRef]
- Bourbonniere, R.A.; Meyers, P.A. Sedimentary geolipid records of historical changes in the watersheds and productivities of Lakes Ontario and Erie. Limnol. Oceanogr. 1996, 41, 352–359. [Google Scholar] [CrossRef]
- Garcia, M.R.; Cattani, A.P.; Cunha Lana, P.; Figueira, R.C.L.; Martins, C.C. Petroleum biomarkers as tracers of low-level chronic oil contamination of coastal environments: A systematic approach in a subtropical mangrove. Environ. Pollut. 2019, 249, 1060–1070. [Google Scholar] [CrossRef]
- Rushdi, A.I.; Al-Shaikh, I.; El-Mubarak, A.H.; Alnaimi, H.A.; Al-Shamary, N.; Hassan, H.M.; Assali, M.A. Characteristics and sources of anthropogenic and biogenic hydrocarbons in sediments from the coast of Qatar. Mar. Pollut. Bull. 2017, 124, 56–66. [Google Scholar] [CrossRef]
- Boonyatumanond, R.; Wattayakorn, G.; Togo, A.; Takada, H. Distribution and origins of polycyclic aromatic hydrocarbons (PAHs) in riverine, estuarine, and marine sediments in Thailand. Mar. Pollut. Bull. 2006, 52, 942–956. [Google Scholar] [CrossRef] [PubMed]
- Jafarabadi, A.R.; Dashtbozorg, M.; Bakhtiari, A.R.; Maisano, M.; Cappello, T. Geochemical imprints of occurrence, vertical distribution and sources of aliphatic hydrocarbons, aliphatic ketones, hopanes and steranes in sediment cores from ten Iranian Coral Islands, Persian Gulf. Mar. Pollut. Bull. 2019, 144, 287–298. [Google Scholar] [CrossRef] [PubMed]
- Keshavarzifard, M.; Zakaria, M.P.; Sharifinia, M.; Grathwohl, P.; Keshavarzifard, S.; Sharifi, R.; Mehr, M.R. Determination of hydrocarbon sources in major rivers and estuaries of peninsular Malaysia using aliphatic hydrocarbons and hopanes as biomarkers. Environ. Forensics 2022, 23, 255–268. [Google Scholar] [CrossRef]
- Peters, K.E.; Moldowan, J.M. The Biomarker Guide: Interpreting Molecular Fossils in Petroleum and Ancient Sediments; Prentice-Hall: Englewood Cliffs, NJ, USA, 1993. [Google Scholar]
- Rushdi, A.I.; Simoneit, B.R.T. Hydrothermal alteration of organic matter in sediments of the northeastern Pacific Ocean: Part 1. Middle Valley, Juan de Fuca Ridge. Appl. Geochem. 2002, 17, 1401–1428. [Google Scholar] [CrossRef]
- Rushdi, A.I.; Simoneit, B.R.T. Hydrothermal alteration of organic matter in sediments of the Northeastern Pacific Ocean: Part 2. Escanaba Trough, Gorda Ridge Appl. Geochem. 2002, 17, 1467–1494. [Google Scholar] [CrossRef]
- Budge, S.M.; Parish, C.C. Lipid biogeochemistry of plankton, settling matter and sediments in Trinity Bay, Newfoundland. II. Fatty acids. Org. Geochem. 1998, 29, 1547–1559. [Google Scholar] [CrossRef]
- Khotimchenko, S.V.; Vaskovsky, V.E.; Titlyanova, T.V. Fatty acids of marine algae from the Pacific coast of North California. Bot. Mar. 2002, 45, 17–22. [Google Scholar] [CrossRef]
- Oyo-Ita, O.E.; Oyo-Ita, I.O. Fatty acid and alcohol distributions and sources in surface sediments of Imo River, southeast Niger Delta, Nigeria. Environ. Nat. Resour. Res. 2012, 2, 101–113. [Google Scholar] [CrossRef]
- Treignier, C.; Derenne, S.; Saliot, A. Terrestrial and marine n-alcohol inputs and degradation processes relating to a sudden turbidity current in the Zaire canyon. Org. Geochem. 2006, 37, 1170–1184. [Google Scholar] [CrossRef]
- Mudge, S.M.; Belanger, S.E.; DeLeo, P.C. Fatty Alcohols: Anthropogenic and Natural Occurrence in the Environment; Royal Society of Chemistry: London, UK, 2018. [Google Scholar]
- Gevao, B.; Boyle, E.A.; Carrasco, G.G.; Ghadban, A.N.; Zafar, J.; Bahloul, M. Spatial and temporal distributions of polycyclic aromatic hydrocarbons in the Northern Arabian Gulf sediments. Mar. Pollut. Bull. 2016, 112, 218–224. [Google Scholar] [CrossRef]
- Soliman, Y.S.; Al Ansari, E.M.S.; Wade, T.L. Concentration, composition and sources of PAHs in the coastal sediments of the exclusive economic zone (EEZ) of Qatar, Arabian Gulf. Mar. Pollut. Bull. 2014, 85, 542–548. [Google Scholar] [CrossRef] [PubMed]
- Kawka, O.E.; Simoneit, B.R. Polycyclic aromatic hydrocarbons in hydrothermal petroleums from the Guaymas Basin spreading center. Appl. Geochem. 1990, 5, 17–27. [Google Scholar] [CrossRef]
- Soliman, Y.S.; Alansari, E.M.; Sericano, J.L.; Wade, T.L. Spatio-temporal distribution and sources identifications of polycyclic aromatic hydrocarbons and their alkyl homolog in surface sediments in the central Arabian Gulf. Sci. Total Environ. 2019, 658, 787–797. [Google Scholar] [CrossRef] [PubMed]
- Yunker, M.B.; Macdonald, R.W.; Vingarzan, R.; Mitchell, R.H.; Goyette, D.; Sylvestre, S. PAHs in the Fraser River basin: A critical appraisal of PAH ratios as indicators of PAH source and composition. Org. Geochem. 2002, 33, 489–515. [Google Scholar] [CrossRef]
- Ramirez, M.M.B.; Caamal, R.D.; Osten, J.R. Occurrence and seasonal distribution of microplastics and phthalates in sediments from the urban channel of the Ria and coast of Campeche, Mexico. Sci. Total Environ. 2019, 672, 97–105. [Google Scholar] [CrossRef] [PubMed]
- Arfaeinia, H.; Fazlzadeh, M.; Taghizadeh, F.; Saeedi, R.; Spitz, J.; Dobaradaran, S. Phthalate acid esters (PAEs) accumulation in coastal sediments from regions with different land use configuration along the Persian Gulf. Ecotoxicol. Environ. Saf. 2019, 169, 496–506. [Google Scholar] [CrossRef] [PubMed]
- Cesar, A.; Lia, L.R.B.; Pereira, C.D.S.; Santos, A.R.; Cortez, F.S.; Choueri, R.B.; Rachid, B.R.F. Environmental assessment of dredged sediment in the major Latin American seaport (Santos, São Paulo—Brazil): An integrated approach. Sci. Total Environ. 2014, 497, 679–687. [Google Scholar] [CrossRef]
- Sivadas, S.K.; Mishra, P.; Kaviarasan, T.; Sambandam, M.; Dhineka, K.; Murthy, M.R.; Hoehn, D. Litter and plastic monitoring in the Indian marine environment: A review of current research, policies, waste management, and a roadmap for multidisciplinary action. Mar. Pollut. Bull. 2022, 176, 113424. [Google Scholar] [CrossRef]
- Isobe, A.; Iwasaki, S. The fate of missing ocean plastics: Are they just a marine environmental problem? Sci. Total Environ. 2022, 825, 153935. [Google Scholar] [CrossRef]
- Jang, M.; Shim, W.J.; Han, G.M.; Cho, Y.; Hong, S.H. Plastic debris as a mobile source of additive chemicals in marine environments: In-situ evidence. Sci. Total Environ. 2023, 856, 158893. [Google Scholar] [CrossRef]
- Fan, S.; Yan, Z.; Qiao, L.; Gui, F.; Li, T.; Yang, Q.; Ren, C. Biological effects on the migration and transformation of microplastics in the marine environment. Mar. Environ. Res. 2023, 185, 105875. [Google Scholar] [CrossRef] [PubMed]
- Peng, L.; Fu, D.; Qi, H.; Lan, C.Q.; Yu, H.; Ge, C. Micro-and nano-plastics in marine environment: Source, distribution and threats—A review. Sci. Total Environ. 2020, 698, 134254. [Google Scholar] [CrossRef] [PubMed]
- Xanthos, D.; Walker, T.R. International policies to reduce plastic marine pollution from single-use plastics (plastic bags and microbeads): A review. Mar. Pollut. Bull. 2017, 118, 17–26. [Google Scholar] [CrossRef] [PubMed]
- Walker, T.R.; Reid, K.; Arnould, J.P.Y.; Croxall, J.P. Marine debris surveys at Bird Island, South Georgia 1990–1995. Mar. Pollut. Bull. 1997, 34, 61–65. [Google Scholar] [CrossRef]
- Surhoff, T.J.; Scholz-Bottcher, B.M. Qualitative impact of salinity, UV radiation and turbulence on leaching of organic plastic additives from four common plastics—A lab experiment. Mar. Pollut. Bull. 2016, 102, 84–94. [Google Scholar] [CrossRef]
- Dong, C.D.; Huang, C.P.; Nguyen, T.B.; Hsiung, C.F.; Wu, C.H.; Lin, Y.L.; Hung, C.M. The degradation of phthalate esters in marine sediments by persulfate over iron–cerium oxide catalyst. Sci. Total Environ. 2019, 696, 133973. [Google Scholar] [CrossRef]
- Tranganida, A.; Hall, A.J.; Armstrong, H.C.; Moss, S.E.; Bennett, K.A. Consequences of in vitro benzyl butyl phthalate exposure for blubber gene expression and insulin-induced Akt activation in juvenile grey seals. Environ. Pollut. 2023, 316, 120688. [Google Scholar] [CrossRef]
- Squillante, J.; Scivicco, M.; Ariano, A.; Nolasco, A.; Esposito, F.; Cacciola, N.A.; Cirillo, T. Occurrence of phthalate esters and preliminary data on microplastics in fish from the Tyrrhenian sea (Italy) and impact on human health. Environ. Pollut. 2023, 316, 120664. [Google Scholar] [CrossRef]


| Al-Qahma | Al-Wajh | |
|---|---|---|
| n-Alkanes | ||
| Range | 15–33 | 14–33 |
| Cmax | 17, 19, 20, 24, 25, 27 | 16, 18, 20 |
| Concentration range (ng/g) | 0–1048 | 11–278 |
| Average concentration ± SD (ng/g) | 235 ± 232 | 64 ± 50 |
| CPI (o/e) | 1.2 ± 0.6 | 0.4 ± 0.1 |
| TAR | 0.75 ± 0.58 | 0.11 ± 0.05 |
| LMW/HMW | 2.0 ± 0.9 | 13.0 ± 2.2 |
| Wax n-Alkanes (ng/g) | 25.3 ± 36.5 | 1.0 ± 0.9 |
| Algal n-Alkanes (ng/g) | 58.6 ± 109.9 | 12.6 ± 13.5 |
| Bacterial n-Alkanes (ng/g) | 51.3 ± 55.6 | 28.4 ± 17.7 |
| Petroleum n-Alkanes (ng/g) | 167.4 ± 264.0 | 22.0 ± 19.0 |
| Hopanes | ||
| Range | 27–35 | 27–34 |
| Cmax | 29, 30 | 29, 30 |
| Concentration range (ng/g) | 0–736.3 | 0–9.5 |
| Average concentration ± SD (ng/g) | 29.8 ± 132.3 | 1.0 ± 2.5 |
| C31 S/(R+S) | 0.67 ± 0.10 | 0.60 ± 0.07 |
| C32 S/(R+S) | 0.71 ± 0.14 | 0.62 ± 0.07 |
| Steranes | ND | T |
| n-Alkanoic Acids | ||
| Range | 9–20 | 5–21 |
| Cmax | 16 | 16, 17, 18 |
| Concentration range (ng/g) | 43.3–2973.2 | 4.1–304.0 |
| Average concentration ± SD (ng/g) | 745.8 ± 799.6 | 120.7 ± 92.0 |
| CPI (e/o) | 15.3 ± 13.5 | 0.9 ± 1.0 |
| n-Alkanols | ||
| Range | 12–28 | 11–26 |
| Cmax | 16, 18, 22, 24 | 16, 18, 22 |
| Concentration range (ng/g) | 27.2–5607.5 | 10.2–162.1 |
| Average concentration ± SD (ng/g) | 457.4 ± 1085.6 | 49.7 ± 32.3 |
| CPI (e/o) | 6.2 ± 4.8 | 4.7 ± 1.0 |
| PAH | ||
| Concentration range (ng/g) | 0–545.4 | 0–38.0 |
| Average concentration ± SD (ng/g) | 54.5 ± 96.8 | 7.8 ± 8.5 |
| Ant/(Ant + Phe) | 0.75 ± 0.38 | 0.50 ± 0.15 |
| Plasticizers | ||
| Concentration range (ng/g) | 34.9–822.7 | 18.9–312.4 |
| Average concentration ± SD (ng/g) | 185.3 ± 169.9 | 67.4 ± 70.4 |
Disclaimer/Publisher’s Note: The statements, opinions and data contained in all publications are solely those of the individual author(s) and contributor(s) and not of MDPI and/or the editor(s). MDPI and/or the editor(s) disclaim responsibility for any injury to people or property resulting from any ideas, methods, instructions or products referred to in the content. |
© 2024 by the authors. Licensee MDPI, Basel, Switzerland. This article is an open access article distributed under the terms and conditions of the Creative Commons Attribution (CC BY) license (https://creativecommons.org/licenses/by/4.0/).
Share and Cite
Al-Otaibi, M.T.; Rushdi, A.I.; Rasul, N.; Bazeyad, A.; Al-Mutlaq, K.F.; Aloud, S.S.; Alharbi, H.A. Occurrence, Distribution, and Sources of Aliphatic and Cyclic Hydrocarbons in Sediments from Two Different Lagoons along the Red Sea Coast of Saudi Arabia. Water 2024, 16, 187. https://doi.org/10.3390/w16010187
Al-Otaibi MT, Rushdi AI, Rasul N, Bazeyad A, Al-Mutlaq KF, Aloud SS, Alharbi HA. Occurrence, Distribution, and Sources of Aliphatic and Cyclic Hydrocarbons in Sediments from Two Different Lagoons along the Red Sea Coast of Saudi Arabia. Water. 2024; 16(1):187. https://doi.org/10.3390/w16010187
Chicago/Turabian StyleAl-Otaibi, Mubarak T., Ahmed I. Rushdi, Najeeb Rasul, Abdulqader Bazeyad, Khalid F. Al-Mutlaq, Saud S. Aloud, and Hattan A. Alharbi. 2024. "Occurrence, Distribution, and Sources of Aliphatic and Cyclic Hydrocarbons in Sediments from Two Different Lagoons along the Red Sea Coast of Saudi Arabia" Water 16, no. 1: 187. https://doi.org/10.3390/w16010187