Article

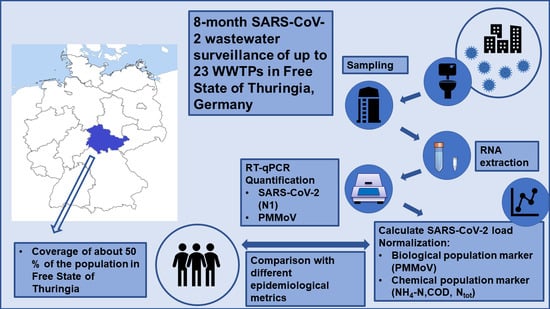
SARS-CoV-2 Wastewater Monitoring in Thuringia, Germany: Analytical Aspects and Normalization of Results

1
Department Hamm 2, Hamm-Lippstadt University of Applied Sciences, 59063 Hamm, Germany
2
Bauhaus-Institute for Infrastructure Solutions (b.is), Bauhaus University Weimar, 99423 Weimar, Germany
3
Analytik Jena GmbH + Co. KG, 07745 Jena, Germany
4
Institute of Digital and Autonomous Construction, Hamburg University of Technology, 21079 Hamburg, Germany
5
Institute for Water Quality and Resources Management, Vienna University of Technology, 1040 Vienna, Austria
6
Institute of Environmental Engineering, RWTH Aachen University, 52074 Aachen, Germany
7
Institute for Infectious Diseases and Infection Control, Jena University Hospital/Friedrich-Schiller-University, Am Klinikum 1, 07740 Jena, Germany
*
Author to whom correspondence should be addressed.
Water 2023, 15(24), 4290; https://doi.org/10.3390/w15244290
Submission received: 9 November 2023 / Revised: 6 December 2023 / Accepted: 11 December 2023 / Published: 15 December 2023

Abstract

:
Wastewater monitoring for SARS-CoV-2 is a valuable tool for surveillance in public health. However, reliable analytical methods and appropriate approaches for the normalization of results are important requirements for implementing state-wide monitoring programs. In times of insufficient case reporting, the evaluation of wastewater data is challenging. Between December 2021 and July 2022, we analyzed 646 samples from 23 WWTPs in Thuringia, Germany. We investigated the performance of a direct capture-based method for RNA extraction (4S-method) and evaluated four normalization methods (NH4-N, COD, Ntot, and PMMoV) in a pooled analysis using different epidemiological metrics. The performance requirements of the 4S method were well met. The method could be successfully applied to implement a state-wide wastewater monitoring program including a large number of medium and small wastewater treatment plants (<100,000 p.e) in high spatial density. Correlations between wastewater data and 7-day incidence or 7-day-hospitalization incidence were strong and independent from the normalization method. For the test positivity rate, PMMoV-normalized data showed a better correlation than data normalized with chemical markers. In times of low testing frequency and insufficient case reporting, 7-day-incidence data might become less reliable. Alternative epidemiological metrics like hospital admissions and test positivity data are increasingly important for evaluating wastewater monitoring data and normalization methods. Furthermore, future studies need to address the variance in biological replicates of wastewater.

Graphical Abstract

1. Introduction

The 2019 coronavirus pandemic (COVID-19) has revealed the pivotal role of surveillance instruments in pandemic management and preparedness. Classical epidemiological metrics, such as cumulative COVID-19 incidence, COVID-19-related hospitalization, and death rates, have been shown to be affected by testing strategy, accessibility to testing and healthcare facilities, as well as the performance of local reporting systems [1,2] and are, therefore, frequently biased. In this context, wastewater monitoring of SARS-CoV-2 has proven to be a precious and complementary instrument with strengths over the aforementioned epidemiological metrics: (a) it is an objective source of information on virus prevalence in a population and independent of individual human testing strategies, (b) under certain circumstances acts as an early indicator (3–7 days/4–10 days) of rising trends in reported COVID-19 cases [3,4,5,6,7], and (c) it is a more cost-effective measure than individual testing [2]. Consequentially, wastewater surveillance programs for SARS-CoV-2 have been implemented globally within the last two years [1,8]. However, reliable and robust analytical methods are essential for successfully implementing wastewater monitoring systems. Currently, there is no standard method or approach for detecting SARS-CoV-2 RNA in wastewater [2]. Several methods, primarily based on RT-qPCR or dPCR, are used to detect SARS-CoV-2 RNA fragments [9,10,11,12]. These methods mainly differ in the concentration procedure (membrane filtration, centrifugation, and PEG precipitation) or molecular detection, e.g., target sequences, PCR primers, and probes. The choice of method mostly depends on the availability of resources and the local lab equipment, as well as the costs of consumables.
A cost-effective and kit-free extraction method that has been widely used is the 4S method by Whitney et al. [13]. The 4S method has already been successfully applied in several studies for SARS-CoV-2 wastewater monitoring [9,13,14,15,16], SARS-CoV-2 variant analysis [14,17], and preparation of RNA extracts for genome sequencing [18]. Unlike many other methods, the 4S method has no explicit concentration step, e.g., by membrane filtration or precipitation. Concentration is achieved solely by volume reduction during RNA extraction using silica columns (direct capture). Furthermore, the sample preparation and RNA extraction are very easily applicable in a microbiological lab equipped as standard.
In addition to different analytical approaches, the informative value of wastewater-based data is influenced by several other factors: (a) the size of the sewage system and flow times in the sewer, (b) wastewater composition as well as catchment characteristics (e.g., amount and type of industrial dischargers), and (c) seasonal variation in wastewater-quality and -loads, e.g., because of tourism, industrial production, or rainfall [19,20,21,22,23]. Regarding the latter, the normalization of SARS-CoV-2 levels using population markers may be critical for viral load interpretation. There is a wide variety of normalization methods documented in the literature [24]. According to the current status, normalization based on flow measurements is chosen most frequently [25,26,27]. Furthermore, standard wastewater parameters such as ammonia (NH4-N), total nitrogen (Ntot), or chemical oxygen demand (COD) are used as population markers for normalization. Chemical tracers such as caffeine, carbamazepine, creatinine, and 5-hydroxy indole acetic acid (5 HIAA) might also be useful for wastewater-based epidemiology [24]. In addition, some studies also indicate that normalization using biological population markers such as pepper mild mottle virus (PMMoV) [1,7,16,28,29], cross-assembly phages (crAssPhage) [25,29], or Bacteroides HF183 [15] may be useful. However, the added value of these biomarkers is discussed controversially in the literature [7,20,26,30,31,32]. A central challenge for a comparative evaluation of different normalization methods is the availability of an appropriate standard for assessing SARS-CoV-2 prevalence in a population. So far, most studies comparing different normalization methods are using cumulative incidence data based on individual human testing [15,16,32,33]. However, as mentioned above, these data might be biased, especially in those pandemic phases with low test coverage or capacity. A recent report by the CDC [34] demonstrates that COVID-19 hospital admission rates and the percentage of positive test results might be suitable additional indicators for monitoring trends in COVID-19 activity. Consequentially, studies evaluating normalization methods in wastewater monitoring programs should include theses epidemiological metrics as well.
Only a few studies on wastewater monitoring of SARS-CoV-2 have been published for Germany [17,29,35,36,37,38,39]. These studies mostly focus on very large wastewater treatment plants (>150,000 p.e.). In contrast to these studies, we investigated a large number of medium and small wastewater treatment plants (<100,000 p.e) in high spatial density. Even so, the European Union recommends focusing on very large wastewater treatment plants (>150,000 p.e.) [40], as these wastewater treatment plants cover about 43.8% of connected inhabitants. Studies focusing on medium and small wastewater treatment plants are of interest because more than 90% of the wastewater treatment plants in the European Union are smaller than 100,000 p.e. [40]. In this study, we present data from a German wastewater monitoring program in the Free State of Thuringia, Germany, and aim to investigate (A) the performance of the 4S method for a SARS-CoV-2 monitoring program and (B) the effect as well as the potential of different normalization methods. Between December 2021 and July 2022, we collected 646 samples from up to 23 wastewater treatment plants (WWTPs) of different sizes. During the monitoring program, samples were analyzed up to twice a week with an analytical method already described by Wilhelm et al. [17,41]. Besides regular monitoring, a second analytical approach with the 4S method was used. Once a week, a sub-sample of the regular monitoring samples was processed using the 4S method to investigate specific aspects of quality assurance. This study is based on the data collected with the 4S method. For our analysis, we used the pooled data set from all WWTPs in the program and applied (I) flow-normalization as well as normalization with chemical water quality markers: (II) ammonium NH4-N, (III) chemical oxygen demand COD, and (IV) total nitrogen Ntot. Furthermore, we used the biomarker (V) PMMoV for normalization. To evaluate the different normalization methods, we used the following epidemiological metrics for COVID-19 frequency: (1) 7-day incidences per 100,000 inhabitants (county level and federal state level), (2) 7-day-hospitalized COVID-19 cases per 100,000 inhabitants (federal state level), and (3) the relative proportion of positive tests from participating laboratories in the Free State of Thuringia.

2. Materials and Methods

2.1. Sampling Sites, Wastewater Sampling, and Transport

The Free State of Thuringia, with around 2,100,000 inhabitants, has many sparsely populated rural areas and, in consequence, many small- and middle-sized WWTPs. Up to 23 WWTPs distributed representatively over the entire federal state were included in the monitoring program. In Germany, WWTPs are classified according to specific capacity-describing parameters. As a rule, size classes (GK) are based on the population equivalent (p.e.). Here, a distinction is made between five size classes (GK 1 = <1000 p.e.; GK 2 = 1000–5000 p.e.; GK 3 = 5001–10,000 p.e.; GK 4 = 10,001–100,000 p.e.; and GK 5 = >100,000 p.e.). The number of actual residents served (without industry) was calculated with data collected from the plant operators. In total, we covered the wastewater from up to 1,049,996 inhabitants, which corresponds to about 50% of the population of Thuringia. WWTPs included in the monitoring program are shown in Table 1.
Between 6 December 2021 and 18 July 2022, we analyzed samples from up to 23 WWTPs once a week using the 4S method. The samples were taken as 24 h composite samples in WWTPs influent, usually during the night from Sunday to Monday. At WWTP ID 19, sampling took place from Wednesday to Thursday, and at WWTP ID 18, sampling took place from Thursday to Friday. Time-proportional samples (n = 16 WWTPs) and volume-proportional (n = 7 WWTPs) 24 h composite samples were collected using automatic sampling devices. Sampling, homogenization, and subsampling were carried out by trained personnel of the WWTP according to uniformly defined criteria. Deviations from the specified procedure and abnormalities during sampling were documented in the sampling protocol. Water quality parameters such as NH4-N, Ntot, and COD were measured by the WWTP employees in the same 24 h composite samples as used to determine the SARS-CoV-2 and PMMoV concentrations.
Per treatment plant, 500 mL of wastewater was sent to the laboratory and arrived within 24 h after sampling. All samples were stored at 4 °C during transport and until analysis.

2.2. Physicochemical Standard Parameters

The following standard physicochemical parameters were analyzed on-site at the WWTP according to generally accepted standard methods (ISO standards): pH-value, temperature, chemical oxygen demand (COD [42,43,44], total bound nitrogen (Ntot) [45,46], and NH4-N [47,48].

2.3. RNA Extraction from Wastewater and Quantification using RT-qPCR

Three biological replicates were prepared for each wastewater sample upon arrival at the laboratory. Each replicate was further analyzed using a volume of 40 mL. The kit-free “Sewage, Salt, Silica and SARS-CoV-2” (4S) method was used for sample preparation and RNA extraction [13]: Each 40 mL aliquot of wastewater was mixed with 9.35 g NaCl (≥99 %, Ph. Eur., USP, Carl Roth GmbH + Co. KG, Karlsruhe, Germany) and 400 µL of a TE buffer at pH 7.2 and shaken. The aliquots were stored overnight at 4 °C until further processing. For pre-treatment, the solution was filtered through a 5 µm PVDF filter (Durapore®, Merck KGaA, Darmstadt, Germany) using a syringe filter to remove large particles. Then, 40 mL of 70% EtOH was added to a 40 mL filtrate and homogenized to isolate nucleic acids from the 80 mL wastewater lysate–EtOH mixture and the sample was filtered over silica gel spin columns via vacuum (Zymo-Spin III; ZYMO Research Europe GmbH, Freiburg, Germany). After washing, nucleic acids were eluted in 200 µL of a ZymoPURETM elution buffer (ZYMO Research Europe GmbH, Freiburg, Germany). The ZymoPURETM elution buffer (ZYMO Research Europe GmbH, Freiburg, Germany) was previously warmed to 50 °C. The total RNA concentration [µg/mL], A260 nm/A280 nm quotient, and absorbance at 260 nm of the RNA extracts were measured using a spectrophotometer (Eppendorf BioPhotometer D30, Eppendorf SE, Hamburg, Germany). For the detection and quantification of SARS-CoV-2-specific RNA sequences, we used an RT-qPCR cycler (CFX96 Touch Real-Time PCR Detection System, Bio-Rad Laboratories GmbH, Feldkirchen, Germany) and the SARS-CoV-2 N1 RT-qPCR Kit for Wastewater (Promega GmbH, Walldorf, Germany) according to the manufacturer’s protocol. All samples were run in technical triplicates. For quantification, each run included a standard curve (six-point serial dilution in triplicate) using the SARS-CoV-2 RNA standard (SARS-CoV-2 RT-qPCR Kit for Wastewater, Promega GmbH, Walldorf, Germany) and the PMMoV RNA Quant standard (SARS-CoV-2 RT-qPCR Kit for Wastewater, Promega GmbH, Walldorf, Germany) reference material. The limit of quantification (LoQ) for the assay was 10 copies per reaction [49]. The RT-qPCR assays were set up in a reaction volume of 20 µL, including a 5 µL RNA extract. Cycling conditions for the RT-qPCR assay were as follows: RT was performed at 45 °C for 15 min, followed by polymerase activation at 95 °C for 2 min and 40 cycles of denaturation, annealing/extension at 95 °C/15 s, then 62 °C/60 s, respectively.
The following quality controls were carried out for verification: triplicate biological extractions, negative extraction controls per RNA extraction, and triplicate technical RT-qPCR reactions. The arithmetic mean, standard deviation, and coefficient of variation (CV) for quantifiable and inhibitor-free replicates were determined for the three biological and technical replicates. Furthermore, the reproducibility was determined by calculating the standard deviation of the log-transformed results of the three biological replicates [9].
Extraction recovery efficiency was tested using MS2 bacteriophage based on the specifications of FA Promega (MS2 RT-qPCR Kit, Promega GmbH, Walldorf, Germany) and Mondal et al. [50,51]. In 22 samples from different WWTPs, the recovery of MS2 bacteriophage was investigated in duplicate.
Additionally, PMMoV was used as an internal control to monitor the success of RNA extraction. We applied the following thresholds, which were derived in a study from Kantor et al. [52], to evaluate our results (Figure S8 in Supplementary Materials): PMMoV concentration lower than 105 GC/L or missing data (poor data quality) and PMMoV concentration higher as 2 × 10⁵ GC/L (acceptable data quality). As the 5% percentile in our data is within the range of the threshold value for acceptable data quality derived by Kantor et al., we decided to use the same threshold values. The extraction process error [%] was determined as the proportion of blocked silica columns [52].
To exclude false-positive results, a negative extraction control was included in each extraction run, and the proportion of positive signals in the negative extraction control was determined at the end of the sampling. We also used PMMoV as an internal process control for RT-qPCR (SARS-CoV-2 RT-qPCR Kit for Wastewater, Promega GmbH, Walldorf, Germany).
Furthermore, the following quality control measures were taken: A no-template control (NTC) and positive control were analyzed in triplicate in each run to exclude contamination and check the correct performance of the RT-qPCR. Furthermore, an internal amplification control (IAC) was analyzed in each well to control the RT-qPCR inhibitors (SARS-CoV-2 RT-qPCR Kit for Wastewater, Promega GmbH, Walldorf, Germany). According to the PCR kit manufacturer’s protocol (SARS-CoV-2 RT-qPCR Kit for Wastewater, Promega GmbH, Walldorf, Germany), the following exclusion limit was defined: If the CT value of the internal amplification control (IAC) in a sample well is significantly shifted against the no-template control (NTC) well (CT ≥ 2), it is assumed that PCR inhibitors are contained in the experimental sample.
For calibration, we used a six-point serial dilution in triplicate on each qPCR plate. Samples with CT values ≥ 40 Ct were determined to be negative for SARS-CoV-2 RNA and PMMoV RNA. For samples with CT values ≤ 40 and >LoQ (calibration standard lowest concentration), the ½ limit of quantitation (LoQ) (5000 GC/L) was specified). The PCR amplification efficiency [%] was calculated according to MIQE guidelines [49].

2.4. Normalization Parameters

For each WWTP, we calculated (a) the virus concentration, (b) the relative SARS-CoV-2 signal related to PMMoV [quotient of GC SARS-CoV-2/24 h and GC PMMoV/24 h], and (c) the viral load per inhabitant and day.
To transfer virus concentration into virus load per inhabitant and day, we first calculated the connected inhabitants using the population marker NH4-N, COD, or Ntot. For the calculation of the population marker-based inhabitants, the daily load of the respective population marker (NH4-N, COD, or Ntot) per WWTP was divided by the daily load per inhabitant. For the daily load per inhabitant, we applied the design criteria according to technical regulation ATV-DVWK-A 198 from the German Association for Water, Wastewater, and Waste (DWA) [53]: per inhabitant and day, we used 8 g NH4-N [54,55], 120 g COD, and 11 g Ntot.
By dividing the daily viral load per WWTP by the connected inhabitants (population marker-based), we obtained the following normalized parameters:
  • Inhabitant-weighted (ammonium-based) 24 h virus load per WWTP [GC SARS-CoV-2/inhabitantNH4 and 24 h] [54,55];
  • Inhabitant-weighted (COD-based) 24 h virus load per WWTP [GC SARS-CoV-2/inhabitantCOD and 24 h];
  • Inhabitant-weighted (nitrogen-based) 24 h virus load per WWTP [GC SARS-CoV-2/inhabitantNtot and 24 h].
Furthermore, we calculated pooled data from all WWTPs in the monitoring program:
  • Average concentration per sampling day [GC SARS-CoV-2/L] (flow-normalized viral load of all sampled WWTPs):
Equation (1): Average SARS-CoV-2 RNA concentration per liter from sampled WWTPs per sampling day.
a v e r a g e   S A R S C o V 2   R N A   c o n c . [ G C L ] = 24   h   v i r u s   l o a d s   o f   s a m p l e d   W W T P   p e r   s a m p l i n g   d a y   [ G C   S A R S C o V 2 / 24 h ] H y d r a u l i c   l o a d s   o f   s a m p l e d   W W T P s   p e r   s a m p l i n g   d a y   [ L 24   h ]
  • Average inhabitant-weighted 24 h virus load per sampling day (population marker X = NH4-N, COD, Ntot) [GC SARS-CoV-2/inhabitantx and 24 h]:
For the calculation of the population-marker-based inhabitants, the sum of the load of the respective population marker (NH4-N, COD, or Ntot) from all sampled WWTPs per day was divided by the above-mentioned daily load per inhabitant.
Equation (2): Average inhabitant-weighted population marker-based virus load per day from sampled WWTPs per sampling day.
a v e r a g e G C   S A R S C o V 2 i n h a b i t a n t X   a n d   d a y = 24   h   v i r u s   l o a d s   o f   s a m p l e d   W W T P   p e r   s a m p l i n g   d a y   [ G C   S A R S C o V 2 / 24   h ] p o p u l a t i o n   m a r k e r   b a s e d   i n h a b i t a n t s   o f   s a m p l e d   W W T P s   p e r   s a m p l i n g   d a y
  • Average relative signal (PMMoV) per sampling day [(GC SARS-CoV-2/24 h)/(GC PMMoV/24 h)]:
Equation (3): Average relative signal (PMMoV) from sampled WWTPs per sampling day.
a v e r a g e   r e l a t i v e   s i g n a l = 24   h   S A R S C o V 2   v i r u s   l o a d s   o f   s a m p l e d   W W T P   p e r   s a m p l i n g   d a y   [ G C   S A R S C o V 2 / 24   h ] 24   h   P M M o V   v i r u s   l o a d s   o f   s a m p l e d   W W T P   p e r   s a m p l i n g   d a y   [ G C   P M M o V / 24   h ]

2.5. Epidemiological Metrics

The epidemiological metrics were obtained from the Robert Koch Institute (RKI), which is the federal public health institute in Germany and responsible for nationwide health surveillance [56].
  • 7-day incidences per 100,000 inhabitants on the federal state level and county/urban district level;
  • 7-day-hospitalized COVID-19 cases per 100,000 inhabitants on the federal-state level;
  • The relative proportion of positive tests (positive test rate) [57]: At the time of our study, the collection of testing data in Germany was based on data from voluntarily participating laboratories in this part of the surveillance system. Testing data from this survey were reported on the federal-state level weekly. The report covers both detection using PCR and serological diagnostics using antibody detection. At the time of our study, two laboratories in Thuringia participated voluntarily and reported 20,429,600 testing data to the Robert Koch Institute. We used these data as a proxy for the positive test rate in the Free State of Thuringia.

2.6. Data Analysis

The parameters used for normalization (PMMoV, NH4-N, Ntot, and COD) were described by calculating the coefficients of variation (CVs) in each WWTP [29]. Furthermore, we pooled the data and examined the temporal variation of the cumulative average concentration. As data were not normally distributed (proofed by the Shapiro–Wilk test), the Spearman rank correlation (r) coefficient was calculated to examine the correlation (i) between the different normalization methods and (ii) between the virus signal in the wastewater and the different epidemiological metrics.
Spearman’s r-values were interpreted according to Sperling et al. [58]: strong correlation (r-value > 0.7); moderate correlation (0.4 < r-value < 0.7); weak correlation (0 < r-value < 0.4); and no correlation (r-value = 0).
During our study period, Thuringia’s testing policy was changed: On 3 April 2022, a new infection protection rule came into force. From this point on, a positive rapid test no longer had to be confirmed using a PCR test. We considered this aspect in our investigation by performing sensitivity analysis for the different time frames: The pooled data set for the state of Thuringia were divided into three time series: (1) 6 December 2021–31 March 2022, (2) 3 April 2022–18 July 2022, and (3) 6 December 2021–18 July 2022 (complete data set). An overview of the methods and data analyses used can be found in Figure S11.
All graphs were created with SigmaPlot (V15). Microsoft Excel 2019 MSO (Version 1808), Sigma Plot (V15), and RStudio (2022.07.0+548) were used to calculate the data.

3. Results

3.1. Performance of the 4S Method for the SARS-CoV-2 Monitoring Program

A total of 646 samples were analyzed in biological triplicates during the sampling period. Upon arrival at the laboratory, the filling and homogenization of samples from 23 WWTPs for overnight treatment was completed by one laboratory worker within 4 h. In collaboration with two laboratory employees, the pre-treatment of the samples was completed within 2–3 h the following day. The extraction of nucleic acids from all biological replicates was successfully completed within 4–5 h. We calculated costs for sampling preparation and RNA extraction of EUR 14.07 per biological replicate (Table S3 in Supplementary Materials).
Approximately 3% of the silica columns used for RNA extraction became clogged and had to be discarded. Possible cross-contamination of the samples was monitored via the negative extraction control and the NTC in the RT-qPCR. No positive signal for the N1 assay was detected in any NTC control. Amplification of the negative extraction control of the N1 assay was rare. One out of 34 negative extraction controls showed amplification in one out of three technical replicates (CT = 38). As the two other technical replicates showed no amplification, we did not exclude the samples from the analysis. In individual biological replicates (n = 102 of n = 1938 preparations; approx. 5%), we found indications of the presence of PCR inhibitors. A total of 26 samples could not be used for quantitative evaluation, as all three extracts showed clear evidence of inhibitors. A total of 22 of the 26 samples with inhibition were sampled in the period from 21 March 2022 to 5 May 2022. The samples were from different WWTPs, and all showed qualitative positive results for SARS-CoV-2 RNA (CT ≤ 40). After excluding the samples with an indication of inhibition, the pooled data set for the analysis comprised 620 samples.
About 10% of the biological replicates (n = 213 of n = 1938) could not be quantified but had a qualitative positive signal for SARS-CoV-2 N1 assay and were included in data analysis with a ½ limit of quantification (5000 GC/L).
The recoveries for MS2 bacteriophage in the 22 different wastewater samples ranged from 2.4 to 13.9%, with a median value of 6.5%. The positive control (matrix: PBS buffer) showed a recovery of 4.1%. Using PMMoV as an internal control for a successful RNA extraction, we took thresholds for quality control by Kantor et al. [52]. A total of 1% of the extracted samples indicated poor quality and were examined in a sensitivity analysis.
All PCR runs had an r2 value of at least 0.98, and the PCR efficiencies averaged 95% (SARS-CoV-2 N1 assay) and 94% (PMMoV assay). The results of the RT-qPCR evaluation can be found in the Supplementary Materials (Figures S9 and S10).

3.2. Description of SARS-CoV-2 Concentration and Normalization Parameters

Figure 1 demonstrates the variation of measured concentrations of PMMoV and SARS-CoV-2 in all biological and technical replicates of our pooled data set. In comparison, variation in technical replicates was low and almost comparable for both assays, with maximum coefficients of variations (CVs) of 7.9% for SARS-CoV-2 N1 and 3.5% for PMMoV. There was a considerably higher variation in biological replicates with CVs of up to 76% and 119% for SARS-CoV-2 N1 and PMMoV, respectively (Table S2 and standard deviation in Figures S6 and S7 in Supplementary Materials).
As chemical parameters used for normalization were not available for all 620 samples, sample sizes for normalization parameters were as follows: ammonia (n = 599), total nitrogen (n = 465), and COD (n = 565). Figure 2 and Figure 3 show the variation of normalization parameters PMMoV and ammonia within the 23 WWTPs. The average concentration (mean of biological replicates) of PMMoV varies more strongly than the average concentration of the chemical parameter ammonia.
The median PMMoV concentrations for all 23 sampled municipal WWTPs are in the range of 5 × 10⁵–2 × 10⁶ GC/L (mean PMMoV concentration: range of 9 × 10⁵–4 × 10⁶ GC/L). The CVs of the PMMoV concentration range from 0.85 to 1.47 and vary considerably between the individual WWTPs. A total of 13 out of 23 WWTPs show CVs greater than 1.
In Figure 3, ammonium concentrations of samples for the WWTPs under investigation are depicted with a median from 11 to 59 mg/L and a mean from 11 to 59 mg/L. CVs of ammonium are in the range of 0.02–0.46. For COD and Ntot, results are comparable (Figures S1 and S2 in Supplementary Materials).
The temporal variation of the cumulative mean concentration (which was calculated as daily load flow-normalized) of NH4-N and PMMoV in the pooled data set is illustrated in Figure 4. Compared to NH4-N (as well as COD and Ntot, Figure S3 in Supplementary Materials), PMMoV shows a different pattern over time. PMMoV concentration had a peak at the end of December and at the end of March/beginning of April. These peaks could not be observed for NH4-N (also not for COD and Ntot, Figure S3 in Supplementary Materials). In June and July 2022, concentrations of PMMoV were very low, whereas the average concentration of NH4-N was relatively high. The CVs for cumulative average concentrations for NH4-N, COD, and Ntot are as follows: 0.22, 0.18, and 0.17, and 0.78 for PMMoV (Figure 4 and Figure S3 in Supplementary Materials).
The Spearman correlation coefficient between the cumulative average concentration of NH4-N, COD, and Ntot [mg/L] shows a strong correlation (r > 0.8). There was no correlation between the cumulative average concentration of PMMoV RNA- and NH4-N-, COD- or Ntot-concentration, respectively (Supplementary Table S1 ).

3.3. Virus Signal in Wastewater and Epidemiological Metrics

3.3.1. Virus Signal in the Pooled Wastewater Data Set and Epidemiological Metrics on the Federal Level

Figure 5 shows the pooled virus signal in the wastewater and different epidemiological metrics on the federal level (7-day incidence, the relative proportion of positive tests, and 7-day hospitalization incidence). Additionally, all epidemiological metrics are illustrated with a time shift of 7 days, respectively.
Until early summer 2022, the three epidemiological metrics show a similar trend. There was an increase in COVID-19 cases in the spring of 2022, which was first reflected in the rising proportion of positive tests in January 2022. From the beginning of June 2022, the hospitalization 7-day incidence and the relative proportion of positive tests showed an increase that was not discernible in the course of the 7-day incidence. The time courses of the flow-normalized pooled average concentrations of SARS-CoV-2 RNA and the normalized values with NH4-N, COD, Ntot, and PMMoV show similar courses until June 2022 (Figure 5, Figures S4 and S5 in Supplementary Materials). The infection wave in spring 2022 could be clearly observed from the beginning of February. From June onwards, the PMMoV-normalized signal increased significantly and deviated from the flow-normalized pooled average concentrations of SARS-CoV-2 RNA, and the pooled data normalized to NH4-N.

3.3.2. Virus Signal Per WWTP and Epidemiological Metrics on the Federal Level

Figure 6 and Figure 7 show the inhabitant-weighted (ammonium-based) 24 h virus load per WWTP and the relative SARS-CoV-2 signal related to PMMoV for each of the 23 investigated WWTPs over the entire sampling period.
From February to April 2022, there was an increase in the virus signal at several WWTPs for all normalization methods. However, the pattern for the ammonia-based inhabitant-weighted virus load appeared more uniform for the different plants than those for the relative SARS-CoV-2 signal related to PMMoV. Furthermore, after normalization with PMMoV, individual WWTPs (ID 9, ID 10, ID 12, ID 13, and ID 16) showed remarkably higher virus signals by the end of January 2022.
From 11 July 2022, an increase in the relative SARS-CoV-2 signal related to PMMoV (relative signal SARS-CoV-2 > 0.30) was observed for seven WWTPs. However, individual WWTPs already showed an increase in June 2022 (e.g., ID 9, ID 10, and ID 12). The increase could not be observed for inhabitant-weighted 24 h virus load using the ammonium-based approach.

3.4. Correlation between Epidemiological Metrics and Pooled Viral Signals in the Wastewater

In general, pooled viral signals in the wastewater correlated strongly with the 7-day-COVID 19 incidence (see Figure 8). However, the correlation is influenced by the time window under investigation. Splitting the data set into a slot before and after the enforcement of the new infection protection law in Thuringia, which went along with a relaxed testing strategy, demonstrates the stronger correlations within the time slot before 3 April 2022. Comparably strong correlations were found for the cumulative average SARS-CoV-2 concentration (flow-normalized; Equation (1)) and for normalized data (Equation (2)) using ammonia, Ntot, or COD, respectively (r-value = 0.96 or 0.96, respectively). The relative SARS-CoV-2 signal related to PMMoV showed a slightly weaker correlation when using the 7-day incidence in the original timeline (r-value = 0.86). Correlating the wastewater data with 7-day-incidence data that were registered earlier (5 or 7-day shift) revealed a slightly better correlation for the PMMoV-normalized virus signal in the wastewater than for the other approaches (r-value = 0.90 and 0.91). The correlation with 7-day-incidence data obtained in the time slot after 3 April 2022, with low test coverage, is much weaker in all cases.
Using the positive test rate (Figure 9), only the PMMoV-normalized SARS-CoV-2 signal consistently showed strong correlations. Choosing the 7-day hospitalization incidence (original timeline) as the epidemiological metric for correlation (Figure 10), the PMMoV-based approach showed lower correlations (r-value = 0.41; moderate correlation) than the other approaches. However, correlations increased for the PMMoV-normalized signal after a time-shift of 7 or 14 days (r-value = 0.59 or 0.68).

4. Discussion

Our study demonstrates that the 4S method is a suitable analytical method that could be successfully applied to implement a wastewater monitoring program in the Free State of Thuringia (Germany). Over eight months, our laboratory processed samples from up to 23 wastewater treatment plants in biological triplicates once a week. To the best of our knowledge, this study is the first in Germany that (1) used epidemiological metrics (positive test rate and 7-day incidence hospitalization) other than 7-day incidence or COVID-19 cases—this is an important contribution in periods with low testing frequency [34]—and (2) investigated a high number of medium and small wastewater treatment plants (<100,000 p.e.) in high spatial density and therefore makes an important contribution to improving the database for rural areas without large wastewater treatment plants.
Using a pooled analysis of our data, we have demonstrated that a monitoring program covering about 50% of the population of the Free State of Thuringia could depict the infection situation in the entire Free State of Thuringia very well, especially in periods with low testing frequency, when incidence numbers based on human testing results are not reliable. Furthermore, our study provides valuable data on variance in biological replicates and other quality aspects.
In our study, there were only marginal differences in the correlations between normalized wastewater data and most of the epidemiological indicators. However, PMMoV-normalized data correlated better with the positive test rate than flow-normalized data or data normalized with a chemical population marker. Test positivity rate data have shown to be a valuable early indicator of evolving trends in COVID-19 activity [34] and have become more important since case or incidence data are less reliable. Thus, our results indicate that in specific settings and for specific analytical methods, the normalization of wastewater-based viral signals with PMMoV might be very valuable. Furthermore, our study stresses the importance of a set of suitable and reliable epidemiological indicators for the evaluation and optimization of methods in wastewater monitoring.

4.1. Performance of the 4S Method for the SARS-CoV-2 Monitoring Program

Applying cost-effective analytical methods is crucial for successfully implementing wastewater monitoring programs. Besides sampling, sample preparation and RNA extraction are critical and cost-intensive steps. Using the 4S method, we calculated costs for sampling preparation and RNA extraction of EUR 14.07 per biological replicate. The costs are comparable to those reported by Kantor et al. (EUR 12.56 per biological replicate) [52] and Whitney et al. (EUR 11.64 per biological) (assumption: exchange rate Euro/US dollar 1.05 (EUR/USD) [13]. The slight cost increase can be explained by fluctuating exchange rates and the fact that discounts were not included. Including personnel costs for two laboratory employees (assuming hourly earnings of EUR 26—average salary level in Germany) processing a minimum of 70 individual preparations in 6–8 h, we calculated a total cost of EUR 18.50 to EUR 20 per biological replicate. A European study [40] reported costs of EUR 50–EUR 550 for the performance of a SARS-CoV-2 measurement in the laboratory (excluding personnel costs). In this study, the costs were not broken down further; however, depending on which costs are used as the basis, 2.5% or 28% are attributable to sample preparation and RNA extraction when using the 4S method. In addition to the general laboratory equipment, a centrifuge, a vacuum pump, and an EZ-Vac Vacuum Manifold are required to apply the 4S method. With the EZ-Vac Vacuum Manifold, parallel extraction of up to 20 preparations is possible. The 4S method proved to be simple and robust in handling. The clogging of individual silica columns is a potential problem that has already been addressed by Whitney et al. [13]. The percentage of clogged columns in our study was 3%.
As wastewater is a very complex matrix, variance is an important aspect to consider in quality assurance. To assess variance in the wastewater data, we investigated biological triplicates. With regard to statistical procedures, as applied in wastewater-based epidemiology, biological replicates are often preferable to technical replicates [59]. The variance in biological replicates was substantially higher than in the technical replicates. Furthermore, the variance for PMMoV was higher than for SARS-CoV-2. In an interlaboratory comparison, Pecson et al. [9] investigated different methods for SARS-CoV-2 quantification in wastewater. The standard deviations of the log-transformed results within each of the different methods were calculated, and a median standard deviation of 0.15 (minimum = 0.04 and maximum = 0.38) was found. The median standard deviation (log-transformed data) in our study is lower in comparison (median for SARS-CoV-2 (0.07) and median for PMMoV (0.11). However, we investigated only three biological replicates, whereas, in Pecson et al., five replicates were analyzed with each method [9]. Still, the data indicate the importance of biological replicates to yield more accurate and reliable data as the base for further modeling in wastewater-based epidemiology. In this context, the process of sample pre-treatment is pivotal. Automated systems may help enable the processing of biological replicates, thus contributing to quality assurance. However, as replicates cause additional costs, the required number of biological replicates is a critical issue, and there is a need to develop intelligent approaches to address the issue of variance in biological replicates of wastewater adequately.
Applying the quality criteria of protocols for evaluations of RT-qPCR performance characteristics for reproducibility [52,60], 90% of the standard deviations of the three technical replicates for the SARS-CoV-2 (N1 assay) and PMMoV assay fulfilled the requirements for high data quality (standard deviations below 0.5; Figure S7 in Supplementary Materials). Generally accepted PCR efficiencies are in the range of 90%–110% (slope ranging from −3.1 to −3.6) and an r2 value of at least 0.98 [60,61,62]. In our study, PCR efficiencies were predominantly within these limits. However, isolated PCR runs showed lower PCR efficiencies: between 86 and 88% (6% SARS-CoV-2 N1 assay) and 82 and 88% (9% PMMoV assay). Kantor et al. [52] used PCR efficiencies in the range of 80–120% as a threshold for acceptable data quality [52]. Our results were within these limits.
Recovery efficiency is a significant quality criterion for assessing the performance of an analytical method. However, up to now, there is no unbiased method to measure recovery efficiency for SARS CoV-2 in wastewater [60,63,64]. SARS-CoV-2 RNA recovery efficiency from wastewater samples has shown to be highly variable and is dependent on the analytical method, the proxy used, and wastewater composition [63]. In most studies, wastewater is spiked with proxy viruses. For SARS-CoV-2, typically used proxies are the bovine coronavirus (BCoV), human coronavirus OC43, bacteriophage Phi6, or inactivated forms of SARS-CoV-2 [9,60]. Using MS2 bacteriophage as a spike, we found recovery rates between 2.4 and 13.9%, with a median value of 6.5% in this study. In the literature, recovery rates between 12 and 89% have been documented determined with MS2 bacteriophage for different sample preparation and extraction methods [36,51,65,66]. However, these studies did not use the 4S method for RNA extraction. Furthermore, MS2 bacteriophages are non-enveloped virus surrogates, which are very robust in the environment [67] and might be more difficult to rupture than the enveloped SARS-CoV-2 viruses. The direct extraction method used in our study might have had a lower extraction efficiency than other methods using additional proteases and shear forces generated with, e.g., magnetic beads. Kantor et al. [52] used BCoV to determine recovery efficiency for the 4S method and found mainly percentages between 1 and 25%. The authors identified a threshold of 1% or 5% acceptable or good data quality. For wastewater monitoring of SARS-CoV-2, a correction of results based on recovery is not recommended [52]. In order to check the consistency of the extraction step, the use of process controls is recommended [15,52,63,64]. We used PMMoV as a qualitative internal process control to monitor the success of RNA extraction. According to a quality assurance plan proposed by Kantor et al. [52], only 1% of our results showed poor data quality. For sensitive analysis, we removed the data with poor quality before analysis; there was no significant change in the relative virus signal.
A total of 10% of the biological replicates in our study could not be quantified as the results were below the LoQ (10 copies per reaction). Other studies show partially lower LoQs between 5 and 10 copies per reaction [13,15,51]. As the 4S method has no explicit concentration step, a subsequent enrichment of RNA extracts might be an option for optimizing our workflow in low-incidence settings. However, direct capture-based methods, such as the 4S method, have shown to be more appropriate for SARS-CoV-2 detection in terms of recovery efficiency, expenditure of time, and costs [9,13,68,69]. Other methods with concentration steps, such as polyethylene glycol (PEG) precipitation or electronegative membrane filtration, do not always have to be more suitable [70]. There is indicative evidence that part of the SARS-CoV-2 RNA is not protected within virus particles but is present in a ribonucleoprotein complex and as free/unprotected viral RNA in the wastewater [13,71]. It has been shown that after centrifugation (12,000× g for 1,5 h without brake), SARS-CoV-2 exists almost equally between the supernatant and pellet fractions [72]. However, in the 4S method, a direct capture method, there is no centrifugation step before extraction, and thus, most of the SARS-CoV-2 RNA might be in the liquid phase. The appropriate workflow might depend on local conditions and the physicochemical properties of wastewater.
Another limitation of the 4S method is the fact that it is an extraction method developed and optimized for RNA extraction. However, as future applications of wastewater monitoring will probably not be limited to RNA viruses, pre-treatment and extraction methods for total nucleic acid extraction will be advantageous when implementing monitoring programs. However, in the setting of our study, the 4S method showed good performance.

4.2. Normalization Parameters

Normalization parameters in wastewater monitoring can help to provide a more accurate picture of the viral load and reduce the impact of influent variations on the measurements. In our study, we used established chemical population markers for normalization, which have already been used in wastewater monitoring. NH4-N is often recommended [7,54,55,73] and prioritized over COD and Ntot [55,74]. One of the advantages of NH4-N is the widespread on-site recording of this parameter in wastewater treatment plants and the low-cost detection method. Furthermore, this is a well-known, easy-available surrogate parameter for the complex pollution in wastewater. Most WWTPs in Germany have a good and reliable database. The mean concentrations of chemical parameters in our study correspond to the typical values in raw municipal wastewater in Germany [53]. Compared to concentrations of PMMoV, chemical normalization parameters in the pooled data set showed almost no fluctuations between the winter months (December 2021 to March 2022), the spring months (March 2022 to June 2022), and the summer month (July 2022).
Several studies support using PMMoV as an indicator of fecal contamination in river water, coastal water, and wastewater [75,76]. According to these studies, the following criteria speak in favor of an indicator function of PMMoV: high prevalence in human sewage, low seasonal variation, and stability in wastewater [75,76]. However, in wastewater monitoring, PMMoV is controversially discussed as a population marker [7,26,31]. PMMoV concentrations in raw sewage samples are usually higher than 104 GC/L, with fluctuations over time [77]. Average PMMoV concentrations found in our studies were in the range of 105 to 106 GC/L (A minimum of 3 × 10⁵ GC/L and a maximum of 6 × 10⁶ GC/L) for the pooled data set. However, several other studies showed, on average, 2–3 log levels higher PMMoV concentrations [29,75,76,78,79] than we found. These studies differ in sample sizes, sampling period and technique, and size of WWTPs as analytical methods, which could lead to higher PMMoV concentrations. We observed high average concentrations of PPMMoV between March and May and low concentrations in the months of June and July 2022 (Figure 4). A comparable pattern has been observed in a Canadian study [78].
The higher fluctuation of PMMoV concentration in the wastewater is considered a limiting factor in using PMMoV for normalization [15,78]. However, even if fluctuation over time of PMMoV might contribute to higher variability in normalized data, we think that PMMoV, as a biological, fecal indicator, might behave in a more similar way as SARS-CoV-2 in the sewer shed than chemical parameters. Currently, no ideal marker is available for normalizing SARS-CoV-2 signals in the wastewater [78]. Therefore, a recent review recommends the simultaneous usage of biological and chemical tracers for normalizing viral load [24]. Recently, it has been shown that different partitioning conditions (centrifugation with varied durations of spin and centrifugal force, (PEG) precipitation followed by centrifugation, and ultrafiltration of wastewater) are relevant for sampling preparation or concentration steps in many analytical procedures [72]. PMMoV showed a different behavior from SARS-CoV-2. These studies did not investigate the effects of partitioning conditions on chemical markers like ammonia or COD. Furthermore, PMMoV RNA has been shown to persist longer in wastewater than SARS-CoV-2 RNA at different temperatures [80]. Therefore, the use of PMMoV as a fecal indicator to normalize SARS-CoV-2 signals has been repeatedly questioned [72,80]. This study focuses on partitioning conditions during sample processing. However, the 4S method is a direct-capture method in which the above-mentioned partitioning conditions are less relevant. This might be one reason why normalization with PMMoV in our case and in other studies [1,13,29] that used a direct-capture method brought an added value at least for one epidemiological indicator (test positivity rate).

4.3. Correlation between Virus Signals in the Wastewater and Epidemiological Metrics

We found mostly strong correlations between SARS-CoV-2 wastewater signals in the pooled data set and different epidemiological metrics on the federal level with the Spearman rank correlation coefficient. However, the strength of the correlation was influenced by the normalization method, the epidemiological metric, and the time window under investigation. Before 3 April 2022, when testing efficiency in Thuringia was high, we found strong correlations between the pooled virus signals in the wastewater and the 7-day incidence. With a time shift from 5 to 7 days, we found r-values up to 0.96. This was independent of the normalization approach and could also be observed for flow-normalized data. However, for the whole study period and the period after 3 April 2022, when the testing policy changed we see, as expected, lower correlations between virus signals in the wastewater and the 7-day incidence or the positive test rate, respectively.
Several other studies have compared different normalization methods, using correlation coefficients with 7-day-incidence data or COVID-19 cases [15,16,29,32]. Correlation analysis with the 7-day incidence might not always be an appropriate metric to judge the effect of normalization, especially in periods when testing and reporting of results is not reliable. In our study period, a change in testing policy led to less reliable 7-day-incidence data. Thus, we used different epidemiological metrics to evaluate the effect of normalization. Only a few studies so far have used alternative indicators of COVID-19 prevalence [1,73,81,82]. However, due to the declared end of COVID-19 as a global public health emergency affecting testing policy and case reporting, it is mandatory to transfer surveillance systems to alternative indicators for 7-day-incidence data in the general population. In this context, test positivity and hospital admissions have become important indicators in surveillance systems [34]. The results of our study implicate that reliable methods for evaluating wastewater monitoring data have to be developed and used in future studies. In this context, especially sentinel networks will be of interest as they have the potential to supply reliable data that might serve as proxies for the COVID-19 spread in a community [1,34]. Sentinel networks should, therefore, be increasingly linked to wastewater monitoring data. Furthermore, wastewater monitoring programs on the building level could help to evaluate monitoring systems. Monitoring tourist and medical facilities might be an especially promising approach [83,84,85]. Institutions with vulnerable populations, such as hospitals or care homes, could play a key role, as the monitoring of infectious diseases is more closely recorded in these facilities than in the general population [84,85]. Last but not least, the stringent quality assurance of the whole analytical workflow (from sampling to data analysis) is mandatory in order to use wastewater monitoring as a reliable and complementary surveillance tool in the future [52,60]. Using the positive test rate as a COVID-19 epidemiological metric, the correlation was strongest for the PMMoV normalized data. It has been shown that test positivity data can indicate changes in trends approximately 4 days earlier than hospital admissions [34]. As wastewater signals should also act as an early indicator, this high correlation speaks in favor of normalization with PMMoV. Furthermore, our site-specific results of the individual WWTPs indicate that in January and June/July 2022, PMMoV-normalized data from several WWTPs tend to indicate an increase in virus signals earlier than the NH4-N-normalized data (Figure 6 and Figure 7). These WWTPs have large catchment areas (ID 9 and ID 16) or are located in spatial proximity (ID 10, ID 11, ID 12, and ID 13).
Our findings for the correlation with the test positivity rate support results of other studies showing an improvement in the correlation when wastewater data were normalized using PMMoV [1,29,82,86]. In addition to COVID-19 case numbers/COVID-19 incidence, these studies also used other data such as positive rapid tests or sentinel samples [1]. With regard to the 7-day incidence and hospitalization incidence, our data are in line with several studies indicating no or only a sporadically improvement in the correlation between COVID-19 epidemiological metrics and the virus signal in wastewater after normalization with PMMoV [7,15,16,32,33,78]. However, these studies used the COVID-19 case numbers/COVID-19 incidences, which might not be an appropriate prevalence indicator in our case or periods with weak case reporting. Therefore, we recommend using the test positivity rate as an additional epidemiological metric for evaluating methods in wastewater monitoring.
Our study has some limitations: As we had no information to allocate the incidence data to the specific catchment areas of the individual WWTPs, we were limited to performing a pooled analysis. In future studies, an assignment of incident cases to the catchment areas would allow for a more accurate correlation analysis. Data on 7-day hospitalization incidence and the positive test rate are only available at the federal-state level. As the monitoring program covers only about 50% of the population of Thuringia, this leads to additional uncertainties. We conducted a simple correlation analysis. More complex methods for trend analysis and modeling would be more informative. However, as samples analyzed with the 4S method were only taken once a week, a trend analysis was not purposeful in this case. Future studies should address these limitations and should be conducted with a higher sampling frequency (several times a week).

5. Conclusions

In conclusion, our study demonstrates that the 4S method could be successfully applied to implement a state-wide wastewater monitoring program in Thuringia, Germany. Performance requirements were well met overall. Based on our results, we recommend the analysis of biological replicates to yield more accurate and reliable data on viral loads in wastewater. Furthermore, there is a need to address the issue of variance in biological replicates of wastewater adequately. With regard to future applications, it must be considered that the 4S method was developed for RNA extraction. Monitoring of DNA viruses or bacteria requires further development of the method or the implementation of another method.
Furthermore, we evaluated different methods for the normalization of viral loads in wastewater. Unlike many other studies, we used different epidemiological metrics as prevalence indicators. Our pooled data set of 23 wastewater treatment plants demonstrates that, with regard to 7-day incidence and 7-day hospitalization incidence per 100,000 inhabitants, correlations were mostly strong. This was independent of normalizing the virus signals. However, as in times of low testing frequency and insufficient reporting of SARS-CoV-2 cases on community-level incidence data became less reliable, alternative epidemiological metrics like hospital admissions and test positivity data are becoming increasingly important in our surveillance systems. With regard to the test positivity rate, our data indicate that virus signals normalized with PMMoV concentration lead to a better correlation. Thus, there is a need for further studies using different and reliable prevalence indicators to evaluate normalization methods for viral loads in wastewater.

Supplementary Materials

The following supporting information can be downloaded at: https://www.mdpi.com/article/10.3390/w15244290/s1, Figure S1: Temporal variation of Ntot concentration [mg/L] for the 23 different sampling sites with size classes (GK) (violet = GK 5; red = GK 4; yellow = GK 3; green = GK 2). boxplots: median (black line), mean (gray line), 10%, and 90% quantiles as whiskers and all possible outliers. Figure S2: Temporal variation of COD concentration [mg/L] for the 23 different sampling sites with size classes (GK) (violet = GK 5; red = GK 4; yellow = GK 3; green = GK 2). boxplots: median (black line), mean (gray line), 10%, and 90% quantiles as whiskers and all possible outliers. Figure S3: Investigation of seasonal variation. Cumulative mean concentrations for the total pooled data set of average COD and Ntot concentration [mg/L] and PMMoV genome copies [GC/L] in comparison. Figure S4: Timeline of SARS-CoV-2 genome copies per inhabitantCOD/24 h of all sampled WWTPs (see Table 1) and different epidemiological metrics for the Free State of Thuringia—without time shift of epidemiological metrics and a with a time shift. Figure S5: Timeline of SARS-CoV-2 genome copies per inhabitantNtot/24 h of all sampled WWTPs (see Table 1) and different epidemiological metrics for the Free State of Thuringia—without time shift of epidemiological metrics and a with a time shift. Figure S6: Standard deviation of biological replicates for the concentration [GC/L] of SARS-CoV-2 and PMMoV. Boxplots: median (black line), 10%, and 90% quantiles as whiskers and all possible outliers. Figure S7: Standard deviation of CT-values from the technical replicates for the SARS-CoV-2 N1 and PMMoV assay in RT-qPCR. Boxplots: median (black line), 10%, and 90% quantiles as whiskers and all possible outliers. Figure S8: PMMoV as internal extraction control with a threshold of 105 PMMoV GC/L (lower values indicated poor quality; dashed line) and 2 × 10⁵ PMMoV GC/L (higher values indicated acceptable quality; line). Threshold values were used in accordance with Kantor et al. (52). boxplot: median (black line), 10%, and 90% quantiles as whiskers and all possible outliers. Figure S9: RT-qPCR Performance Characteristics SARS-CoV-2. Boxplots: median (black line), 10%, and 90% quantiles as whiskers and all possible outliers. Figure S10: RT-qPCR Performance Characteristics PMMoV. Boxplots: median (black line), 10%, and 90% quantiles as whiskers and all possible outliers. Figure S11: Figure providing an overview of the methods and data analyses performed. Table S1: Spearman Correlation between cumulative average concentration of PMMoV, NH4-N, COD, and Ntot. p-value * < 0.05; ** > 0.05. Table S2: Minimum and maximum coefficients of variation (CVs) of biological and technical replicates for SARS-CoV-2 (N1 assay) and PMMoV. Table S3: Cost per biological sample replicate for RNA extraction (consumables and reagents) within the comparative analyses in the wastewater monitoring laboratory at Hamm Lippstadt University of Applied Sciences.

Author Contributions

Conceptualization, C.K. and S.B.; data curation, S.H.; formal analysis, S.H.; funding acquisition, S.B.; investigation, S.H., R.M., K.S., Y.A.-H., N.K., J.P., M.W.P., C.K. and S.B.; methodology, S.H.; project administration, S.B.; supervision, C.K. and S.B.; visualization, S.H.; writing—original draft, S.H.; writing—review and editing, S.H., R.M., K.S., Y.A.-H., N.K., J.P., M.W.P., C.K. and S.B. All authors have read and agreed to the published version of the manuscript.

Funding

This research is partially funded by Bauhaus University Weimar, Germany, under award number 2360200276-2/21, which is gratefully acknowledged. The authors would also like to thank the Free State of Thuringia, Germany, as this work has partially been conducted within the framework of the CoMoTH project, funded by Thüringer Aufbaubank under grant number 2021 FE 9143/44.

Data Availability Statement

The datasets generated for this study are available upon request from the corresponding author.

Acknowledgments

Finally, the authors would like to record their deep gratitude for the invaluable support and suggestions provided by the research teams at the Robert Koch Institute. And we would like to thank the participating wastewater treatment plants for the opportunity to conduct this study, for their participation in the sampling campaign, and for their continuous support throughout the study period. Special thanks go to the student assistants of Hamm-Lippstadt University of Applied Sciences (Anna Scheuermann, Valentin Kaiser, and Felix Kaller) and Bauhaus-Universität Weimar (Sara Wullenkord, Katharina Reichel-Kühl) for their excellent support.

Conflicts of Interest

Co-Author Robert Möller was employed by the company Analytik Jena GmbH + Co. KG, Jena, Germany. The remaining authors declare that the research was conducted in the absence of any commercial or financial relationships that could be construed as a potential conflict of interest. The funders had no role in the design of the study, in the collection, analyses, or interpretation of data, in the writing of the manuscript, or in the decision to publish the results.

References

  1. Perez-Zabaleta, M.; Archer, A.; Khatami, K.; Jafferali, M.H.; Nandy, P.; Atasoy, M.; Birgersson, M.; Williams, C.; Cetecioglu, Z. Long-term SARS-CoV-2 surveillance in the wastewater of Stockholm: What lessons can be learned from the Swedish perspective? Sci. Total Environ. 2023, 858 Pt 3, 160023. [Google Scholar] [CrossRef]
  2. World Health Organization. Environmental Surveillance for SARS-COV-2 to Complement Public Health Surveillance–Interim Guidance: WHO/HEP/ECH/WSH/2022.1; World Health Organization: Geneva, Switzerland, 2022. [Google Scholar]
  3. Zheng, S.; Fan, J.; Yu, F.; Feng, B.; Lou, B.; Zou, Q.; Xie, G.; Lin, S.; Wang, R.; Yang, X.; et al. Viral load dynamics and disease severity in patients infected with SARS-CoV-2 in Zhejiang province, China, January-March 2020: Retrospective cohort study. BMJ 2020, 369, m1443. [Google Scholar] [CrossRef] [PubMed]
  4. Wang, X.; Zheng, J.; Guo, L.; Yao, H.; Wang, L.; Xia, X.; Zhang, W. Fecal viral shedding in COVID-19 patients: Clinical significance, viral load dynamics and survival analysis. Virus Res. 2020, 289, 198147. [Google Scholar] [CrossRef] [PubMed]
  5. Kumar, M.; Patel, A.K.; Shah, A.V.; Raval, J.; Rajpara, N.; Joshi, M.; Joshi, C.G. First proof of the capability of wastewater surveillance for COVID-19 in India through detection of genetic material of SARS-CoV-2. Sci. Total Environ. 2020, 746, 141326. [Google Scholar] [CrossRef] [PubMed]
  6. D’Aoust, P.M.; Graber, T.E.; Mercier, E.; Montpetit, D.; Alexandrov, I.; Neault, N.; Baig, A.T.; Mayne, J.; Zhang, X.; Alain, T.; et al. Catching a resurgence: Increase in SARS-CoV-2 viral RNA identified in wastewater 48 h before COVID-19 clinical tests and 96 h before hospitalizations. Sci. Total Environ. 2021, 770, 145319. [Google Scholar] [CrossRef] [PubMed]
  7. Maal-Bared, R.; Qiu, Y.; Li, Q.; Gao, T.; Hrudey, S.E.; Bhavanam, S.; Ruecker, N.J.; Ellehoj, E.; Lee, B.E.; Pang, X. Does normalization of SARS-CoV-2 concentrations by Pepper Mild Mottle Virus improve correlations and lead time between wastewater surveillance and clinical data in Alberta (Canada): Comparing twelve SARS-CoV-2 normalization approaches. Sci. Total Environ. 2023, 856 Pt 1, 158964. [Google Scholar] [CrossRef] [PubMed]
  8. Li, X.; Zhang, S.; Sherchan, S.; Orive, G.; Lertxundi, U.; Haramoto, E.; Honda, R.; Kumar, M.; Arora, S.; Kitajima, M.; et al. Correlation between SARS-CoV-2 RNA concentration in wastewater and COVID-19 cases in community: A systematic review and meta-analysis. J. Hazard. Mater. 2022, 441, 129848. [Google Scholar] [CrossRef] [PubMed]
  9. Pecson, B.M.; Darby, E.; Haas, C.N.; Amha, Y.M.; Bartolo, M.; Danielson, R.; Dearborn, Y.; Di Giovanni, G.; Ferguson, C.; Fevig, S.; et al. Reproducibility and sensitivity of 36 methods to quantify the SARS-CoV-2 genetic signal in raw wastewater: Findings from an interlaboratory methods evaluation in the U.S. Environ. Sci. Water Res. Technol. 2021. [Google Scholar] [CrossRef]
  10. Bertels, X.; Demeyer, P.; van den Bogaert, S.; Boogaerts, T.; van Nuijs, A.L.N.; Delputte, P.; Lahousse, L. Factors influencing SARS-CoV-2 RNA concentrations in wastewater up to the sampling stage: A systematic review. Sci. Total Environ. 2022, 820, 153290. [Google Scholar] [CrossRef]
  11. Augusto, M.R.; Claro, I.C.M.; Siqueira, A.K.; Sousa, G.S.; Caldereiro, C.R.; Duran, A.F.A.; de Miranda, T.B.; Bomediano Camillo, L.d.M.; Cabral, A.D.; de Freitas Bueno, R. Sampling strategies for wastewater surveillance: Evaluating the variability of SARS-COV-2 RNA concentration in composite and grab samples. J. Environ. Chem. Eng. 2022, 10, 107478. [Google Scholar] [CrossRef]
  12. Ahmed, W.; Bivins, A.; Bertsch, P.M.; Bibby, K.; Choi, P.M.; Farkas, K.; Gyawali, P.; Hamilton, K.A.; Haramoto, E.; Kitajima, M.; et al. Surveillance of SARS-CoV-2 RNA in wastewater: Methods optimisation and quality control are crucial for generating reliable public health information. Curr. Opin. Environ. Sci. Health 2020, 17, 82–93. [Google Scholar] [CrossRef] [PubMed]
  13. Whitney, O.N.; Kennedy, L.C.; Fan, V.B.; Hinkle, A.; Kantor, R.; Greenwald, H.; Crits-Christoph, A.; Al-Shayeb, B.; Chaplin, M.; Maurer, A.C.; et al. Sewage, Salt, Silica, and SARS-CoV-2 (4S): An Economical Kit-Free Method for Direct Capture of SARS-CoV-2 RNA from Wastewater. Environ. Sci. Technol. 2021, 55, 4880–4888. [Google Scholar] [CrossRef] [PubMed]
  14. Hubert, C.R.J.; Acosta, N.; Waddell, B.J.M.; Hasing, M.E.; Qiu, Y.; Fuzzen, M.; Harper, N.B.J.; Bautista, M.A.; Gao, T.; Papparis, C.; et al. Tracking Emergence and Spread of SARS-CoV-2 Omicron Variant in Large and Small Communities by Wastewater Monitoring in Alberta, Canada. Emerg. Infect. Dis. 2022, 28, 1770–1776. [Google Scholar] [CrossRef]
  15. Greenwald, H.D.; Kennedy, L.C.; Hinkle, A.; Whitney, O.N.; Fan, V.B.; Crits-Christoph, A.; Harris-Lovett, S.; Flamholz, A.I.; Al-Shayeb, B.; Liao, L.D.; et al. Tools for interpretation of wastewater SARS-CoV-2 temporal and spatial trends demonstrated with data collected in the San Francisco Bay Area. Water Res. X 2021, 12, 100111. [Google Scholar] [CrossRef] [PubMed]
  16. Schill, R.; Nelson, K.L.; Harris-Lovett, S.; Kantor, R.S. The dynamic relationship between COVID-19 cases and SARS-CoV-2 wastewater concentrations across time and space: Considerations for model training data sets. Sci. Total Environ. 2023, 162069. [Google Scholar] [CrossRef] [PubMed]
  17. Wilhelm, A.; Schoth, J.; Meinert-Berning, C.; Agrawal, S.; Bastian, D.; Orschler, L.; Ciesek, S.; Teichgräber, B.; Wintgens, T.; Lackner, S.; et al. Wastewater surveillance allows early detection of SARS-CoV-2 omicron in North Rhine-Westphalia, Germany. Sci. Total Environ. 2022, 846, 157375. [Google Scholar] [CrossRef]
  18. Crits-Christoph, A.; Kantor, R.S.; Olm, M.; Whitney, O.N.; Al-Shayeb, B.; Lou, Y.C.; Flamholz, A. Genome Sequencing of Sewage Detects Regionally Prevalent SARS-CoV-2 Variants. mBio 2021, 12, 10–1128. [Google Scholar] [CrossRef] [PubMed]
  19. Rainey, A.L.; Loeb, J.C.; Robinson, S.E.; Lednicky, J.A.; McPherson, J.; Colson, S.; Allen, M.; Coker, E.S.; Sabo-Attwood, T.; Maurelli, A.T.; et al. Wastewater surveillance for SARS-CoV-2 in a small coastal community: Effects of tourism on viral presence and variant identification among low prevalence populations. Environ. Res. 2022, 208, 112496. [Google Scholar] [CrossRef]
  20. Mazumder, P.; Dash, S.; Honda, R.; Sonne, C.; Kumar, M. Sewage surveillance for SARS-CoV-2: Molecular detection, quantification, and normalization factors. Curr. Opin. Environ. Sci. Health 2022, 28, 100363. [Google Scholar] [CrossRef]
  21. Kumar, M.; Jiang, G.; Kumar Thakur, A.; Chatterjee, S.; Bhattacharya, T.; Mohapatra, S.; Chaminda, T.; Kumar Tyagi, V.; Vithanage, M.; Bhattacharya, P.; et al. Lead time of early warning by wastewater surveillance for COVID-19: Geographical variations and impacting factors. Chem. Eng. J. 2022, 441, 135936. [Google Scholar] [CrossRef]
  22. Bayati, M.; Hsieh, H.-Y.; Hsu, S.-Y.; Li, C.; Rogers, E.; Belenchia, A.; Zemmer, S.A.; Blanc, T.; LePage, C.; Klutts, J.; et al. Identification and quantification of bioactive compounds suppressing SARS-CoV-2 signals in wastewater-based epidemiology surveillance. Water Res. 2022, 221, 118824. [Google Scholar] [CrossRef] [PubMed]
  23. Zhang, D.; Duran, S.S.F.; Lim, W.Y.S.; Tan, C.K.I.; Cheong, W.C.D.; Suwardi, A.; Loh, X.J. SARS-CoV-2 in wastewater: From detection to evaluation. Mater. Today Adv. 2022, 13, 100211. [Google Scholar] [CrossRef]
  24. Oloye, F.F.; Xie, Y.; Challis, J.K.; Femi-Oloye, O.P.; Brinkmann, M.; McPhedran, K.N.; Jones, P.D.; Servos, M.R.; Giesy, J.P. Understanding common population markers for SARS-CoV-2 RNA normalization in wastewater—A review. Chemosphere 2023, 333, 138682. [Google Scholar] [CrossRef]
  25. Langeveld, J.; Schilperoort, R.; Heijnen, L.; Elsinga, G.; Schapendonk, C.E.M.; Fanoy, E.; Schepper, E.I.T.; de Koopmans, M.P.G.; de Graaf, M.; Medema, G.; et al. Normalisation of SARS-CoV-2 concentrations in wastewater: The use of flow, electrical conductivity and crAssphage. Sci. Total Environ. 2023, 865, 161196. [Google Scholar] [CrossRef] [PubMed]
  26. Masri, N.Z.; Card, K.G.; Caws, E.A.; Babcock, A.; Powell, R.; Lowe, C.J.; Donovan, S.; Norum, S.; Lyons, S.; de Pol, S.; et al. Testing specificity and sensitivity of wastewater-based epidemiology for detecting SARS-CoV-2 in four communities on Vancouver Island, Canada. Environ. Adv. 2022, 9, 100310. [Google Scholar] [CrossRef] [PubMed]
  27. Fitzgerald, S.F.; Rossi, G.; Low, A.S.; McAteer, S.P.; O’Keefe, B.; Findlay, D.; Cameron, G.J.; Pollard, P.; Singleton, P.T.R.; Ponton, G.; et al. Site Specific Relationships between COVID-19 Cases and SARS-CoV-2 Viral Load in Wastewater Treatment Plant Influent. Environ. Sci. Technol. 2021, 55, 15276–15286. [Google Scholar] [CrossRef]
  28. Alamin, M.; Tsuji, S.; Hata, A.; Hara-Yamamura, H.; Honda, R. Selection of surrogate viruses for process control in detection of SARS-CoV-2 in wastewater. Sci. Total Environ. 2022, 823, 153737. [Google Scholar] [CrossRef]
  29. Mitranescu, A.; Uchaikina, A.; Kau, A.-S.; Stange, C.; Ho, J.; Tiehm, A.; Wurzbacher, C.; EDrewes, J. Wastewater-Based Epidemiology for SARS-CoV-2 Biomarkers: Evaluation of Normalization Methods in Small and Large Communities in Southern Germany. ACS EST Water 2022, 2, 2460–2470. [Google Scholar] [CrossRef]
  30. Markt, R.; Stillebacher, F.; Nägele, F.; Kammerer, A.; Peer, N.; Payr, M.; Scheffknecht, C.; Dria, S.; Draxl-Weiskopf, S.; Mayr, M.; et al. Expanding the Pathogen Panel in Wastewater Epidemiology to Influenza and Norovirus. Viruses 2023, 15, 263. [Google Scholar] [CrossRef]
  31. Graham, K.E.; Loeb, S.K.; Wolfe, M.K.; Catoe, D.; Sinnott-Armstrong, N.; Kim, S.; Yamahara, K.M.; Sassoubre, L.M.; Mendoza Grijalva, L.M.; Roldan-Hernandez, L.; et al. SARS-CoV-2 RNA in Wastewater Settled Solids Is Associated with COVID-19 Cases in a Large Urban Sewershed. Environ. Sci. Technol. 2021, 55, 488–498. [Google Scholar] [CrossRef]
  32. Feng, S.; Roguet, A.; McClary-Gutierrez, J.S.; Newton, R.J.; Kloczko, N.; Meiman, J.G.; McLellan, S.L. Evaluation of Sampling, Analysis, and Normalization Methods for SARS-CoV-2 Concentrations in Wastewater to Assess COVID-19 Burdens in Wisconsin Communities. ACS EST Water 2021, 1, 1955–1965. [Google Scholar] [CrossRef]
  33. Zheng, X.; Li, S.; Deng, Y.; Xu, X.; Ding, J.; Lau, F.T.K.; Yau, C.I.; Poon, L.L.M.; Tun, H.M.; Zhang, T.; et al. Quantification of SARS-CoV-2 RNA in wastewater treatment plants mirrors the pandemic trend in Hong Kong. Sci. Total Environ. 2022, 844, 157121. [Google Scholar] [CrossRef] [PubMed]
  34. Scobie, H.M.; Panaggio, M.; Binder, A.M.; Gallagher, M.E.; Duck, W.M.; Graff, P.; Silk, B.J. Correlations and Timeliness of COVID-19 Surveillance Data Sources and Indicators―United States, October 1, 2020–March 22, 2023. Morb. Mortal. Wkly. Rep. MMWR 2023, 72, 529–535. [Google Scholar] [CrossRef] [PubMed]
  35. Dumke, R.; Geissler, M.; Skupin, A.; Helm, B.; Mayer, R.; Schubert, S.; Oertel, R.; Renner, B.; Dalpke, A.H. Simultaneous Detection of SARS-CoV-2 and Influenza Virus in Wastewater of Two Cities in Southeastern Germany, January to May 2022. Int. J. Environ. Res. Public Health 2022, 19, 3374. [Google Scholar] [CrossRef] [PubMed]
  36. Agrawal, S.; Orschler, L.; Lackner, S. Long-term monitoring of SARS-CoV-2 RNA in wastewater of the Frankfurt metropolitan area in Southern Germany. Sci Rep 2021, 11, 5372. [Google Scholar] [CrossRef] [PubMed]
  37. Westhaus, S.; Weber, F.-A.; Schiwy, S.; Linnemann, V.; Brinkmann, M.; Widera, M.; Greve, C.; Janke, A.; Hollert, H.; Wintgens, T.; et al. Detection of SARS-CoV-2 in raw and treated wastewater in Germany - Suitability for COVID-19 surveillance and potential transmission risks. Sci. Total Environ. 2021, 751, 141750. [Google Scholar] [CrossRef] [PubMed]
  38. Breulmann, M.; Kallies, R.; Bernhard, K.; Gasch, A.; Müller, R.A.; Harms, H.; Chatzinotas, A.; van Afferden, M. A long-term passive sampling approach for wastewater-based monitoring of SARS-CoV-2 in Leipzig, Germany. Sci. Total Environ. 2023, 887, 164143. [Google Scholar] [CrossRef]
  39. Ho, J.; Stange, C.; Suhrborg, R.; Wurzbacher, C.; Drewes, J.E.; Tiehm, A. SARS-CoV-2 wastewater surveillance in Germany: Long-term RT-digital droplet PCR monitoring, suitability of primer/probe combinations and biomarker stability. Water Res. 2022, 210, 117977. [Google Scholar] [CrossRef]
  40. Gawlik, B.; Tavazzi, S.; Mariani, G.; Skejo, H.; Sponar, M.; Higgins, T.; Medema, G.; Wintgens, T. SARS-CoV-2 Surveillance Employing Sewage-Towards a Sentinel System; JRC Technical Report; Publications Office of the European Union: Luxembourg, 2021; ISBN 978-92-76-36888-5. [Google Scholar]
  41. Wilhelm, A.; Agrawal, S.; Schoth, J.; Meinert-Berning, C.; Bastian, D.; Orschler, L.; Ciesek, S.; Teichgräber, B.; Wintgens, T.; Lackner, S.; et al. Early Detection of SARS-CoV-2 Omicron BA.4 and BA.5 in German Wastewater. Viruses 2022, 14, 1876. [Google Scholar] [CrossRef]
  42. DIN 38409-44:1992; German Standardised Method for the Analysis of Water, Waste Water and Sludge; Summarised Effect and Substance Parameters (Group H); Determination of the Chemical Oxygen Demand (COD) in the Range 5 to 50 mg/l (H 44). DIN German Institute for Standardization; Beuth Verlag GmbH: Berlin, Germany, 1992.
  43. DIN ISO 15705:2002; Water Quality-Determination of Chemical Oxygen Demand (ST-COD): Cuvette Test (ISO 15705:2002). DIN German Institute for Standardization; Beuth Verlag GmbH: Berlin, Germany, 2003.
  44. ISO 6060:1989; Water Quality; Determination of Chemical Oxygen Consumption. DIN German Institute for Standardization; Beuth Verlag GmbH: Berlin, Germany, 1989.
  45. DIN 38405-9:2011; German Standardised Methods for the Analysis of Water, Waste Water and Sludge- Anions (Group D)-Part 9: Photometric Determination of Nitrate (D 9). DIN German Institute for Standardization; Beuth Verlag GmbH: Berlin, Germany, 2011.
  46. DIN EN ISO 11905-1:1998; Water Quality-Determination of Nitrogen: Part 1: Determination of Nitrogen by Oxidative Digestion with Peroxodisulfate (ISO 11905-1:1997). DIN German Institute for Standardization; German Version EN ISO 11905-1:1998; Beuth Verlag GmbH: Berlin, Germany, 1998.
  47. DIN 38406-5:1983; German Standardised Method for the Analysis of Water, Waste Water and Sludge; Cations (group E); Determination of Ammonium Nitrogen (E 5). DIN German Institute for Standardization; Beuth Verlag GmbH: Berlin, Germany, 1983.
  48. ISO 7150-1:1984; Water quality; Determination of ammonium; Part 1: Manual spectrometric method. DIN German Institute for Standardization; Beuth Verlag GmbH: Berlin, Germany, 1984.
  49. Bustin, S.A.; Benes, V.; Garson, J.A.; Hellemans, J.; Huggett, J.; Kubista, M.; Mueller, R.; Nolan, T.; Pfaffl, M.W.; Shipley, G.L.; et al. The MIQE guidelines: Minimum information for publication of quantitative real-time PCR experiments. Clin. Chem. 2009, 55, 611–622. [Google Scholar] [CrossRef]
  50. ISO 10705-1:1995; Detection and Enumeration of Bacteriophages: Part 1: Enumeration of F-Specific RNA Bacteriophages. DIN German Institute for Standardization; Beuth Verlag GmbH: Berlin, Germany, 2002.
  51. Mondal, S.; Feirer, N.; Brockman, M.; Preston, M.A.; Teter, S.J.; Ma, D.; Goueli, S.A.; Moorji, S.; Saul, B.; Cali, J.J.; et al. A direct capture method for purification and detection of viral nucleic acid enables epidemiological surveillance of SARS-CoV-2. Sci. Total Environ. 2021, 795, 148834. [Google Scholar] [CrossRef] [PubMed]
  52. Kantor, R.S.; Greenwald, H.D.; Kennedy, L.C.; Hinkle, A.; Harris-Lovett, S.; Metzger, M.; Thornton, M.M.; Paluba, J.M.; Nelson, K.L. Operationalizing a routine wastewater monitoring laboratory for SARS-CoV-2. PLoS Water 2022, 1, e0000007. [Google Scholar] [CrossRef]
  53. ATV-DVWK—Rules, ATV-DVWK-A 198: Vereinheitlichung und Herleitung von Bemessungswerten für Abwasseranlagen; Deutsche Vereinigung für Wasserwirtschaft, Abwasser und Abfall e.V.: Hennef, Germany, 2003; ISBN 3-924063-48-6.
  54. Been, F.; Rossi, L.; Ort, C.; Rudaz, S.; Delémont, O.; Esseiva, P. Population normalization with ammonium in wastewater-based epidemiology: Application to illicit drug monitoring. Environ. Sci. Technol. 2014, 48, 8162–8169. [Google Scholar] [CrossRef] [PubMed]
  55. Arabzadeh, R.; Grünbacher, D.M.; Insam, H.; Kreuzinger, N.; Markt, R.; Rauch, W. Data filtering methods for SARS-CoV-2 wastewater surveillance. Water Sci. Technol. 2021, 84, 1324–1339. [Google Scholar] [CrossRef] [PubMed]
  56. Robert Koch-Institute (RKI). 7-Day Incidences by State and County. Available online: https://www.rki.de/DE/Content/InfAZ/N/Neuartiges_Coronavirus/Daten/Fallzahlen_Inzidenz_aktualisiert.html (accessed on 20 October 2022).
  57. Robert Koch-Institute (RKI). Laboratory-Based SARS-CoV-2 Surveillance Data Sheets: Federal State Thueringen. Available online: https://ars.rki.de/Content/COVID19/Reports.aspx (accessed on 20 October 2022).
  58. von Sperling, M.; Verbyla, M.E.; Oliveira, S.M.A.C. (Eds.) Assessment of Treatment Plant Performance and Water Quality Data: A Guide for Students, Researchers and Practitioners, 1st ed.; IWA Publishing: London, UK, 2020; ISBN 9781780409320. [Google Scholar]
  59. Blainey, P.; Krzywinski, M.; Altman, N. Points of significance: Replication. Nat. Methods 2014, 11, 879–880. [Google Scholar] [CrossRef] [PubMed]
  60. Ontario Clean Water Agency, Ministry of the Environment, Conservation and Parks, MECP Wastewater Surveillance Initiative: Protocol for Evaluations of RT-qPCR Performance Characteristics: Technical Guidance; Ministry of the Environment, Conservation and Parks (MECP): Toronto, ON, Canada, 2022; ISBN 978-1-4868-5481-3.
  61. Svec, D.; Tichopad, A.; Novosadova, V.; Pfaffl, M.W.; Kubista, M. How good is a PCR efficiency estimate: Recommendations for precise and robust qPCR efficiency assessments. Biomol. Detect. Quantif. 2015, 3, 9–16. [Google Scholar] [CrossRef] [PubMed]
  62. Broeders, S.; Huber, I.; Grohmann, L.; Berben, G.; Taverniers, I.; Mazzara, M.; Roosens, N.; Morisset, D. Guidelines for validation of qualitative real-time PCR methods. Trends Food Sci. Technol. 2014, 37, 115–126. [Google Scholar] [CrossRef]
  63. Ahmed, W.; Simpson, S.L.; Bertsch, P.M.; Bibby, K.; Bivins, A.; Blackall, L.L.; Bofill-Mas, S.; Bosch, A.; Brandão, J.; Choi, P.M.; et al. Minimizing errors in RT-PCR detection and quantification of SARS-CoV-2 RNA for wastewater surveillance. Sci. Total Environ. 2022, 805, 149877. [Google Scholar] [CrossRef]
  64. Kantor, R.S.; Nelson, K.L.; Greenwald, H.D.; Kennedy, L.C. Challenges in Measuring the Recovery of SARS-CoV-2 from Wastewater. Environ. Sci. Technol. 2021, 55, 3514–3519. [Google Scholar] [CrossRef]
  65. Balboa, S.; Mauricio-Iglesias, M.; Rodriguez, S.; Martínez-Lamas, L.; Vasallo, F.J.; Regueiro, B.; Lema, J.M. The fate of SARS-COV-2 in WWTPS points out the sludge line as a suitable spot for detection of COVID-19. Sci. Total Environ. 2021, 772, 145268. [Google Scholar] [CrossRef]
  66. Forés, E.; Bofill-Mas, S.; Itarte, M.; Martínez-Puchol, S.; Hundesa, A.; Calvo, M.; Borrego, C.M.; Corominas, L.L.; Girones, R.; Rusiñol, M.; et al. Evaluation of two rapid ultrafiltration-based methods for SARS-CoV-2 concentration from wastewater. Sci. Total Environ. 2021, 768, 144786. [Google Scholar] [CrossRef] [PubMed]
  67. Kitajima, M.; Iker, B.C.; Pepper, I.L.; Gerba, C.P. Relative abundance and treatment reduction of viruses during wastewater treatment processes--identification of potential viral indicators. Sci. Total Environ. 2014, 488, 290–296. [Google Scholar] [CrossRef] [PubMed]
  68. Dimitrakopoulos, L.; Kontou, A.; Strati, A.; Galani, A.; Kostakis, M.; Kapes, V.; Lianidou, E.; Thomaidis, N.; Markou, A. Evaluation of viral concentration and extraction methods for SARS-CoV-2 recovery from wastewater using droplet digital and quantitative RT-PCR. Case Stud. Chem. Environ. Eng. 2022, 6, 100224. [Google Scholar] [CrossRef] [PubMed]
  69. Kim, S.; Kennedy, L.C.; Wolfe, M.K.; Criddle, C.S.; Duong, D.H.; Topol, A.; White, B.J.; Kantor, R.S.; Nelson, K.L.; Steele, J.A.; et al. SARS-CoV-2 RNA is enriched by orders of magnitude in primary settled solids relative to liquid wastewater at publicly owned treatment works. Environ. Sci. Water Res. Technol. 2022, 8, 757–770. [Google Scholar] [CrossRef] [PubMed]
  70. Lucansky, V.; Samec, M.; Burjanivova, T.; Lukacova, E.; Kolkova, Z.; Holubekova, V.; Turyova, E.; Hornakova, A.; Zaborsky, T.; Podlesniy, P.; et al. Comparison of the methods for isolation and detection of SARS-CoV-2 RNA in municipal wastewater. Front. Public Health 2023, 11, 1116636. [Google Scholar] [CrossRef] [PubMed]
  71. Wurtzer, S.; Waldman, P.; Ferrier-Rembert, A.; Frenois-Veyrat, G.; Mouchel, J.M.; Boni, M.; Maday, Y.; Marechal, V.; Moulin, L. Several forms of SARS-CoV-2 RNA can be detected in wastewaters: Implication for wastewater-based epidemiology and risk assessment. Water Res. 2021, 198, 117183. [Google Scholar] [CrossRef] [PubMed]
  72. Breadner, P.R.; Dhiyebi, H.A.; Fattahi, A.; Srikanthan, N.; Hayat, S.; Aucoin, M.G.; Boegel, S.J.; Bragg, L.M.; Craig, P.M.; Xie, Y.; et al. A comparative analysis of the partitioning behaviour of SARS-CoV-2 RNA in liquid and solid fractions of wastewater. Sci. Total Environ. 2023, 895, 165095. [Google Scholar] [CrossRef]
  73. Sweetapple, C.; Wade, M.J.; Melville-Shreeve, P.; Chen, A.S.; Lilley, C.; Irving, J.; Grimsley, J.M.; Bunce, J.T. Dynamic population normalisation in wastewater-based epidemiology for improved understanding of the SARS-CoV-2 prevalence: A multi-site study. J. Water Health 2023, 21, 625–642. [Google Scholar] [CrossRef]
  74. Schenk, H.; Heidinger, P.; Insam, H.; Kreuzinger, N.; Markt, R.; Nägele, F.; Oberacher, H.; Scheffknecht, C.; Steinlechner, M.; Vogl, G.; et al. Prediction of hospitalisations based on wastewater-based SARS-CoV-2 epidemiology. Sci. Total Environ. 2023, 873, 162149. [Google Scholar] [CrossRef]
  75. Rosario, K.; Symonds, E.M.; Sinigalliano, C.; Stewart, J.; Breitbart, M. Pepper mild mottle virus as an indicator of fecal pollution. Appl. Environ. Microbiol. 2009, 75, 7261–7267. [Google Scholar] [CrossRef]
  76. Hamza, I.A.; Jurzik, L.; Uberla, K.; Wilhelm, M. Evaluation of pepper mild mottle virus, human picobirnavirus and Torque teno virus as indicators of fecal contamination in river water. Water Res. 2011, 45, 1358–1368. [Google Scholar] [CrossRef]
  77. Kitajima, M.; Sassi, H.P.; Torrey, J.R. Pepper mild mottle virus as a water quality indicator. NPJ Clean Water 2018, 1, 19. [Google Scholar] [CrossRef]
  78. Dhiyebi, H.A.; Abu Farah, J.; Ikert, H.; Srikanthan, N.; Hayat, S.; Bragg, L.M.; Qasim, A.; Payne, M.; Kaleis, L.; Paget, C.; et al. Assessment of seasonality and normalization techniques for wastewater-based surveillance in Ontario, Canada. Front. Public Health 2023, 11, 1186525. [Google Scholar] [CrossRef] [PubMed]
  79. Ando, H.; Murakami, M.; Ahmed, W.; Iwamoto, R.; Okabe, S.; Kitajima, M. Wastewater-based prediction of COVID-19 cases using a highly sensitive SARS-CoV-2 RNA detection method combined with mathematical modeling. Environ. Int. 2023, 107743. [Google Scholar] [CrossRef] [PubMed]
  80. Burnet, J.-B.; Cauchie, H.-M.; Walczak, C.; Goeders, N.; Ogorzaly, L. Persistence of endogenous RNA biomarkers of SARS-CoV-2 and PMMoV in raw wastewater: Impact of temperature and implications for wastewater-based epidemiology. Sci. Total Environ. 2023, 857, 159401. [Google Scholar] [CrossRef] [PubMed]
  81. Bivins, A.; North, D.; Wu, Z.; Shaffer, M.; Ahmed, W.; Bibby, K. Within- and between-Day Variability of SARS-CoV-2 RNA in Municipal Wastewater during Periods of Varying COVID-19 Prevalence and Positivity. ACS EST Water 2021, 1, 2097–2108. [Google Scholar] [CrossRef]
  82. Baldwin, W.M.; Dayton, R.D.; Bivins, A.W.; Scott, R.S.; Yurochko, A.D.; Vanchiere, J.A.; Davis, T.; Arnold, C.L.; Asuncion, J.E.T.; Bhuiyan, M.A.N.; et al. Highly socially vulnerable communities exhibit disproportionately increased viral loads as measured in community wastewater. Environ. Res. 2023, 222, 115351. [Google Scholar] [CrossRef]
  83. Water Environment Federation. Summary Report: Pilot Program for Onsite Testing of SARS-CoV-2 in Correctional Facility Wastewater; Water Environment Federation: Alexandria, VA, USA, 2022. [Google Scholar]
  84. Gonçalves, J.; Torres-Franco, A.; Rodriguéz, E.; Diaz, I.; Koritnik, T.; Da Silva, P.G.; Mesquita, J.R.; Trkov, M.; Paragi, M.; Muñoz, R.; et al. Centralized and decentralized wastewater-based epidemiology to infer COVID-19 transmission - A brief review. One Health 2022, 15, 100405. [Google Scholar] [CrossRef]
  85. Haeusser, S.; Weber, M.; Mauer, C.; Linnemann, V.; Pfannstiel, A.; Pinnekamp, J.; Wintgens, T.; Klümper, C.; Beier, S. On-site treatment of hospital wastewater in a full-scale treatment plant in Germany: SARS-CoV-2 and treatment performance. Water Sci. Technol. 2023, 87, 1747–1763. [Google Scholar] [CrossRef]
  86. Zhan, Q.; Babler, K.M.; Sharkey, M.E.; Amirali, A.; Beaver, C.C.; Boone, M.M.; Comerford, S.; Cooper, D.; Cortizas, E.M.; Currall, B.B.; et al. Relationships between SARS-CoV-2 in Wastewater and COVID-19 Clinical Cases and Hospitalizations, with and without Normalization against Indicators of Human Waste. ACS EST Water 2022, 2, 1992–2003. [Google Scholar] [CrossRef]
Figure 1. Coefficient of variation (CV) of the biological (a) and technical replicates (b) for the SARS-CoV-2 N1 and PMMoV concentration respective CT values in RT-qPCR. Boxplots: median (black line), 10%, and 90% quantiles as whiskers and possible outliers.
Water 15 04290 g001
Figure 2. Variation of PMMoV concentration [GC/L] for the 23 different sampling sites/WWTPs with size classes (GK) (violet = GK 5; red = GK 4; yellow = GK 3; and green = GK 2); boxplots: median (black line), mean (gray line), 10%, and 90% quantiles as whiskers and possible outliers; coefficient of variation (CV).
Water 15 04290 g002
Figure 3. Temporal variation of ammonium concentration [mg/L] for the 23 different sampling sites/WWTPs with size classes (GK) (violet = GK 5; red = GK 4; yellow = GK 3; and green = GK 2); boxplots: median (black line), mean (gray line), 10%, and 90% quantiles as whiskers and all possible outliers; coefficient of variation (CV).
Water 15 04290 g003
Figure 4. Investigation of temporal variation. Cumulative mean concentrations (flow-normalized) of pooled data set of the Free State of Thuringia of average NH4-N concentration [mg/L] and PMMoV genome copies [GC/L] in comparison.
Water 15 04290 g004
Figure 5. (a) Timeline of pooled average SARS-CoV-2 genome copies/L (N1) concentration, (b) timeline of relatives SARS-CoV-2 signal (SARS-CoV-2 GC/24 h/PMMoV GC/24h) and of SARS-CoV-2 genome copies per inhabitantNH4/24 h of sampled WWTPs and different epidemiological metrics for the Free State of Thuringia—with and without a time shift of 7 days.
Water 15 04290 g005
Figure 6. Heatmap. PMMoV-normalized data from the 23 WWTPs with three epidemiological metrics (7-day incidence, positive test rate, and 7-day hospitalization on the federal-state level). White areas = no sampling; white patterned areas = values removed due to inhibition; black line areas = PMMoV data with poor quality (Figure S8).
Water 15 04290 g006
Figure 7. Heatmap. Ammonia-normalized data from the 23 WWTPs with three epidemiological metrics (7-day incidence, positive test rate, and 7-day hospitalization on the federal-state level). White areas = no sampling or ammonia measured; white patterned areas = values removed due to inhibition.
Water 15 04290 g007
Figure 8. Rank correlation coefficients (Spearman) between the 7-day incidence with the cumulative average concentration and population markers (including chemical parameters and PMMoV)—without time shift of epidemiological metrics and with a time shift of 5 and 7 days. The data set was categorized into three time series. Lines: threshold for evaluating the correlation (r = 0.4; r = 0.7).
Water 15 04290 g008
Figure 9. Rank correlation coefficients (Spearman) between the relative percentage positive test with the cumulative average concentration and population markers (including chemical parameters and PMMoV)—without time shift of epidemiological metrics and with a time shift of 7 days. The data set was categorized into three time series. Lines: threshold for evaluating the correlation (r = 0.4; r = 0.7).
Water 15 04290 g009
Figure 10. Rank correlation coefficients (Spearman) between the 7-day incidence hospitalization with the cumulative average concentration and population markers (including chemical parameters and PMMoV)—without time shift of epidemiological metrics and with a time shift of 7 and 14 days. Lines: threshold for evaluating the correlation (r = 0.4; r = 0.7).
Water 15 04290 g010
Table 1. Sampling sites in the monitoring program.
Site-IDCounty LK/Urban District SKSampling Point Mean Flow Rate [m3 per d] Size Classes (GK)Population Served (without Industry)Type of SamplingSampling Days
1SK WeimarAfter screen 16,747466,50024 h time proportional31
2LK GothaAfter grit chamber 35394890024 h time proportional33
3LK Ilm KreisAfter screen6503428,90024 h time proportional33
4SK GeraAfter grit chamber19,7415100,63824 h volume proportional33
5LK Ilm KreisBefore screen8317572,00024 h time proportional30
6LK Schmalkalden-MeiningenAfter grit chamber9509430,00024 h time proportional32
7LK Saale-Holzland-KreisAfter grit chamber2102413,76824 h time proportional31
8LK Saale-Orla-KreisAfter grit chamber4913414,02024 h volume proportional31
9SK JenaAfter grit chamber20,7085114,02424 h time proportional32
10LK NordhausenAfter grit chamber9551454,00024 h volume proportional30
11LK EichsfeldAfter screen6115414,35824 h time proportional30
12LK EichsfeldAfter grit chamber2585411,10324 h time proportional30
13LK EichsfeldAfter screen4689455,86724 h volume proportional28
14LK Altenburger LandAfter screen1922413,55024 h time proportional30
15LK SoemmerdaAfter screen3941417,00024 h volume proportional26
16SK ErfurtAfter screen45,5225317,27424 h time proportional28
17SK SuhlAfter grit chamber17,872436,00024 h time proportional28
18LK Unstrut-Hainich-KreisBefore screen25953456924 h time proportional21
19LK Saale-Orla-KreisAfter screen23353540024 h time proportional26
20LK Schmalkalden-MeiningenAfter grit chamber8112350024 h time proportional24
21LK Saalfeld-RudolstadtAfter screen5154428,81724 h volume proportional22
22LK Saalfeld-RudolstadtAfter grit chamber7651432,80824 h volume proportional23
23LK KyffhaeuserkreisAfter screen9523700024 h time proportional14
Disclaimer/Publisher’s Note: The statements, opinions and data contained in all publications are solely those of the individual author(s) and contributor(s) and not of MDPI and/or the editor(s). MDPI and/or the editor(s) disclaim responsibility for any injury to people or property resulting from any ideas, methods, instructions or products referred to in the content.

