Article

A Study on the Carrying Capacity of Water Resources Utilizing the Fuzzy Comprehensive Evaluation Model—Illustrated by a Case from Guantao County

1
China Institute of Water Resources and Hydropower Research, Beijing 100048, China
2
Faculty of Architecture Civil and Transportation Engineering, Beijing University of Technology, Beijing 100124, China
3
Hebei Geo-Environment Monitoring, Shijiazhuang 050051, China
4
Hebei Institute of Water Science, Shijiazhuang 050051, China
*
Authors to whom correspondence should be addressed.
Water 2023, 15(24), 4277; https://doi.org/10.3390/w15244277
Submission received: 19 October 2023 / Revised: 22 November 2023 / Accepted: 5 December 2023 / Published: 14 December 2023

Abstract

:
The efficient utilization of water resources is the key to ensuring sustainable development. Due to the complex relationship between resource utilization and economy and the environment, there are positive societal effects from a scientific and precise assessment of the carrying capacity of water supplies. This study aims to investigate the uncertainty associated with the selection of evaluation parameters in assessing the carrying capacity of water resources. To achieve this, the fuzzy comprehensive evaluation model is adopted, and two distinct weighting methods, namely hierarchical analysis and entropy weighting, are applied to analyze the sources of uncertainty in the evaluation results under the framework of the established evaluation indicators. Aiming at the traditional water resources carrying capacity, evaluation indexes are redundant and the correlation is not very close. Thus, the sensitivity analysis method based on the weights of the indexes is proposed to eliminate the indexes that have the greatest impact in order to decrease the uncertainty of the evaluation results. The results indicate that the correlationship coefficient of the comprehensive evaluation results obtained through the two weighting ways is 0.4542, which is not a large correlation, so the uncertainty of the assignment of indicator weights exists. The calculation of the sensitivity index shows that the weights of the three indicators of the utilization ratio of water resources development, water consumption per unit of GDP and per capita water resources are the most sensitive, which are 40.62%, 27.58%, and 23.61%, respectively, and these are the key influencing factors. This demonstrates that improving the accuracy of the primary control indices and the quality control of weight assignment can assist with lowering the error of the carrying capacity assessment of water resources and also point the fuzzy evaluation model in the right direction.

1. Introduction

Water resources are an irreplaceable natural resource that plays a crucial role in supporting the sustainable development of society. It is not only a constraining factor but also a vital carrier for social, economic, and ecological development [1]. Currently, figuring out the significant connections between a region’s water supplies, population, ecology, and social economy requires researching the water resources carrying capacity [2]. It is a hot topic in water resources science and is essential for managing sustainable water utilization and related water issues [3]. Research on water resource carrying capacity forms the foundation for sustainable development and water security strategies, harmonizing the water environment with economic sustainability. It is of great significance in promoting the coordinated development of regional resources, population, economy, and the eco-environment [4].
The evaluation of water resources carrying capacity is a specific application [5] of the concept of carrying capacity in the field of water resources, which can provide practical and effective suggestions [6,7,8] for regional water resources planning and management. Lv et al. studied the water resources carrying capacity of Heilongjiang Province, China, based on the TOPSIS model, and they found that water resources and social factors have a significant impact [9] on the water resources carrying capacity of the eastern part of Heilongjiang Province. Wang et al. studied the development trend of water resources carrying capacity in Changchun City, China, using a fuzzy comprehensive evaluation method, and they proposed six different development modes to improve the current problem [10] of decreasing the water resources carrying capacity faced by Changchun City. He et al. judged China’s water resources carrying capacity by the entropy method and concluded that Fujian Province, Liaoning Province, and the Beijing Municipality have a large potential problem of Insufficient water resources carrying capacity, which could be alleviated by implementing pertinent laws and promoting waste classification policies [11].
At present, the foreign water resources carrying capacity [12,13] for sustainable development issues [14] is being increasingly discussed. Some scholars analyzed the sustainable use of water resources, the ecological limits of the water environment or natural system limits [15], and other indicators, and most of the research focused on the limits of the water resources carrying capacity. The domestic water resources carrying capacity [16] has been a significant topic of discussion since the beginning of the 21st century. The current understanding, representing the academic forefront, is to balance the rational scale [10] of ecological health and sustainable development of resources within specific social contexts of economic, environmental, and technological progress. As water resources carrying capacity encompasses various systems such as water resources, ecological, and socio-economic systems under varying regional and natural conditions, the interactions between these multiple systems further complicate and intensify this complexity and uncertainty. Strengthening the research on water resources carrying capacity uncertainty can enhance the reliability [17] of evaluation outcomes. In this analysis, mathematical models are often used, and the parameters in the models usually exhibit uncertainties. The study of model input parameter changes on the deviation of the calculation results—that is, sensitivity analysis research—can effectively determine the variables themselves and their error range, thus increasing the reliability of the model calculation results [10,16,17]. Since the end of the 20th century, the calculation method of carrying capacity has been continuously improved from the ecological footprint model, which was quite representative in the field of sustainable evaluation in the early days, to the recent application of the artificial neural network model, multi-objective analysis model, object-element model, system dynamics model, and many other evaluation models [18]. The widely used evaluation model on comprehensive dynamics is mainly the fuzzy comprehensive evaluation model [18,19]. Zadeh [20] proposed fuzzy logic, which defines uncertainty and ambiguity. Through the use of exact numerical approaches, fuzzy comprehensive evaluation manages fuzzy evaluation variables, enabling more practical and scientific quantitative evaluations of obscure and confusing notions [21]. This approach can also be used to ascertain whether evaluation findings are considerably impacted by evaluation index weights and other associated uncertainties. The fuzzy evaluation model is chosen for a means to carry out the study on the uncertainty of the evaluation results of water resources carrying capacity because the boundaries of the water resources carrying capacity evaluation index standard and evaluation system are typically ambiguous as well as uncertain. Additionally, the fuzzy comprehensive evaluation method can improve the objectivity and accuracy of the evaluation results [5].
The highlights of this study are as follows:
(1)
Taking Guantao County in Hebei Province as an example; “the resources–environment–ecology–socio-economy” [22] water resources carrying capacity evaluation index system was constructed by applying the fuzzy comprehensive evaluation model under the uncertainty of the weight of the index system;
(2)
A comprehensive evaluation of the water resources carrying capacity in Guantao County, exploring the weights of indicators with higher sensitivity coefficients that have a more significant effect on the assessment outcomes;
(3)
The application of fuzzy comprehensive assessment reduces the degree of uncertainty in the model’s outcome, and the more accurate evaluation results can offer sensible recommendations for Guantao County’s future use and management of its water resources.

2. Materials and Methods

2.1. Overview of the Study Area

Gantao County, located in the southeastern part of Handan City, Hebei Province, China, is bordered by Shandong Province to the east, separated by the Wei River and the Grand Canal, and by Handan County and Linxi County in Xingtai City. The county is located between latitudes 36°27′ and 36°47′ north and longitudes 115°06′ and 115°40′ east with a total area of about 456 km2. The climate is a typical warm temperate semi-humid continental monsoon climate. The average temperature is 14.0 °C, the average annual precipitation is about 532.73 mm, mainly in summer, and the average annual evaporation is about 1104.9 mm.
The average multi-year total water resources of Guantao County is 45.92 million cubic meters, of which the average multi-year surface water resources is 1.506 million cubic meters and the average multi-year underground water resources is 43.199 million cubic meters. The county mainly consists of the Heilonggang River system and the Zhangwei River system, of which the Heilonggang River system accounts for about 87.9% of the total area. The main river in this system is the Wei River, which flows intermittently for an average of 45 days per year, mainly during the rainy season.
There are 8 townships under the jurisdiction of Guantao County (Figure 1), and in 2019, Guantao County realized a gross regional product of 9150.4 million yuan. By the end of 2020, the total population of the county had reached 360,246,000 with an urbanization rate of 43.76%. However, water resources in Guantao County are relatively scarce, and agricultural production mainly relies on the exploitation of groundwater, which has resulted in issues like ground subsidence, lower levels of groundwater, and in certain places, machine well failure, thus restricting the socio-economic development of the region and the improvement of the living standards of the people.

2.2. Method of Calculation

2.2.1. Fuzzy Comprehensive Evaluation Model

A more thorough representation of the status of the regional water resources can be obtained by using the fuzzy comprehensive evaluation model, which can increase the objectivity and accuracy of the evaluation results due to the fuzziness and uncertainty in the standards and boundaries of the water resources carrying capacity evaluation indicators [10]. The basic principles of the model used in the paper [23,24] can be described as follows: Let U = (u1, u2, …, um) represent the set of evaluation indicators and V = (v1, v2, …, vn) represent the set of linguistic terms. The result of a fuzzy comprehensive evaluation is determined by the following formula:
C = (c1, c2, …, cm) = W · R
The fuzzy subset of U, denoted as W, is defined as W = {w1, w2, …, wn}, with wi ranging from 0 to 1. The weight of element U in the evaluation is indicated by the membership degree of each wi. The ordinary matrix algorithm utilizes the fuzzy operator. C is the fuzzy subset of V, represented as C = (c1, c2, …, cm), where 0 ≤ cj ≤ 1. Each cj represents the membership degree of the linguistic term Vj in C, which represents the comprehensive evaluation result.
The membership (evaluation) matrix is given by the following:
R = r 11 r 1 n r m 1 r m n
where rij represents the membership degree of ui’s evaluation to the grade vj, and Ri = (ri1, ri2, …, rim) represents the single-factor evaluation results for the i-th factor ui.
By comparing the actual values with the grading intervals, the corresponding membership degree values are obtained. To ensure a smooth transition between different grades, a fuzzification process is applied. In the calculation of the membership degree matrix R, let r i t ( t = 1 ,   2 ,   3 ,   4 ,   5 ) be the membership degree for the t-th grade, x m a x t be the upper limit of the t-th evaluation grade, x m i n t be the lower limit of the t-th evaluation grade, r i x ¯ ( t ) be the actual value of the indicator, and x ( t ) = x m a x ( t ) + x m i n ( t ) 2 be the mean of the t-th evaluation grade.

2.2.2. Indicator Weight Calculation Methods

There are two main types of methods for calculating weights: subjective methods and objective methods. Subjective methods, such as the coefficient method and the Analytic Hierarchy Process (AHP) [25], have been well established and involve a high level of subjectivity, relying heavily on the decision-maker’s thoughts. On the other hand, objective approaches like Principal Component Analysis (PCA) and the Entropy Weight Method (EWM) [26] employ decision matrices and are grounded in solid mathematical principles, calculating weights according to the connections within the original data. Since water resource carrying capacity involves many factors, and different factors have varying degrees of impact, weights should be assigned based on the specific conditions of the study area. The primary sources of data for this study are primarily derived from the Guantao County Water Resources Bulletin (2019) and the 2019 Statistical Yearbook of Guantao County. In this study, we discuss and explore two weight methods, AHP and EWM, to find a suitable approach.
Analytic Hierarchy Process (AHP) uses fuzzy quantitative analysis based on qualitative indicators to make decisions [27]. It reduces the problem to determining the relative importance weights of the indicators at the standard level (minimum level) of the target level (maximum level) [28]. The principal stages of the AHP technique are outlined below [29]:
(1)
Establish the hierarchical structure model;
(2)
Create pairwise comparison judgment matrices for indicators;
(3)
Calculate the maximum eigenvalue and eigenvector of the judgment matrix and perform consistency testing.
(4)
Calculate the weights of each evaluation indicator.
The Entropy Weight Method (EWM) is an objective approach to determine weights based on the original data of the indicators. Generally, the smaller the information entropy of an indicator, the greater the amount of information it provides, and thus, the higher its corresponding weight; conversely, a larger information entropy corresponds to a smaller weight. The primary computation steps are outlined below:
Obtain the initial evaluation indicator matrix B based on the membership relationships.
B = b 11 b 1 n b m 1 b m n
The above, b i j represents the raw value of the i-th indicator in the j-th year. Standardization is performed to eliminate the influence of dimensions and obtain the standardized matrix A. The treatment for favorable and reverse indicators is outlined below:
Favorable indicators:
a i j = b i j m i n ( b i j ) m a x ( b i j ) m i n ( b i j )
Reverse indicators:
a i j = m a x ( b i j ) b i j m a x ( b i j ) m i n ( b i j )
Normalization matrix:
A = a 11 a 1 n a m 1 a m n
Calculation of objective weight through entropy weight method:
w i = 1 e i m i = 1 m e i
Information entropy:
e i = 1 ln n j = 1 n p i j ln p i j , p i j = a i j i = 1 n a i j

2.2.3. Sensitivity Calculation Method

The sensitivity analysis [30] allows us to identify which indicator’s weight significantly influences the evaluation. By changing the values of the corresponding indicator variables, we can reflect the impact of indicator weights on the evaluation results.
In this study, we utilize One Variable At A Time (OVAAT) [31] to evaluate the impact of indicator weights. This involves removing the weight of a specific indicator variable while keeping the weights of other variables equally distributed, maintaining a total weight of 1. This process demonstrates how the alteration of a single factor can affect the alteration in the carrying capacity of water resources and the subsequent effects. Subsequently, each indicator’s weight is individually removed, and its sensitivity is calculated, evaluating the uncertainty of each indicator’s weight and its influence on the research results. If the removal of an indicator’s weight does not significantly affect the scoring results, it implies that the overall assessment of water resource carrying capacity is unresponsive to the assigned weight of this particular indicator. Conversely, if removing an indicator’s weight significantly affects the scoring results, it indicates a high sensitivity of this indicator’s weight in the comprehensive evaluation. The computation of this approach is provided by Formulas (9) and (10).
R M S E C = i = 1 n ( Y Y i Y ) 2 n
T F = i = 1 k F R M S E C
The formula demonstrates the sensitivity analysis of the comprehensive evaluation of carrying capacity for water resources. RMSEC represents the speed of modification in the root mean square error, serving as a measure of sensitivity. “n” refers to the quantity of indicator weight variables. “Y” represents the initial fuzzy comprehensive evaluation result incorporating the overall evaluation value. “Yi” represents the comprehensive evaluation score following the modification of indicator weight variables. “TF” denotes the total sensitivity index. “k” indicates the number of comprehensive evaluation outcomes. Lastly, “FRMSEC” symbolizes the rate of change in the root mean square error of the comprehensive evaluation results after altering each indicator weight variable, reflecting the sensitivity of the comprehensive evaluation.

3. Results and Discussion

3.1. Construction and Classification Standard of Evaluation Indicator System of Water Resources Carrying Capacity

The factors influencing water resource carrying capacity mainly include aspects related to water resources, social economy, environment, and ecology [32,33,34,35]. In this research, a comprehensive evaluation indicator system for water resource carrying capacity is proposed, focusing on four dimensions: water resources, water environment, water ecology, and social economy. This is completed based on the strict constraints of water resource carrying capacity in Hebei Province and considering the actual situation of water resources. Representative evaluation indicators from each dimension were selected (Table 1).
In the process of indicators selection, we primarily relied on existing data (The Guantao County Water Resources Bulletin, The Guantao County Statistical Yearbook) [36,37] for evaluation and referred to indicators from other relevant literature [3,38,39]. Furthermore, we meticulously took into account the distinctive aspects and properties of water resources in Hebei Province and incorporated expert advice to ultimately synthesize and select the indicators for the study area [40].
After constructing the evaluation indicator system for water resource carrying capacity, the evaluation indicators are categorized into five levels, forming the evaluation language set V = (v1, v2, …, vn). Among them, the v1 level represents an ideal state of water resource carrying capacity, where water resources are in harmony with society and ecology, meeting sustainable utilization conditions. The v2 level indicates a relatively good state of water resource carrying capacity, with water resources adequately supporting local socio-economic development. The v3 level signifies a normal state of water resource carrying capacity, without water shortages. The v4 level reflects a relatively poor state of water resource carrying capacity, but it still meets the water demand of various industries to a certain extent. The V5 level indicates a very poor state of water resource carrying capacity, signifying a severe water resource conflict. If the value of the index escalates indefinitely and approaches the V1 criterion, representing a superior carrying capacity, it is classified as a positive index. In contrast, when the value of the index escalates indefinitely and approaches the V5 criterion, indicating a weaker carrying capacity, it is considered a negative index. The definitions and guidelines for the indicators in the indicator layer are shown in Appendix A.
Based on the weight matrix W and the membership matrix R, the fuzzy comprehensive evaluation matrix C for each township is obtained using the formula C = W · R [33]. The evaluation grades of the indicators are quantified with values ranging from 0 to 1, where smaller values indicate weaker water resource carrying capacity. For the grades v1, v2, v3, v4, and v5, the quantification values are set as follows: α1 = 0.1, α2 = 0.3, α3 = 0.5, α4 = 0.7, and α5 = 0.9. Based on Formula (11), the five-level scores for water resource carrying capacity and the final comprehensive evaluation value θ are calculated, and a comparative study is conducted on the comprehensive evaluation values of the two calculations (Table 2 and Table 3).
θ = t = 1 5 b t k α t t = 1 5 b t k
In the formula, θ represents the comprehensive evaluation score for the water resources carrying capacity of the matrix “C”. b t k denotes the values of the association degrees for every level in the indicator layer, where “k” is usually equal to 1.

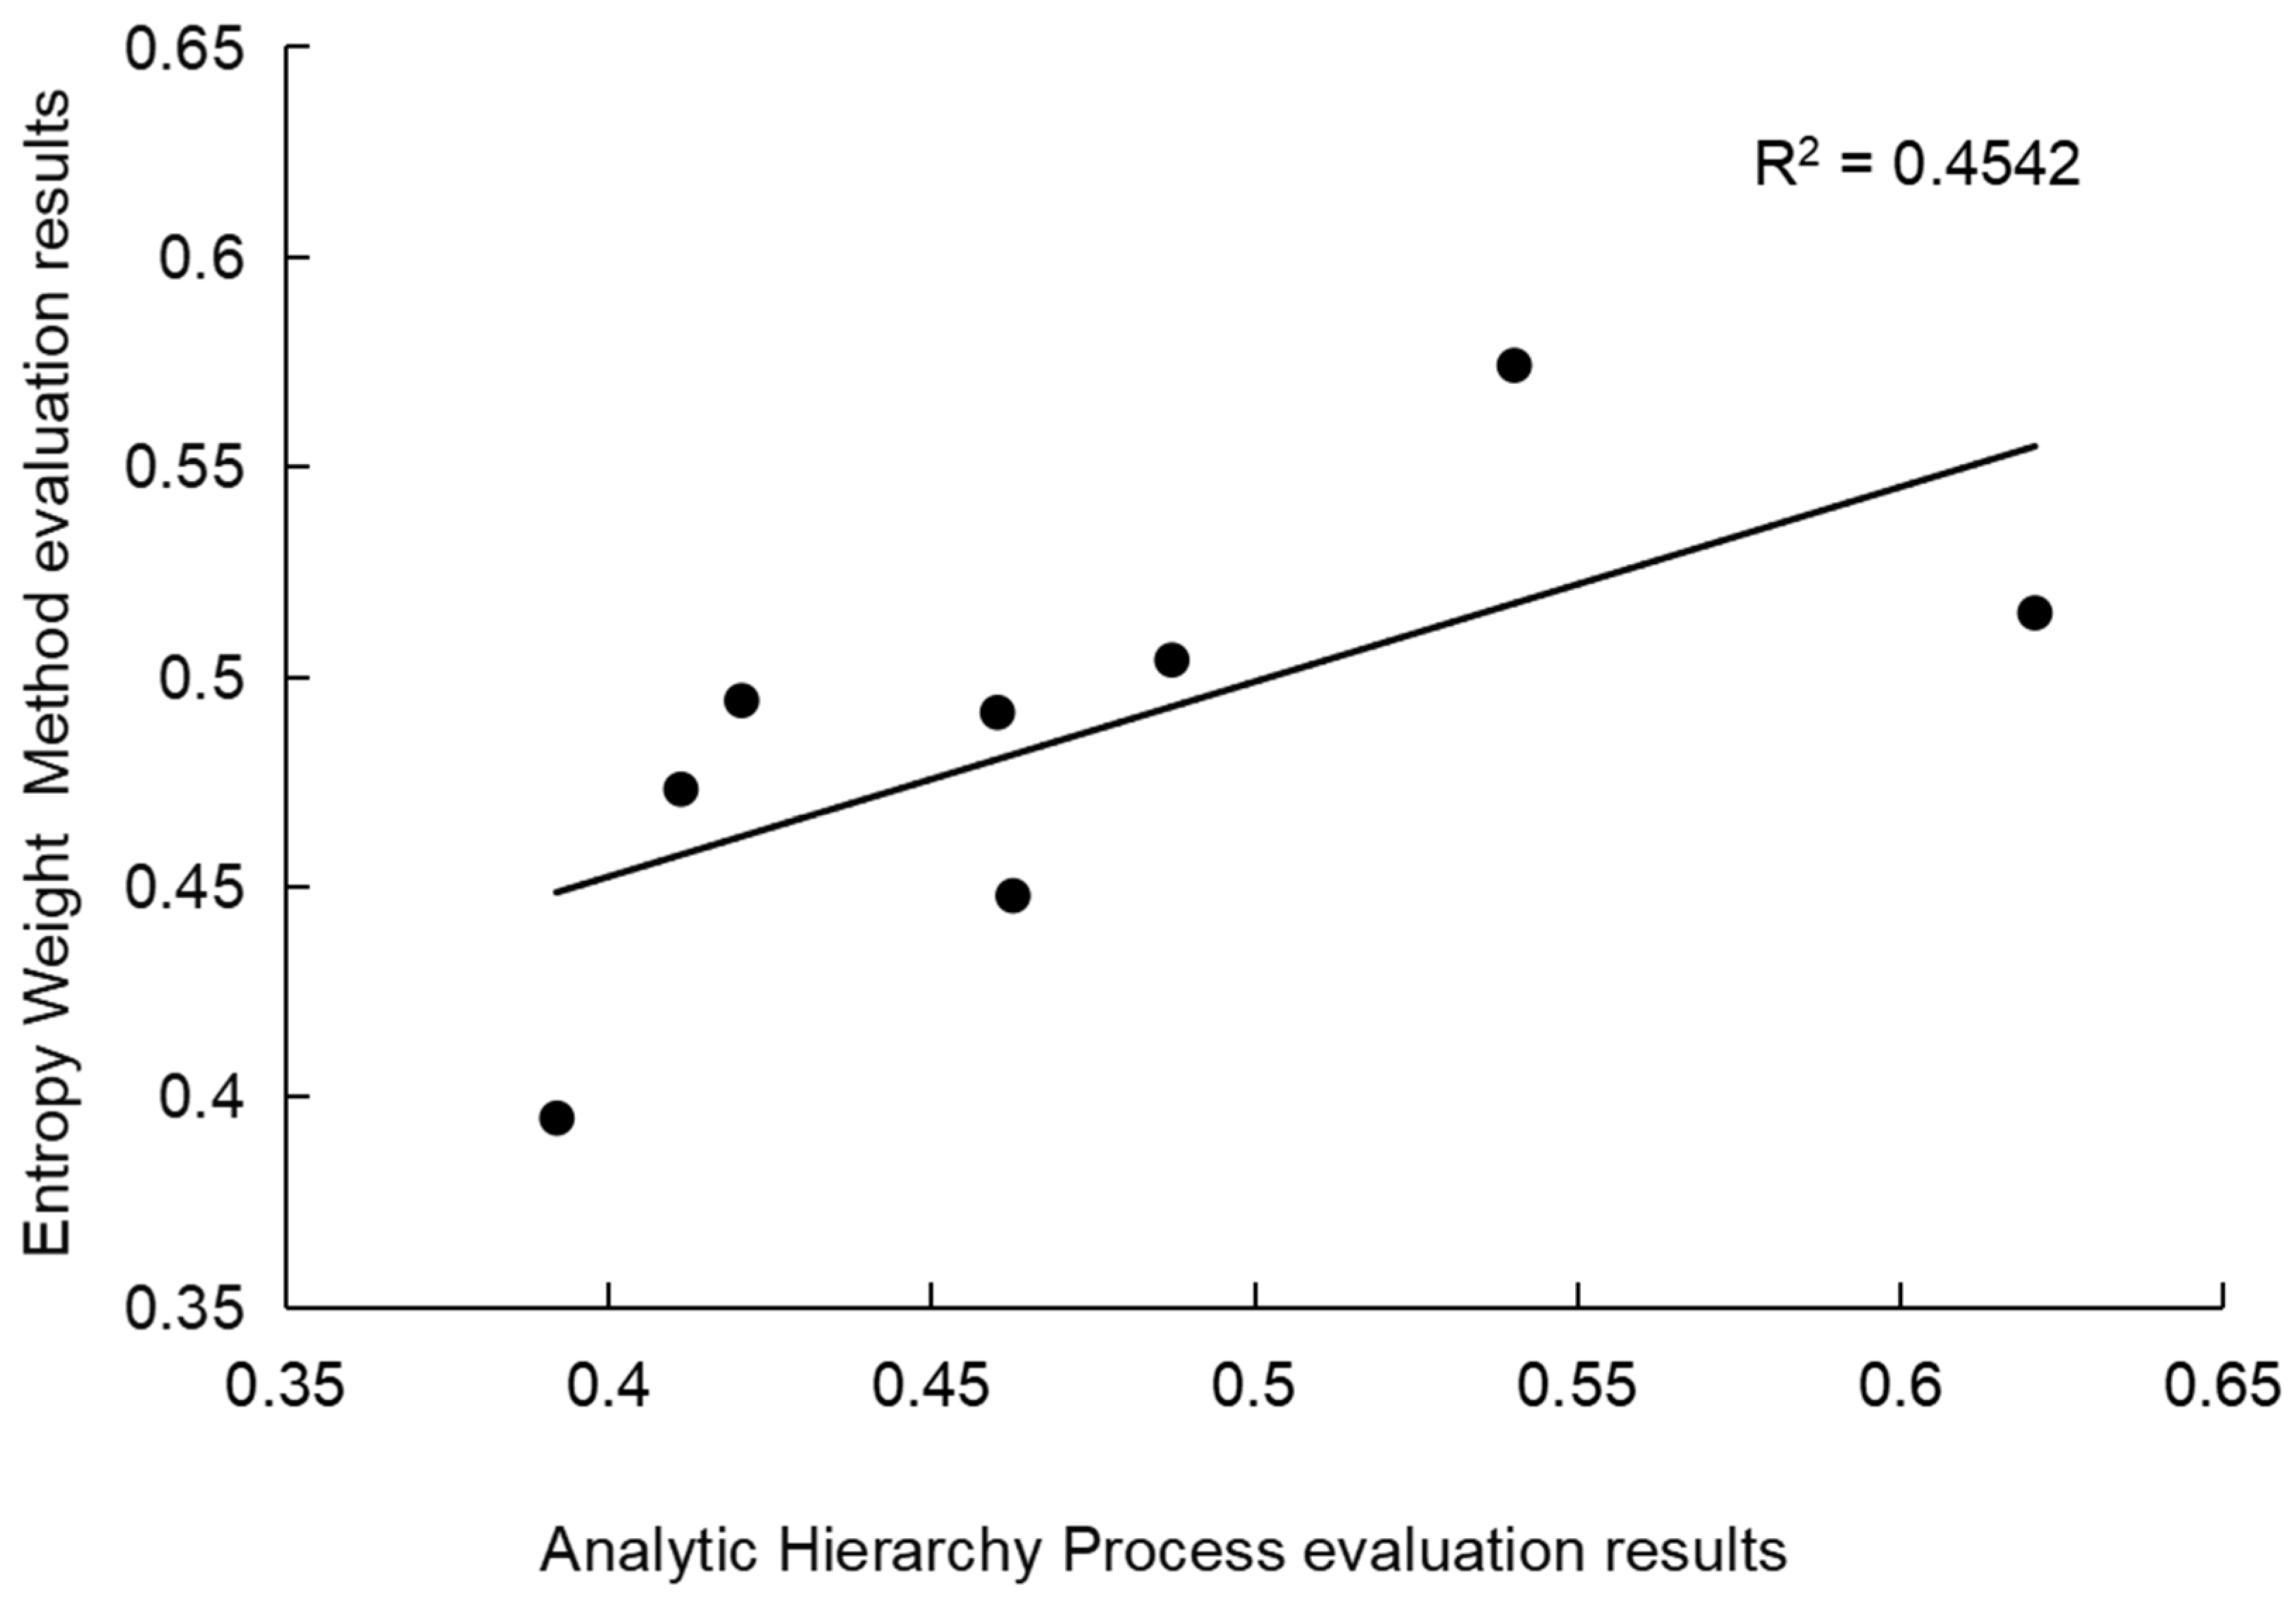
3.2. Examining the Difference of Analytic Hierarchy Process and Entropy Weight Method on Weight Results

Based on the data from Guantao County in 2019, applying the two calculation methods, the weights of the four subsystems calculated by using two calculation methods, using hierarchical analysis, are as follows: WA is 0.45, WB is 0.15, WC is 0.12, and WD is 0.28. The weights of the four subsystems calculated by using entropy weighting are as follows: WA is 0.22, WB is 0.25, WC is 0.19, and WD is 0.34. The ultimate weights derived for every indicator layer are illustrated in Figure 2.
According to Figure 2, the most significant indicators identified through the Analytic Hierarchy Process (AHP) are as follows: water resource utilization ratio, water consumption per unit of Gross Regional Product, per capita GDP, and domestic water quota. These indicators have weights of 0.18, 0.15, 0.13, 0.10, and 0.09, respectively. These indicators constitute 65% of the overall weight and encompass the water resources subsystem as well as the social economy subsystem. They ought to be ranked as vital sectors for improvement to boost Guantao County’s water resources carrying capacity. This result validates that the AHP method takes into account the coupling effects among multiple criteria and indicators, emphasizing the identification of essential indicators.
For the Entropy Weight Method, the calculated weights are mostly distributed around 0.06, except for the population density indicator, which weighs 0.22. This method’s results encompass most of the criteria layer, including water resources, water environment, water ecology, and social economy subsystems. It confirms that the Entropy Weight Method, according to decentralized data calculation, leans more toward mathematical regularity and objectivity. However, it tends to overlook the interconnectedness and coupling effects of significant indicators, which are essential factors that cannot be disregarded for accurate assessment.

3.3. A Comparative Analysis of Fuzzy Comprehensive Assessment for Two Weighting Methods

From Figure 2, it can be observed that the weight results of B1, B2, B3, C1, C2, C3, and D3 calculated by AHP and EWM are relatively close. Table 3 and Table 4 present the comprehensive evaluation results computed using AHP and EWM, respectively. Figure 3 illustrates the correlation between the evaluation results obtained from AHP and EWM. In Figure 3, the correlation coefficient between AHP and EWM evaluation results is 0.4542 with a slope of 0.4641 and an intercept of 0.2668. These findings indicate that the evaluation results obtained by both methods are somewhat correlated but still exhibit some differences.
Based on the evaluation results in Figure 3, it is evident that the correlation coefficient between AHP and EWM is relatively low with a slope close to 0.5 and a small intercept. The reasons for this can be attributed to some shortcomings of EWM. Firstly, this evaluation has selected more indicators than the number of objects being evaluated, which may introduce biases in the results based on experience. Secondly, EWM neglects the significance of the indicators themselves and relies too heavily on objective weighting, which can result in the failure to reduce the dimensionality of evaluation indicators and overlook the subjective intentions of decision-makers. Additionally, due to the independence and diversity of each township, the weights of the indicators at each level should differ, but EWM fails to effectively capture this characteristic, resulting in many similar weight results during calculation. On the other hand, AHP takes into account the coupling effects occurring among numerous criteria and indicators, taking into account the decision-makers’ intentions and the local context. It effectively identifies the importance of key influencing indicators. AHP successfully compensates for the limitations of EWM and provides a more rational method for selecting weights in this study’s evaluation of water resource carrying capacity. Considering the water resource situation and ecological environment in Hebei Province, this study has established the grading criteria for the comprehensive evaluation of water resource carrying capacity, as shown in Table 4.

3.4. Assessment Results Analysis
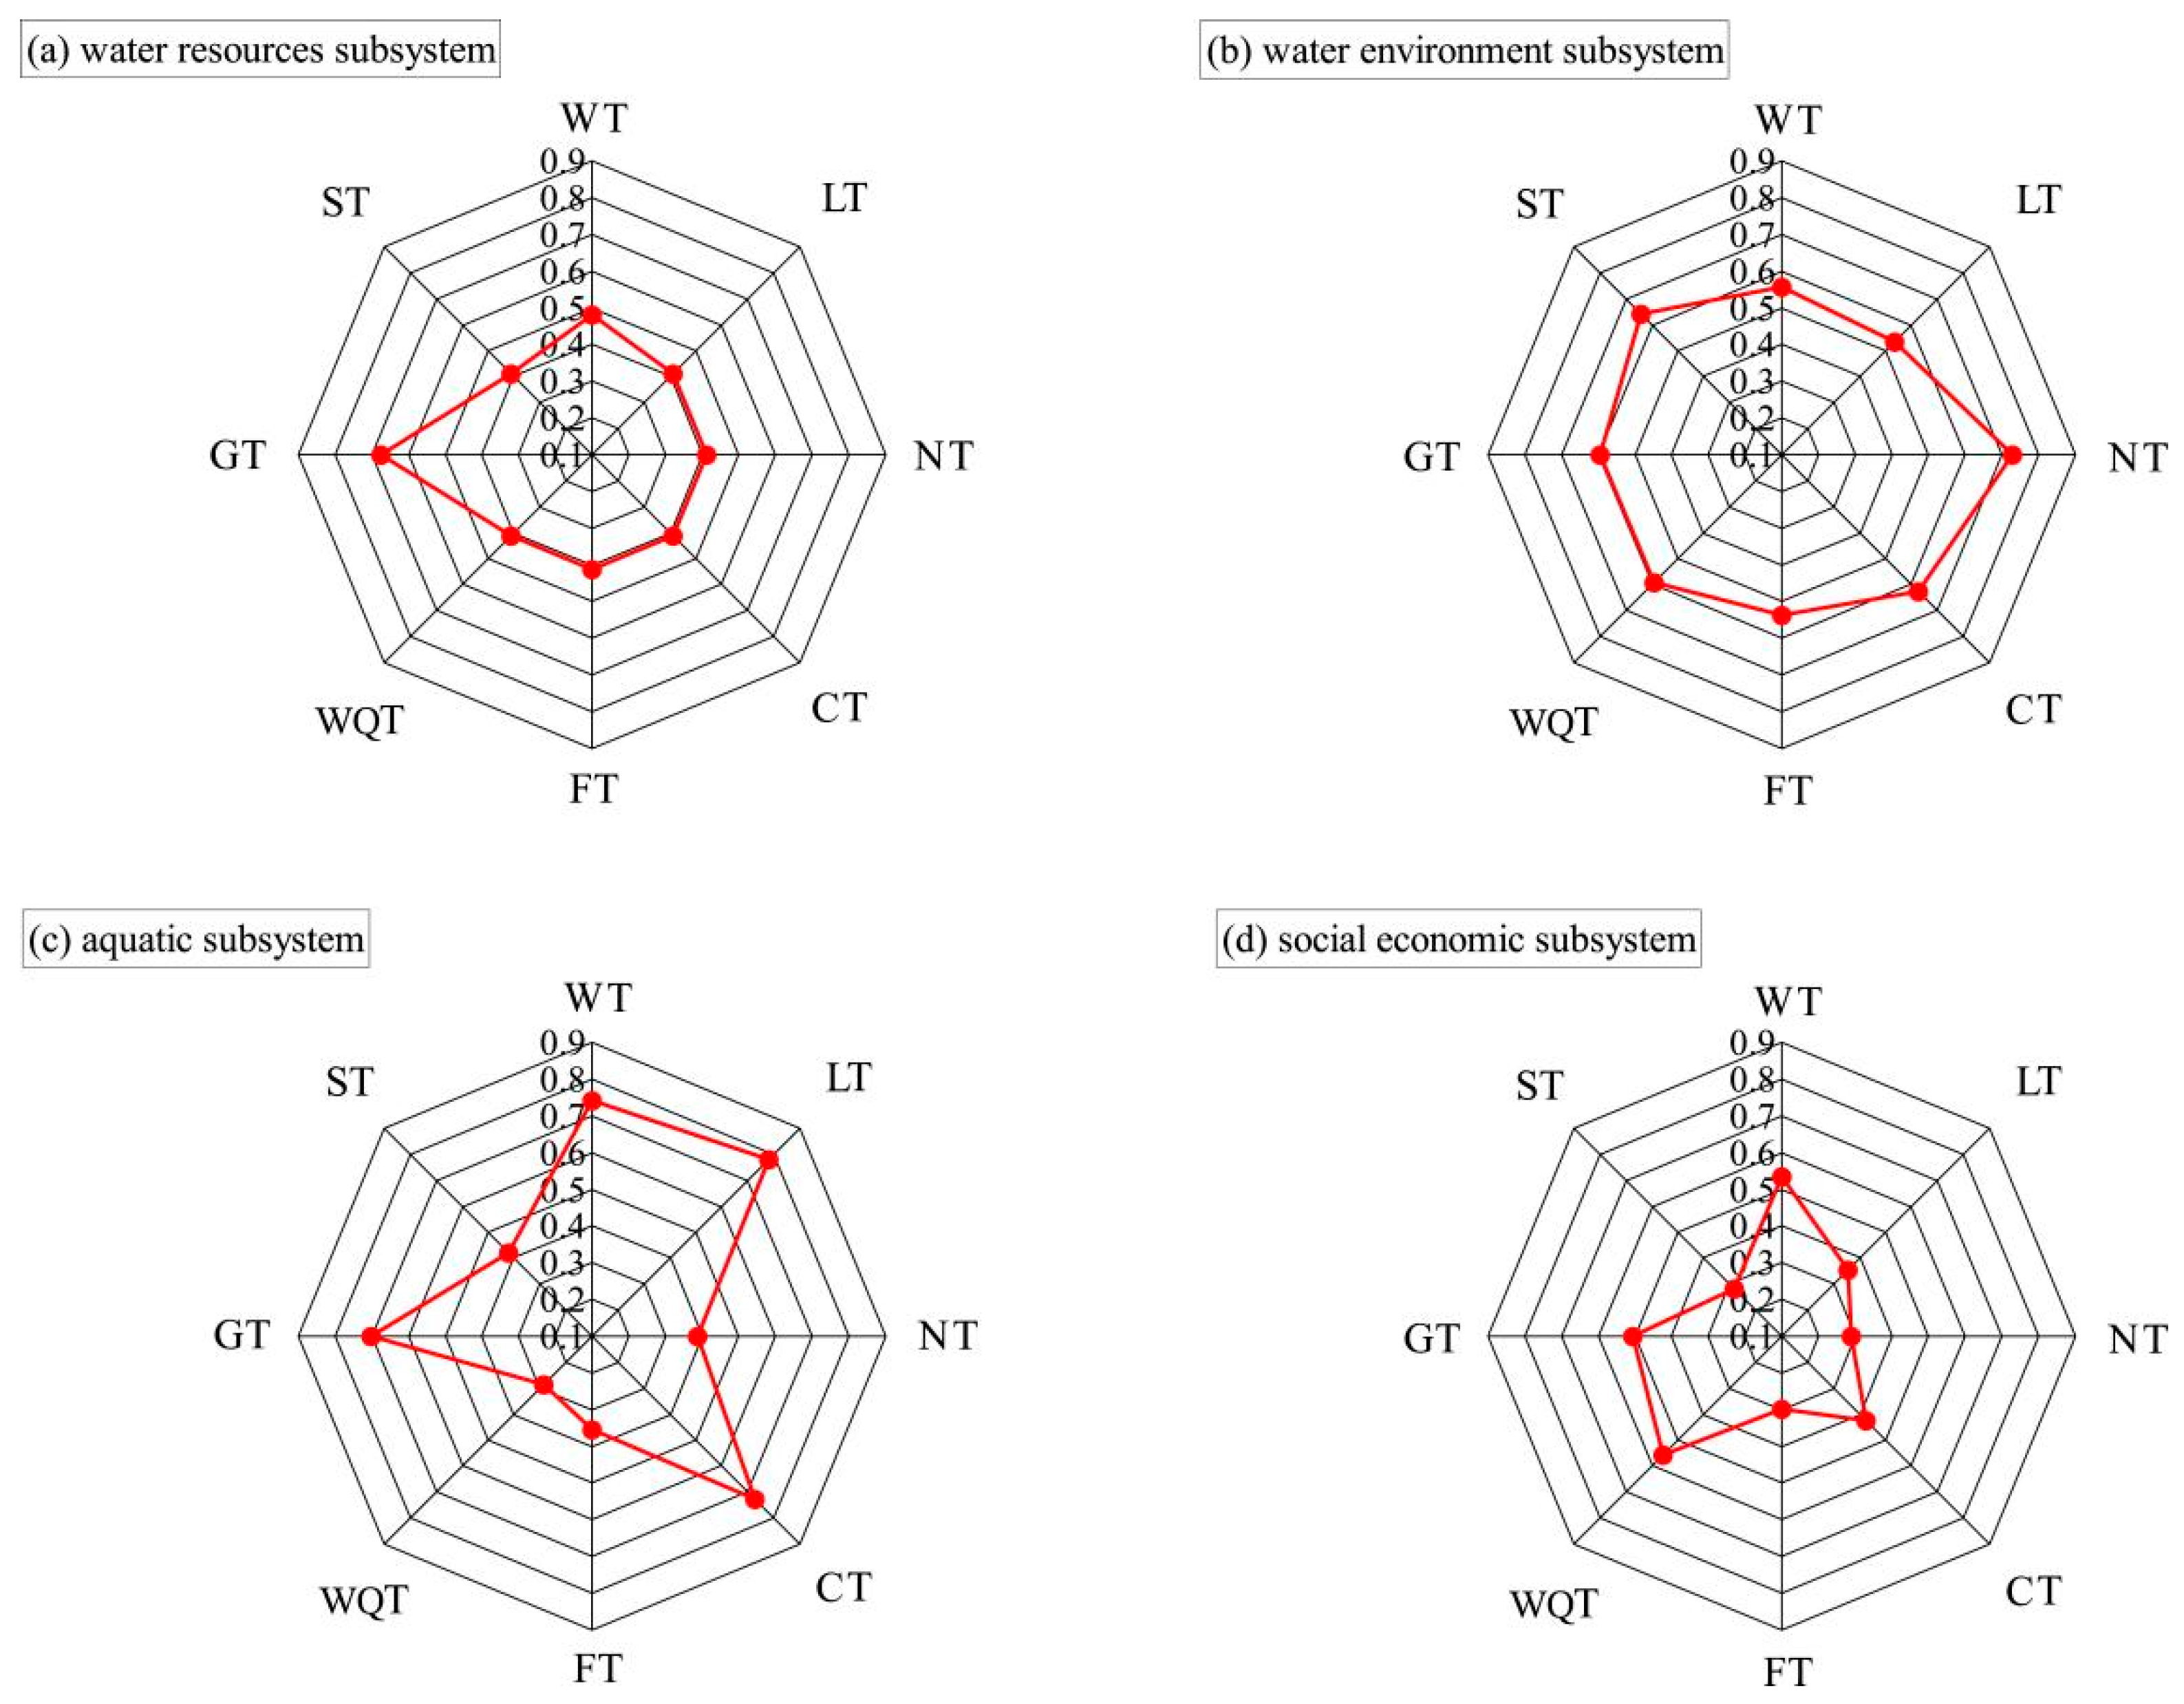
To enhance the demonstration of each criterion level’s contribution to the comprehensive evaluation of water resource carrying capacity, and to investigate the impact of each criterion level’s system on water resource carrying capacity [35], this research computed the stacking status of the four systems in the comprehensive evaluation of each township, as illustrated in Figure 4. From the horizontal perspective, the regional water resource carrying capacity is presently stable and satisfactory with a certain level of water resource development and utilization. It meets the objective of having Guantao Town as the center and Weisengzhai Town and Fangzhai Town as sub-centers, connecting ecological spaces between regions, and forming a spatial pattern of efficient and safe transportation, complementary industrial functions, and harmonious development. From the vertical perspective, the water resource subsystem and social economy subsystem contribute significantly to the comprehensive evaluation, indicating that they are the main factors influencing water resource carrying capacity.
The water resource carrying capacity of the eight townships in Guangtao County exhibits spatial variability influenced by the local industrial layout. To better reflect the spatial variability at the subsystem level, this study independently conducted fuzzy comprehensive calculations for the four criteria layers that affect water resource carrying capacity and obtained the comprehensive score values for each subsystem (Figure 5).
(1)
In the water resource subsystem, Guantao Town had the highest evaluation score of 0.6739, while the other townships generally scored around 0.45. Overall, the water resource subsystem received relatively low evaluation scores, with only Guantao Town obtaining a high score, indicating a good carrying capacity. This result is consistent with the pattern of Guantao County, which is centered around the urban area of Guantao Town radiating outwards. The county has reasonably delineated three functional zones for development, restriction, and prohibition, and it has constructed a county center with strong resource and environmental carrying capacity to foster harmonious development in the neighboring regions.
(2)
Based on the evaluation results of the water environment subsystem, the townships were ranked from highest to lowest evaluation scores as follows: Nanxucun Township, Shoushansi Township, Chaibao Town, Guantao Town, Wangqiao Township, Weisengzhai Town, Luqiao Township and Fangzhai Town. Nanxucun Township had the highest evaluation score of 0.7286, representing a farming and industrial township mainly engaged in breeding and agricultural processing. Luqiao Township and Fangzhai Town had relatively lower scores, reaching 0.53. Overall, all townships in Guantao County achieved good carrying capacity in the water environment subsystem. This is primarily due to the layout of a unified urban–rural construction system in the county, where the total emissions of major pollutants have been continuously reduced, and the rate of centralized sewage treatment has steadily increased. This also confirms the county’s reputation as “Tao Du Water Township”, which is located at the junction of Hebei, Shandong, and Henan provinces.
(3)
For the water ecology subsystem evaluation results, the townships were ranked from highest to lowest evaluation scores as follows: Luqiao Township, Weisengzhai Town, Chaibao Town, Guantao Town, Shoushansi Township, Nanxucun Township, Fangzhai Town, and Wangqiao Township. The first four townships scored above 0.7 due to the extension of the central urban area northwards, forming riverfront landscape green belts along the Yongji River and the Wei Canal. Additionally, Guantao Town relies on the Princess Lake Wetland Park and other pond landscapes to create a rich water system ecological landscape. The last four townships extend southwards, relying on the construction of a new urban area along the Handan–Ji’nan railway, resulting in relatively lower scores for water ecology.
(4)
In the social economy subsystem evaluation results, the townships were ranked from highest to lowest evaluation scores as follows: Wangqiao Township, Weisengzhai Town, Guantao Town, Chaibao Town, Luqiao Township, Fangzhai Town, Nanxucun Township, and Shoushansi Township. Guantao Town, as a comprehensive township center for politics, economy, and culture in the county, and Weisengzhai Town, as a demonstration small town constructed by Handan City, both achieved good carrying capacity within the graded range. These developments have driven the integrated development of urban and rural areas.

3.5. Results and Discussion of Weight Sensitivity Analysis

Based on the fuzzy comprehensive evaluation model with weight determination using AHP, this study analyzed the sensitivity of indicator variable weights. Figure 6 represents the comparison of the comprehensive evaluation values when removing one indicator weight for each township and the baseline result when considering all indicators. “BASE” represents the baseline result obtained when all indicators are considered, while “-XX” represents the result obtained after removing a specific evaluation indicator. From Figure 6, it can be observed that significant errors in the comprehensive evaluation values occur when removing indicators A1, A2, A3, D2, and D3, indicating that these indicators have relatively high sensitivity. To investigate the influence of specific indicator weights on assessing the comprehensive carrying capacity of water resources, we computed the Root Mean Square Error Change (RMSEC) for each township before and after adjusting individual indicator weights. The results were then summed to derive the Total Sensitivity Factor (TF) for each indicator. The calculated outcomes for the Total Sensitivity Factor (TF) of each indicator are shown in Figure 7. The indicators exhibiting the greatest sensitivity are the utilization proportion of water resources, water consumption per unit of Gross Regional Product, and per capita water resources with sensitivity factors of 40.62%, 27.58%, and 23.61%, respectively. These indicators belong to the water resource subsystem and exhibit significantly higher sensitivity than other subsystem indicators. To reduce the impact of high uncertainty associated with these indicators, it is suggested to use quantitative indicators, such as total regional water consumption, groundwater extraction, and water consumption per 10,000 industrial value-added, to replace them. This approach not only requires high data quality but also avoids the uncertainty associated with indicator allocation.
During the comprehensive evaluation analysis using the fuzzy comprehensive evaluation model, all eight townships in Guantao County exhibited good carrying capacity. To better understand the influence of evaluation uncertainty on each township, the uncertainty of indicators in the indicator layer was comprehensively calculated, as shown in Figure 8. Figure 8 indicates that Shoushansi Township had the highest indicator sensitivity, accounting for 24.65%, making it the area with the greatest uncertainty in Guantao County. In this township, the water resource development and utilization rate had the highest sensitivity, while the urban wastewater discharge indicator had the lowest sensitivity. On the other hand, Chaibao Town had the lowest indicator sensitivity, accounting for 15.30%, indicating the least uncertainty in this area. In this township, the water resource development and utilization rate had the highest sensitivity, while the industrial wastewater discharge indicator had the lowest sensitivity in the indicator layer. This study reveals that the sensitivity of indicators in the indicator layer varies, and during evaluation analysis, it is essential to control data quality or weaken the sensitivity of other indicators by adding more quantitative indicators. This can reduce data uncertainty and mitigate the impact of indicators on the evaluation results. Additionally, the sensitivity also varies for each township area, which is closely related to the actual development of various industries in the region. Therefore, improving the control of high uncertainty indicator data quality and statistical analysis of actual regional industry development can minimize errors in the assessment of water resource carrying capacity.

4. Conclusions

In this study, the weight values of the four subsystems were determined using the hierarchical analysis approach and the entropy weight method based on the collected data. The suitable method was selected by comparing the fuzzy comprehensive evaluation results of the two methods. The water resources carrying capacity and its influencing factors in Guantao County were examined from the perspectives of the four subsystems, and finally, the sensitivity of the change in the weights of the indicator variables as well as the uncertainty analysis of the indicators in the indicator layer were investigated. The calculation of the fuzzy comprehensive evaluation model indicates that the water resources in Guantao County in 2019 are generally in a bearable condition. The evaluation values of the eight townships, in descending order, are Guantao Township, Weisinzhai Township, Chaibao Township, Lubiao Township, Wangqiao Township, Nansucun Township, Shoushansi Township, and Fangzhai Township. Among them, Guantao Township has the highest rating value of 0.6208, while Fangzhai Township has the lowest rating value of 0.392. Based on the sensitivity analysis method of indicator weights, the results of the indicators with the greatest influence are screened out: the sensitivity of the weights of the five indicators of water resources development and utilization rate, water consumption per unit of GDP, per capita water resources, per capita GDP, and domestic water quota are the greatest, which reach 40.62%, 27.58%, 23.61%, 16.98%, and 14.29%, respectively. In the process of water resources planning and management in Tantao County, full attention should be paid to the above five indicators, and measures such as the rational allocation of water resources to ensure the people’s living water demand and optimization of the industrial structure to improve the efficiency of water resources utilization should be implemented so as to ensure the sustainability of the water resources carrying capacity. Analyzing the results of the attribution of the water resources carrying capacity subsystem, the water resources carrying capacity of Guantao County is greatly influenced by the regional water resources endowment status and socio-economic status. In summary, since the weight calculation method used in this study is based on a data-driven approach, it can be considered for replication in other regions, but the evaluation effect should be determined only after further research.
Compared with the previous research, the research employs the fuzzy comprehensive evaluation model to develop an evaluation index system incorporating resource, environmental, ecological, and socio-economic factors. It identifies indicators with higher sensitivity coefficients and decreases the ambiguity of the fuzzy comprehensive evaluation outcomes. The ambiguity of the evaluation outcomes is mitigated. In future research, we can continue to investigate enhancements to the fuzzy comprehensive evaluation model, explore the application of machine learning in this domain, and assess the replicability of the evaluation system across various countries or regions.

Author Contributions

Y.L. Conceptualization, Y.L. Data curation, Y.L. Funding acquisition, Y.W. Methodology, Y.L. and Y.W. Writing—original draft, Y.L. and X.Z. Writing—review and editing. D.Z. Supervision. D.Z. Validation. X.Z. and D.Z. Formal analysis. Y.W., X.Z. and D.Z. Project administration. All authors have read and agreed to the published version of the manuscript.

Funding

This research was funded by the Hebei Province Key Research and Development Program of China. Grant number: 21374201D.

Data Availability Statement

The data that support the findings of this study are available from the corresponding author, X.Z. and D.Z., upon reasonable request.

Conflicts of Interest

The authors declare no conflict of interest.

Appendix A

Table A1. Definition and criterion of each indicator in the indicator layer.
IndicatorDefinitionCriterion
Water Resources Subsystem
The utilization ratio of water resources A1/%Regional water consumption/regional water resourcesThe Guantao County Water Resources Bulletin
Water consumption per unit of Gross Regional Product A2/(m3/104 CNY)Regional water consumption/total regional GDPThe Guantao County Water Resources Bulletin and Statistical Yearbook of Guantao County
Per capita water resources A3/(m3/per person)Total water resources/total populationThe Guantao County Water Resources Bulletin and Statistical Yearbook of Guantao County
Water Environment Subsystem
Water environment quality index B1/%The rate of water quality discharge up to standardEnvironmental monitoring reports
Industrial wastewater discharge index B2/%Regional industrial water discharge/total wastewater dischargeThe Guantao County Water Resources Bulletin and environmental monitoring reports
Fertilization application intensity index B3/(kg·hm−2)Total amount of fertilizer applied (discounted)/cultivated area of evaluation areaStatistical Yearbook of Guantao County
Fertilization application intensity index B3/(kg·hm−2)Regional urban sewage discharge/total wastewater dischargeThe Guantao County Water Resources Bulletin and environmental monitoring reports
Water Ecological Subsystem
Coastal vegetation coverage rate C1/%Length of plant cover/length of shorelineStatistical Yearbook of Guantao County and Google Satellite Map
Ecological base flow guarantee rate C2/%Average monthly actual flow/minimum ecological flowRain station monitoring reports
Drainage density index C3/(1/km)River length/watershed areaStatistical Yearbook of Guantao County and Google Satellite Map
Socio-economic Subsystem
Population density D1/(per person·km−2)Regional population/regional administrative areaStatistical Yearbook of Guantao County
Per capita GDP D2/(104 CNY)Regional GDP/regional populationStatistical Yearbook of Guantao County
Domestic water quota D3/(L·(per person·d)−1)Domestic water consumption/(regional population·days)The Guantao County Water Resources Bulletin and Statistical Yearbook of Guantao County

References

  1. Zhao, Y.; Wang, Y.; Wang, Y. Comprehensive evaluation and influencing factors of urban agglomeration water resources carrying capacity. J. Clean. Prod. 2021, 288, 125097. [Google Scholar] [CrossRef]
  2. Jin, J.; Dong, T.; Li, J.; Zhang, L.; Li, H. Evaluation of water resources carrying capacity under different carrying standards. Adv. Water Sci. 2018, 29, 31–39. [Google Scholar]
  3. Wang, Y.; Wang, Y.; Su, X.; Qi, L.; Liu, M. Evaluation of the comprehensive carrying capacity of interprovincial water resources in China and the spatial effect. J. Hydrol. 2019, 575, 794–809. [Google Scholar] [CrossRef]
  4. Zuo, Q.; Zhang, X. Study on dynamic carrying capacity of water resources under climate change. J. Hydraul. Eng. 2015, 46, 387–395. [Google Scholar]
  5. Ren, B.; Zhang, Q.; Ren, J.; Ye, S.; Yan, F. A Novel Hybrid Approach for Water Resources Carrying Capacity Assessment by Integrating Fuzzy Comprehensive Evaluation and Analytical Hierarchy Process Methods with the Cloud Model. Water 2020, 12, 3241. [Google Scholar] [CrossRef]
  6. Ge, Y.; Wu, J.; Zhang, D.; Jia, R.; Yang, H. Uncertain Analysis of Fuzzy Evaluation Model for Water Resources Carrying Capacity: A Case Study in Zanhuang County, North China Plain. Water 2021, 13, 2804. [Google Scholar] [CrossRef]
  7. Park, R.; Assimilation, B.E. Introduction to the Science of Sociology; University of Chicago Press: Chicago, IL, USA, 1921. [Google Scholar]
  8. UNESCO; FAO. Carrying Capacity Assessment with a Pilot Study of Kenya: A Resource Accounting Methodology for Sustainable Development; United Nations Educational, Scientific and Cultural Organization: Paris, France, 1985. [Google Scholar]
  9. Lv, B.; Liu, C.; Li, T.; Meng, F.; Fu, Q.; Ji, Y.; Hou, R. Evaluation of the water resource carrying capacity in Heilongjiang, eastern China, based onthe improved TOPSIS model. Ecol. Indic. 2023, 150, 110208. [Google Scholar] [CrossRef]
  10. Wang, G.; Xiao, C.; Qi, Z.; Meng, F.; Liang, X. Development tendency analysis for the water resource carrying capacity based on system dynamics model and the improved fuzzy comprehensive evaluation method in the Changchun city, China. Ecol. Indic. 2021, 122, 107232. [Google Scholar] [CrossRef]
  11. He, Y.; Wang, Z. Water-land resource carrying capacity in China: Changing trends, main driving forces, and implications. J. Clean. Prod. 2022, 331, 130003. [Google Scholar] [CrossRef]
  12. Peng, T.; Deng, H. Comprehensive evaluation on water resource carrying capacity based on DPESBR framework: A case study in Guiyang, southwest China. J. Clean. Prod. 2020, 268, 122235. [Google Scholar] [CrossRef]
  13. Cao, Q.; Cheng, X.; Shi, M. Evaluation and regulation of urban water resources security based on DPSIR concept. Resour. Sci. 2012, 34, 1591–1599. [Google Scholar]
  14. Yang, J.; Lei, K.; Khu, S.; Meng, W. Assessment of Water Resources Carrying Capacity for Sustainable Development Based on a System Dynamics Model: A Case Study of Tieling City, China. Water Resour. Manag. 2015, 29, 885–899. [Google Scholar] [CrossRef]
  15. Song, X.; Kong, F.; Zhan, C. Assessment of Water Resources Carrying Capacity in Tianjin City of China. Water Resour. Manag. 2011, 25, 857–873. [Google Scholar] [CrossRef]
  16. Zuo, Q. Summary and Reconsideration on Research Methods of Water Resources Carrying Capacity. Prog. Water Conserv. Hydropower Technol. 2017, 37, 1–6. [Google Scholar]
  17. Wu, J.; Teng, Y.; Li, J.; Chen, H. Study on variable sensitivity in soil heavy metal source apportionment based on PMF model. China Environ. Sci. 2019, 39, 2960–2969. [Google Scholar]
  18. Liu, J.; Dong, S.; Li, Z. Study on comprehensive evaluation of water resources carrying capacity in China. J. Nat. Resour. 2011, 26, 258–269. [Google Scholar]
  19. Jin, J.; Wei, Y.; Ding, J. Fuzzy comprehensive evaluation model based on improved analytic hierarchy process. J. Hydraul. Eng. 2004, 3, 65–70. [Google Scholar]
  20. Zadeh, L.A. Fuzzy sets. Inf. Control 1965, 8, 338–353. [Google Scholar] [CrossRef]
  21. Wang, Y.; Shi, R.; Qiao, C. Evaluation of water resources carrying capacity in the economic belt on the northern slope of Tianshan Mountains based on fuzzy comprehensive evaluation model. Bull. Soil Water Conserv. 2018, 38, 206–212. [Google Scholar]
  22. Qu, X. Comprehensive Evaluation of Water Resources Carrying Capacity in Shaanxi Province. J. Arid. Land Resour. Environ. 2017, 31, 91–97. [Google Scholar]
  23. Wang, Y. Evaluation and application of water resources carrying capacity in Ningbo based on fuzzy theory. J. Yangtze River Sci. Res. Inst. 2013, 30, 28–31. [Google Scholar]
  24. An, Q.; Wei, C.; He, H.; Cui, Y.; Nie, Q. Evaluation of water resources carrying capacity of Zhongyuan urban agglomeration in Henan Province based on fuzzy comprehensive evaluation method. Conserv. Irrig. 2019, 12, 65–71. [Google Scholar]
  25. Lu, W.; Li, D.; Zhang, L.; Yi, Y. The application of fuzzy comprehensive evaluation based on analytic hierarchy process in water quality evaluation. Conserv. Irrig. 2011, 3, 43–46. [Google Scholar]
  26. Dai, M.; Wang, L.; Wei, X. Study on spatial differentiation of water resources carrying capacity in Guangxi based on fuzzy comprehensive evaluation model of entropy weight. Soil Water Conserv. 2016, 23, 193–199. [Google Scholar]
  27. Hamidifar, H.; Ghorbani, M.K.; Bakhshandeh, M.A.; Gholami, S. A multi-criteria multidimensional model for optimal selection of rural water supply systems. AQUA-Water Infrastruct. Ecosyst. Soc. 2023, 72, 1042–1056. [Google Scholar] [CrossRef]
  28. Zuo, Q.; Guo, J.; Ma, J.; Cui, G.; Yang, R.; Yu, L. Assessment of regional-scale water resources carrying capacity based on fuzzy multiple attribute decision-making and scenario simulation. Ecol. Indic. 2021, 130, 108034. [Google Scholar] [CrossRef]
  29. Ghorbani, M.K.; Hamidifar, H.; Skoulikaris, C.; Nones, M. Concept-Based Integration of Project Management and Strategic Management of Rubber Dam Projects Using the SWOT–AHP Method. Sustainability 2022, 14, 2541. [Google Scholar] [CrossRef]
  30. Zhao, X.; Ye, Y.; Zhou, J.; Liu, L.; Dai, W.; Wang, Q.; Hu, Y. Comprehensive evaluation of cultivated land quality and sensitivity analysis of index weight in hilly area of Pearl River Delta. Agric. Eng. 2017, 33, 226–235. [Google Scholar]
  31. Xing, K.; Guo, H. A review of uncertainty analysis methods for environmental models. Environ. Sci. Technol. 2006, 5, 112–115. [Google Scholar]
  32. Liu, Y.H.; Li, Y.B.; Liang, X.Y.; Ran, C.H. Evaluation and change of water resources carrying capacity in China. Resour. Environ. Yangtze River Basin 2019, 28, 1080–1091. [Google Scholar]
  33. Wang, Q.; Zhang, Y.; Yang, Y. Study on Evaluation Index System of Resources and Environment Carrying Capacity in Xiong ‘an New Area. Environ. Sci. Technol. 2020, 43, 203–212. [Google Scholar]
  34. Li, Z.; Wang, J.; Ye, Y.; Dong, J.; Liu, X. Study on uncertainty of water resources carrying capacity evaluation under the influence of weight and data. Yangtze River 2023, 54, 53–60. [Google Scholar]
  35. Yang, J.; Yang, P.; Zhang, S.; Wang, W.; Cai, W.; Hu, S. Evaluation of water resources carrying capacity in the middle reaches of Heihe River based on fuzzy comprehensive evaluation model. Hydroelectr. Energy 2023, 41, 27–30. [Google Scholar]
  36. Guantao County Water Bureau. 2019, Guantao County Water Bureau, the Guantao County Water Resources Bulletin; China Statistics Press: Beijing, China, 2017.
  37. Statistics Bureau of Guantao County, Hebei Province. Statistics Bureau of Guantao County, Hebei Province, Statistical Yearbook of Guantao; China Statistics Press: Beijing, China, 2019.
  38. Gao, F.; Wang, H.; Liu, C. Long-term assessment of groundwater resources carrying capacity using GRACE data and Budyko model. J. Hydrol. 2020, 588, 125042. [Google Scholar] [CrossRef]
  39. Wang, X.; Li, X.; Wang, J. Urban Water Conservation Evaluation Based on Multi-grade Uncertain Comprehensive Evaluation Method. Water Resour. Manag. 2018, 32, 417–431. [Google Scholar] [CrossRef]
  40. Ren, L.; Gao, J.; Song, S.; Li, Z.; Ni, J. Evaluation of Water Resources Carrying Capacity in Guiyang City. Water 2021, 13, 2155. [Google Scholar] [CrossRef]
Figure 1. Location map of Guantao County.
Water 15 04277 g001
Figure 2. Comparison of weight outcomes computed by Analytic Hierarchy Process and Entropy Weight Method.
Water 15 04277 g002
Figure 3. The connection among the assessment outcomes of Analytic Hierarchy Process and Entropy Weight Method. (The line represents the fitting line of the two evaluation results).
Water 15 04277 g003
Figure 4. The results and distribution of comprehensive evaluation value of water resources carrying capacity in Guantao County.
Water 15 04277 g004
Figure 5. The score value of each subsystem of water resources carrying capacity of each township (WT on behalf of Weisengzhai Town, LT on behalf of Luqiao Township, NT on behalf of Nanxucun Township, CT on behalf of Chaibao Town, FT on behalf of Fangzhai Town, WQT on behalf of Wangqiao Township, GT on behalf of Guantao Town, ST on behalf of Shoushansi Township).
Water 15 04277 g005
Figure 6. The comparison between the original comprehensive assessment value for each township and the elimination of a specific factor (WT on behalf of Weisengzhai Town, LT on behalf of Luqiao Township, NT on behalf of Nanxucun Township, CT on behalf of Chaibao Town, FT on behalf of Fangzhai Town, WQT on behalf of Wangqiao Township, GT on behalf of Guantao Town, ST on behalf of Shoushansi Township).
Water 15 04277 g006aWater 15 04277 g006bWater 15 04277 g006c
Figure 7. Distribution of the overall sensitivity of evaluation indicators for water resources carrying capacity.
Water 15 04277 g007
Figure 8. The total sensitivity results of each township and the distribution map of uncertainty impact indicators.
Water 15 04277 g008
Table 1. Comprehensive evaluation indicator and grading standard of water resources carrying capacity in Guantao County.
Goal LayerCriterion LayerIndicator TypesIndicator LayerGrading Standard
V1V2V3V4V5
Water resources carrying capacity synthesisWater resources subsystem
(A)
ReverseThe utilization ratio of water resources A1/%<1515~2020~3535~60>60
ReverseWater consumption per unit of Gross regional product A2/(m3/104 CNY)<5050~7575~8080~100>100
ObversePer capita water resources A3/(m3/per person)>17001300~1700900~1300500~900<500
Water environment subsystem
(B)
ObverseWater environment quality index B1/%>9080~9070~8060~70<60
ReverseIndustrial wastewater discharge index B2/%<1010~2020~4040~50>50
ReverseFertilization application intensity index B3/(kg·hm−2)<100100~150150~200200~250>250
ReverseUrban wastewater discharge index B4/%<1010~2020~4040~50>50
Water ecology subsystem
(C)
ReverseCoastal vegetation coverage rate C1/%<2020~3030~4040~60>60
ObverseEcological base flow guarantee rate C2/%>6040~6030~4020~30<20
ObverseDrainage density index C3/(1/km)>0.80.6~0.80.4~0.60.2~0.4<0.2
Social economy subsystem
(D)
ReversePopulation density D1/(per person·km−2)<300300~500500~700700~900>900
ObversePer capita GDP D2/(104 CNY)>7.56~7.54.5~63~4.5<3
ObverseDomestic water quota D3/(L·(per person·d)−1)>130110~13090~11070~90<70
Table 2. Comprehensive assessment outcomes of water resources carrying capacity derived using the Analytic Hierarchy Process.
Township NameV1V2V3V4V5Comprehensive
Evaluation Value
Wei Sengzhai Town0.2800.1420.0310.1910.3560.540
Luqiao Township0.4510.0690.0000.1760.3040.463
Nanxucun Township0.5400.0200.0430.0910.3060.421
Chaibao Town0.4100.0300.1040.1260.3300.487
Fangzhai Town0.4500.1400.1500.0200.2400.392
Wangqiao Township0.5000.0160.0140.1230.3470.460
Tuoguantao Town0.2400.0360.1340.0600.5300.621
Shoushan Temple Township0.4700.0920.0980.0920.2480.411
Table 3. Comprehensive assessment outcomes of water resources carrying capacity derived using the Entropy Weight Method..
Township NameV1V2V3V4V5Comprehensive Evaluation Value
Wei Sengzhai Town0.2610.0780.0410.2710.3490.574
Luqiao Township0.3740.1840.0000.2100.2310.448
Nanxucun Township0.4050.0250.0580.2160.2960.494
Chaibao Town0.2780.0810.2330.1600.2480.504
Fangzhai Town0.3490.1720.2910.0310.1570.395
Wangqiao Township0.4030.0340.0290.2670.2660.492
Tuoguantao Town0.3500.0510.1380.0940.3670.515
Shoushan Temple Township0.2790.1590.1560.2280.1780.473
Table 4. Classification standard of comprehensive score value of water resources carrying capacity.
Bearing LevelUnbearableQuasi-LoadableGood BearingIdeal Bearing
Evaluation result0–0.250.25–0.50.5–0.750.75–1.0
Disclaimer/Publisher’s Note: The statements, opinions and data contained in all publications are solely those of the individual author(s) and contributor(s) and not of MDPI and/or the editor(s). MDPI and/or the editor(s) disclaim responsibility for any injury to people or property resulting from any ideas, methods, instructions or products referred to in the content.

