Article

Land Cover Trajectories and Their Impacts on Rainfall-Triggered Landslide Occurrence in a Cultivated Mountainous Region of Western Japan

1
Graduate School of Agriculture, Ehime University, Matsuyama 790-8566, Japan
2
National Research Institute for Earth Science and Disaster Resilience, Tsukuba 305-0006, Japan
3
Faculty of Environmental Studies, Tokyo City University, Yokohama 224-8551, Japan
4
Faculty of Civil Engineering, Thuyloi University, Hanoi 10000, Vietnam
5
Graduate School of Science and Technology, Gunma University, Kiryu 376-8515, Japan
*
Author to whom correspondence should be addressed.
Water 2023, 15(24), 4211; https://doi.org/10.3390/w15244211
Submission received: 6 November 2023 / Revised: 3 December 2023 / Accepted: 4 December 2023 / Published: 6 December 2023

Abstract

:
Land cover changes in mountainous regions are potential precursors to landslide disasters. However, the effects of past long-term land cover changes on the characteristics of recent landslides remains underexplored. We studied land cover evolution over a 56-year period on Omishima Island in western Japan to examine the spatial relations of landslides in the July 2018 storm event based on rainfall, land cover trajectories, and topography. We generated land cover maps for 1962, 1981, and 2018 by aerial photo interpretation. We also identified 512 new landslides. Based on 47-year precipitation records, we estimated the return periods of 1- to 264-h rainfalls during the storm using the generalised extreme value (GEV) distributions. Return periods showed wide variation when the derived GEV distributions were applied to 1-km grid rainfall distributions. Despite such pronounced spatial variations in rainfall, we did not observe a clear correlation between rainfall intensity and landslide distribution. In contrast, land cover trajectories had a pronounced effect on landslide occurrence. Landslides were more concentrated on slopes that experienced land cover changes after 1962. A comparison of slopes on farmland developed between 1962 and 1981 (mainly citrus orchards) indicated that landslide density and area ratio were significantly lower on slopes that had reverted to forests than on those remaining as farmland. However, the values of the reforested slopes exceeded those of forests and farmlands that remained since before 1962. Our geospatial analysis revealed that even if the field had shifted to forests, the effects of reduced slope stability due to orchard development had remained for at least 37 years. This suggested that the impacts of converting forests to orchards last longer than harvesting in managed plantation forests.

1. Introduction

Human-induced land cover change occurs broadly in mountainous regions worldwide [1], causing various environmental changes [2]. Among such anthropogenic changes, forest clearing and conversion to other land cover types, including monoculture tree plantations, agricultural fields (i.e., cropland, pasture, and orchard) and bare lands, significantly impact landslide occurrence due to reduced slope stability by removing the existing vegetation [3,4].
Numerous studies have examined how anthropogenic land cover changes have affected landslide occurrence. These studies demonstrated that, particularly in steep mountainous terrains, the occurrences of shallow landslides due to rainfall events have been markedly accelerated by deforestation, such as harvesting in plantation forests [5,6,7,8,9,10,11], shifting (slash-and-burn) cultivation [3,12], and forest conversion to pasture [13,14,15,16] or farmland [17,18,19,20]. Studies focusing on the role of tree roots in slope stabilisation have revealed that the effectiveness of root systems for soil layer reinforcement is highly spatially heterogeneous and does not remain constant over time. For example, several studies have demonstrated that the abundance of roots in the soil layer and the mechanical strength of the entire root system are strongly dependent on tree species, size, and density [21,22,23]. Some intensive research in managed plantation forests showed that the effectiveness of tree root reinforcement decreased progressively over a period of approximately 10 years after logging due to the decay of felled tree roots, but recovered to the same level as before logging within 25 years due to the growth of replanted tree roots [5,10,24,25]. This understanding of the influences of vegetation highlights the need to consider various vegetation characteristics (e.g., species, size, density, and age) reflecting past land cover changes when assessing landslide susceptibility over a wide area. However, with the exception of several studies in managed plantation forests, there have been few investigations of the effects of past long-term land use changes on the characteristics of recent landslides.
Notably, recent land cover changes have occurred not only in the direction of forest losses but also in that of forest gains through afforestation and forest regeneration [26]. In Japan, the abandonment of farmlands has been progressing in response to changes in economic, industrial, and social trends over the last several decades (primarily increased dependence on imported agricultural products and depopulation of farming workers), and many of these abandoned fields have been shifted to secondary forests [27]. However, as agricultural land use in mountainous regions has generally been extensive and unregulated, it is often unclear where and how land use and land cover changed in the past, which hinders a comprehensive understanding of the relationship between land cover evolution and landslide occurrence. Therefore, exploring and reconstructing the trajectory of land cover changes at each location is necessary to determine how long the impacts of anthropogenic land cover change will remain.
In this study, we explored land cover evolution in a mountainous region, where land has been widely used as sloped farmland, to analyse its relationship with the occurrence of landslides due to heavy rains in recent years. The primary objectives of this study were to understand past land cover changes quantitatively and to clarify how and to what extent past land cover changes affected recent shallow landslide occurrences on Omishima Island, western Japan (Figure 1). The island experienced numerous landslides triggered by heavy rains from late June to early July 2018, causing severe damage to infrastructure, property, and farmland. The island had citrus fruit farming using terraced fields, and abandoned citrus orchards have expanded in recent decades [28,29].
We also analysed the relationship between landslide distribution and spatial rainfall variation. Although landslide occurrences are expected to be closely related to the predisposition and rainfall amount at each location [3], few studies have considered both effects in characterising landslide distribution in a single storm event. Recent advances in meteorological radar observation networks allowed us to analyse the spatial relationship between rainfall events and landslides, even in remote mountainous regions without dense ground observatories, e.g., [19]. We used radar/rain gauge-analysed precipitation (RRAP), which is generated by correcting radar-estimated rainfall using rainfall records at ground observatories; it is therefore more reliable and accurate than the original radar estimates, e.g., [30,31,32,33], although the spatial and temporal resolution is not very high (1-h precipitation data with spatial resolution ≥ 1 km).

2. Study Area

2.1. Omishima Island

Omishima Island (67.5 km2) is located in the Setonaikai Sea area, western Japan (Figure 1A,B). The elevation ranges from sea level to the peak of Mt. Washigato at 436 m a.s.l. in the central part of the island (Figure 1B). Hillslopes primarily vary between 5° and 45°, steepening with increasing elevation (Figure 1C). The bedrock geology mainly comprises granite rocks in the southern and central parts of the island, and the northern part of the island consists of metamorphic rocks [34,35]. The Omishima Observatory (Figure 1B), which is operated by the Japan Meteorological Agency (JMA), recorded a mean annual temperature and precipitation of 15.4 °C and 1218.6 mm, respectively, from 1991 to 2020.
The land use and land cover of Omishima Island are characterised by terraced fields spread over hillslopes. A vegetation map at 1:50,000 scale (Figure 1D) prepared by the Ministry of the Environment of Japan (MOE) from surveys in 1978–1999 shows that agricultural fields cover an area of 32.5 km2. Notably, approximately 84% (ca. 27.4 km2) of this area is occupied by evergreen citrus orchards. Due to the narrow plains and mountainous topography of the island, orchard areas are often located on slopes. The remaining slopes are predominantly covered with natural and semi-natural forests consisting of pines (Pinus densiflora and Pinus thunbergii), oaks (e.g., Quercus acutissima, Quercus serrata), and evergreen broadleaf trees (e.g., Quercus acuta, Castanopisis sieboldii), with some cedar (Cryptomeria japonica) and cypress (Chamaecyparis obtusa) plantations.
Citrus orchards began to expand on Omishima Island around the 1930s, whereas the landscape of terraced fields originated in the early 18th century with the introduction of sweet potato cultivation [28]. Once citrus fruit farming (mainly mandarin oranges) took root on the island, terraced crop fields were rapidly converted into orchards. In the 1960s, orchard expansion further accelerated with the enforcement of the Act on Special Measures for the Promotion of Fruit Tree Agriculture and the start of agricultural structure improvement projects. New orchards were developed on slopes by clearing mountain forests. However, since the mid-1970s, orange prices have become stagnant, mainly due to the increase in imported fruits, which caused reductions in production and in the number of farmers, leading to a rapid increase in the area of abandoned orchards [29]. Consequently, the island experienced a rapid expansion of orchards on slopes and a subsequent increase in areas abandoned after the 1960s.

2.2. The July 2018 Storm Event and Landslide Disaster

Heavy rainfall affected a broad region of western Japan from 28 June to 8 July 2018 [36,37]. The Omishima Observatory (Figure 1B) recorded a total rainfall of 446.5 mm, with 24-h rainfall between 08:00 on 6 July and 08:00 on 7 July (JST) reaching 249.5 mm, breaking previous records (Figure 2). This precipitation event triggered numerous landslides on Omishima and neighbouring islands, some causing severe damage to property and infrastructure [38,39]. Landslides also occurred in citrus orchards and abandoned orchards. Our earlier observations in Omishima Island found that large-scale landslides occurred on slopes where orchard fields were created by filling head hollows in upstream areas [40,41]. Based on these findings, we focused on temporal changes in land cover, including the development of new orchard fields and their abandonment in the past decades.

3. Methods

We conducted geographic information system (GIS)-based analysis, including the identification and classification of land cover change during the 56 years prior to the July 2018 storm event (1962–2018), mapping of landslides triggered by the storm event, analysis of rainfall intensity and its spatial variation during the storm event, and analysis of landslide occurrence in association with rainfall, land cover changes, and topography. Based on the results of these analyses, we examined how and to what extent the past land cover change affected the landslide occurrences in the recent storm event. Details of the methods are described below.

3.1. Land Cover Mapping

Past land cover changes (hereinafter referred to as land cover trajectories) were reconstructed through the visual interpretation of optical images and complementary field surveys. Although land use and land cover data for several periods are available in Japan (e.g., the 1:50,000-scale vegetation map created by MOE; Figure 1D), each has different criteria and resolutions (map scales) for classification. Therefore, it is difficult to determine whether land cover changes have occurred by comparing the published data. Hence, we newly generated a time series of land cover maps.
Land cover was classified into four types (Figure 3): (A) forest, characterised by dense and closed tree canopies indicating very high tree density; (B) shrub, characterised by sparse and small canopies, accompanied by herbaceous vegetation including bamboo grasses and ferns, as well as bare ground; (C) farmland, characterised by landscapes with demarcated agricultural fields, mainly citrus orchards; and (D) developed land, including non-vegetated areas, such as residential and industrial areas and quarry sites. Water bodies (e.g., dammed areas, reservoirs, and river channels) were excluded from the analysis. Land cover classification was performed manually based on the visual interpretation of orthorectified images using ArcGIS ver. 10.8.1. We used aerial photographs taken in May 1962, February 1975, October 1981, April 2016, and September 2018 for this analysis (Table 1). A high-resolution satellite image (1.5-m resolution true colour image obtained by pan-sharpening SPOT-6 panchromatic and multispectral sensor images acquired on 16 July 2018) was also used as complementary data to understand the ground surface conditions immediately after the heavy rainfall event.
As the intervals between photographs taken in 1975 and 1981 and 2016 and 2018 were short (ca. 2–6 years), no significant land cover changes were observed between periods. Therefore, we integrated the results of the visual interpretation of photographs from 1975 and 1981 and those from 2016 and 2018 and generated three land cover maps with a scale of 1:10,000 for 1962, 1981, and 2018. The 2018 land cover map was confirmed by comparison with the current vegetation and land use conditions through field surveys from 2019 to 2023.
As illustrated in Figure 4, the land cover of Omishima Island changed significantly during the study period. By comparing aerial photographs and land cover maps, we identified eight characteristic trajectory patterns: (i) conversion to farmland; (ii) conversion to developed land; (iii) shift to forest; (iv) shift to shrub; (v) remaining forest; (vi) remaining shrub; (vii) remaining farmland; and (viii) remaining developed land. Trajectories (i) and (ii) represent conversions from (semi-)natural environments (forest and shrub) to anthropogenic environments (farmland and developed land). Conversely, trajectories (iii) and (iv) correspond to shifts from anthropogenic environments to (semi-)natural environments caused by vegetation succession or afforestation. If the land cover did not change throughout the study period, then the trajectory of the area was classified as (v–viii) based on the initial land cover classification.
We also performed high-resolution terrain surface analysis to verify the classification results of land cover trajectories by comparing our trajectory map with the tree height distribution estimated from light detection and ranging (LiDAR) data. Tree height at each location was expected to correspond to land cover and its trajectory pattern. We obtained post-storm airborne LiDAR data acquired in September 2018 from the Forestry Agency of the Ministry of Agriculture, Forestry and Fisheries (MAFF). The LiDAR point cloud data had an average density of 25.3 m−2 for original data and 4.4 m−2 for filtered ground data in the study area. Using this data set, we generated a digital surface model (DSM) and digital terrain model (DTM) with a resolution of 0.5 m through interpolation by constructing triangulated irregular networks (TINs). A digital canopy height model (DCHM) was generated by subtracting the DTM from the DSM. Assuming that each point in the DCHM represents the tree height at that point, we extracted the highest point at 5-m grid cell intervals to estimate the height of overstorey trees and summarised them according to the land cover trajectory patterns.

3.2. Landslide Mapping

Landslides triggered by the heavy rainfall in July 2018 were mapped using orthorectified images captured after the storm (Table 1). The shape and location of each identified landslide (landslide polygon) was confirmed by comparison with a post-storm topographic map generated from the LiDAR-based 0.5-m DTM described above. The area of each landslide scar was measured using the geometry calculator in ArcGIS. Some additional information on landslides will be presented in Section 4.2.

3.3. Rainfall Analysis

To clarify the significance of rainfall in the July 2018 storm event, we analysed hourly rainfall records observed at the JMA Omishima Observatory (Figure 1B). We first collected annual maxima for 1, 3, 6, 12, 24, and 264 h (11 days) from a 47-year hourly rainfall time series (1976–2022) (Figure 2). Then, we estimated the generalized extreme value (GEV) distribution parameters that best fit each annual maximum data set using the maximum likelihood estimation (MLE) approach. The obtained GEV distributions were used to estimate return levels and return periods for 1- to 264-h rainfall. This analysis was performed using the ExtRemes package in R ver. 4.2.3 [42,43].
As topography and local atmospheric conditions markedly affect rainfall, the precipitation from a single storm can vary widely, even within a small area. To examine the effects of spatial variation in rainfall on landslide occurrence, RRAP data were also used in this study. RRAP consists of previous 1-h precipitation data with a spatial resolution of 1 km (2006 to present) generated every 30 min using radar estimates and observation by rain gauges densely distributed throughout Japan. Many previous studies have verified the accuracy of RRAP data, e.g., [30,31,32,33]. We obtained hourly data from 0:00 on 28 June to 0:00 on 8 July 2018 (JST) and calculated the event maximum for 1, 3, 6, 12, and 24 h and the total (264 h) rainfall at each grid cell. From the calculation results of each rainfall intensity, 174 grid cells overlapping with the study area were extracted and divided into five or six rainfall classes in increments ranging from 2.5 to 25.0 mm. We overlaid this data set onto land polygons of Omishima Island to identify the area of each rainfall class, and then analysed the landslide characteristics described in the following section.

3.4. Geospatial Analysis of Landslide Occurrence with Rainfall, Land Cover Change, and Topography

The rainfall and land cover change distributions were compared with the landslide distribution to investigate their spatial correspondence. Using the event maximum rainfall distributions, landslide density, area ratio (proportion of landslide scar areas), and area size statistics (i.e., mean, standard deviation [SD], median, and range) were computed for each rainfall class. These features were also calculated for each land cover trajectory pattern and the current land cover type.
As topography is an essential factor affecting the occurrence of landslides together with rainfall and land cover change, e.g., [10], spatial distributions of elevation, slope angle, and planform and profile curvatures were analysed for the study area and landslide sites using the Spatial Analyst extension in ArcGIS. In this analysis, we used a pre-storm 5-m DTM generated by the Geospatial Information Authority of Japan (GSI) based on airborne LiDAR data in April 2012.

4. Results and Discussion

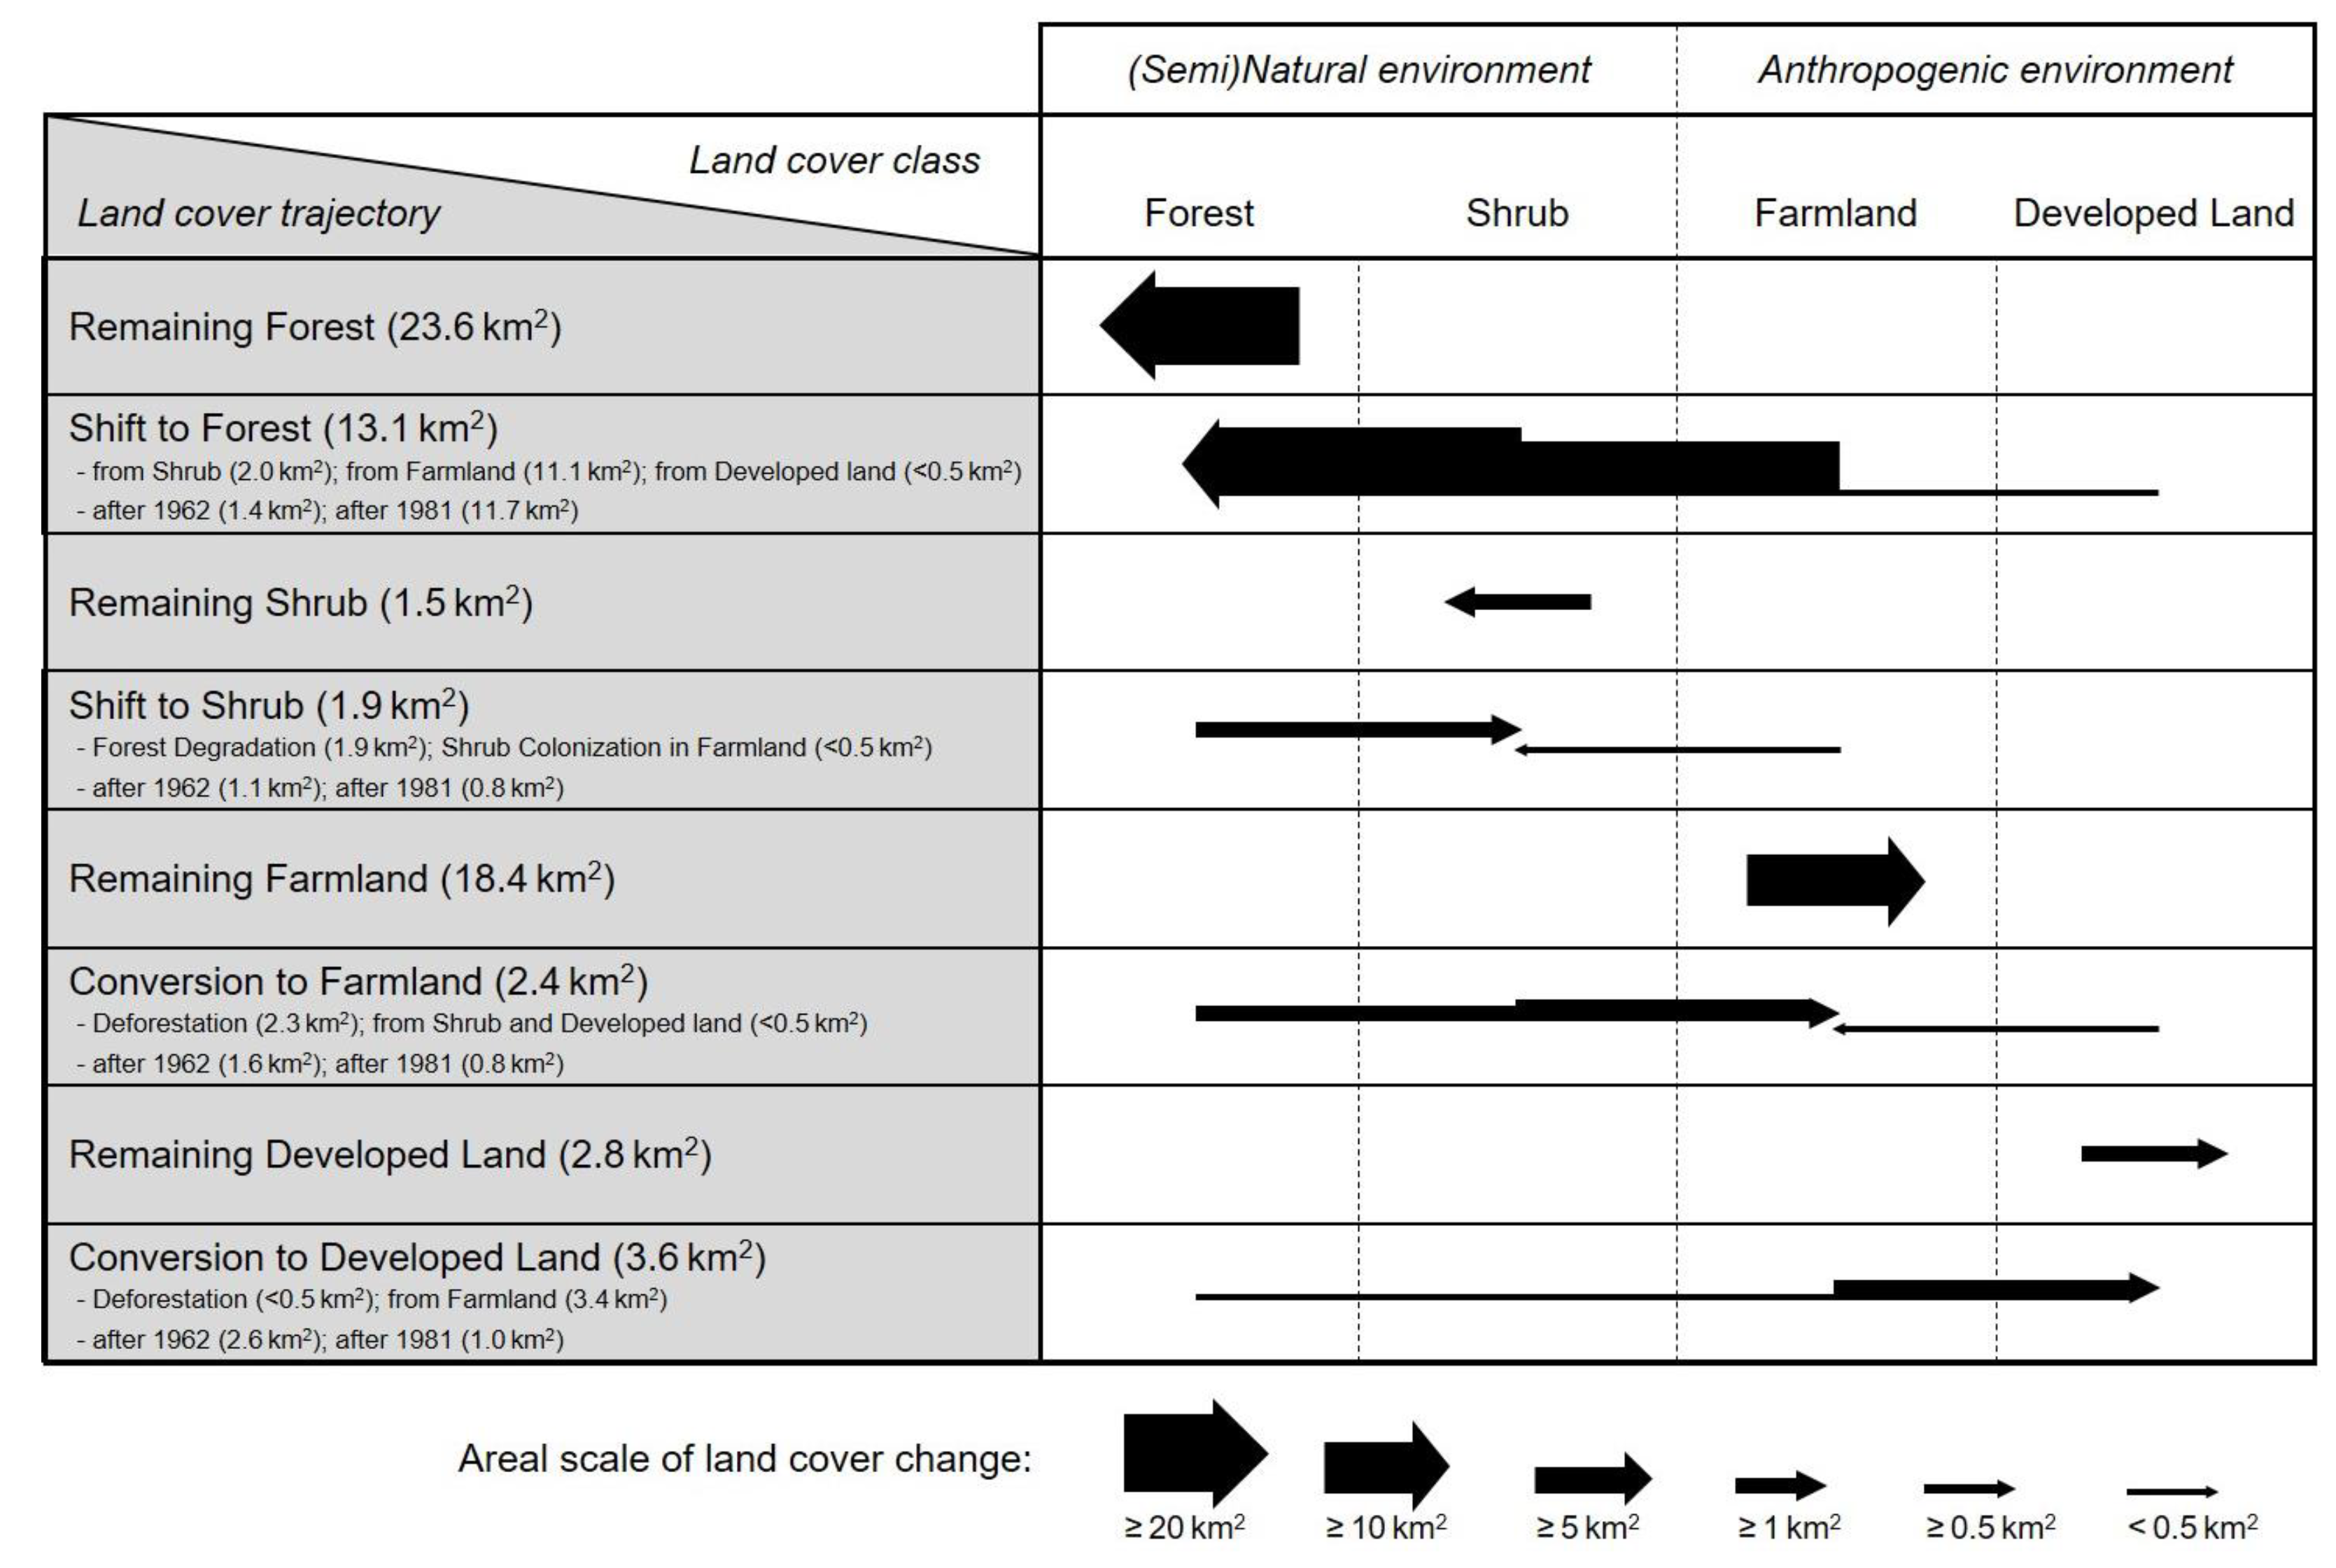
4.1. Patterns of Land Cover Change

The newly generated land cover maps for the three periods (1962, 1981, and 2018) (Figure 5A–C) showed that Omishima Island was continuously dominated by forest and farmland (mainly citrus orchards) throughout the study period (1962–2018). Forest and farmland each accounted for 31–54% of the island area; their total area reached 85–91%. However, their areas and distributions changed significantly in the few decades between each period. Temporal changes in land cover types (Figure 6A) showed that forest area decreased by ca. 4.3 km2 (from 31.0 to 26.7 km2) between 1962 and 1981 and increased by ca. 10.0 km2 (from 26.7 to 36.7 km2) between 1981 and 2018. Farmland area increased by ca. 0.7 km2 (from 30.6 to 31.3 km2) between 1962 and 1981 and decreased by ca.10.5 km2 (from 31.3 to 20.8 km2) between 1981 and 2018.
Land cover trajectories for the past 56 years were reconstructed by comparing the three land cover maps (Figure 5D). We quantified how the area of each trajectory pattern has changed over time (Figure 6B) and created a diagram showing the changes from and to each land cover type (Figure 7). Approximately 23.6 km2 of forest and 18.4 km2 of farmland remained intact throughout the study period; however, current forests contain ca. 13.1 km2 of secondary forest formed after 1962, and the current farmland area includes ca. 2.4 km2 of farmland that was newly developed after 1962 (Figure 6 and Figure 7). Secondary forest formation (shift to forest) occurred mainly on former farmland (ca. 11.1 km2) and was concentrated over the 37-year period from 1981 to 2018. Most new farmland development (conversion to farmland) occurred in the former forest (ca. 2.3 km2) and was concentrated over the 19-year period from 1962 to 1981. Although there were also substantial changes in the areas of shrub and developed land, these changes were insufficient to significantly alter the land cover of the island.
The land cover trajectory classification results based on visual interpretation of aerial photographs were consistent with the current tree height distribution estimated from the post-storm DCHM (Figure 5D,E). As shown in Figure 8, estimated tree heights were the highest for remaining forest before 1962 (mature forests > 56 years, mean ± standard deviation [SD]: 13.3 ± 5.4 m, median: 12.9 m), followed by areas shifted to forests after 1962 (secondary forests mainly < 37 years; mean ± SD: 12.2 ± 4.7 m, median: 12.0 m). Although the estimated tree heights for shrub, farmland, and developed land were clearly lower than for forests, there were some discrepancies with actual tree heights determined in the field. For example, the estimated tree height for farmland was 5.4 m on average (remaining farmland before 1962; mean ± SD: 5.1 ± 4.5 m, median: 4.0 m, newly developed farmland [areas converted to farmland after 1962]; mean ± SD: 7.3 ± 4.9 m, median: 7.0 m), whereas the actual height of citrus fruit trees planted in farmland was approximately 2.0–3.0 m, likely because the DCHM obtained from airborne LiDAR data included the heights of objects other than planted fruit trees, such as hedge trees and structures within and around the orchards. Nevertheless, the characteristics of the estimated tree height distribution for each land cover trajectory pattern were generally consistent with the actual heights of trees and structures in each location, suggesting that visual interpretation of aerial photographs in this study accurately reconstructed the land cover trajectory of Omishima Island.
Figure 9 shows the probability density distributions of topographic conditions for the study area. The distributions of elevation and slope angle by land cover trajectory patterns (Figure 9A,B) revealed that the remaining forest before 1962 was mainly distributed on slopes ≥30° at elevations ≥100 m, whereas areas that shifted to forests after 1962 were found more frequently on gentler slopes (<30°) at lower elevations (<100 m); however, most of the remaining farmland before 1962 was located on slopes of <30° at elevations <100 m, whereas areas converted to farmland after 1962 were more frequently found on steeper slopes (≥30°) at higher elevations (≥100 m). In contrast, both planform and profile curvatures in the study area were concentrated around zero (i.e., straight, planar slopes), with no differences in dominant slope morphology among the different land cover trajectory patterns (Figure 9C,D).
Thus, the following features characterised land cover changes in Omishima Island between 1962 and 2018. Forest and farmland have consistently dominated the island over the past 56 years. However, forest area decreased during the initial 19 years (1962–1981), mainly due to conversion to farmland. Forest area increased substantially, while farmland area decreased over the subsequent 37 years (1981–2018), primarily due to the shift from farmland to forest. These features were consistent with the trends of primary industries and the history of land use in Omishima Island (Section 2.1). Notably, such shifts to forest and conversion to farmland occurred widely on slopes of 0°–45° at elevations of 0–300 m (Figure 9), spanning from gentle, low-elevation slopes (<30° gradient and <100 m) dominated by remaining farmland to steep, high-elevation slopes (≥30° gradient and ≥100 m) composed primarily of remaining forest.

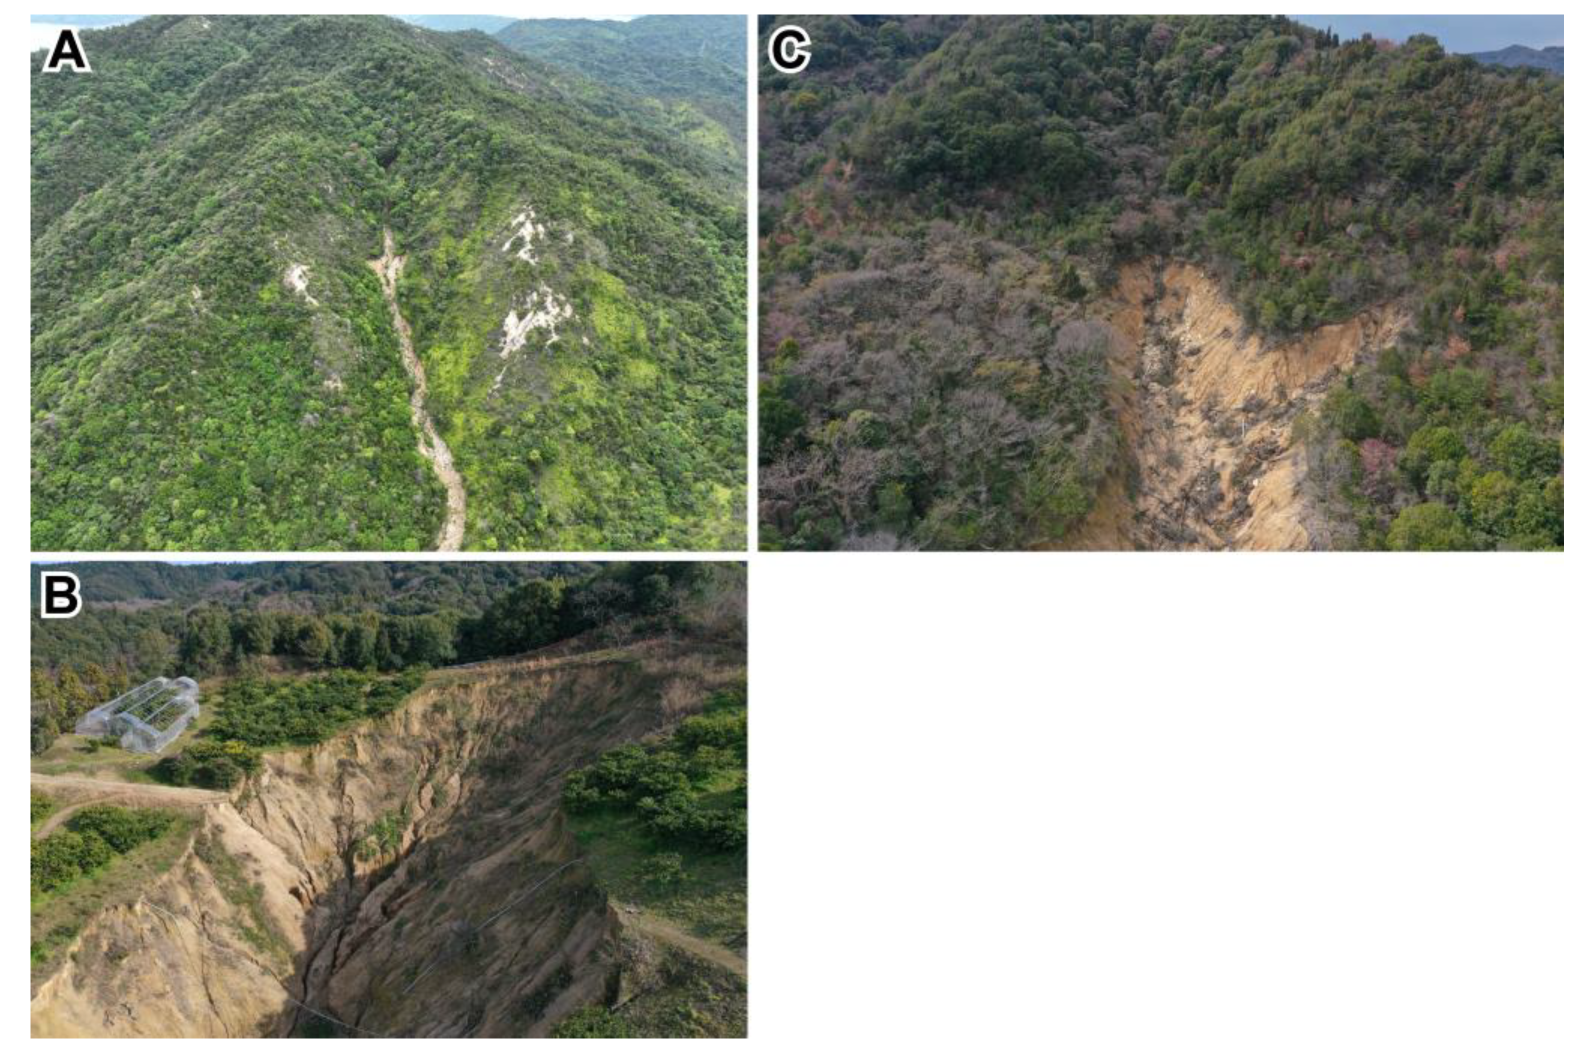
4.2. Landslide Characteristics in the July 2018 Storm Event

We identified 512 new landslides across Omishima Island (Figure 5F). Most of these were shallow translational landslides of the topsoil layer, although deeply incised gullies developed due to surface erosion after the landslide occurred in some cases [40,41]. Figure 10 shows some typical landslides observed after the July 2018 storm event. The size of the landslide scars ranged from 6 to 9279 m2 (mean ± SD: 267 ± 718 m2, median: 121 m2), with a total area of 0.137 km2. Based on these results, the landslide density and area ratio were estimated to be 7.588 slides km−2 and 0.202%, respectively, for the whole island.

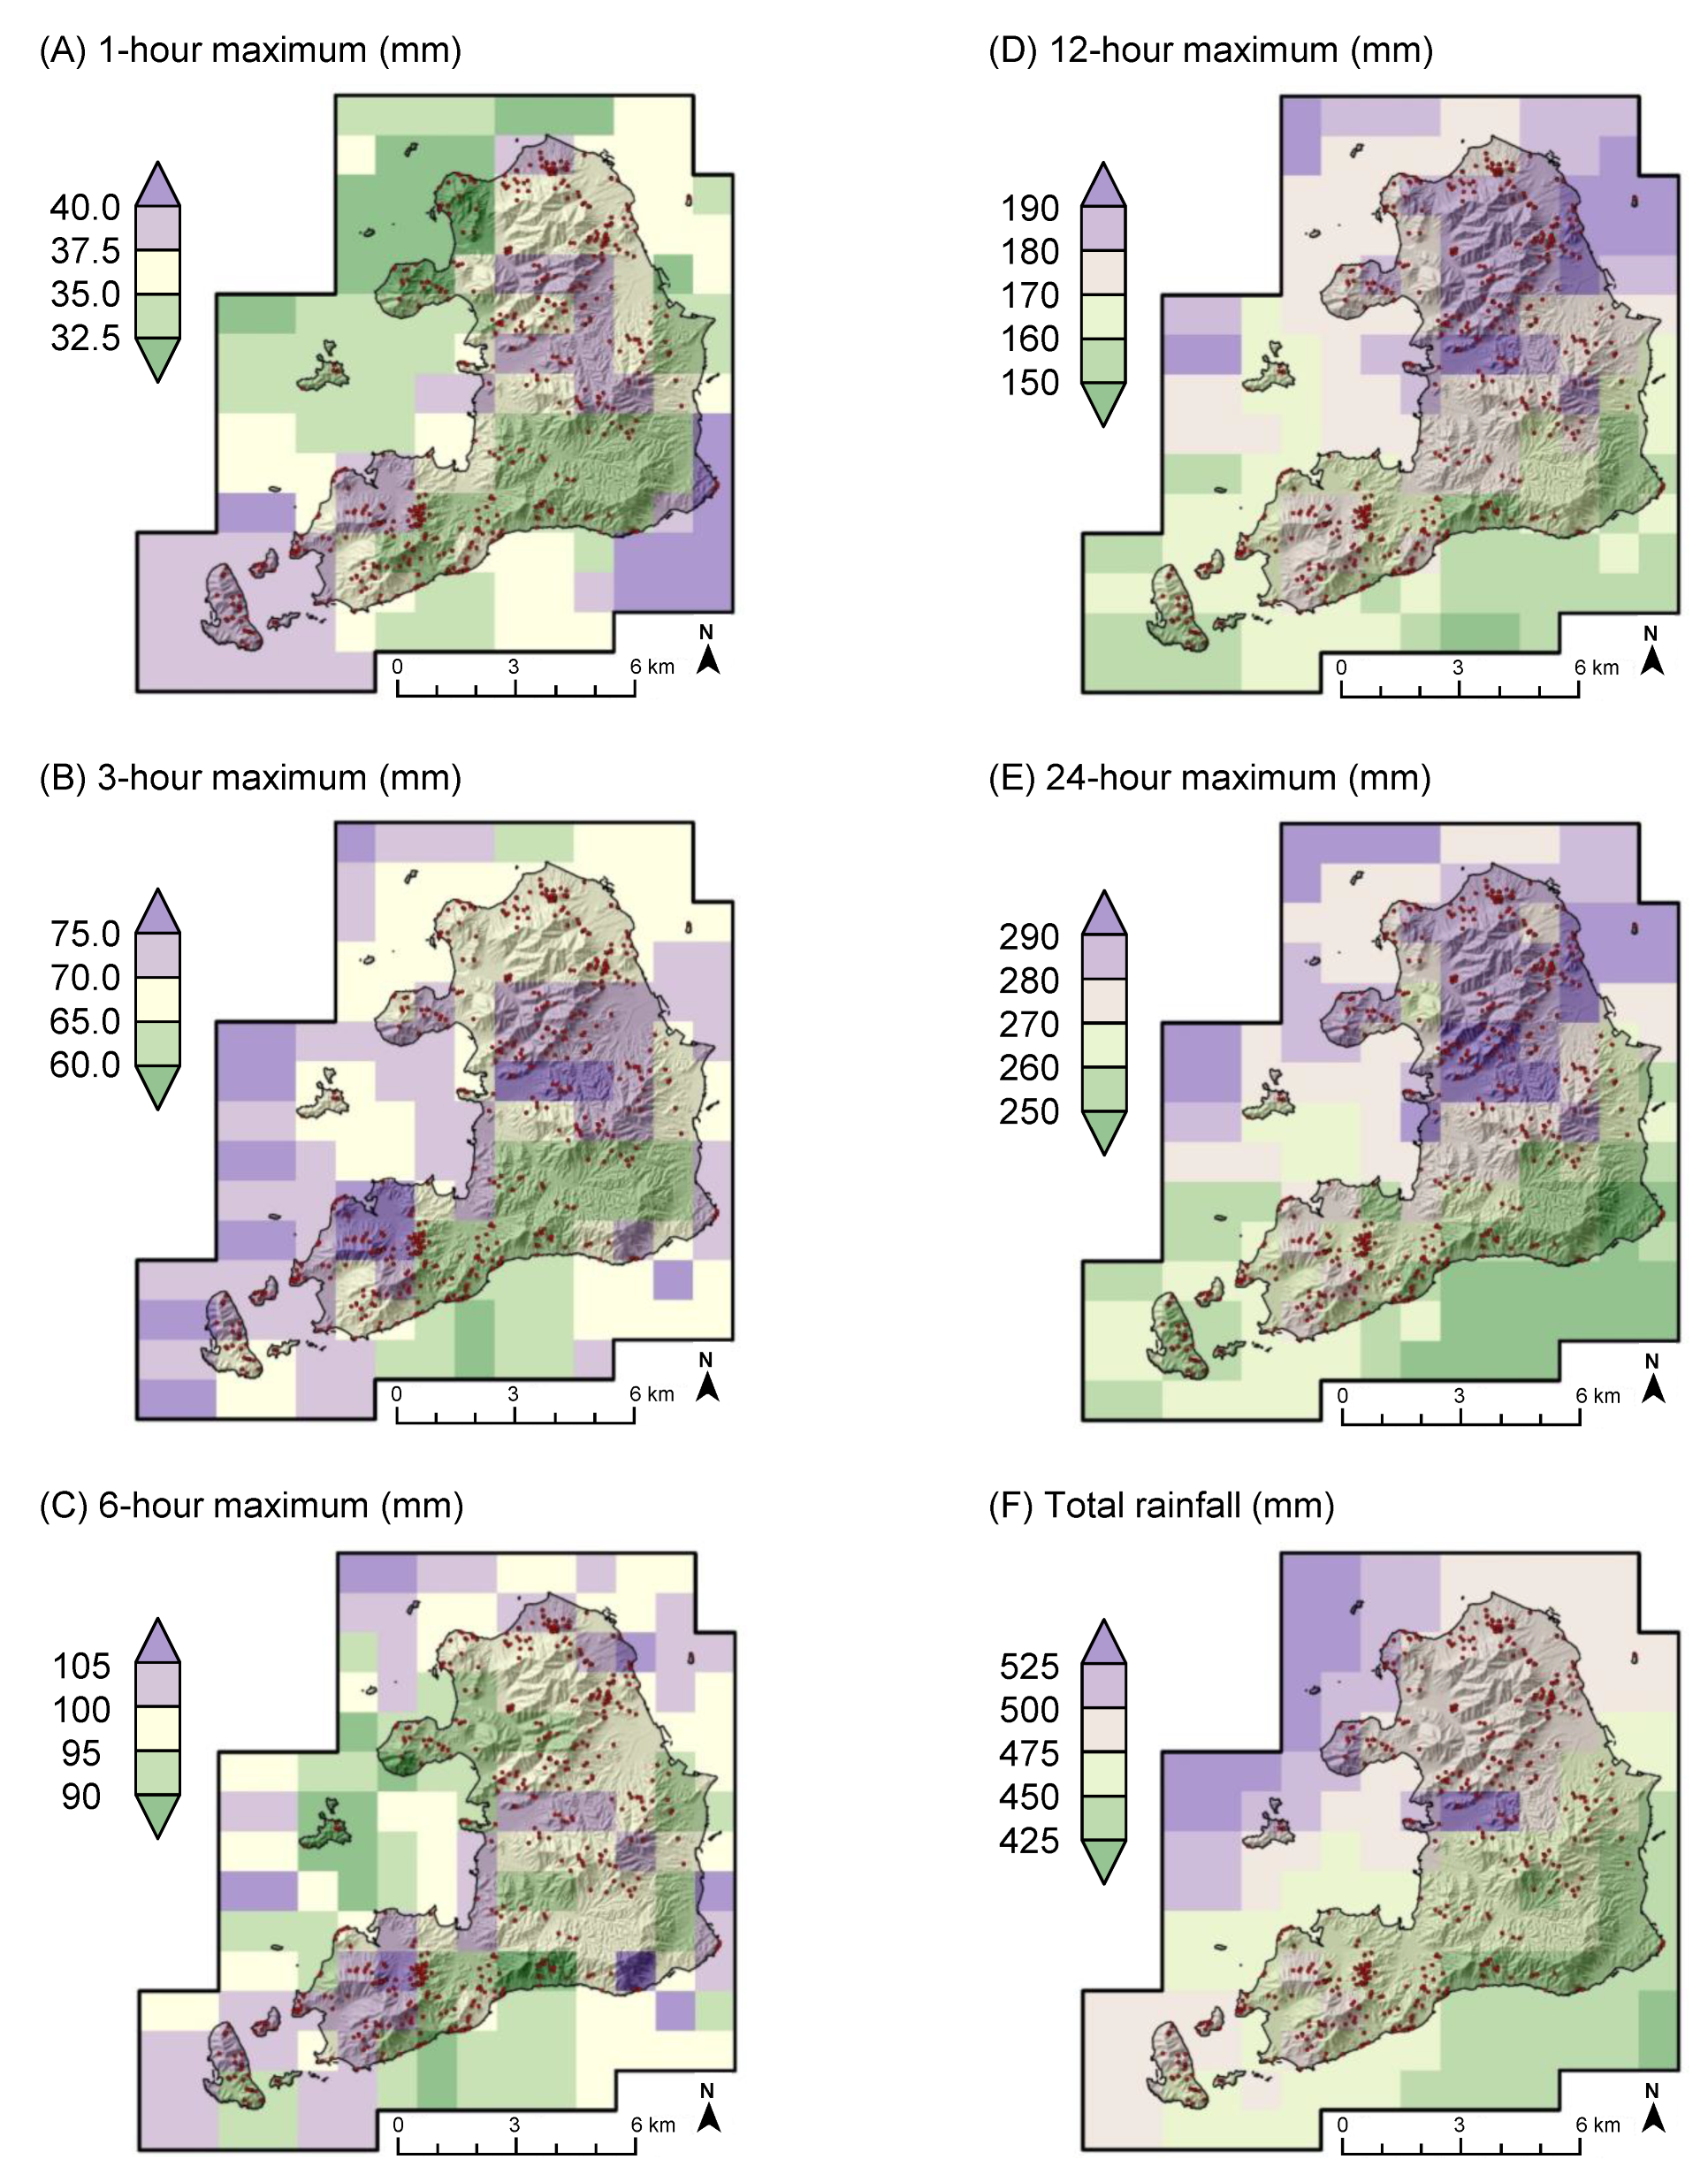
4.3. Rainfall Distributions and Landslide Characteristics in the July 2018 Storm Event

The Omishima Observatory (Figure 1B) recorded maximum rainfall amounts of 31.0 mm for 1 h, 69.5 mm for 3 h, 90.0 mm for 6 h, 146.0 mm for 12 h, and 249.5 mm for 24 h during the storm. The total rainfall reached 446.5 mm. However, not all of these values were the highest in the precipitation record for this observatory (Figure 2). Based on the GEV distributions obtained from the 47-year observation record (Table 2), the return period for rainfall during the July 2018 storm was estimated to be 4.3 years for 1-h rainfall, 25.8 years for 3-h rainfall, 15.4 years for 6-h rainfall, 49.8 years for 12-h rainfall, and 88.3 years for 24-h rainfall; if the total rain during the storm was considered as 264-h (11-day) rainfall, then its return period is estimated to be 24.1 years (Table 3). The apparent difference in return period between the 1- to 6-h rainfall and the 12- to 24-h rainfall indicated that long-term precipitation was particularly heavy during the storm.
Figure 11 shows the 1-km grid maximum rainfall distributions generated from RRAP data. The 174 grid cells overlapping with Omishima Island showed that the event maximum was 29–44 mm for 1-h rainfall, 60–80 mm for 3-h rainfall, 89–108 mm for 6-h rainfall, 147–198 mm for 12-h rainfall, and 231–304 mm for 24-h rainfall, corresponding to up to 1.4 times the amount of rainfall at the observatory. The event total rainfall ranged from 415 to 552 mm, or 0.9–1.2 times the amount at the observatory. Nevertheless, as shown in Figure 12, there were no clear increasing trends in landslide density or area ratio in areas with heavier rainfall.
The lack of spatial correspondence between rainfall and landslide occurrence may have been due to the difference in spatial variation between short-term (≤6 h) and long-term (12 and 24 h) precipitation. We applied the obtained GEV distributions to RRAP data and estimated the return period for each 1-km grid cell (Table 3) and found that the 12-h and 24-h rainfall exceeded the 1-in-50-year precipitation across the island (return periods of 52.0–399.2 years), although the return periods for ≤6 h and the event total rainfall varied widely within the island (3.3–315.8 years). As a result of heavy long-term precipitation across the island, topsoil layers on slopes likely became saturated, reaching a critical state where shallow landslides could occur regardless of the shorter term rainfall intensity. The rainfall analysis results also suggested that predisposing factors on individual slopes, such as geological and geomorphological features, hydrological and engineering properties of soils, as well as the underlying bedrock and influences of vegetation, e.g., [3], affected landslide distribution more strongly than rainfall spatial variation.

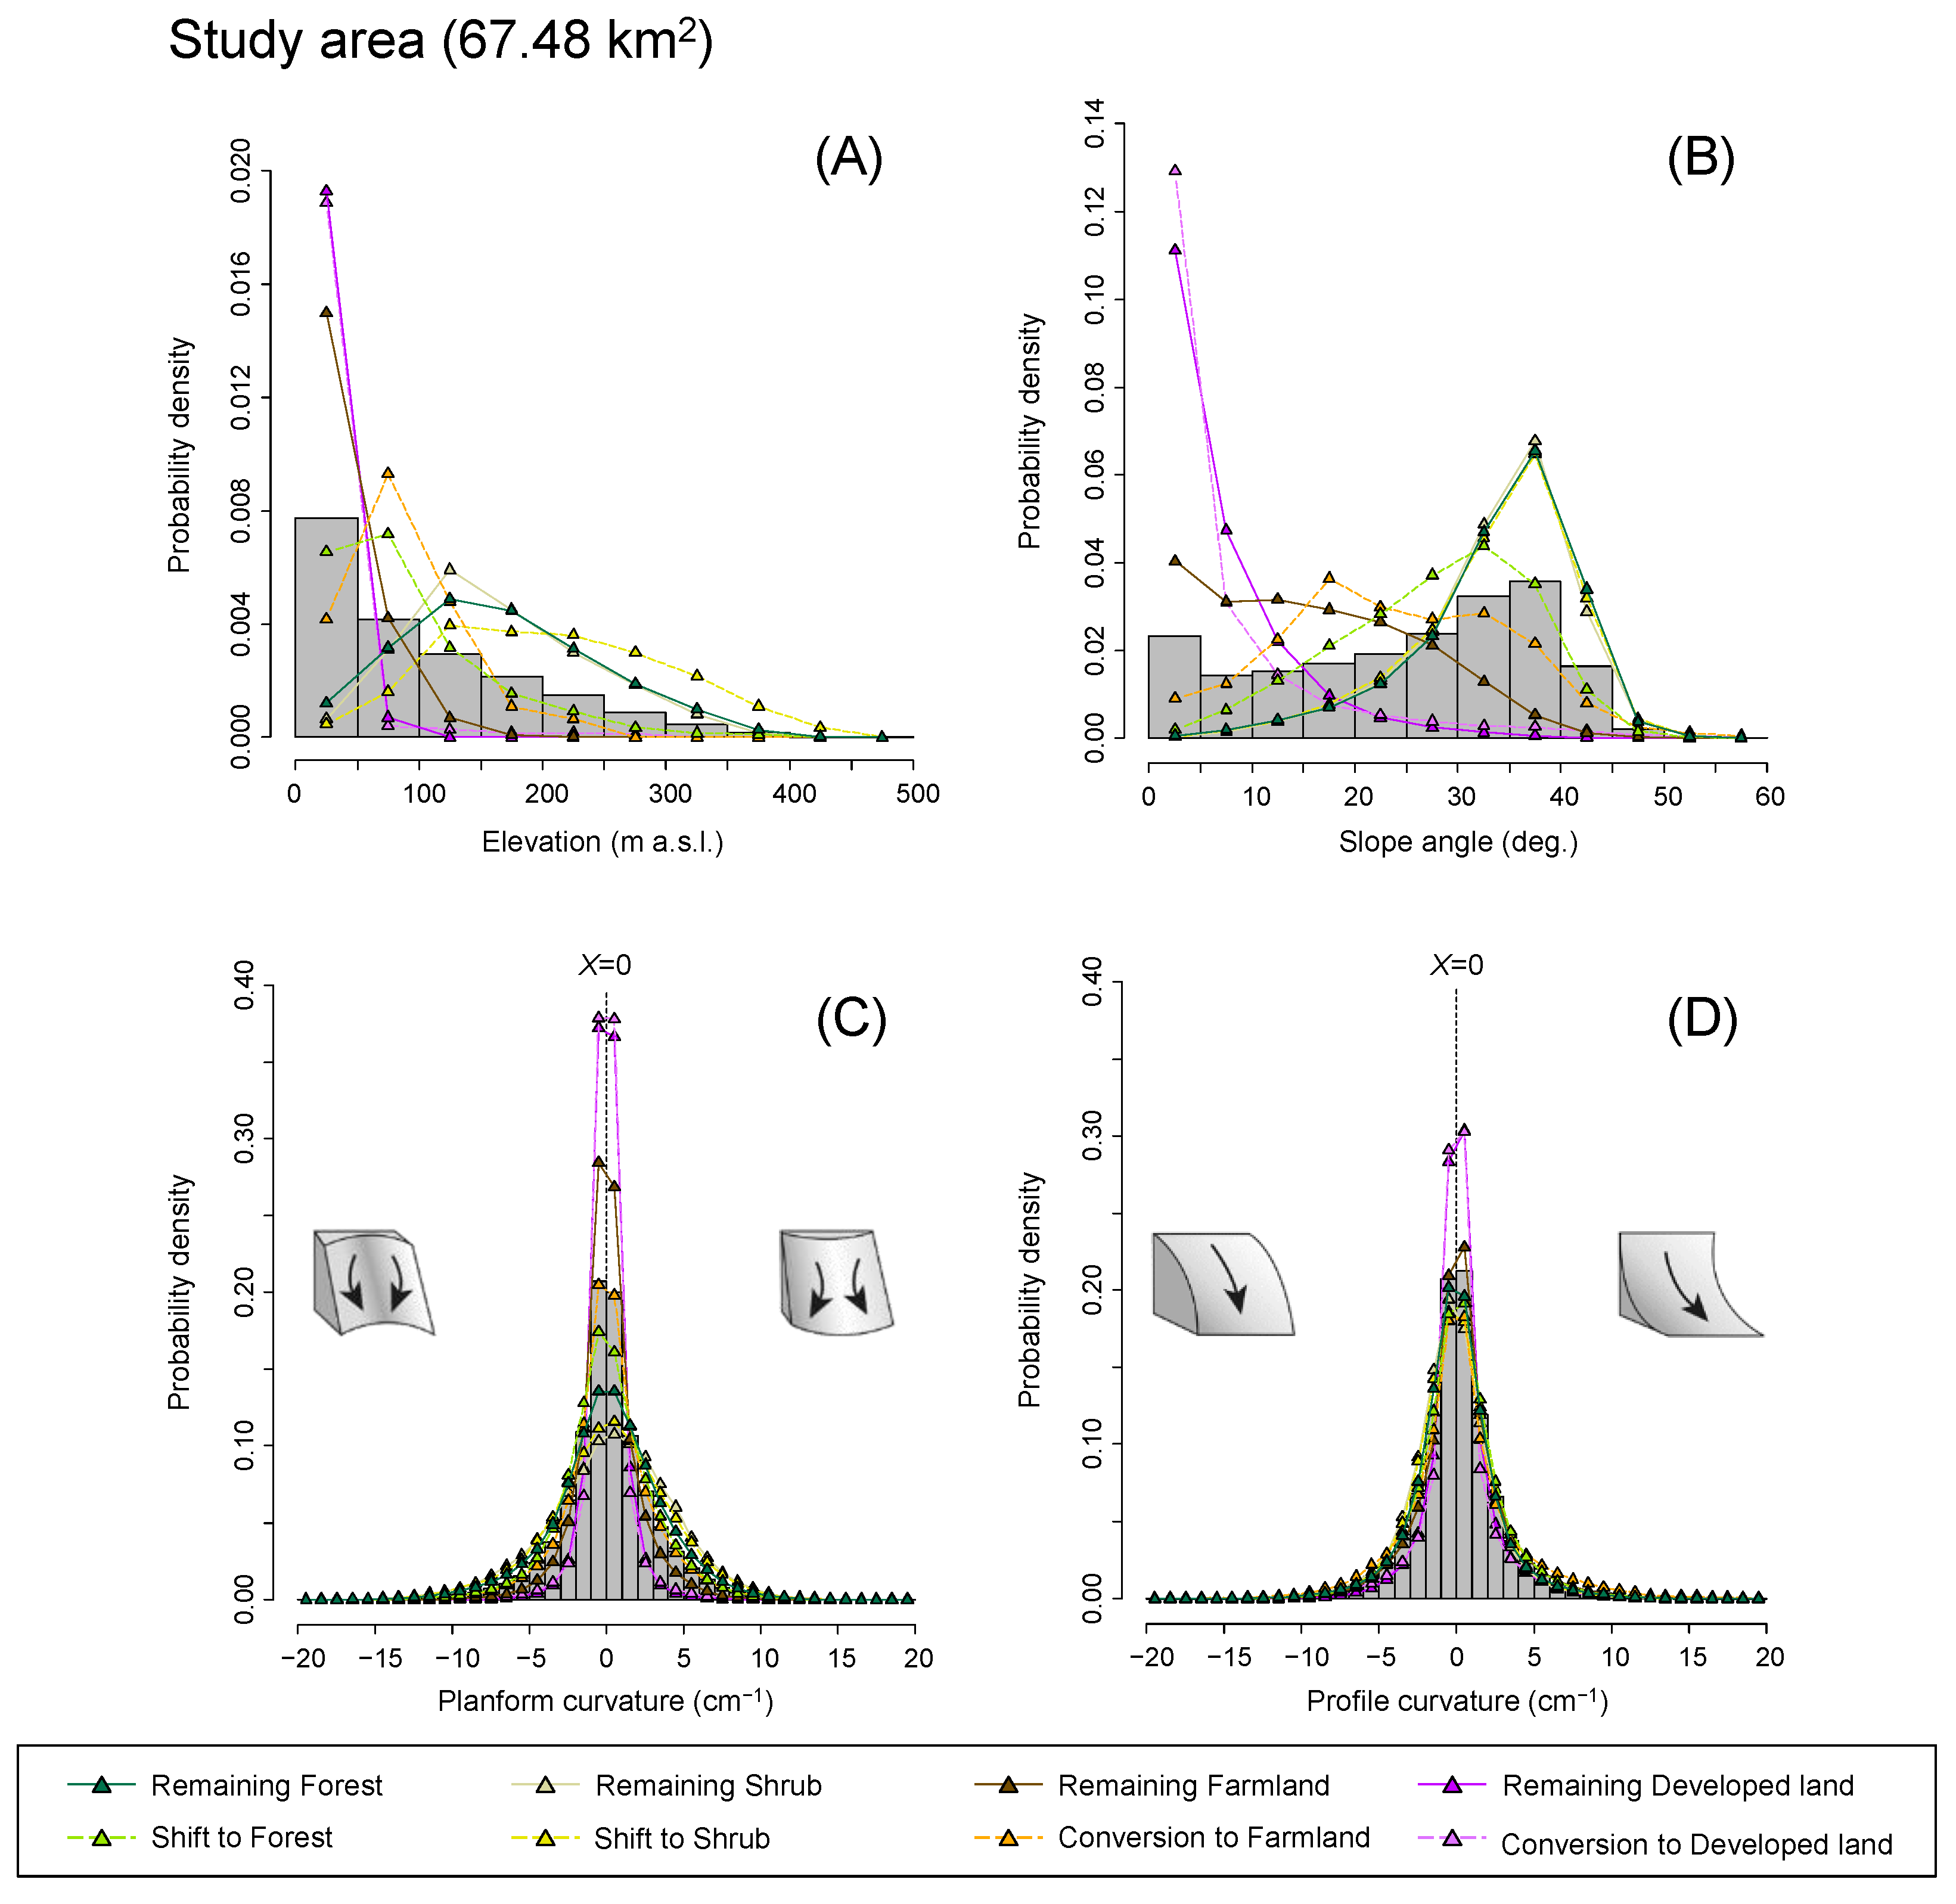
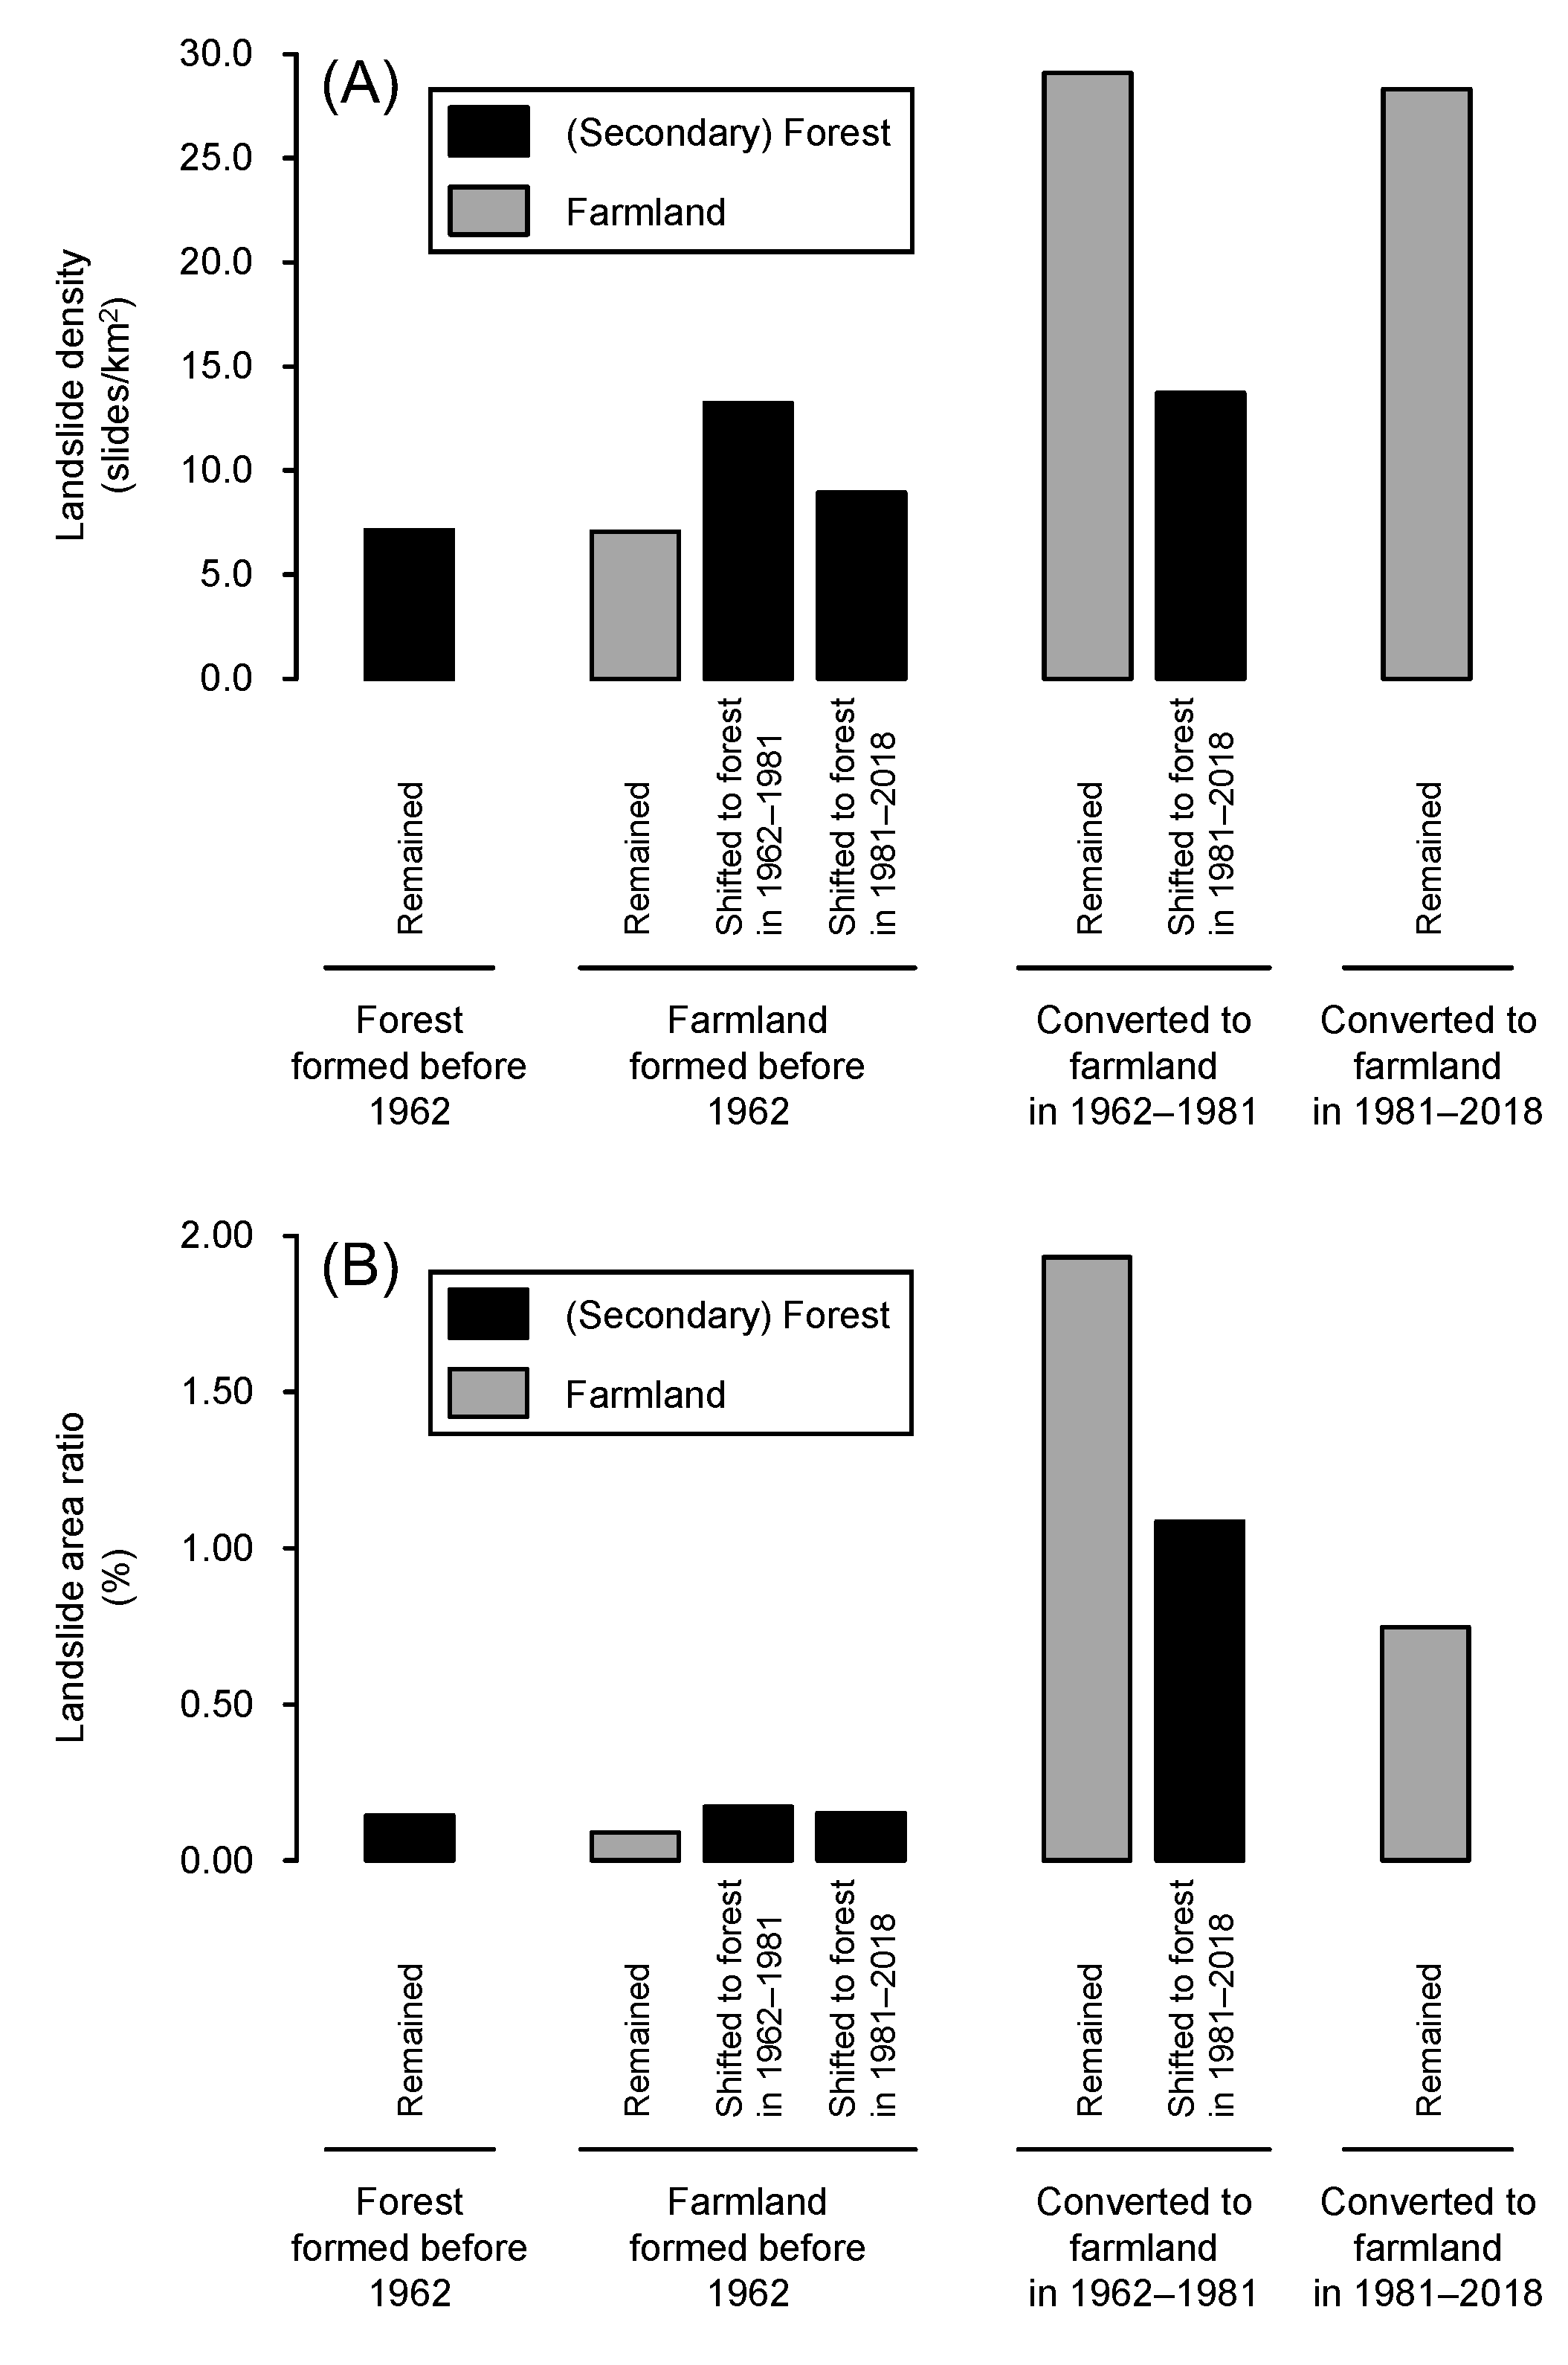
4.4. Relationship between Land Cover Trajectory and Landslide Occurrence

Landslide characteristics for each land cover trajectory pattern are summarised in Table 4. According to the current land cover types, both the landslide density and area ratio were the highest for farmland (9.596 slides km−2 and 0.259%), followed by forest (7.868 slides km−2 and 0.208%) and shrub (6.574 slides km−2 and 0.176%). Comparing the landslide populations for each land cover trajectory pattern, the density and area ratio were highest in areas converted to farmland after 1962 (CFAR: 28.827 slides km−2 and 1.551%). The next highest concentration of landslides was observed in areas shifted to forest after 1962 (SFOR: 9.220 slides km−2 and 0.335%), although the density and area ratio were only approximately one third and one fifth of those in the newly developed farmland (CFAR), respectively.
Comparing the landslide scar area for each land cover trajectory pattern, larger landslides were observed where land cover changed after 1962 (Table 4). Landslides in the areas converted to farmland (CFAR) ranged up to 6034 m2 (mean ± SD: 538 ± 1142 m2, median: 151 m2), whereas those in the remaining farmland (RFAR) ranged up to 825 m2 (mean ± SD: 125 ± 126 m2, median: 85 m2). Similarly, landslides in the areas shifted to forest (SFOR) ranged up to 9279 m2 (mean ± SD: 363 ± 1121 m2, median: 115 m2), whereas those in the remaining forest (RFOR) ranged up to 1811 m2 (mean ± SD: 194 ± 211 m2, median: 138 m2). The average landslide in the newly developed farmland (CFAR) was 4.3 times larger than in the remaining farmland (RFAR), and that in the secondary forest (SFOR) was 1.9 times larger than in the remaining forest (RFOR).
Figure 13 shows the probability density distributions of topographic conditions for the landslides triggered by the July 2018 storm event. We calculated the average values of elevation, slope angle, and planform and profile curvatures at each landslide scar, and analysed their probability distributions for each land cover trajectory pattern. The average elevation and average slope angle of the landslides (Figure 13A,B) reflected the spatial distributions of forest and farmland where most landslides occurred. Landslides in secondary forest (SFOR) were found more frequently on gentler slopes (<30°) at lower elevations (<100 m) than in the remaining forest (RFOR). Conversely, landslides in newly developed farmland (CFAR) were often located on steeper slopes (≥30°) at higher elevations (≥100 m) than those in the remaining farmland (RFAR). Unlike the topographic features of the study area (Figure 9), the average planform curvature was negatively biased, and the average profile curvature was positively biased on the landslide slopes, regardless of the land cover trajectories (Figure 13C,D). These observations suggest that landslides occurred more frequently on concave and convergent slopes, likely due to the surface and subsurface water flow concentration, increasing pore water pressure during heavy precipitation [3,44,45].
Landslides in the July 2018 storm event occurred more densely on slopes where land cover changed after 1962; the size of landslides also increased, especially in secondary forest and newly developed farmland (SFOR and CFAR) (Table 4). As the main land cover changes between 1962 and 2018 were the shift of farmland to forest and the conversion of forest to farmland (Figure 6 and Figure 7) and the farmland on slopes primarily comprised citrus orchards (Figure 1D), orchard development after 1962 likely caused significant slope destabilisation, resulting in many large-scale landslides during the recent storm event. Possible reasons for slope destabilisation due to orchard development include reduced influence of vegetation on hydrogeomorphological processes by clearing former forest vegetation and impacts of alterations to the topography, foundation, and hydrological properties through new land creation. Although trees can increase slope stability by removing soil moisture through evapotranspiration and providing root cohesion to the soil layer [3,4], their effectiveness is highly dependent on tree species, size, and density [21,22,23], which determine root system expansion and canopy development. Therefore, fruit trees in orchards may have only a limited slope stabilising effect due to their small size and low planting density. Lusiana and Shinohara [19] analysed the spatial distribution and causal factors of landslide occurrences during the July 2018 storm event in a hilly area of western Japan (ca. 110 km southwest of our study area); they showed that the landslide density became higher in citrus orchards than in surrounding forests. Previous studies also reported higher landslide densities in orchard fields compared to forests [17,18,20]. Our study provided additional evidence that orchard fruit trees are less effective in stabilising slopes. Meanwhile, landform modifications, such as building roads and cutting and filling slopes, often caused landslides [3,7,8,46]. Our previous studies observed several large-scale landslides on abandoned orchard fields created by filling head hollows in upstream areas [40,41], which led to unstable sediment emplacements in water-rich environments. In Omishima Island, traditional terraced fields on slopes were created manually without making large-scale changes to the land; in contrast, orchard development since the 1960s involved building new roads and expanding areas using heavy machinery [28]. Therefore, developing new orchard fields since the 1960s may have increased the size of the landslides. However, further investigation and geotechnical studies are required to clarify how land modification caused the increase in landslide severity.
The influence of forestation due to the abandonment of orchards may have increased slope stability compared to the previous farmlands. To test this hypothesis, we analysed differences in landslide occurrence between forest and farmland by subdividing according to age and former land cover trajectory (Figure 14). Comparing the slopes of farmland developed in 1962–1981, the landslide density and area ratio were significantly lower on the forested slopes than on the slopes that remained as farmland after development; both decreased to nearly half or less (landslide density: 29.081 and 13.734 slides km−2, landslide area ratio: 1.932 and 1.086%). The difference between the two likely reflects how much the forestation after 1981 increased the slope stability of the abandoned farmlands. The analysis also showed that areas converted to farmland after 1962 had much greater landslide densities and area ratios than forests and farmland that formed before 1962, even if the area had already shifted to forest. These results suggested that the effects of reduced slope stability due to farmland development between 1962 and 1981 remained for at least 37 years (until the July 2018 storm event), as illustrated schematically in Figure 15. In managed plantation forests, slope stability reduced by logging has been shown to recover within 25 years as replanted trees grow while the roots of felled trees decay [5,10,24,25]. Therefore, the impacts of forest conversion to farmland on landslides may be longer-lasting than forest harvesting, as suggested previously by studies in areas where shifting (slash-and-burn) cultivation has been practised [3,12]. As the recovery of slope stability in converted farmland depends primarily on the progress of forest regeneration after abandonment, stabilising effectiveness should be investigated for various vegetation conditions (tree species composition, size, and density), considering differences in vegetation succession patterns and forest development stages.

5. Conclusions

In this study, we explored the 56-year (1962–2018) land cover evolution on Omishima Island, and examined the spatial relations of landslides triggered by the July 2018 storm event with rainfall, land cover trajectories, and topography. We generated land cover maps of the island for three periods (1962, 1981, and 2018) based on aerial photographs. The reconstructed land cover trajectories from these maps revealed that forest area decreased over the initial 19 years (1962–1981), primarily due to conversion into farmland (citrus orchard). The forest area increased while the farmland area decreased over the subsequent 37 years (1981–2018), mainly due to farmland reverting to forest. These land cover changes occurred widely, spanning from gentle slopes at low elevation to steep slopes at high elevation. High-resolution images captured after the storm identified 512 new landslides.
Based on a 47-year precipitation records, we estimated the return periods of 1- to 264-h rainfall during the storm using the GEV distributions. Return periods showed wide variations when the derived GEV distributions were applied to 1-km grid maximum rainfall distributions generated from RRAP data. For short-term precipitation (≤6 h), the return periods varied by 3.3–315.8 years, while they exceeded 50 years (52.0–399.2 years) for long-term precipitation (12 and 24 h) across the island. Despite such pronounced spatial rainfall variations, we did not observe clear correlations between areas of heavier rainfall and increased landslide density or area ratio. In contrast, the land cover trajectories over the past 56 years had a pronounced effect on landslide occurrence. Landslides were more concentrated on slopes that experienced land cover changes after 1962, with the magnitude of the landslides increasing, especially in secondary forests and newly developed farmlands. When comparing slopes of farmland developed between 1962 and 1981, landslide density and area ratio were significantly lower on the slopes that had reverted to forests than on those that remained as farmland. However, the values of the reforested slopes exceeded those of forests and farmlands that remained since before 1962.
Given that the farmland in the study area primarily consisted of citrus orchards, we inferred that orchard development after 1962 likely induced significant slope destabilisation. Citrus trees in orchards may have only a limited slope stabilising effect, whereas land modifications to develop new orchard fields also contributed to landslides. Our geospatial analysis further revealed that even if the fields had shifted to forests, the effects of reduced slope stability due to orchard development had remained for at least 37 years. However, due to limited information on slope conditions, it is currently impossible to quantitatively compare slope stability between the newly developed orchards and other lands. Therefore, further investigations are required to determine the stabilising and destabilising factors on slopes with different land cover trajectories. In particular, understanding the relations of stabilising effectiveness with various vegetation conditions will help to predict how long the impacts of past land cover changes will remain on slopes. This will be essential for future appropriate land management and disaster countermeasures in many mountainous regions where human activities have undergone significant changes.

Author Contributions

Conceptualization, T.K. and G.S.; methodology, T.K.; formal analysis, T.K.; investigation, T.K., G.S., T.O., N.V.T. and A.W.; data curation, T.K.; writing—original draft preparation, T.K.; writing—review and editing, G.S., T.O., N.V.T. and A.W.; visualization, T.K.; project administration, A.W. and G.S.; funding acquisition, A.W., G.S. and T.K. All authors have read and agreed to the published version of the manuscript.

Funding

This research was funded by Japan Science and Technology Agency (JST) e-ASIA Joint Research Program (Grant Number JPMJSC18E3), the Japan Society for the Promotion of Science (JSPS, KAKENHI Grant Number JP21H01584), and the Japan Geographic Data Center (JGDC, 20th Research Grant “Elucidation of factors causing landslides in the July 2018 storm event based on land use changes since Showa period: a case study on islands in Ehime Prefecture”).

Data Availability Statement

The data that support the findings of this study are available from the corresponding author, T.K., upon reasonable request.

Acknowledgments

The authors thank the Forestry Agency of the Ministry of Agriculture, Forestry and Fisheries (MAFF) for providing the airborne LiDAR data used in this study.

Conflicts of Interest

The authors declare no conflict of interest.

References

  1. Lambin, E.F.; Turner, B.L.; Geist, H.J.; Agbola, S.B.; Angelsen, A.; Bruce, J.W.; Coomes, O.T.; Dirzo, R.; Fischer, G.; Folke, C.; et al. The causes of land-use and land-cover change: Moving beyond the myths. Glob. Environ. Chang. 2001, 11, 261–269. [Google Scholar] [CrossRef]
  2. Rindfuss, R.R.; Walsh, S.J.; Turner, B.L.; Fox, J.; Mishra, V. Developing a science of land change: Challenges and methodological issues. Proc. Natl. Acad. Sci. USA 2004, 101, 13976–13981. [Google Scholar] [CrossRef]
  3. Sidle, R.C.; Ochiai, H. Landslides: Processes, Prediction, and Land Use, Water Resources Monograph 18; American Geophysical Union: Washington, DC, USA, 2006; 312p. [Google Scholar]
  4. Stokes, A.; Douglas, G.B.; Fourcaud, T.; Giadrossich, F.; Gillies, C.; Hubble, T.; Kim, J.H.; Loades, K.W.; Mao, Z.; McIvor, I.R.; et al. Ecological mitigation of hillslope instability: Ten key issues facing researchers and practitioners. Plant Soil 2014, 377, 1–23. [Google Scholar] [CrossRef]
  5. Sidle, R.C. A theoretical model of the effects of timber harvesting on slope stability. Water Resour. Res. 1992, 28, 1897–1910. [Google Scholar] [CrossRef]
  6. Jakob, M. The impacts of logging on landslide activity at Clayoquot Sound, British Columbia. Catena 2000, 38, 279–300. [Google Scholar] [CrossRef]
  7. Guthrie, R.H. The effects of logging on frequency and distribution of landslides in three watersheds on Vancouver Island, British Columbia. Geomorphology 2002, 43, 273–292. [Google Scholar] [CrossRef]
  8. Brardinoni, F.; Hassan, M.A.; Slaymaker, H.O. Complex mass wasting response of drainage basins to forest management in coastal British Columbia. Geomorphology 2003, 49, 109–124. [Google Scholar] [CrossRef]
  9. Montgomery, D.R.; Schmidt, K.M.; Greenberg, H.M.; Dietrich, W.E. Forest clearing and regional landsliding. Geology 2000, 28, 311–314. [Google Scholar] [CrossRef]
  10. Imaizumi, F.; Sidle, R.C.; Kamei, R. Effects of forest harvesting on the occurrence of landslides and debris flows in steep terrain of central Japan. Earth Surf. Process. Landf. 2008, 33, 827–840. [Google Scholar] [CrossRef]
  11. Saito, H.; Murakami, W.; Daimaru, H.; Oguchi, T. Effect of forest clear-cutting on landslide occurrences: Analysis of rainfall thresholds at Mt. Ichifusa, Japan. Geomorphology 2017, 276, 1–7. [Google Scholar] [CrossRef]
  12. Sidle, R.C.; Ziegler, A.D.; Negishi, J.N.; Nik, A.R.; Siew, R.; Turkelboom, F. Erosion processes in steep terrain—Truths, myths, and uncertainties related to forest management in Southeast Asia. For. Ecol. Manag. 2006, 224, 199–225. [Google Scholar] [CrossRef]
  13. Grade, T. Landslide occurrence as a response to land use change: A review of evidence from New Zealand. Catena 2003, 51, 297–314. [Google Scholar] [CrossRef]
  14. Alcántara-Ayala, I.; Esteban-Chávez, O.; Parrot, J.F. Landsliding related to land-cover change: A diachronic analysis of hillslope instability distribution in the Sierra Norte, Puebla, Mexico. Catena 2006, 65, 152–165. [Google Scholar] [CrossRef]
  15. García-Ruiz, J.M.; Beguería, S.; Alatorre, L.C.; Puigdefábregas, J. Land cover changes and shallow landsliding in the flysch sector of the Spanish Pyrenees. Geomorphology 2010, 124, 250–259. [Google Scholar] [CrossRef]
  16. Guns, M.; Vanacker, V. Forest cover change trajectories and their impact on landslide occurrence in the tropical Andes. Environ. Earth Sci. 2013, 70, 2941–2952. [Google Scholar] [CrossRef]
  17. Constantin, M.; Bednarik, M.; Jurchescu, M.C.; Vlaicu, M. Landslide susceptibility assessment using the bivariate statistical analysis and the index of entropy in the Sibiciu Basin (Romania). Environ. Earth Sci. 2011, 63, 397–406. [Google Scholar] [CrossRef]
  18. Mousavi, S.Z.; Kavian, A.; Soleimani, K.; Mousavi, S.R.; Shirzadi, A. GIS-based spatial prediction of landslide susceptibility using logistic regression model. Geomat. Nat. Hazards Risk 2011, 2, 33–50. [Google Scholar] [CrossRef]
  19. Lusiana, N.; Shinohara, Y. The role of citrus groves in rainfall-triggered landslide hazards in Uwajima, Japan. Water 2022, 14, 2113. [Google Scholar] [CrossRef]
  20. Arrasyid, R.; Ihsan, H.M.; Ruhimat, M.; Pratama, A.R. Suitability evaluation of land use/land cover (LULC) towards landslide prone areas in structural and volcano landform. Int. J. Geoinform. 2023, 19, 61–75. [Google Scholar] [CrossRef]
  21. Roering, J.J.; Schmidt, K.M.; Stock, J.D.; Dietrich, W.E.; Montgomery, D.R. Shallow landsliding, root reinforcement, and the spatial distribution of trees in the Oregon Coast Range. Can. Geotech. J. 2003, 40, 237–253. [Google Scholar] [CrossRef]
  22. Schwarz, M.; Lehmann, P.; Or, D. Quantifying lateral root reinforcement in steep slopes—From a bundle of roots to tree stands. Earth Surf. Process. Landf. 2010, 35, 354–367. [Google Scholar] [CrossRef]
  23. Mao, Z.; Saint-André, L.; Bourrier, F.; Stokes, A.; Cordonnier, T. Modelling and predicting the spatial distribution of tree root density in heterogeneous forest ecosystems. Ann. Bot. 2015, 116, 261–277. [Google Scholar] [CrossRef] [PubMed]
  24. Kitamura, K.; Nanba, S. The function of tree roots upon landslide prevention presumed through the uprooting test. Bull. For. For. Prod. Res. Inst. 1981, 313, 175–208. [Google Scholar]
  25. Tsukamoto, Y. Evaluation of the effect of tree roots on slope stability. Bull. Exp. For. Tokyo Univ. Agric. Technol. 1987, 23, 65–124, (In Japanese with English Abstract). [Google Scholar]
  26. Radwan, T.M.; Blackburn, G.A.; Whyatt, J.D.; Atkinson, P.M. Global land cover trajectories and transitions. Sci. Rep. 2021, 11, 12814. [Google Scholar] [CrossRef] [PubMed]
  27. Ministry of Agriculture, Forestry and Fisheries (MAFF). Current Status and Issues of Degraded Farmland. 2023. Available online: https://www.maff.go.jp/j/nousin/tikei/houkiti/attach/pdf/index-16.pdf (accessed on 10 October 2023). (In Japanese)
  28. Ehime Prefectural History Compilation Committee (Ed.) Ehime Prefectural History, Regional Geography II (Western Toyo Region); Ehime Prefecture: Matsuyama, Japan, 1986; 890p. (In Japanese)
  29. Tsubaki, S. Detail of securing manpower in large-scale farming in citrus area: A case study in Ehime Prefecture. Bull. Fac. Agric. Ehime Univ. 2018, 63, 8–15, (In Japanese with English Abstract). [Google Scholar]
  30. Makihara, Y. A method for improving radar estimates of precipitation by comparing data from radars and raingauges. J. Meteorol. Soc. Jpn. Ser. II 1996, 74, 459–480. [Google Scholar] [CrossRef]
  31. Makihara, Y.; Uekiyo, N.; Tabata, A.; Abe, Y. Accuracy of radar-AMeDAS precipitation. IEICE Trans. Commun. 1996, 79, 751–762. [Google Scholar]
  32. Shimpo, A. Radar/Raingauge-Analyzed Precipitation (I). Tenki 2001, 48, 579–583. (In Japanese) [Google Scholar]
  33. Shimpo, A. Radar/Raingauge-Analyzed Precipitation (II). Tenki 2001, 48, 777–784. (In Japanese) [Google Scholar]
  34. Suyari, K.; Iwasaki, M.; Suzuki, T. (Eds.) Regional Geology of Japan, Part 8 Shikoku; Kyoritsu Shuppan Co., Ltd.: Tokyo, Japan, 1991; 266p. (In Japanese) [Google Scholar]
  35. Geological Society of Japan (Ed.) Japanese Regional Geology 7 Shikoku Region; Asakura Publishing Co., Ltd.: Tokyo, Japan, 2016; 679p. (In Japanese) [Google Scholar]
  36. National Research Institute for Earth Science and Disaster Resilience (NIED). Characteristics of Cumulative Rainfall in WESTERN Japan during the Heavy Rain Event of July 2018. 2018. Available online: http://mizu.bosai.go.jp/key/RainJulyH30Accu (accessed on 10 October 2023). (In Japanese)
  37. Japan Meteorological Agency (JMA). Preliminary Report on Characteristics and Causes of Heavy Rains in “July 2018 Heavy Rains” and Their Causes. 2018. Available online: http://www.jma.go.jp/jma/press/1807/13a/gou20180713.pdf (accessed on 10 October 2023). (In Japanese)
  38. Ehime University Disaster Investigation Team of July 2018 Heavy Rain (EUDIT). Report on the Disaster in July 2018 Heavy Rain; Ehime University: Matsuyama, Japan, 2019; 379p. (In Japanese) [Google Scholar]
  39. Mori, S.; Ono, K. Landslide disasters in Ehime Prefecture resulting from the July 2018 heavy rain event in Japan. Soils Found. 2019, 59, 2396–2409. [Google Scholar] [CrossRef]
  40. Kimura, T.; Sato, G. Landslides on slopes of constructed agricultural land in Omishima, Geiyo Islands due to heavy rain in July 2018 and their causal factors. In Proceedings of the Japan Geoscience Union Meeting 2022, HDS09-06, Makuhari, Japan, 22 May 2022. (In Japanese with English Abstract). [Google Scholar]
  41. Kimura, T.; Sato, G.; Ozaki, T.; Thang, N.V.; Wakai, A. Landslide susceptibility in a highly-cultivated hilly region: Artificial slope construction in 1963–1979 and the subsequent 2018 landslide event in Omishima, western Japan. In Natural Geo-Disasters and Resiliency: Select Proceedings of CREST 2023; Hazarika, H., Haigh, S.K., Chaudhary, B., Murai, M., Manandhar, S., Eds.; Springer Nature Singapore Pte Ltd.: Singapore, 2023; in press. [Google Scholar]
  42. Coles, S. An Introduction to Statistical Modeling of Extreme Values; Springer: London, UK, 2001; 208p. [Google Scholar]
  43. Gilleland, E.; Katz, R.W. extRemes 2.0: An Extreme Value Analysis Package in R. J. Stat. Softw. 2016, 72, 1–39. [Google Scholar] [CrossRef]
  44. Montgomery, D.R.; Dietrich, W.E.; Torres, R.; Anderson, S.P.; Heffner, J.T.; Loague, K. Hydrologic response of a steep, unchanneled valley to natural and applied rainfall. Water Resour. Res. 1997, 33, 91–109. [Google Scholar] [CrossRef]
  45. Tsuboyama, Y.; Sidle, R.C.; Noguchi, S.; Murakami, S.; Shimizu, T. A zero-order basin—Its contribution to catchment hydrology and internal hydrological processes. Hydrol. Process. 2000, 14, 387–401. [Google Scholar] [CrossRef]
  46. Rupke, J.; Huisman, M.; Kruse, H.M.G. Stability of man-made slopes. Eng. Geol. 2007, 91, 16–24. [Google Scholar] [CrossRef]
Figure 1. Maps showing (A,B) location, (C) topography, and (D) land cover of Omishima Island in the Setonaikai Sea area, western Japan. (C) shows the distribution of slope angle in 5° increments, calculated using the pre-storm 5-m DTM. Ec1, evergreen coniferous forest type-1 (dominated by Japanese red pine); Ec2, evergreen coniferous forest type-2 (dominated by Japanese black pine); Db, deciduous broad-leaved forest (dominated by oaks); Eb, evergreen broad-leaved forest (dominated by live oaks); Pl, evergreen conifer plantation (composed of cedar and cypress); Lg, logging area; Bl, bare land; Cv, coastal herbaceous vegetation; Or, evergreen citrus orchard; Fi, field; Pf, paddy field; As, abandoned salt field; Ra, residential area; Fa, factory area; Dl, developed land; Wb, water body.
Water 15 04211 g001
Figure 2. Time series of the annual maxima for (A) 1-h, (B) 3-h, (C) 6-h, (D) 12-h, and (E) 24-h rainfall, and (F) annual total rainfall of 1976–2022 recorded at the Omishima Observatory. The red dot in each plot indicates the greatest rainfall in the 47-year record.
Water 15 04211 g002
Figure 3. Examples of optical images showing dominant four land cover types: (Row (A)) forest; (Row (B)) shrub; (Row (C)) farmland; (Row (D)) developed land. The image specifications are summarised in Table 1.
Water 15 04211 g003
Figure 4. Examples of land cover changes typically observed on Omishima Island between 1962 and 2018. Land cover maps on the bottom (Row (B): land cover trajectory) were created based on visual interpretation of the aerial photographs shown on the top (Row (A)).
Water 15 04211 g004
Figure 5. Maps showing (AC) land cover classifications in 1962, 1981, and 2018, (D) integrated patterns of land cover trajectory based on the sequence of land cover changes between 1962 and 2018, (E) the distribution of tree height estimated using airborne LiDAR data, and (F) the landslide distribution in the July 2018 storm event.
Water 15 04211 g005
Figure 6. Temporal changes in areas of land cover types and trajectory patterns. (A) Areas of four land cover types in 1962, 1981, and 2018. (B) Areas of eight land cover trajectory patterns between 1962 and 2018.
Water 15 04211 g006
Figure 7. Diagram of integrated patterns of land cover trajectory based on the sequence of land cover changes between 1962 and 2018.
Water 15 04211 g007
Figure 8. Grid-based distributions of tree height estimated using the post-storm airborne LiDAR data in each land cover trajectory pattern. RFOR, remaining forest; SFOR, shift to forest; RSHR, remaining shrub; SSHR, shift to shrub; RFAR, remaining farmland; CFAR, conversion to farmland; RDVL, remaining developed land; CDVL, conversion to developed land. Each box indicates 1st and 3rd quartiles (lower and upper lines) with median (centre line), while both ends of the whisker indicate the lowest and highest values when excluding outliers (outside 1.5 times the interquartile range above the upper quartile and below the lower quartile).
Water 15 04211 g008
Figure 9. Probability density distributions of (A) elevation (m a.s.l.), (B) slope angle (°), (C) planform curvature (divergent-planar-convergent slope, cm–1), and (D) profile curvature (convex-straight-concave slope, cm–1) for the study area and each land cover trajectory pattern. All topographic conditions were calculated using the pre-storm 5-m DTM.
Water 15 04211 g009
Figure 10. Field views of landslides caused by the heavy rainfall in July 2018. Landslide in (A) semi-natural forest, (B) citrus orchard field, and (C) abandoned field that has shifted to forest. The photographs were taken by T.K. on (A) 5 June 2023 and (B,C) 14 March 2020, respectively.
Water 15 04211 g010
Figure 11. The 1-km grid rainfall distributions in the July 2018 storm event generated from RRAP data for (A) 1-h, (B) 3-h, (C) 6-h, (D) 12-h, and (E) 24-h maximum rainfall and (F) total rainfall in the July 2018 rainfall event (264 h from 28 June to 8 July 2018). Red dots indicate the distribution of rainfall-triggered landslides.
Water 15 04211 g011
Figure 12. Proportion of the areas (AF) and the landslide density and area ratio (GL) for 1-, 3-, 6-, 12-, and 24-h maximum rainfall and total (264-h) rainfall.
Water 15 04211 g012
Figure 13. Probability density distributions of (A) elevation (m a.s.l.), (B) slope angle (°), (C) planform curvature (divergent-planar-convergent slope, cm–1), and (D) profile curvature (convex-straight-concave slope, cm–1) for landslides in the study area and each land cover trajectory pattern. Shrubs and developed lands were omitted from the figure due to the absence or scarcity of landslides. All topographic conditions were calculated using the pre-storm 5-m DTM.
Water 15 04211 g013
Figure 14. Comparison of (A) landslide density and (B) area ratio among the areas with different land cover trajectories. Farmland areas were classified into three types depending on when they were developed (those formed before 1962 or converted to farmland in 1962–1981 or 1981–2018); they were further subdivided depending on whether they had been shifted into forest (those shifted to forest in 1962–1981 or 1981–2018).
Water 15 04211 g014
Figure 15. Schematic diagram of slope stability change dynamics associated with major land cover trajectories. Bold arrows represent significant increases and decreases in slope stability due to the conversion of forest to farmland and the shift of farmland to forest.
Water 15 04211 g015
Table 1. General information of the image data used for land cover and landslide interpretation.
YearDateType *Scale **Acquired by
196231 MayMAP1:10,000Geospatial Information Authority of Japan
197513 Feb.CAP1:8,000Geospatial Information Authority of Japan
198120 Oct.CAP1:10,000Geospatial Information Authority of Japan
201630 Apr.CAP1:10,000Geospatial Information Authority of Japan
201816 Jul.OSI(1.50-m res.)Airbus Defence and Space
201823 Sep.CAPT(0.25-m res.)Forest Agency of Japan
Notes: * Abbreviations: MAP, monochrome air photo; CAP, coloured air photo; OSI, optical satellite image; CAPT, coloured air photo with very fine topographic map. ** Values in parentheses indicate resolutions of the digitalized optical images.
Table 2. Maximum likelihood estimation of the GEV distribution parameters for 1-, 3-, 6-, 12-, 24-, and 264-h (11-day) rainfall based on the 47-year observation record.
RainfallGEV Distribution Parameter *Goodness-of-Fit **
Location, μScale, σShape, ξNLLAICBIC
1-h max.22.53 ± 1.066.41 ± 0.77−0.01 ± 0.11161.21328.41333.96
3-h max.41.46 ± 2.0512.70 ± 1.45−0.25 ± 0.09186.89379.79385.34
6-h max.52.77 ± 2.5115.39 ± 1.78−0.08 ± 0.10200.43406.86412.41
12-h max.65.46 ± 3.1018.24 ± 2.350.06 ± 0.14212.54431.08436.63
24-h max.80.01 ± 3.8222.46 ± 3.110.22 ± 0.14226.21458.42463.97
264-h max.184.36 ± 12.9976.51 ± 9.890.05 ± 0.14279.46564.92570.47
Notes: * Estimated three parameters in the generalized extreme value (GEV) distribution are shown with standard error estimates. ** Abbreviations: NLL, negative log-likelihood value; AIC, Akaike’s information criterion; BIC, Bayesian information criterion.
Table 3. Estimation of rainfall return level and the return period for 1-, 3-, 6-, 12-, 24-, and 264-h (11-day) rainfall based on the GEV distributions.
RainfallReturn Level (mm) *Observatory **RRAP Data **
2-yr20-yr100-yrLowestHighest
1-h max.24.941.251.031.0 mm (4.3 yr)29.0 mm (3.3 yr)44.0 mm (31.6 yr)
3-h max.45.968.076.069.5 mm (25.8 yr)60.0 mm (6.7 yr)80.0 mm (315.8 yr)
6-h max.58.393.3111.790.0 mm (15.4 yr)89.0 mm (14.2 yr)108.0 mm (71.1 yr)
12-h max.72.2125.0162.7146.0 mm (49.8 yr)147.0 mm (52.0 yr)198.0 mm (399.2 yr)
24-h max.88.6173.6257.0249.5 mm (88.3 yr)231.0 mm (64.0 yr)304.0 mm (203.9 yr)
264-h max.212.7429.5580.4446.5 mm (24.1 yr)415.0 mm (17.1 yr)552.0 mm (74.5 yr)
Notes: * Estimated rainfall level (mm) for 2, 20, and 100-year return period. ** Rainfall amounts measured at the JMA Omishima Observatory and estimated from the radar/rain gauge-analysed precipitation (RRAP) data are shown with their return periods in parentheses.
Table 4. Landslide characteristics for the eight land cover trajectory sites based on the July 2018 rainfall event inventory.
Land Cover Landslides Triggered by the July 2018 Storm Event
ClassificationTrajectory *AreaLandslide population **Landslide size characteristics ***
TNTALDARMeanMedianRange
(4 types)(8 patterns)(km2)(slides)(km2)(km–2)(%)(m2)(m2)(m2)
Forest 36.732890.0777.8680.208265 ± 74812513, 9279
RFOR23.611680.0337.1160.138194 ± 21113813, 1811
SFOR13.121210.0449.2200.335363 ± 112111517, 9279
Shrub 3.50230.0066.5740.176267 ± 24020313, 1009
RSHR1.5470.0014.5610.080175 ± 5716485, 290
SSHR1.96160.0058.1470.251308 ± 27523213, 1009
Farmland 20.842000.0549.5960.259270 ± 7111126, 6034
RFAR18.411300.0167.0600.088125 ± 126856, 825
CFAR2.43700.03828.8271.551538 ± 114215116, 6034
Developed land 6.400000------
RDVL2.810000------
CDVL3.590000------
Study area 67.485120.1377.5880.202267 ± 7181216, 9279
Notes: * The following eight trajectory patterns were identified in the land cover changes between 1962 and 2018: RFOR, remaining forest; SFOR, shift to forest; RSHR, remaining shrub; SSHR, shift to shrub; RFAR, remaining farmland; CFAR, conversion to farmland; RDVL, remaining developed land; CDVL, conversion to developed land. ** Abbreviations: TN, total number of landslides; TA, total area of landslide scars; LD, landslide density; AR, area ratio of landslide scars. *** Landslide size characteristics are represented by the mean, median, and range of landslide scar area (m2).
Disclaimer/Publisher’s Note: The statements, opinions and data contained in all publications are solely those of the individual author(s) and contributor(s) and not of MDPI and/or the editor(s). MDPI and/or the editor(s) disclaim responsibility for any injury to people or property resulting from any ideas, methods, instructions or products referred to in the content.

