1. Introduction
The South-to-North Water Transfer Project (SNWTP) is a key national water conservancy project in China as well as an important initiative for China to improve the imbalance in the distribution of regional water resources and to safeguard economic and social development. The three routes together constitute China’s SNWTP, which plays an important role in solving China’s water problems in different regions. According to the State Council’s release, as of 31 March 2023, the cumulative amount of water transferred by the South-to-North Water Diversion East and Central Route Project exceeded 61.2 billion cubic meters. Among them, the first phase of the central line project has transferred a cumulative total water of 55.015 billion m3, the first phase of the eastern line project has transferred a cumulative total water of 5.778 billion m3, and the northern extension of the eastern line emergency water supply project has transferred a cumulative total water of 479 million m3. According to the planning objectives of the Western Route Project, the Western Route Project mainly solves the water shortage problem in Northwest China and basically meets the water demand of the six provinces (districts) in the upper and middle reaches of the Yellow River and the neighboring areas until 2050. Meanwhile, it promotes the governance and development of the Yellow River, promotes river governance in the upper and middle reaches, and supplies water to the lower reaches of the Yellow River to alleviate ecological and environmental problems such as the downstream breakage of the Yellow River. However, it was once shelved due to its special human geography and other reasons. General Secretary Xi Jinping mentioned that the Western Route Project is an important part of the SNWTP Overall Plan approved by the State Council and is a strategic water conservancy project in the country’s ‘Four Horizontal and Three Vertical’ water resources allocation pattern, as well as an important water conservancy project for building the national water network. After 50 years, the western route of the South-to-North Water Diversion Project has been incorporated into the national capital construction program.
The argument about the economic, social, and ecological impacts of the SNWTP on China is ongoing. Fang et al. [
1] found that the SNWTP’s cost effectiveness was at least partially dependent on within-basin water allocation, and the project has an important impact on aggregate welfare. Gao et al. [
2] used the input-output model to analyze the macroeconomic impact of the increased water supply on the recipient areas in the industrial sector. Their empirical results showed that the increased water supply has brought about direct economic benefits for Beijing. Qin et al. [
3] used a static multi-region computable general equilibrium model to research the economic effect of SNWTP. Their findings suggested that the construction of the South-to-North Water Transfer Project will have a positive impact on economic development, household welfare, and environmental sustainability. All these studies have a similar finding, as expected, that the SNWTP will have economic benefits for recipient regions. However, there were some different views about the impact of SNWTP. For example, Moore [
4] pointed out that the project’s economic viability remains controversial. This was echoed in a more recent analysis by Webber et al. [
5], who noted that whether the project was economically justified needed further discussion. More recently, Wilson et al. [
6] pointed out that whether the SNWD project was economically beneficial depends largely on model assumptions. This implies that economic gains at the regional and national level are uncertain. Even though the SNWTP would reduce water scarcity in the North China Plain and economic and agricultural growth could be maintained with additional water from the SNWTP, environmental problems could be greatly ameliorated by this project. At the same time, with the intensification of climate change, water supply and demand are constantly changing [
7,
8].
What exactly is the contribution of the South-to-North Water Transfer Project (SNWTP)? This is a subject of much debate. There are concerns about the possible effects on the macroeconomy. Most previous studies have tried to answer this question. The current research on the SNWTP lacks consideration of the impact of the increase in water supply on different industries in the receiving area, the substitution relationship (S-r) between water sources, the S-r between water and capital, and the total water quantity constraint. In order to answer this question quantitatively, it is necessary to separate the effect of SNWTP from many influencing factors. The CGE model was introduced to this researcher; the dynamic SICGE model is adopted in this paper, and Beijing, one of the main receiving areas of the National Water Resources Allocation Center (NWRAC), is selected as the research area. In order to evaluate the economic impact of the SNWTP on Beijing, this paper extends the SICGE model and introduces the water resource constraint module and the subdivided water resource substitution module to reflect the S-r between various water sources. Based on the SICGE model, an alternative relationship between capital and water is introduced. The baseline simulation time span of this paper is 2012–2020. Two scenarios were set: one with SNWTP and one without SNWTP. The one with the SNWTP scenario was called the baseline scheme, and the one without SNWTP schemes was called the policy scenario. The effect of SNWTP on many influencing factors will be separated by comparative analysis with or without SNWTP. In the policy scenario, this paper implements water supply changes from 2012 and models the economic impact of water supply changes.
2. Modeling Framework and Extension
The CGE model uses a set of equations to describe the supply, demand, and market relations of an economy over a given period of time [
9,
10,
11,
12,
13]. More importantly, to enrich the research, we extended a dynamic CGE model, the SICGE (State Information Centre General Equilibrium model), which is built to simulate China’s water problems [
14,
15]. This model introduces a subdivided water substitution module that reflects the S-r between various sources [
14].
The key problem we faced was how to reflect the operation process of water resources into CGE’s operating mechanism. As we treat water resources as commodities that are used in various household consumption and sectoral production, it is necessary to describe the different water demand characteristics of various sectors. Accordingly, economic sectors by water usage intensity should be distinguished as well. According to the sources of water used in Beijing, we split the water supply sector into four sub-sectors: surface water (SW), groundwater (GW), recycled water (RW), and south-to-north water (SNW). We then add a subdivided water substitution module that reflects the S-r between various sources into the SICGE model. Given the fact that water is a natural resource limited in supply/availability, we added a total water constraints module. Capital in some sectors is equivalent to water resources. For example, various types of water-saving facilities could substitute water resources, so we add a water and capital substitution module that reflects the S-r between water and capital in some sectors.
2.1. Subdivided Water Substitution Module
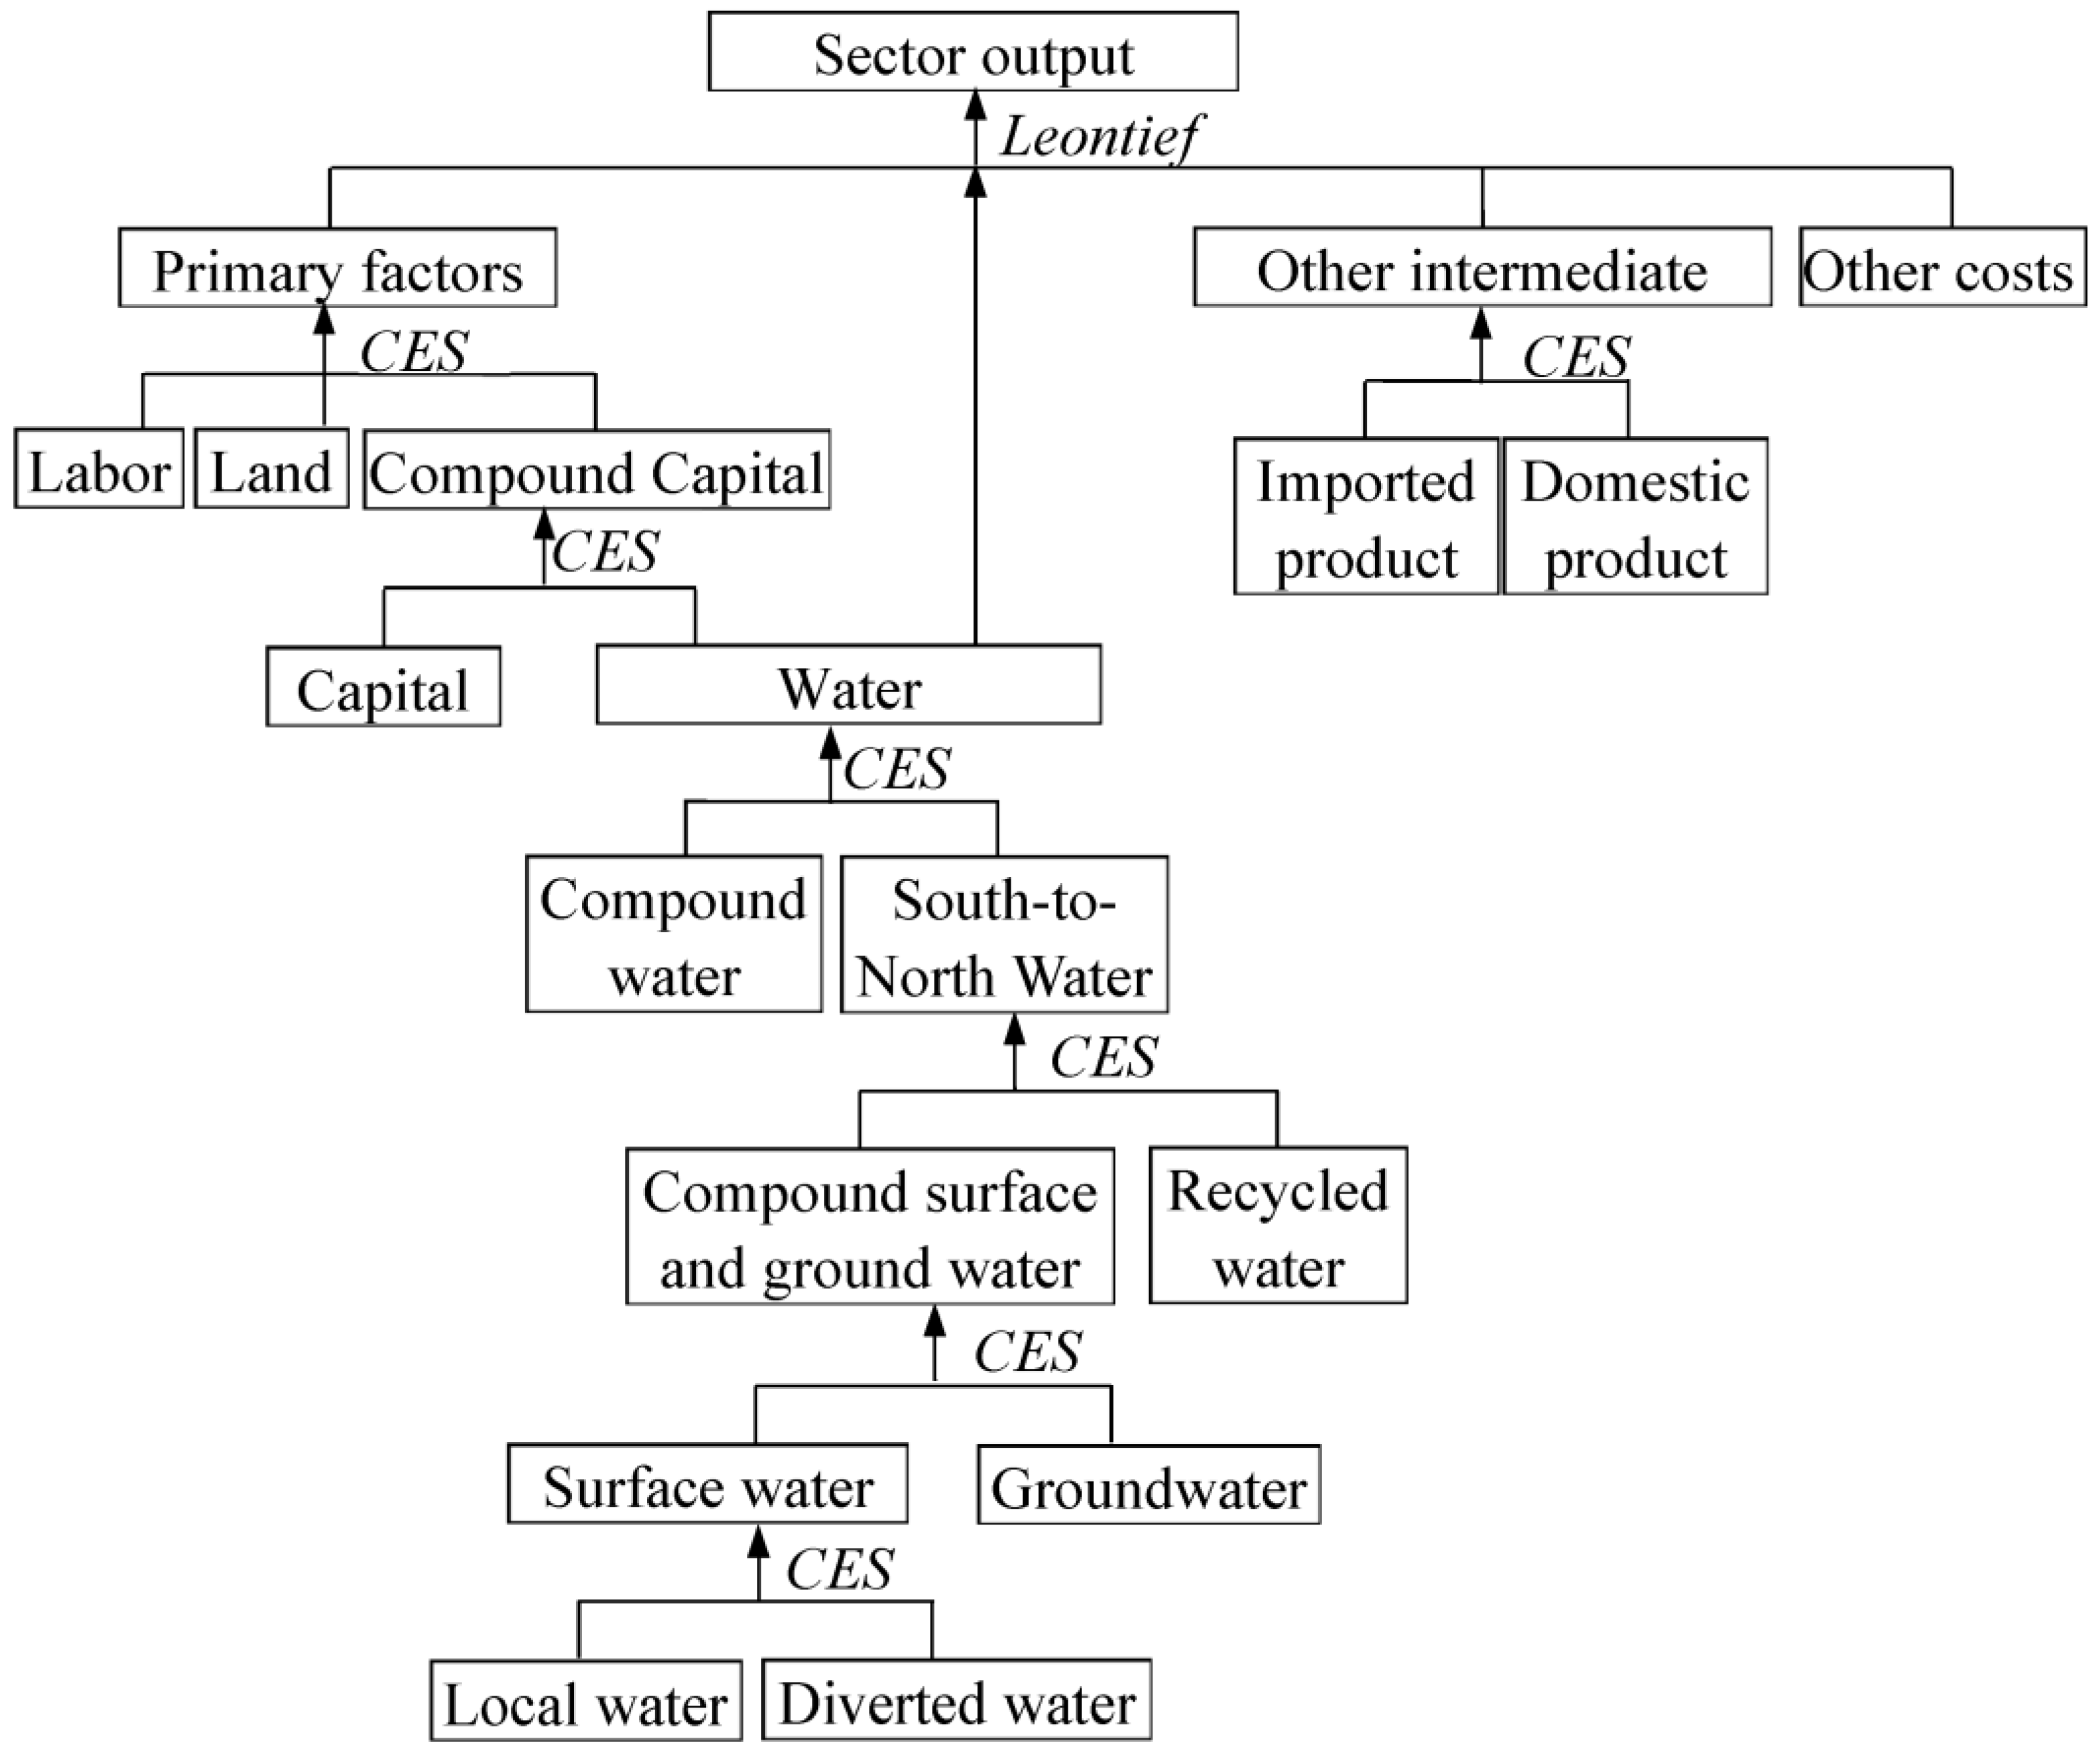
This paper sets up a hierarchy (from bottom to top), as shown in
Figure 1, to model how to alternatively compose and enter into the producer’s input decision.
The CES function was applied to reflect the S-r between the various types of water. SW firstly considered that it is composed of local water and diverted water transferred from other regions (excluding SNW), and the CES equation is as follows:
where
is the CES function composition that industry j uses imported water and self-produced water.
is the amount of the input of product
to industry
from source s (
for self-produced products,
for imported products).
is the technological progress parameter.
is the share parameter, and
is the coefficient of constant substitution elasticity.
Then, the demand for compounds SW and GW in sector j are examined in Equation (2):
where
is sector
j’s demand for compound water from sources SW (
) and GW (
);
,
and
are the technological progress, the shares, and the constant elasticity of substitution.
The demand for composite water can be represented in Equation (3):
where
is the demand for compound water;
is the technological progress parameters;
,
is the shares and constant elasticity of substitution,
is the SW, and
is the RW.
The demand SNW can be represented in Equation (4):
where
is sector
j’s aggregate demand;
,
,
are, respectively, the technological progress, the shares, and the constant elasticity of substitution.
is the aforementioned three types of water.
is the SNW.
2.2. Total Water Constraints Module
This CGE model added a total water constraints module. The value of water use is calculated in Equation (5):
where
,
, and
, respectively, are the water value, volume, and price. Taxes levied on the volume of water need to be converted into an ad valorem tax; see Equations (6) and (7).
where
is the tax levied and
is the ad valorem tax.
is the amount of water from different sources.
,
represents the amount and price of the water used. Superscripts (1) and (3) represent that this relationship applies to producer and household consumption, respectively. The other variables have the same meaning as before.
In Beijing, RW is not treated as a non-conventional water source. TW (total amount of water consumed) can be calculated as follows:
where
is the TW, which needs to stay within the “red line” control target.
s = 1, 2, and 4 represent SW, GW, and SNW, respectively.
2.3. Water and Capital Substitution Module
Capital, such as various types of water-saving equipment, can be substituted for water resources. We include a water and capital substitution module to accurately reflect water use problems. CES functions are applied to reflect the S-r between capital and water (
Figure 1).
where
is the demand for compound capital and water.
,
, and
are, respectively, technological progress, the shares, and the constant elasticity of substitution.
3. Baseline Scenario (B-s)
In order to analyze the impact of different water policy changes on water resource indicators, this paper sets up different policy scenarios based on the B-s (no policy impact). The paper constructs a CGE model for Beijing. The database of the CGE model is based on Beijing’s 2012 input-output table.
3.1. Case Study Area
Beijing is China’s capital city and has a dense population and a developed economy. Beijing’s per-capita GDP ranked second in China in 2015, which is behind that of Tianjin. However, Beijing is one of the world’s most water-stressed cities. Rapid economic development and increased pollution have exacerbated Beijing’s water scarcity, resulting in the overexploitation of GW and environmental issues. In Beijing, three-fifths of the water supply comes from GW, one-fifth from SW (including SNW), and one-fifth from RW in 2012. As one of the two arteries of the Beijing water supply system, the first phase of the SNWTP will send 1 billion m3 of water from the Yangtze to Beijing annually. This amount accounts for 66% of the total water consumption of the city’s central urban area (approximately 1.5 billion m3). The Beijing municipal government hopes that the SNWTP will mitigate the water resources crisis, increase sectoral water supply, and replace GW.
3.2. Data Sources and Processing
The B-s consists of a period from 2012 to 2020. We provide real values for key economic variables, e.g., real GDP growth, real consumption growth, real investment growth, and employment, as exogenous shocks to the model. The economic growth is displayed in
Table 1. Data from field investigations and surveys are also used. Among these shocks, we also provide the water usage figures for the various water users and sources. In order to analyze the impact of the SNWTP on industries, this paper classifies 44 sectors into 6 sectors according to water intensity [
16].
3.3. Parameters
3.3.1. Water Supply and Use
The water supply in Beijing exhibits an increasing trend. In 2012, it was approximately 3.59 billion m
3, of which SNW accounted for 0.28 billion m
3 (7.8%). In 2013, it was approximately 3.64 billion m
3, of which SNW accounted for 0.35 billion m
3 (9.6%). In 2014, it was approximately 3.75 billion m
3, of which SNW accounted for 0.8 billion m
3 (2.1%). The water supply in 2015 was approximately 3.82 billion m
3, including 2.87 billion m
3 SW, 1.83 billion m
3 GW, 0.95 billion m
3 RW, and 0.76 billion m
3 SNW (19.8%) (
Table 2).
Total water usage in 2015 was approximately 3.82 billion m
3, including 0.97 billion m
3 for households (25.5% of total usage), 0.65 billion m
3 for agriculture (16.9% of total usage), 0.39 billion m
3 for industry (10.1% of total usage), and 1.77 billion m
3 for service (46.4% of total usage) (
Table 3). The service sector represents the primary water user. Based on the forecast, water use will decrease by 3.1 billion m
3 in 2020, of which SNW will account for 1.0 billion m
3 (32.3%), RW 1.2 billion m
3 (38.7%), SW 0.3 billion m
3 (9.7%), and GW 0.6 billion m
3 (19.4%).
Table 4 shows that in 2015, the added value of agriculture decreased by 9.6% and the water use in agriculture decreased by 21.1%. The added value of industry increased by 3.3%, and the water use in industry decreased by 24.4%. In 2015, the state council of the PRC approved a “pilot program for expanding and opening the service sector in Beijing”. The service sector in Beijing is exhibiting rapid expansion. Its added value increased by 8.1% in 2015, and its water use increased by 23.7%. The expansion of the service sector is requiring more water; it snatches water used for the agricultural sector, particularly RW (in
Table 2, the amount of RW used by the agricultural sector in 2015 was 0). A certain amount of SW was replaced by RW. Therefore, the amount of SW for various users decreased (
Table 2).
3.3.2. Other Parameters
The labor demand elasticity and consumer price elasticity for all sectors were 0.243 and 5 [
17]. The Frisch parameter is −2 [
18]. The CET elasticity, the expenditure elasticity of household demand, the Armington elasticity, and the other elasticity values are taken [
19].
4. Results and What-If Analysis
In this paper, the policy scenario is a what-if scenario. We assume that there is no SNWTP. To evaluate the effect of the SNWTP on the Beijing economy, it is necessary to discuss the change in Beijing’s total water supply due to the SNWTP. If there is no SNWTP, the three other water sources will change. In 2014, the available SW and GW in Beijing were 0.645 billion m
3 and 1.38 billion m
3, respectively. However, in the same year, the usage amounts of SW and GW were 0.85 billion m
3 and 1.962 billion m
3, respectively, which indicates that conventional water resources have been severely overexploited. Therefore, if there is no SNWTP, SW and GW increases will be limited given that they are already overexploited (
Table 5). The RW supply will also increase (
Table 5), but only to a limited degree because of the limitations of production capacity. As a result, without the SNWTP, the total supply of water in Beijing will decrease dramatically (
Table 5).
How much will be the economic loss due to the decreased water volume if the current sectoral structure and water use structure are changed? The following analysis tries to answer these questions.
4.1. Macroeconomic Impacts
- (1)
GDP, employment, and capital
In the policy scenario, we assume that there is no SNWTP and no SNW supply. We exogenously shock the south-to-north water supply by −278 million m
3 in 2012, −351 million m
3 in 2013, −84 million m
3 in 2014, −755 million m
3 in 2015, −840 million m
3 in 2016, and −1000 million m
3 annually for 2017 to 2020. The water supply reduction poses a direct, unavoidable threat to economic growth.
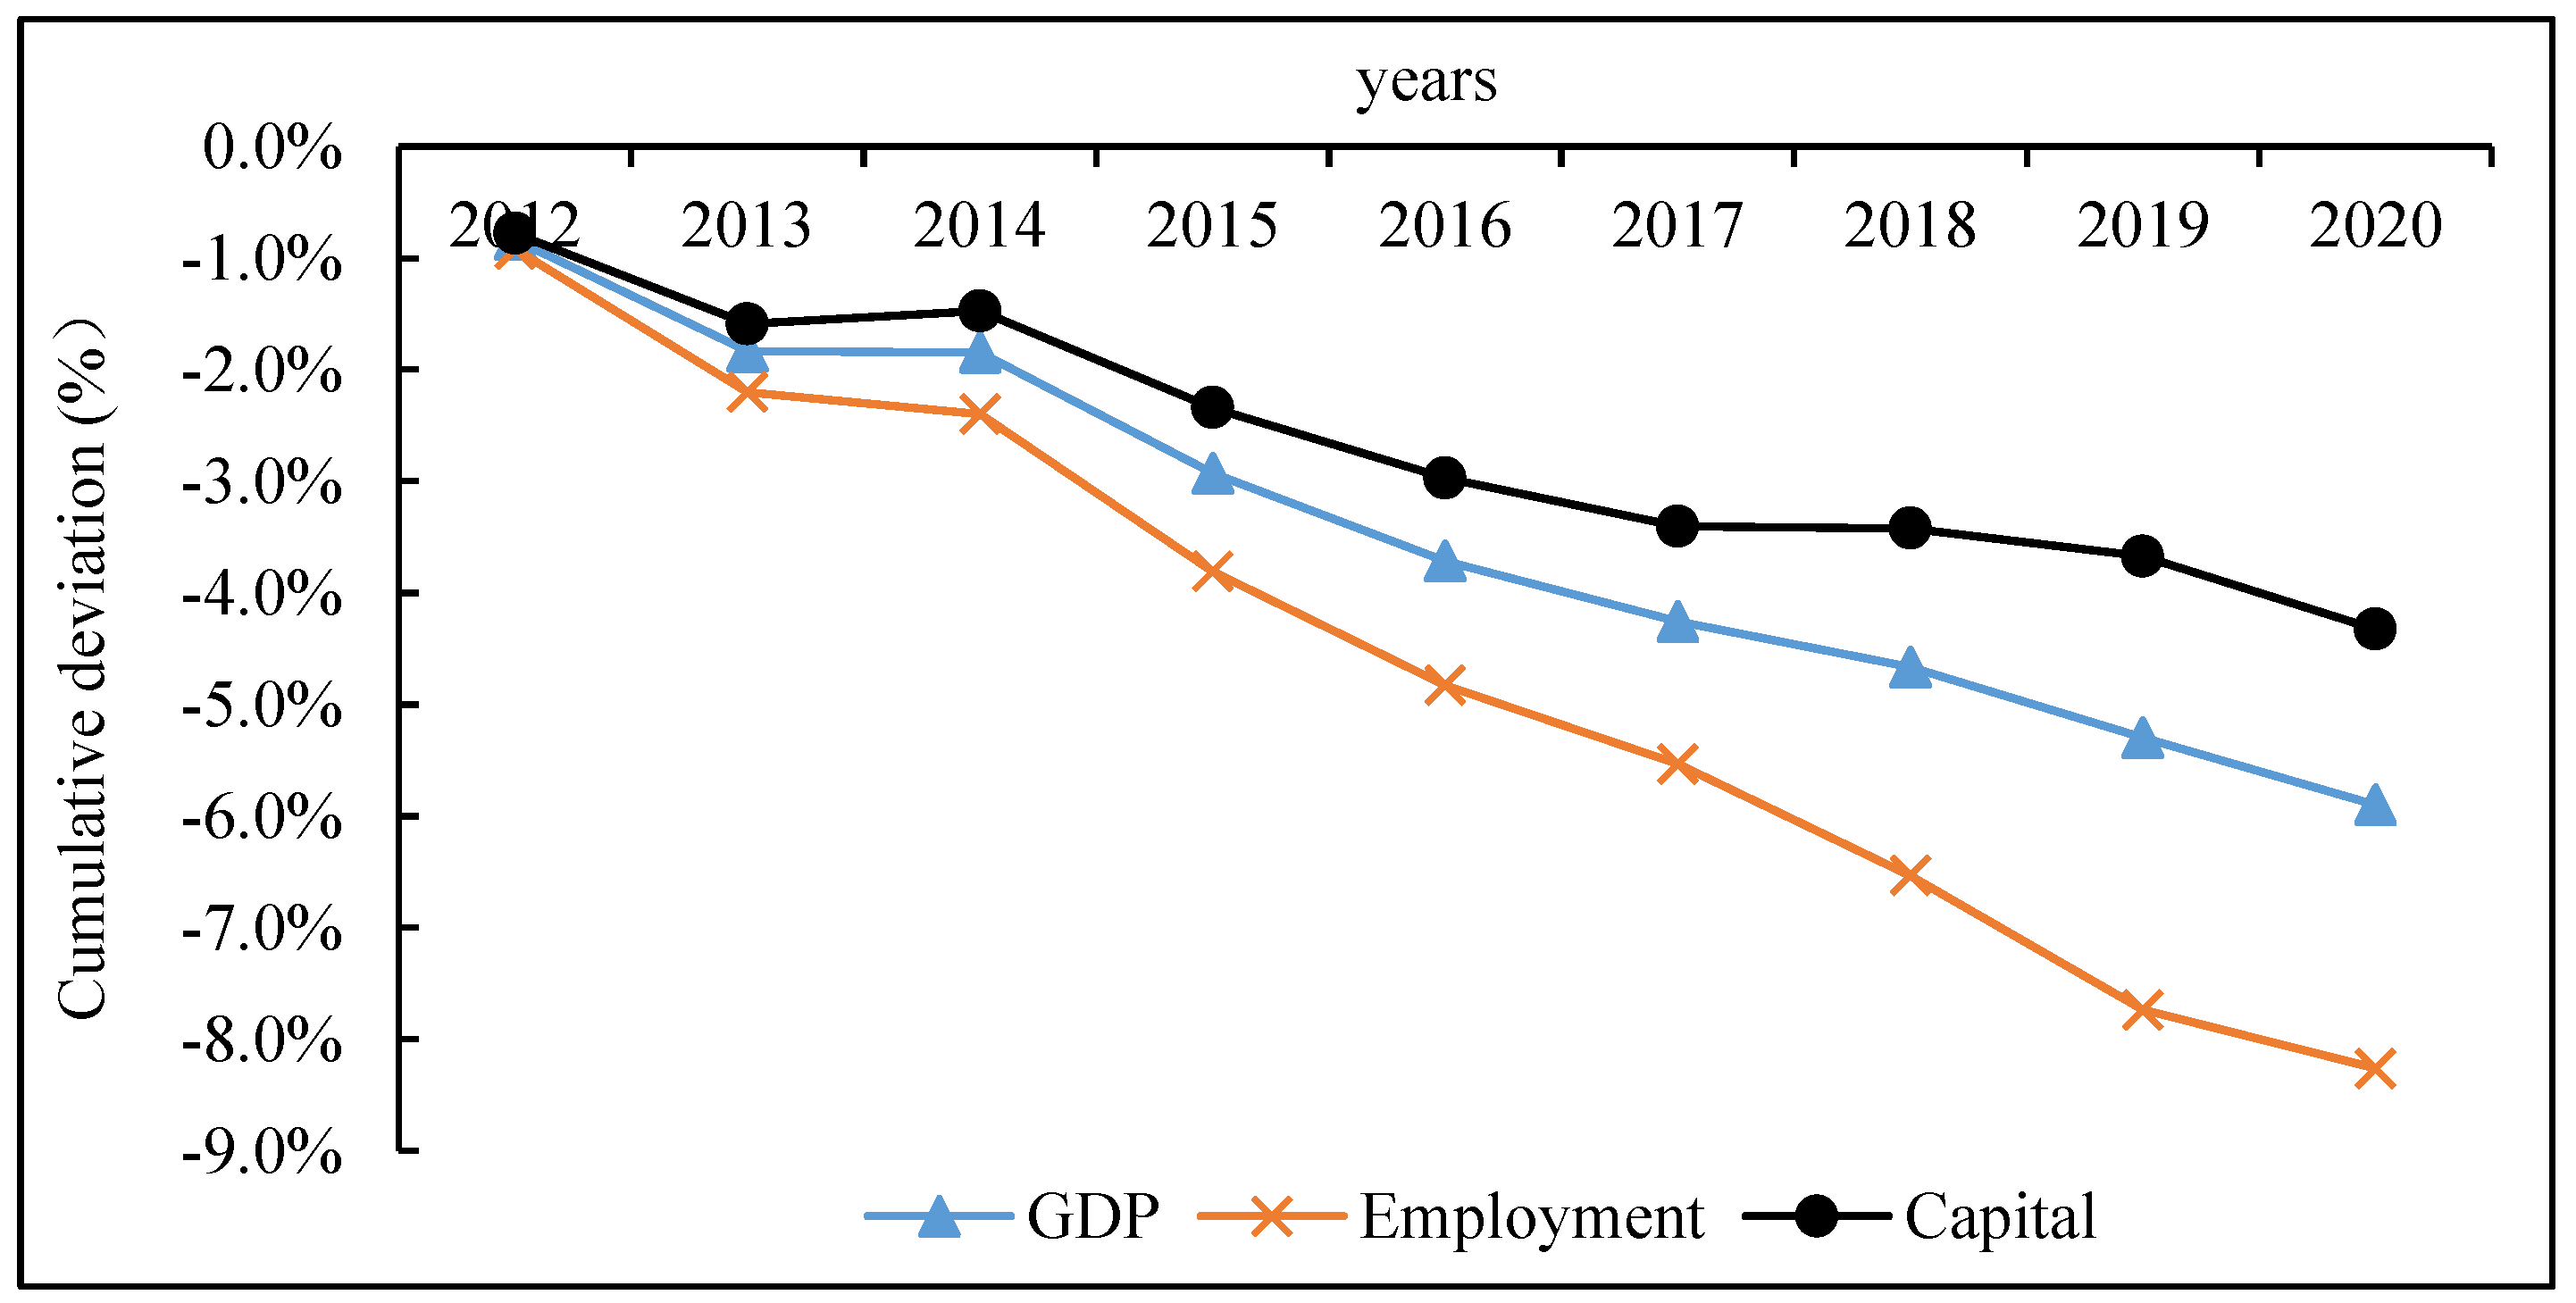
Figure 2 shows the impact on the economy when water supply is reduced in the policy scenario. GDP continues to decline because of the accumulated water supply reduction imposed in the policy scenario. When the water supply is 8% lower than the B-s in 2012, GDP is 0.8% lower than the B-s. When the water supply is 20% lower than the B-s in 2015, GDP is 2.9% lower. When the water supply is 33% lower in 2020, GDP is 5.9% lower (
Figure 2).
The lower GDP in the policy scenario is the result of slower growth of capital and employment.
Figure 2 shows that capital is 2.3% lower than in the B-s in 2015 and 4.3% lower in 2020. The water supply reduction as a result of no SNWTP also affects employment, which is 3.8% lower than in the B-s in 2015 and 8.3% lower in 2020. Employment suffers a larger negative impact than capital stock for two reasons. First, labor-intensive sectors, such as general industry and services, suffer output loss (for a detailed discussion, see the next section), which reduces their employment. Secondly, more than 37% of Beijing’s 2015 population consisted of immigrants from other regions. Once output and real wages decrease substantially in numerous sectors in Beijing, labor will migrate to other regions. GDP (
) is a function of technology
A, capital
K, and labor
L. If
A is fixed,
L and
K decide
Y. The GDP in 2020 is 5.9% lower than B-s, which reflects the combined effects of K and L (L is 8.3% lower and K is 4.3% lower than in B-s).
- (2)
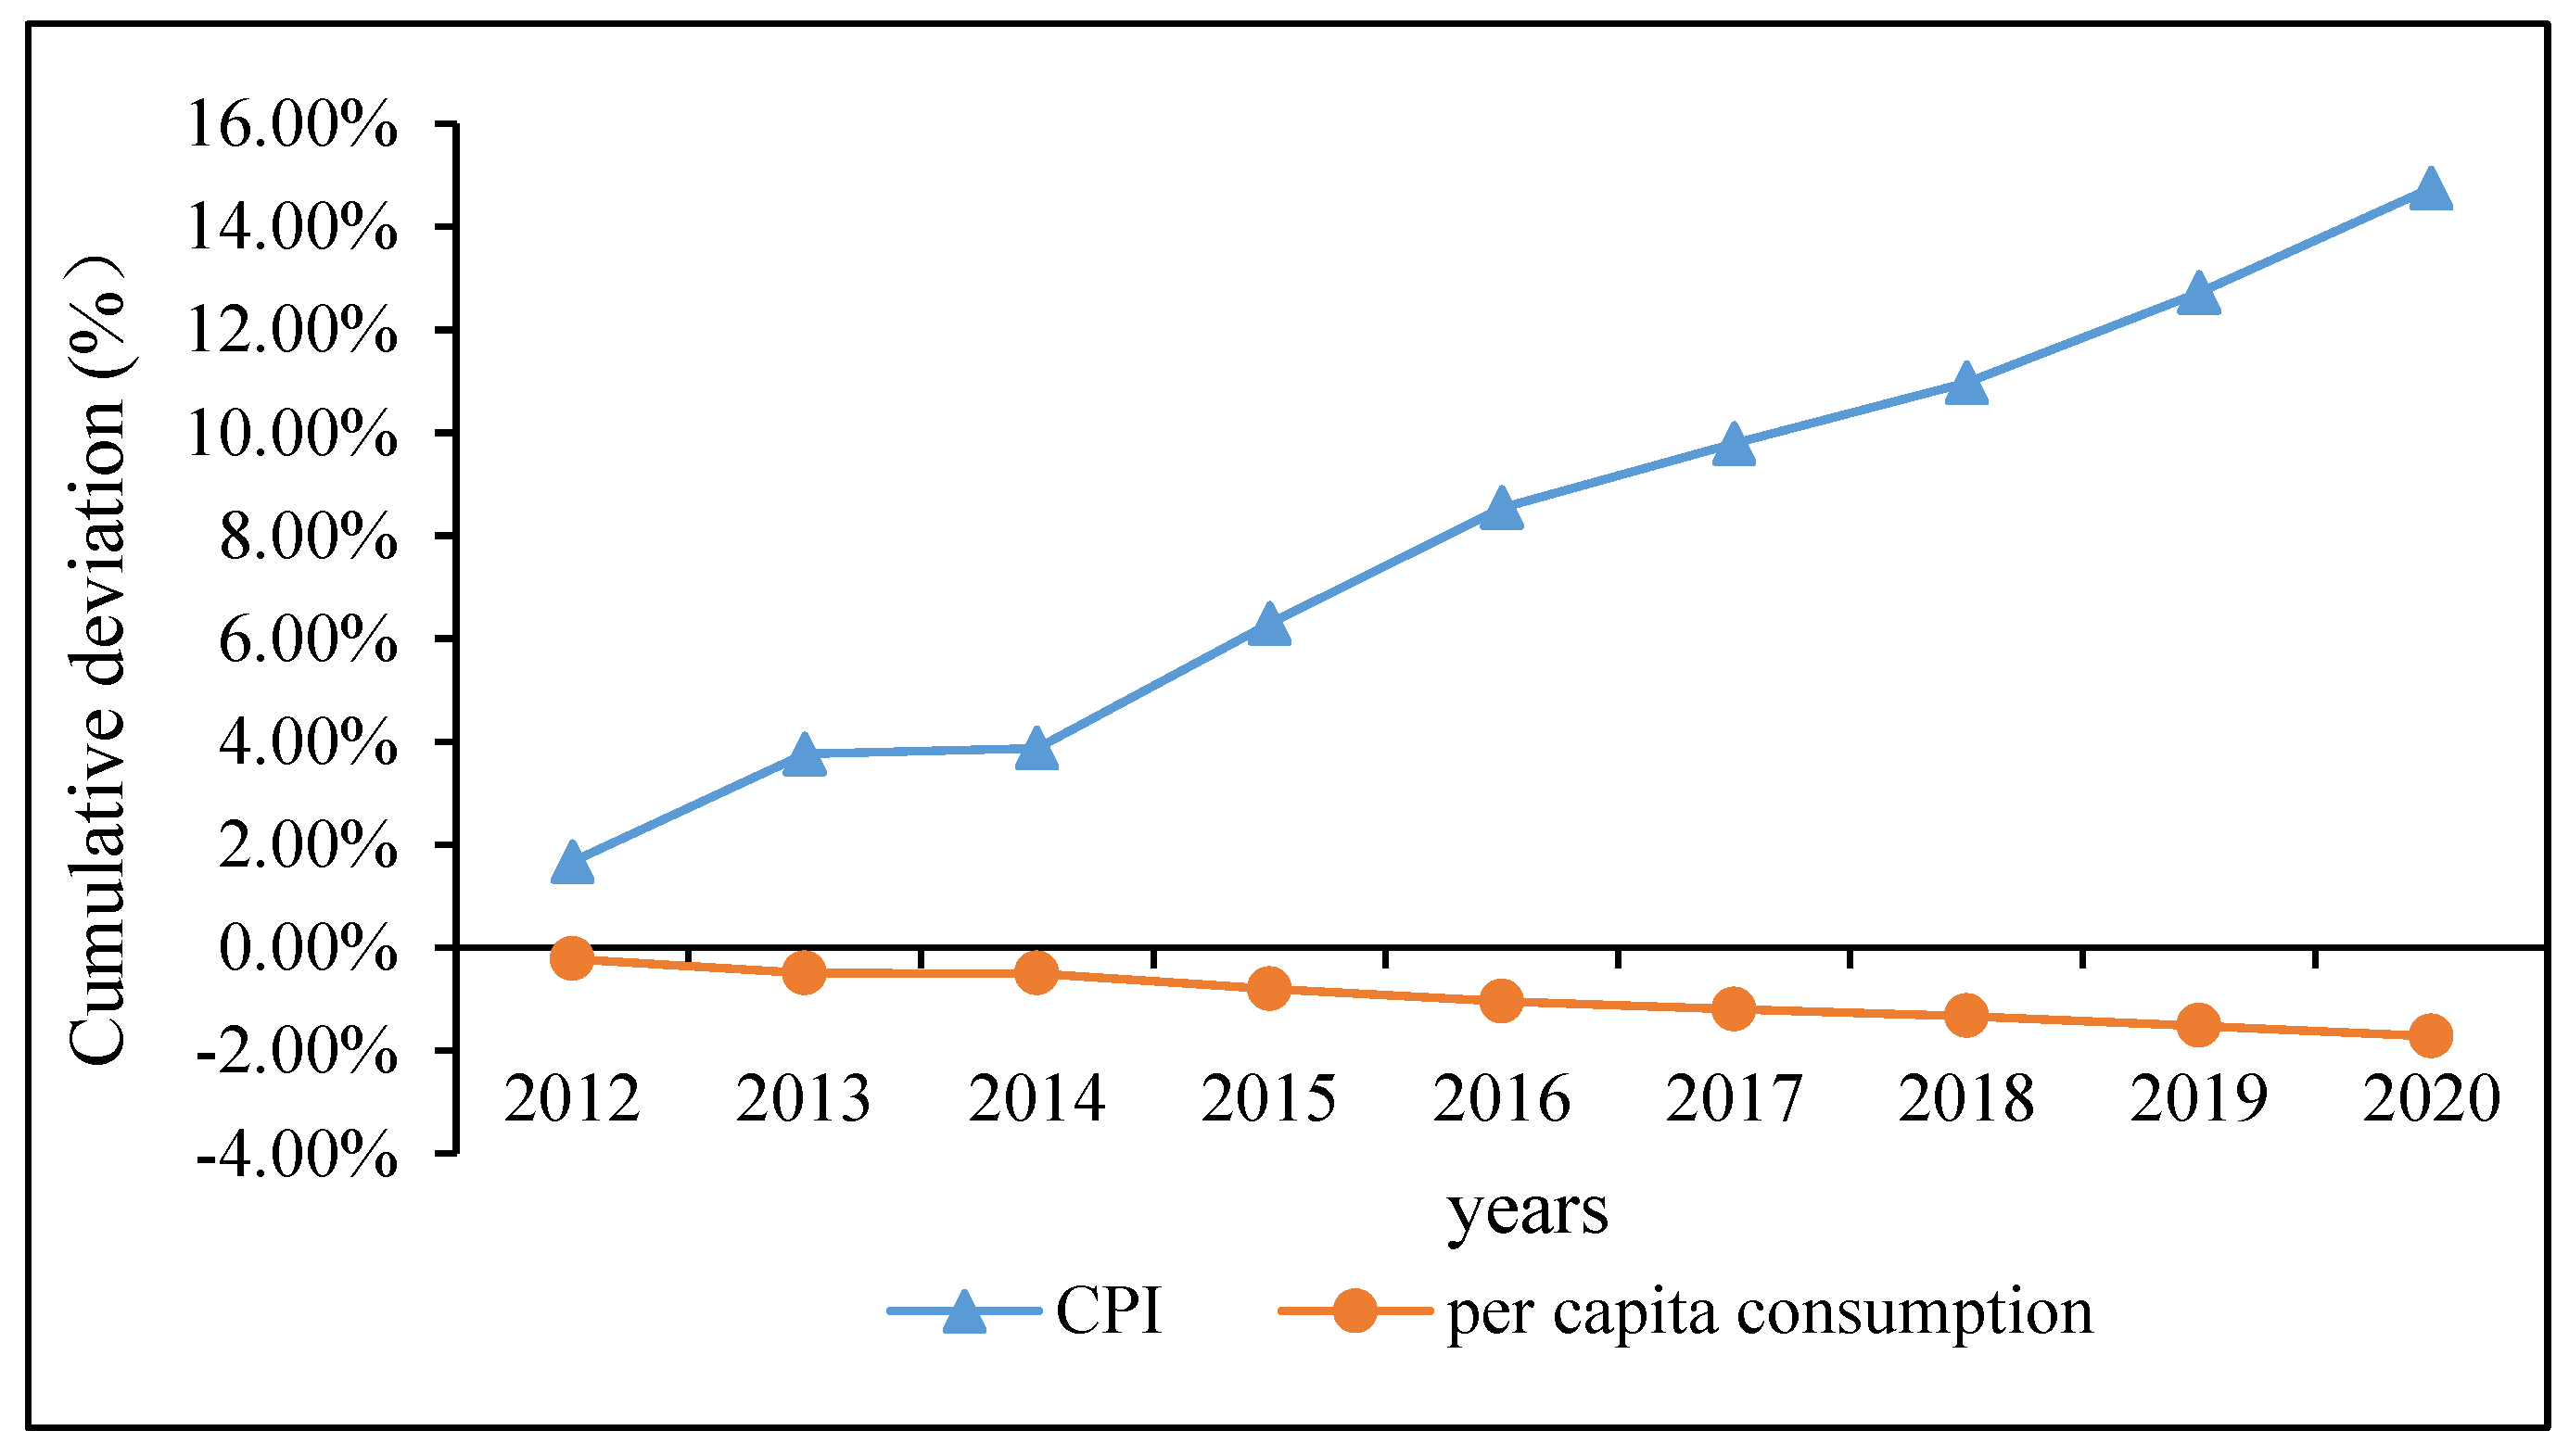
CPI and per-capita real household consumption
In our model, supply and demand determine prices. A supply decrease causes an increase in water prices and then causes an increase in other industries’ output prices. The consumer price index (CPI) will be 14.7% higher in 2020 (
Figure 3). By 2020, real household consumption will be 4.6% lower than in the B-s, and investment will be 3.4% lower. However, the per-capita decrease in consumption is only 1.6% because the population will be approximately 3% lower than in the B-s in 2020 (once real wages and output decrease in Beijing according to the policy scenario, migrants will migrate to other regions). Thus, per-capita consumption in Beijing decreases by 1.6% (i.e., 4.6–3%).
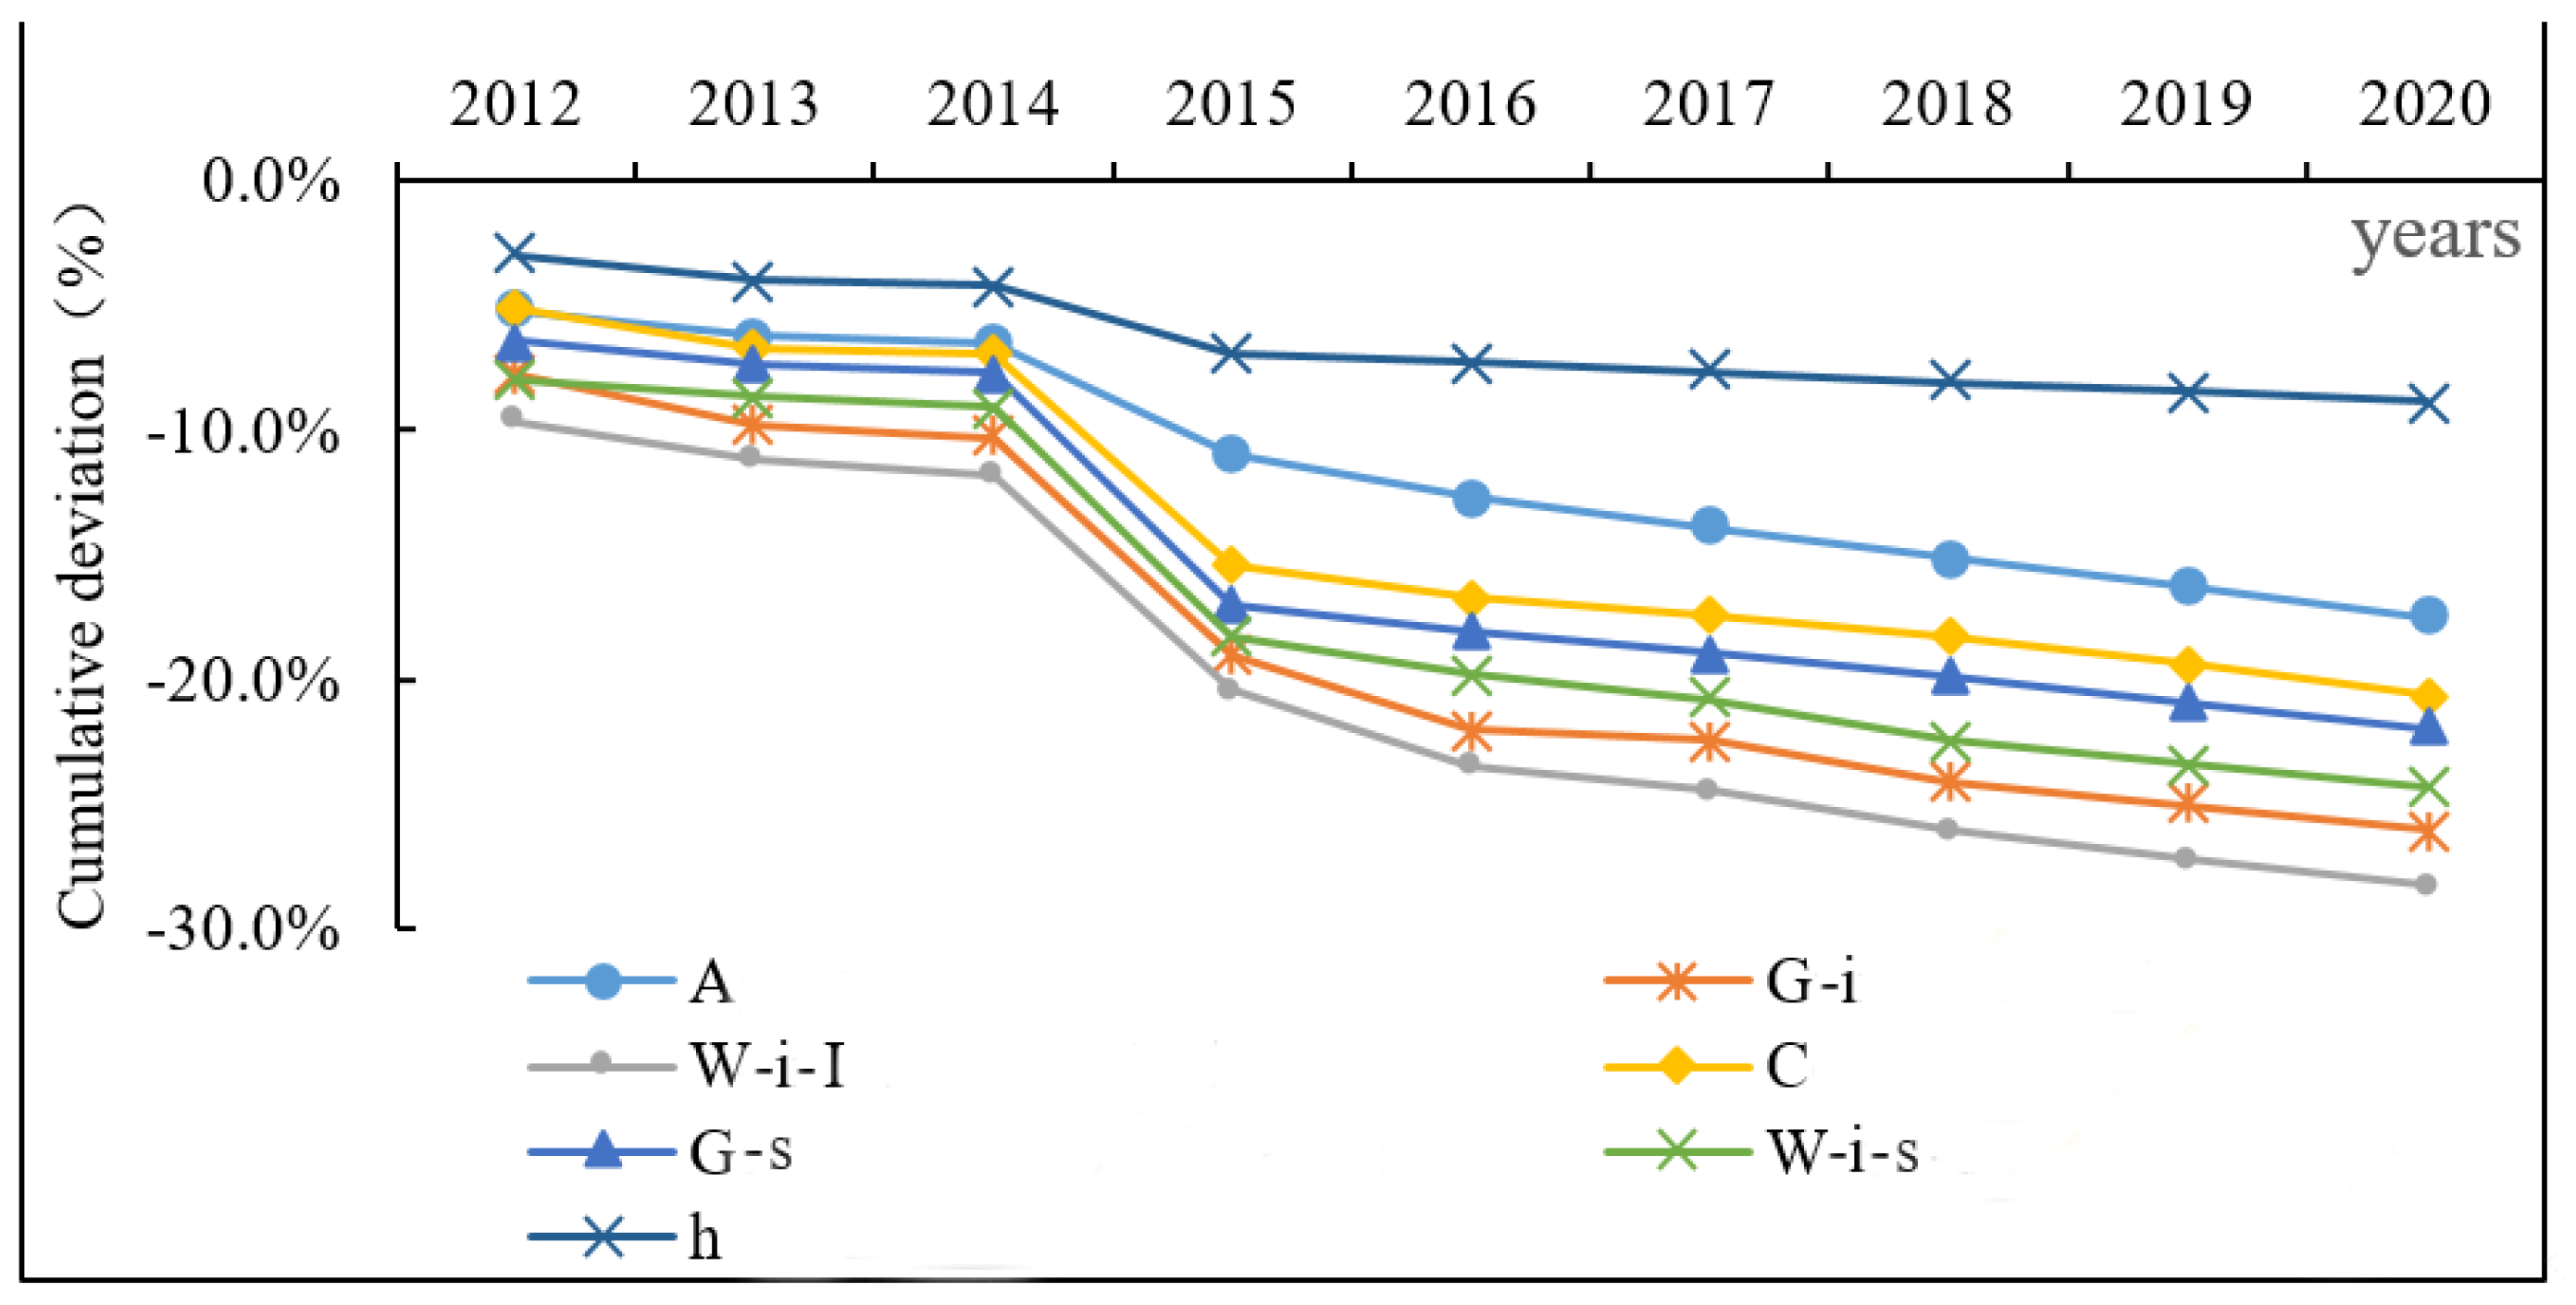
4.2. Sectoral Impacts
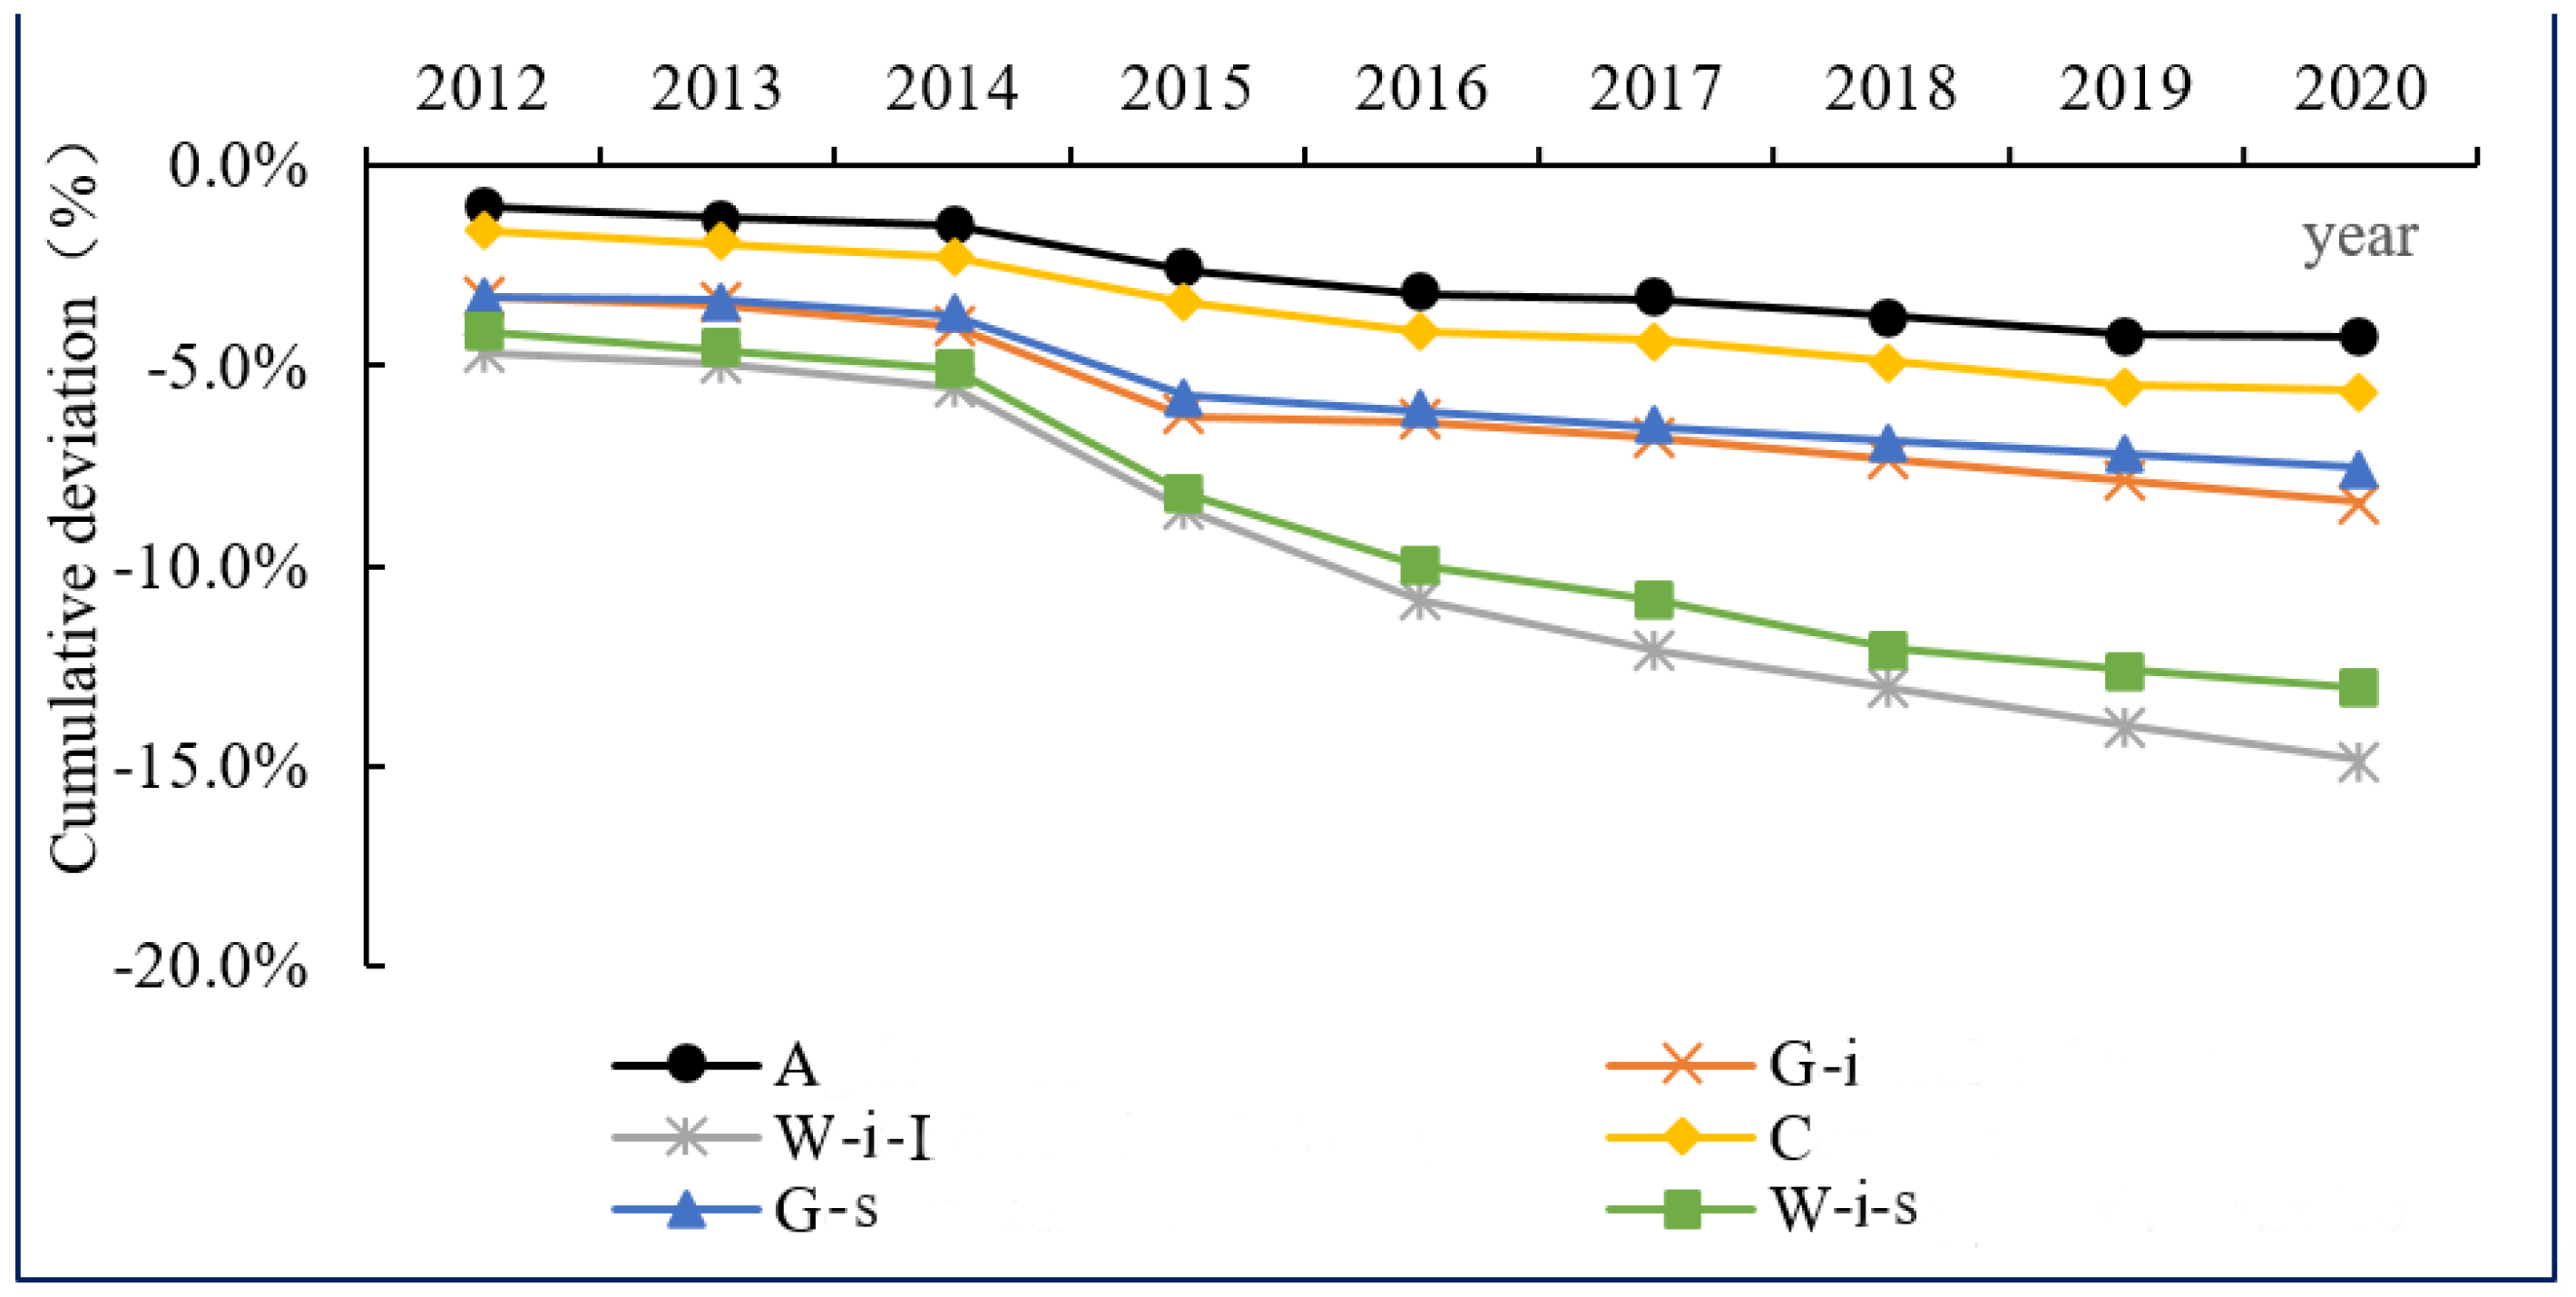
The decrease in the water supply without the SNWTP forces Beijing’s economy to continuously adapt to water scarcity conditions and reduces water demand in water-intensive industries, where output decreases. It is more likely that the water-intensive users of water will reduce output or import water-intensive inputs as water scarcity worsens. The output of W-i-I suffers the largest reductions (−14.8% in 2020), followed by W-i-s (−13.1% in 2020), then G-i, G-s, C, and A (
Figure 4). A only accounts for a small proportion of the overall Beijing economy (9.0% of GDP in 2015), and the primary water sources for agriculture are GW and RW. The decrease in the SNWTP water supply does not exert a direct, significant impact on agriculture but will be influenced by an extrusion effect (i.e., industry, services, and households will use some agricultural water).
4.3. Water Utilization
The decrease in water supply will reduce water waste and increase water-use efficiency. Policy scenarios produce tangible water reduction results. The aggregated water reduction rate will be 18.4%. We simulate an uneven allocation of water transfers among different sectors. The water utilization for water-intensive industries will decrease the most and be approximately 28.3% lower relative to the B-s by the end of 2020 (
Figure 5). The water utilization in general industry will decrease by 26.1%. Water use by water-intensive services and general services will be 24.3% and 22.0% (
Figure 5) lower, respectively. The water utilization for households also shows a continued decreasing trend, falling 8.9% (
Figure 5). The decrease in household water usage is smaller than that of the other sectors. The reason is that the water supply protectionist policy prioritizes the water used by households, subsequently establishing overall arrangements for industrial and other sectors.
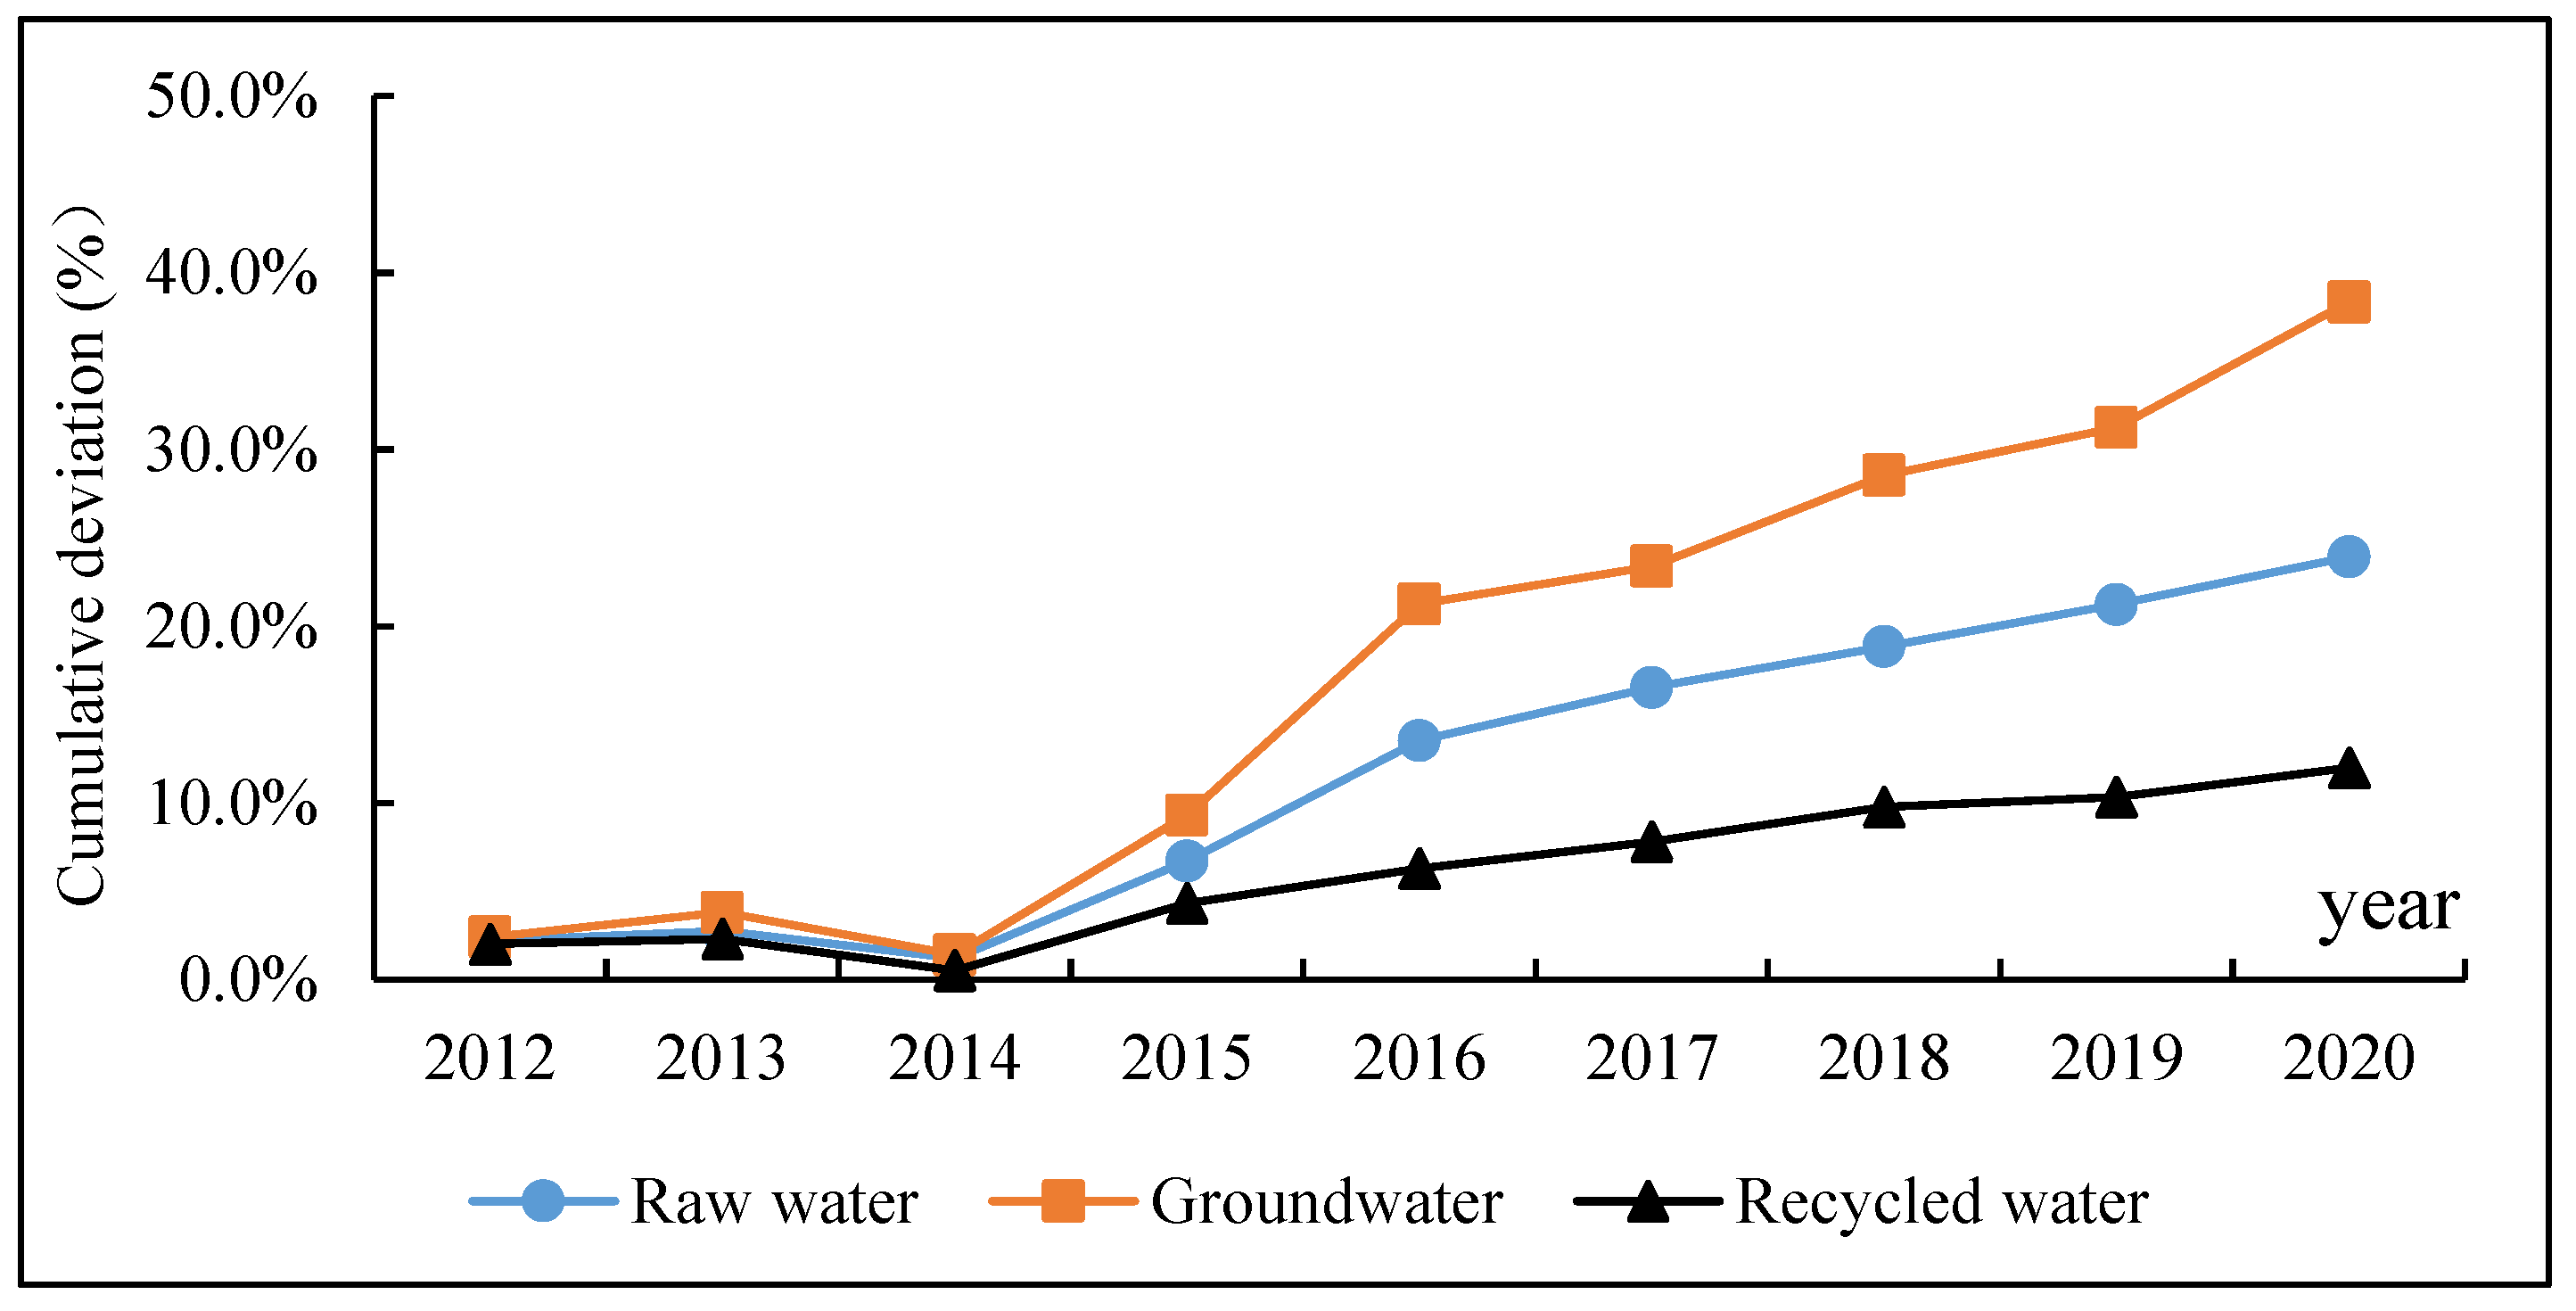
The policy simulation also shows that the water supply change will differ across sources (
Figure 6). The supply of SW will increase by 23.9% to a level of 0.07 billion m
3 by 2020 in the policy scenario. By 2020, GW and RW supplies will increase by 38.4% and 12.0% to 230 million m
3 and 140 million m
3, respectively, when there is no SNWTP. The policy simulation suggests that SNWTP water will tentatively replace GW in Beijing. GW extraction will decrease by 0.19 billion m
3 annually from 2012–2020 because of the water supply from the SNWTP and Beijing GW levels rising in 2015 for the first time in 16 years (since 1999). In 2016, GW levels rose by 0.52 m. In 2017, GW levels rose by 0.26 m. In March 2018, GW levels rose by 0.41 m, and GW storage volume reserves increased by 210 million cubic meters.
5. Discussion and Limitations
5.1. Comparison with Other Studies
Our study shows that the SNWTP enhances economic growth. These results are consistent with the findings of previous studies. For example, Feng et al. [
20] found that the incremental water supply from the SNWTP would cause economic growth in Beijing, and GDP would be 27% higher than the baseline (without the SNWTP). A ripple effect would result in production expansion, 12% higher employment, and 20% higher per-capita household income than the baseline by 2020. Gao et al. [
2] estimated that the comprehensive economic benefit of the water supply from the SNWTP to Beijing would be 207.04 billion yuan (approximately 7% of GDP). Qin et al. [
3] found that total output and GDP would increase by less than 2% (2007). Our analysis found that GDP would decrease by 5.9% in 2020 without the SNWTP. This value was smaller than that found by Feng et al. [
18] and Gao et al. [
2], primarily because we include water and capital substitution modules in our study. When the water supply decreases, water-saving investment increases, and producers and families may purchase water-saving equipment. As a result, water can be saved, and water efficiency increases. In our study, producers and households adjust to the decrease in water supply if there is no SNWTP. Our value was higher than that found by Qin et al. [
3], primarily because Qin et al. [
3] applied a comparative-static CGE model, which has only the data of a specific year (2007) and reflects the policy impact of the specific year. It does not allow for the consideration of cumulative effects, which are represented year-by-year in the same simulation. It is necessary to develop a dynamic CGE model to investigate long-term effects and capture the accumulated impact.
The sectoral impact results in our study are consistent with Gao et al.’s results [
2]. They estimated that the industrial sectors that will experience major direct economic benefits from the SNWTP are the chemical industry, the production and supply of electric power and heat power, petroleum processing, coking, nuclear fuel processing, metal smelting and rolling, and food and tobacco manufacturing. In our study, these sectors belong to water-intensive industries.
Two scenarios were set: one with SNWTP and one without SNWTP. This paper separates the effect of SNWTP from many influencing factors by comparative analysis with or without SNWTP. The paper provides a quantitative answer to the economic impact of the SNWTP. This will help the public understand SNWTP correctly. SNWTP contributes to social-economic development, guarantees social-economic water use, and helps Beijing rid itself of the bottleneck of water shortages.
5.2. Effect of the Water Price Policy
People are responsive to water price increases [
21,
22]. The price elasticity of water demand expresses the percentage change in quantity demanded in response to a one-percent change in price. The price elasticity of water demand in previous studies is shown in
Table 6. The mean elasticity value ranges from −0.365 to −0.79, which means if the water price increases by 10%, the water demand decreases by 3.65–77.9%.
Water pricing is effectively used to conserve water and improve water utilization efficiency. In China, water pricing is determined in certain regions by top-down administrative commands rather than a market [
27]. In 2016, Beijing increased the water price (
Table 7). Non-residential water prices increased to 9 yuan/m
3~9.5 yuan/m
3 from 8.15 yuan/m
3 before 2016. For certain industries, such as car-washing, baths, and golf courses, the price increased to 160 yuan/m
3 from 61.68 yuan/m
3~81.68 yuan/m
3 before 2016.
“Non-resident” includes industrial and commercial clients, the hotel and catering industry, and administrative management. “Special industry” includes car washes, baths, the bottled water industry, golf courses, and ski resorts.
However, pricing is not being used to create economic incentives to save water under certain conditions. Water pricing is complicated, involving trade-offs between cost recovery, equity, and environmental efficiency [
28,
29]. An increase in the price of water may negatively impact the level of economic activity [
30]. Raising water prices cannot solve Beijing’s water shortage problem. The SNWTP has solved the water shortage problem in Beijing to some extent and promoted social-economic development.
5.3. Limitations
This study has several limitations. For example, the construction costs, ecological environmental impact, and immigration-related effects of the SNWTP are not considered.
- (1)
SNWTP construction costs
The SNWTP is highly expensive. This article does not address the project’s construction costs. In other studies, costs are discussed. For example, a study by the World Bank [
31] suggests that the project is economically attractive, whereas a study by the WWF [
32] shows the opposite.
- (2)
Ecological and environmental impact
The SNWTP has generated a large controversy regarding its environmental implications. For example, Yangtze Estuary salinization will worsen, particularly during dry months and years [
33,
34]. Coastal erosion along the delta is unavoidable [
35]. Wang and Ma [
36] note that the Middle Route will be affected by the altered slope stability of swelling clay and rock as well as soil salinization. Yang and Zehnder [
37] suggested that SNWTP is responsible for the resulting environmental benefits. Zhang [
38] suggested that the MR-SNWTP could increase the risk of secondary salinization (i.e., soil salinization caused by over-irrigation). Through the synergistic use of water transferred from SNW and locally reclaimed water, Beijing has reduced the amount of GW extraction by 0.16 billion m
3 annually, and the GW level has rebounded for the first time in 16 years (since 1999), so that the ecological environment has significantly improved.
- (3)
Resettlement of displaced residents
A total of 300,000 inhabitants were displaced during the construction phase of the project, both around Danjiangkou Reservoir and elsewhere [
39], and relocated due to project construction. Webber et al. [
5] observed that resettlements, restricted development, and reduced use of pesticides were altered in many communities. We do not consider immigration and its secondary influence, such as resettlements, health effects (including higher labor force productivity), and sanitation and life-satisfaction assessments.
In the future, the CGE model will be extended to the ecological field to quantitatively analyze the ecological environment impact of SNWTP.
6. Conclusions
This article distinguishes economic sectors based on water use intensity. The Beijing water sector is divided into four subsectors: SW, GW, RW, and SNW. This article adopts the CGE model and adds three modules based on the original CGE model: a subdivided water substitution module, a total water constraints module, and a water and capital substitution module. These improvements provide additional insights into the impacts of different water policies, including their economic impacts.
The results of this study contribute to filling a knowledge gap in our understanding of the economic impacts of the world’s largest water transfer project and could be of critical importance in clarifying the ambiguous economic impacts of the SNWTP. The key findings of this study are summarized as follows: (1) Water reduction without the SNWTP poses a direct, unavoidable threat to economic growth in Beijing, largely due to the region’s water shortages. Employment, capital, and GDP will continue to decrease, respectively 8.3%, 4.3%, and 5.9% lower than in the B-s in 2020. Per-capita household consumption also exhibits a downward trend (1.6%). The consumer price index (CPI) will be 14.7% higher than the B-s. (2) The water demand will decrease in water-intensive sectors without the SNWTP, whereby output obviously decreases. The output of water-intensive industry will suffer the largest decrease (−14.8% in 2020), followed by water-intensive services (−13.1% in 2020), then general industry, general services, construction, and agriculture. (3) The policy scenario produced a significant water-saving effect, with a water reduction rate of 18.4%. Water-intensive industries saw the largest reduction in water use, about 28.3%. General industrial water use will be reduced by 26.1%. Water utilization by households will exhibit the smallest decrease due to the water supply protectionist policy.
South-to-north water will tentatively replace GW in Beijing, decreasing GW extraction to 0.19 billion m3 per year for the period 2012–2020. This was verified by Beijing GW levels rising in 2015 for the first time in 16 years (since 1999).
Author Contributions
Conceptualization, Y.X. and J.Z.; Methodology, Y.X. and J.Z.; Software, Y.B.; Validation, Y.B.; Formal analysis, Y.B.; Investigation, J.Z.; Resources, J.Z.; Writing — original draft, Y.X. and Y.B.; Writing — review & editing, Y.X., Y.B. and J.D.; Supervision, J.Z; Project administration, J.Z.; Funding acquisition, J.Z. All authors have read and agreed to the published version of the manuscript.
Funding
This work was supported by the National Key R&D Program of China under grant [2022YFC3204600], the National Key R&D Program of China under grant [2021YFB3900605] and the Natural Science Foundation of Henan province [222300420231].
Data Availability Statement
Data are contained within the article.
Acknowledgments
We are grateful to the reviewers and the editor for their constructive suggestions, which have helped us a lot in improving the quality of the paper.
Conflicts of Interest
Author Yinsheng Xu and Yanjie Bi were employed by the company China Water Resources Beifang Investigation, Design and Research Company Limited. The remaining authors declare that the research was conducted in the absence of any commercial or financial relationships that could be construed as a potential conflict of interest.
References
- Fang, X.M.; Roe, T.L.; Smith, R.B.W. Water shortages, intersectoral water allocation and economic growth: The case of China. China Agric. Econ. Rev. 2015, 7, 2–26. [Google Scholar] [CrossRef]
- Gao, Y.; Yu, M. Assessment of the economic impact of South-to-North Water Diversion Project on industrial sectors in Beijing. J. Econ. Struct. 2018, 7, 2–17. [Google Scholar] [CrossRef]
- Qin, C.; Su, Z.; Bressers, H.T.; Jia, Y.; Wang, H. Assessing the economic impact of North China’s water scarcity mitigation strategy: A multi-region, water-extended computable general equilibrium analysis. Water Int. 2013, 38, 701–723. [Google Scholar] [CrossRef]
- Moore, S.M. Modernization, authoritarianism, and the environment: The politics of China’s South-North Water Transfer Project. Environ. Political 2014, 6, 947–964. [Google Scholar] [CrossRef]
- Webber, M.; Crow-Miller, B.; Rogers, S. The South-North Water Transfer Project: Remaking the geography of China. Reg. Stud. 2017, 51, 370–382. [Google Scholar] [CrossRef]
- Wilson, M.; Li, X.Y.; Ma, Y.J.; Smith, A.; Wu, J. A Review of the Economic, Social, and Environmental Impacts of China’s South–North Water Transfer Project: A Sustainability Perspective. Sustainability 2017, 9, 1489. [Google Scholar] [CrossRef]
- Cancelliere, A. Assessing Future Impacts of Climate Change on Water Supply System Performance: Application to the Pozzillo Reservoir in Sicily, Italy. Water 2019, 11, 2531. [Google Scholar] [CrossRef]
- Arunrat, N.; Sereenonchai, S.; Chaowiwat, W.; Wang, C. Climate change impact on major crop yield and water footprint under CMIP6 climate projections in repeated drought and flood areas in Thailand. Sci. Total Environ. 2022, 807, 150741. [Google Scholar] [CrossRef]
- Dixon, P.; Parmenter, B.; Sutton, J.; Vincent, D.P. ORANI: A Multi-Sectoral Model of the Australian Economy; North-Holland: West Frisian, The Netherlands, 1982. [Google Scholar]
- Dixon, P.; Rimmer, M.T. Dynamic General Equilibrium Modelling for Forecasting and Policy: A Practical Guide and Documentation of MONASH; North Holland: West Frisian, The Netherlands, 2002. [Google Scholar] [CrossRef]
- Parikh, A.; Thorbecke, E. Impact of rural industrialization on village life and economy: A social accounting matrix approach. Econ. Dev. Cult. Change 1996, 44, 351–377. [Google Scholar] [CrossRef]
- Horridge, M.; Madden, J.; Wittwer, G. The impact of the 2002–2003 drought on Australia. J. Policy Model. 2005, 27, 285–308. [Google Scholar] [CrossRef]
- Dixon, P.; Jorgenson, D. Handbook of Computable General Equilibrium Modeling, Vols. 1A and 1B; North Holland: West Frisian, The Netherlands, 2013. [Google Scholar] [CrossRef]
- Li, J.; Zhang, Y. A quantitative analysis economic impact of potential green barrier of international trade for China: Case study of carbon tariff with SIC-GE Model. J. Int. Trade 2012, 5, 105–118. (In Chinese) [Google Scholar]
- Mai, Y.; Peng, X.; Dixon, P.B.; Rimmer, M. The Economic Effects of Facilitating the Flow of Rural Workers to Urban Employment in China. Pap. Reg. Sci. 2014, 93, 619–642. [Google Scholar] [CrossRef]
- Ni, H.; Wang, H.; Li, J.; Zhang, C.; Zhao, J. Study on Water Supply Price System; China Water & Power Press: Beijing, China, 2016. (In Chinese) [Google Scholar]
- Zheng, Y.; Fan, M. China CGE Model and Policy Analysis; Social Science Academic Press: Beijing, China, 2008. (In Chinese) [Google Scholar]
- Dervis, K.; Melo, J.; Robinson, S. General Equilibrium Models for Development Policy; Cambridge University Press: Cambridge, UK, 1982. [Google Scholar]
- Horridge, M. ORANI-G: A Generic Single-Country Computable General Equilibrium Model; Monash University: Melbourne, Australia, 2003. [Google Scholar]
- Feng, S.; Li, L.X.; Duan, Z.G.; Jin, L.Z. Assessing the impacts of South-to-North Water Transfer Project with decision support systems. Decis. Support Syst. 2007, 42, 1989–2003. [Google Scholar] [CrossRef]
- Renwick, M.E.; Green, R.D. Do residential water demand side management policies measure up? An analysis of eight water agencies. J. Environ. Econ. Manag. 2000, 40, 37–55. [Google Scholar] [CrossRef]
- Ashoori, N.; Dzombak, D.A.; Small, M.J. Identifying water price and population criteria for meeting future urban water demand targets. J. Hydrol. 2017, 555, 547–556. [Google Scholar] [CrossRef]
- Schoengold, K.; Sunding, D.L.; Moreno, G. Price elasticity reconsidered: Panel estimation of an agricultural water demand function. Water Resour. Res. 2006, 42, 2286–2292. [Google Scholar] [CrossRef]
- Dalhuisen, J.M.; Florax, R.J.; de Groot, H.L.; Nijkamp, P. Price and income elasticities of residential water demand: A meta-analysis. Land Econ. 2003, 79, 292–308. [Google Scholar] [CrossRef]
- Sebri, M. A meta-analysis of residential water demand studies. Environ. Dev. Sustain. 2014, 16, 499–520. [Google Scholar] [CrossRef]
- Olmstead, S.M.; Hanemann, W.M.; Stavins, R.N. Water demand under alternative price structures. J. Environ. Econ. Manag. 2007, 54, 181–198. [Google Scholar] [CrossRef]
- Yu, H.; Shen, D. Application and outlook of CGE model in water resources. J. Nat. Resour. 2014, 29, 1626–1636. [Google Scholar] [CrossRef]
- Rinaudo, J.D.; Montginoul, M. Simulating the Impact of Pricing Policies on Residential Water Demand: A Southern France Case Study. Water Resour. Manag. 2012, 26, 2057–2068. [Google Scholar] [CrossRef]
- Expósito, A.; Berbel, J. Why Is Water Pricing Ineffective for Deficit Irrigation Schemes? A Case Study in Southern Spain. Water Resour. Manag. 2017, 31, 1047–1059. [Google Scholar] [CrossRef]
- Zhao, J.; Ni, H.; Peng, X.; Li, J.; Chen, G.; Liu, J. Impact of water price reform on water conservation and economic growth in China. Econ. Anal. Policy 2016, 51, 90–103. [Google Scholar] [CrossRef]
- World Bank. China: Agenda for Water Sector Strategy for North China; World Bank Report 22040-CHA; World Bank: Washington, DC, USA, 2001. [Google Scholar]
- Worldwide Foundation for Nature (WWF). The Proposed South North Water Transfer Scheme in China; Needs, Justification and Cost. Draft Report; WWF: Beijing, China, 2001. [Google Scholar]
- Xu, K.; Zhu, J.; Gu, Y. Impact of the eastern water diversion from the south to the north project on the saltwater intrusion in the Changjiang Estuary in China. Acta Oceanol. Sin. 2012, 31, 47–55. [Google Scholar] [CrossRef]
- Chen, D.; Webber, M.; Finlayson, B.; Barnett, J.; Chen, Z.; Wang, M. The impact of water transfers from the lower Yangtze river on water security in Shanghai. Appl. Geogr. 2013, 45, 303–310. [Google Scholar] [CrossRef]
- Chen, X.; Zong, Y. Coastal Erosion along the Changjiang Deltaic Shoreline, China: History and Prospective. Estuar. Coast. Shelf Sci. 1998, 46, 733–742. [Google Scholar] [CrossRef]
- Wang, L.; Ma, C. A Study on the Environmental Geology of the Middle Route Project of the South-North Water Transfer. Eng. Geol. 1999, 51, 153–165. [Google Scholar] [CrossRef]
- Yang, H.; Zehnder, A.J.B. The South-North Water Transfer Project in China. Water Int. 2015, 30, 339–349. [Google Scholar] [CrossRef]
- Zhang, Q. The South-to-North Water Transfer Project of China: Environmental implications and monitoring strategy. J. Am. Water Resour. Assoc. 2009, 45, 1238–1247. [Google Scholar] [CrossRef]
- Freeman, C. Quenching the Dragon’s Thirst: The South-North Water Transfer Project—Old Plumbing for New China? China Environment Forum, Woodrow Wilson International Center for Scholars: Washington, DC, USA, 2011. [Google Scholar]
| Disclaimer/Publisher’s Note: The statements, opinions and data contained in all publications are solely those of the individual author(s) and contributor(s) and not of MDPI and/or the editor(s). MDPI and/or the editor(s) disclaim responsibility for any injury to people or property resulting from any ideas, methods, instructions or products referred to in the content. |
© 2023 by the authors. Licensee MDPI, Basel, Switzerland. This article is an open access article distributed under the terms and conditions of the Creative Commons Attribution (CC BY) license (https://creativecommons.org/licenses/by/4.0/).


