1. Introduction
It is well established that data assimilation—the mathematical discipline for the combination of model information with different types of observations—provides the optimum initial state to improve the results of numerical weather prediction (NWP) forecasts [
1]. Within this framework, of crucial importance to NWP models are wind data, as they play a decisive role in the formulation of the atmospheric circulation patterns that lead the weather forecasting process. Additionally, it has also been confirmed that satellite radiances are vital to the quality of NWP products [
2]. Nevertheless, the resulting wind simulations have intrinsic uncertainties due to various factors, including the model’s spatial and temporal resolution, approximations in the physical parameterization schemes, and errors in the boundary conditions.
The World Meteorological Organization’s Rolling Review of Requirements has identified wind profiles as the most important atmospheric variable that is not being sufficiently documented by existing or planned observation systems. Towards this direction, several research works [
3,
4,
5,
6] have suggested the possible benefits of improving wind profile measurements for NWP.
With the goal of overcoming the current lack of wind data within the global observing system, on 22 August 2018, the European Space Agency (ESA) successfully launched Aeolus, a cutting-edge-technology satellite of unique payload, and established Europe’s first use of space-borne lidar technology: the Doppler Wind Lidar (DWL). This is an achievement of enormous scientific significance, since it offers a rare chance to emphasize the importance of wind profiles collected from satellites in improving NWP models. The DWL payload allows the satellite to collect accurate wind profile readings from orbit, a crucial feature in closing the current gap in worldwide wind measurements by obtaining thorough and precise data on atmospheric winds. As a consequence of this vital information, Aeolus is expected to contribute to the advancement of NWP models and improve their potential for more reliable and accurate meteorological products. In particular, the impact of Aeolus on short-range forecasts was found to be comparable to certain other well-known satellite monitoring systems lately employed by the European Centre for Medium-Range Weather Forecasts (ECMWF). Given that Aeolus, as a single sensor on a satellite, represents less than 1% of the assimilation observations, this conclusion is extremely encouraging. Numerous scientific studies [
7,
8,
9,
10,
11] have validated the favorable results that resulted from the integration of Aeolus wind data in global and local area NWP models. Of particular importance were the findings at ECMWF that Aeolus data were significantly enhancing the performance of the global observing system and their subsequent activation in the operational data assimilation of the ECMWF on 9 January 2020 [
9,
10].
In order to assess the Aeolus-assimilated data to demonstrate any superiority over assimilation data without them, a severe weather event, specifically a part of the development of IANOS Tropical-Like System (TLC) or medicane, is considered. Due to its exceptional scientific challenge as well as its most serious social impact, this is a notably well-studied case from many perspectives. These aspects have been thoroughly addressed in several current works regarding its meteorological and remote-sensing characteristics as well considerations regarding the socioeconomic hazards that resulted [
12,
13,
14,
15,
16,
17] and references therein. This study’s goal is to investigate the existence of any qualitative and quantitative differences and improvements, especially regarding precipitation, resulting from the assimilation of Aeolus data, using the last version of the state-of-the-art non-hydrostatic regional COSMO model [
18,
19,
20,
21]. For this reason, the model was utilized in hindcast mode starting from 17 September 2020 at 00 UTC and for 48 h lead time. It was forced by the ECMWF 6 h available analysis with and without the assimilation of Aeolus data. Certain comparative graphs between the two runs are also given to highlight the overall behavior regarding the overall accumulated precipitation and mean sea level pressure (PMSL).
2. Materials and Methods
2.1. Aeolus Satellite
The successful deployment of the Aeolus satellite by the ESA on 22 August 2018 brought a remarkable advancement in the field of Earth observation. Aeolus has a primary objective of providing highly accurate and detailed wind component profiles spanning from the Earth’s surface to the lower stratosphere. This mission is made possible through the utilization of the groundbreaking DWL instrument known as the Atmospheric LAser Doppler Instrument (ALADIN).
ALADIN emits pulses of laser light at a 50.5 Hz frequency and a wavelength of 354.8 nm while operating in the ultraviolet region of the electromagnetic spectrum. The light that is released interacts with the atmosphere of the Earth and experiences numerous scattering processes. The backscattered light is collected via Mie scattering, which results from interactions with particulates such aerosols, cloud droplets, and ice crystals, and Rayleigh scattering, which is brought on by interactions with air molecules [
22,
23]. The signals that are backscattered are further examined inside the ALADIN apparatus. The Rayleigh channel concentrates on capturing the backscatter from molecules in clean air using a double Fabry–Pérot spectrometer. The Mie channel, on the other hand, uses a Fizeau spectrometer particularly to record backscatter from particles. Due to the movement of atmospheric scatterers in relation to the instrument’s view projection, the returned signal undergoes a Doppler shift [
22,
23], which is precisely determined by contrasting the backscatter frequency with the instrument’s emitted frequency.
The advanced on-board electronics used by ALADIN divide the signal into height bins to produce detailed wind component profiles. Each of the 24 vertical bins on Aeolus is designed for a particular range of altitudes. These bins steadily get bigger as higher integer multiples of 250 m are reached. Because of the Aeolus vertical sampling system’s adaptability, it is possible to modify the range bin settings and tailor the sample plan to the particular climate zone that the mission would experience. Previous studies [
22,
23] provide an in-depth investigation of ALADIN’s design, performance, and accomplishments, including the laser transmitter, receiver optics, and initial mission data.
2.2. Medicane IANOS
Medicanes, cyclonic meteorological systems with tropical-like characteristics, have been well established as a critical factor seriously affecting the Mediterranean area [
24]. As a realization of this critical weather development, IANOS, a powerful Mediterranean medicane, appeared during the period of 15–20 September 2020, covering an extended track of around 2000 km of mainly marine area [
13,
15,
16]. It heavily impacted Greece, causing 4 fatalities and significant damages over the western and central regions of the country, due to strong to violent storm gale with observed wind gusts up to 54 m/s over Cephalonia Island and enormous amounts of rainfall to several Ionian Islands and parts of central Greece [
13]. The hazardous precipitation events led to flash floods and river flooding in various areas, particularly impacting the islands of Cephalonia and Zakynthos (Ionian Sea), as well as central Greece. The storm winds associated with the medicane caused severe damage to the infrastructure and the environment, resulting in power outages and uprooted trees. Coastal areas also faced the impact of the rough to very rough sea state, with coastal erosion and storm surge along the affected coastlines.
The premier significance of this event motivated the publication of numerous cutting-edge works in almost every area of the atmospheric sciences, like synoptic meteorology, marine meteorology, observation methodologies, and remote-sensing and numerical weather prediction, global as well as regional [
7,
8,
9,
10,
11,
25,
26,
27,
28]. These efforts should be considered of benchmark character, as they bring together the very latest advances focused on the same critical subject. This is an endeavor of foremost importance towards exceptional scientific progress that is currently immensely needed for the benefit of the economy and society in its entirety.
2.3. COSMO Model Investigation
The most recent COSMO.v6 (previously LM) NWP model was used [
18,
19,
20,
21] to examine the possible qualitative transfer of the advances in data assimilation resulting from the Aeolus project to local NWP. The COSMO consortium (
www.cosmo-model.org, accessed on 24 October 2023) has used the COSMO model as an exceptional resource for operational, research, and development purposes. Τhanks to its continuous improvement and compliance to the highest scientific and technical standards over the course of about 25 years [
21], the COSMO model stands as a cutting-edge, particularly adaptable tool in numerical weather prediction applications. Of particular importance have been the recent advancements in the physical parameterization and performance optimization via the systematic understanding of model sensitivity [
29,
30].
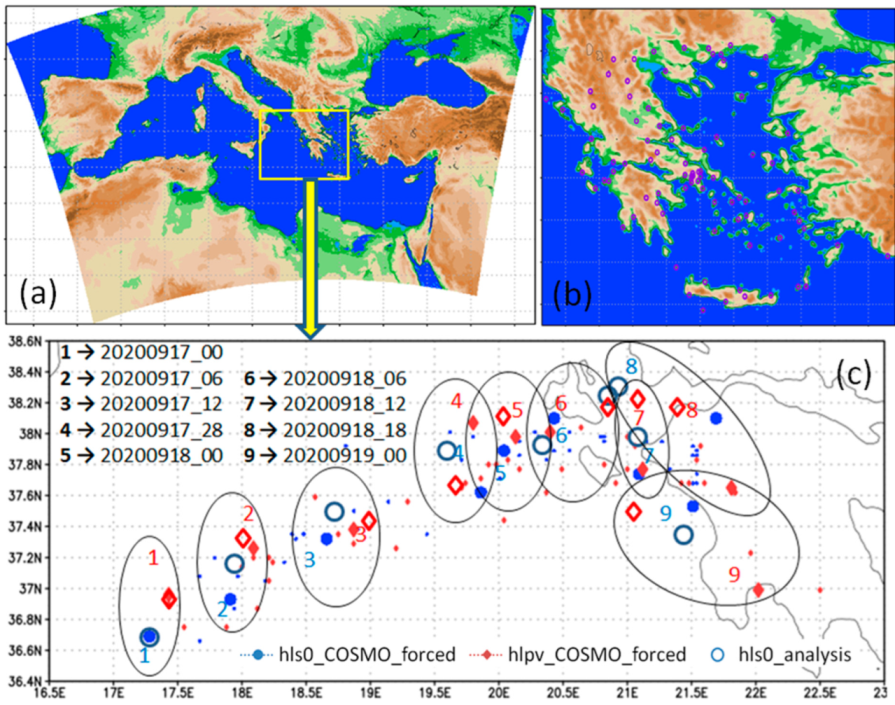
The model is run on a horizontal grid width of 0.03° (~3.5 km, in line with [
12], who simulated the same medicane) over a domain covering the wider Mediterranean area (
Figure 1a), for a total of 1367 × 834 grid points, 60 vertical levels up to 23 km above sea level, and an integration time step of 30 s. This setup is considered as an excellent compromise regarding the size of a very complex domain. It is able to sufficiently capture all the synoptic features as well as the local-scale weather phenomena of the target area (
Figure 1b) of our study that is related to the part of Greece that was most affected by the medicane. The overall model setup was close to that of COSMO_DE, which is presented in detail in [
31].
This setup was considered as most suitable in the investigation of the considered extreme weather event by adding value with the inclusion of the high-resolution data from Aeolus. It offers a unique opportunity to utilize the positive impact of this novel observational resource with the available observations.
The COSMO model was utilized in hindcast mode over a period of 48 h, starting from 17 September 2020 at 00 UTC. It was forced by the available 6 h analysis with and without data assimilation of Aeolus products, denoted as
hls0 and
hlpv, respectively, from the corresponding experimental runs of the global model of the ECMWF [
7,
8]. This time frame was considered suitable for capturing the comparative evolution of the development and progression of the medicane over the period that effected Greece the most, especially regarding precipitation, the focal point of this study. It also captures the main value of regional NWP as short-range tools with lead times of no more than 2 days.
The computations were performed at the new Atos supercomputing system at ECMWF [
32] with the computational resources available to the Hellenic National Meteorological Service (HNMS).
3. Results
The synoptic situation associated with medicane IANOS has been extensively analyzed in all relevant studies mentioned. In this work, we focus on the model results regarding detailed analysis of PMSL, the most crucial meteorological issue in direct connection to the most hazardous one, the accumulated precipitation. Our approach is guided by the strong cyclonic features of the medicane.
The first
Section 3.1, is focused on PMSL patterns and their differences around the deep low in the marine areas of the severe storm until it reached the coastline of western Pelopennese and the nearby Ionian Islands. Special attention was given to the relative positions of the medicane centers and the corresponding lowest PMSL values that determine its tracking (
Figure 1c,
Figure 2 and
Figure 3). The comparison of the two hindcasts forced with and without Aeolus-assimilated data was visually addressed with the analysis of the German Weather Service (DWD) [
33] in
Figure 4. Τhe PMSL of the model runs at the locations of the HNMS synoptic stations (
Figure 1b) is evaluated against the observed values over the whole 48 h simulation period (
Figure 5). The corresponding average values over all stations along with the associated mean bias (MBE) and mean absolute (MAE) errors are also given in the same figure.
In the second
Section 3.2, the precipitation for the target area is presented along with the differences in the model runs in 12 h intervals (
Figure 6) to show any distinct differences that may be considered important due to the extreme nature of the event. A comparative evaluation regarding the HNMS synoptic stations is displayed via the evaluation of the equitable threat scores (ETS) in
Figure 7.
3.1. Medicane Tracking Analysis via PMSL
In order to place this work directly within the framework of the extended literature related to the IANOS medicane, the tracking of the PMSL minimum associated with the development of the event is presented. This was realized in comparative fashion regarding the runs with and without the inclusion the Aeolus products in the data assimilation of the analysis boundary conditions used for the model forcing. In
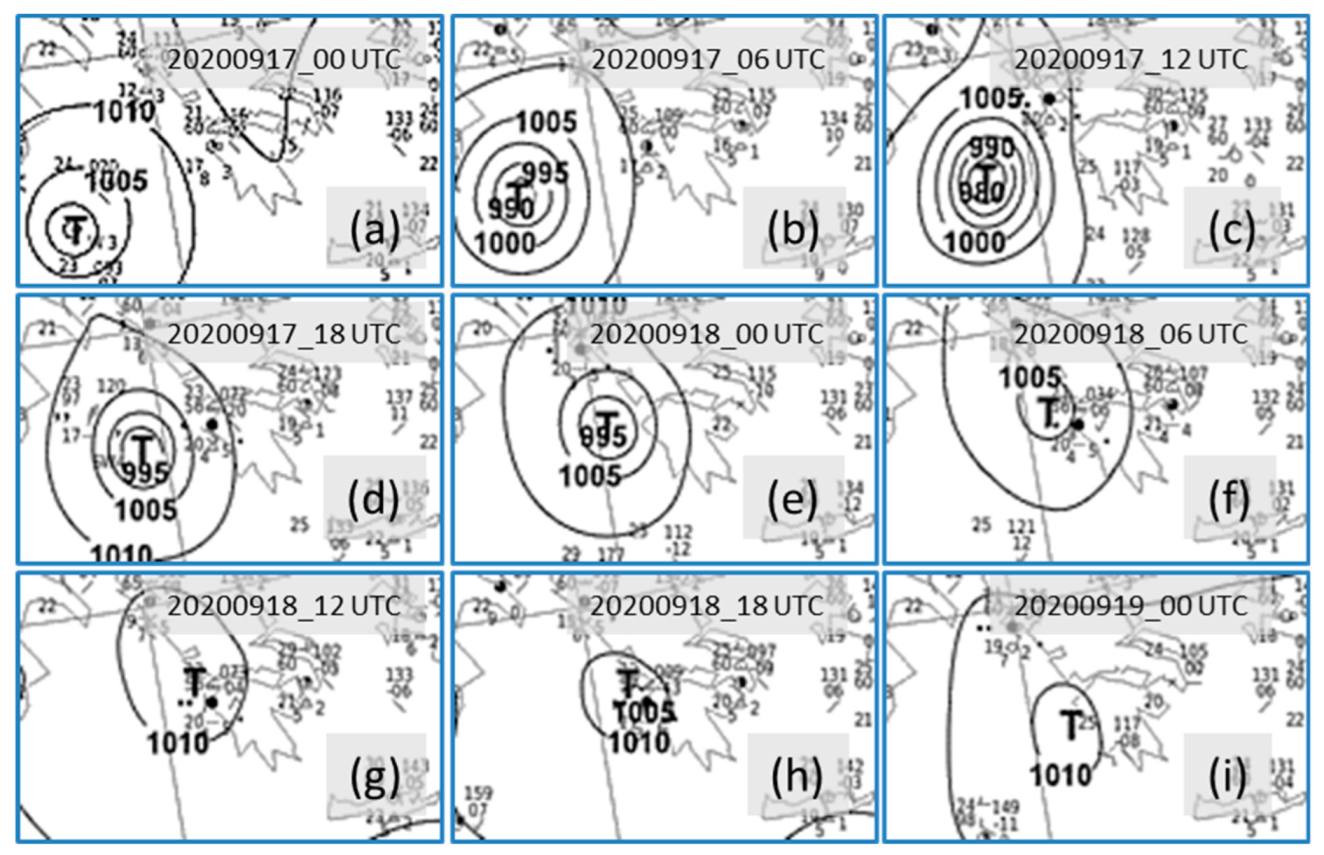
Figure 1c, the PMSL is displayed for the 48 h hindcast runs covering the period from 17 September 00 UTC to 19 September 00 UTC, 2020. It should be noted that in this figure, the dates regarding the hindcast runs are kept the same as the analysis times, although they refer to the times after the hindcast start—for example, 20200918_12 refers to the 36th hour of the hindcast run.
The tracking
with Aeolus assimilation is shown with
blue circles, and the tracking
without it with
red diamond legends, a color convention used throughout this work. The numbered 1 to 9
larger closed legends refer to the hindcast results every six hours, with the corresponding dates and times given in the upper left corner of the figure. The smaller legends refer to the hourly medicane track. For the same lead time, the distances of the tracking points with and without Aeolus-assimilated data (closed blue- and red-colored legends, respectively) are on a scale of 0.2° (~20 km) with the exception of the last point (9), referring to 19 September 00 UTC. For this point, the difference is more than 60 km, with the Aeolus point located in the Kyparissian Golf in western Peloponnese and the non-Aeolus point in the Messinian Gulf in southern Peloponnese. With the exception of this point, there is generally good agreement with those provided by the literature, especially the sources listed in [
14,
16,
17]. The differences may be attributed to the fact that these works were based on different analyses (e.g., final analysis of NCEP, ERA-5 reanalysis, and the operational ECMWF analyses). Regarding the last track point, the Aeolus hindcast is clearly favored.
This observation was further checked by taking the PMSL analyses of both experiments for the nine dates and times in the upper left of
Figure 1c. The resulting tracking points are also displayed in
Figure 1c with the open legends. These points are in relative agreement with those of the 48 h hindcast displayed with closed legends. As expected, they coincide with those in the beginning of the hindcast, but they depart from the corresponding ones as the hindcast progresses. It is very interesting to note, however, that the last point (point 9) of the PMSL analysis without Aeolus data is in the relatively proper place of the Kyparissian Golf. Thus, it looks like the model synergies of the hindcast run
without Aeolus spatially
devaluate the PMSL track as the hindcast progresses. In order to better visualize the above analysis, the abovementioned tracking points are circled in groups of four with ellipses according to their corresponding times.
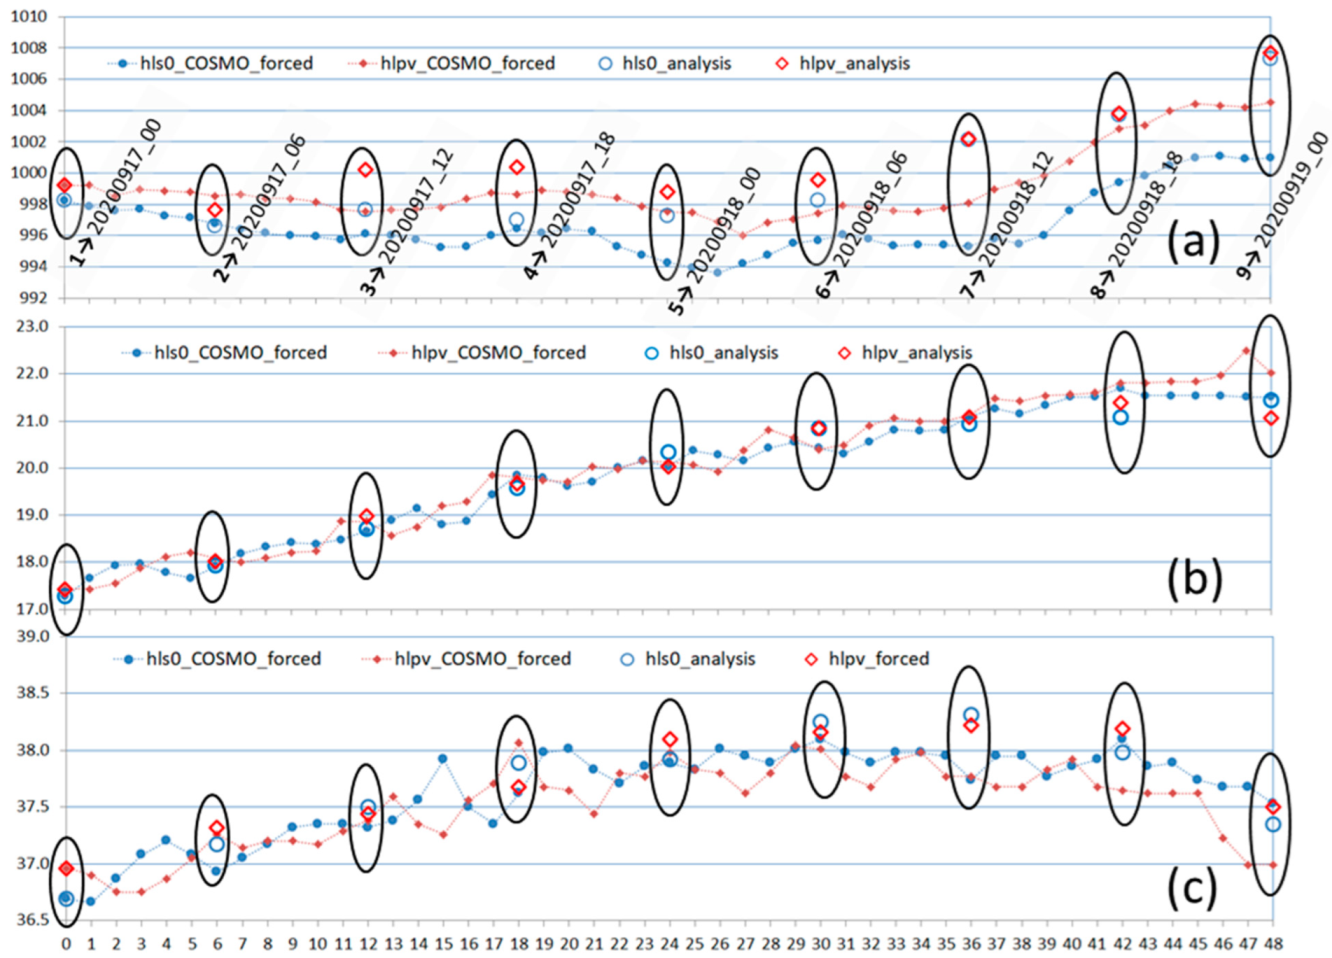
The abovementioned convention is kept in
Figure 2 and further illuminates the previous comments.
Figure 2a shows that the PMSL minimum values of the Aeolus hindcast (closed blue circles) are lower than those of the non-Aeolus hindcast (closed red diamonds). Regarding geographical longitude (
Figure 2b) and latitude (
Figure 2c), the trackings are relatively close, with the exception of the end of the period, when they diverge in favor of Aeolus with respect to analysis.
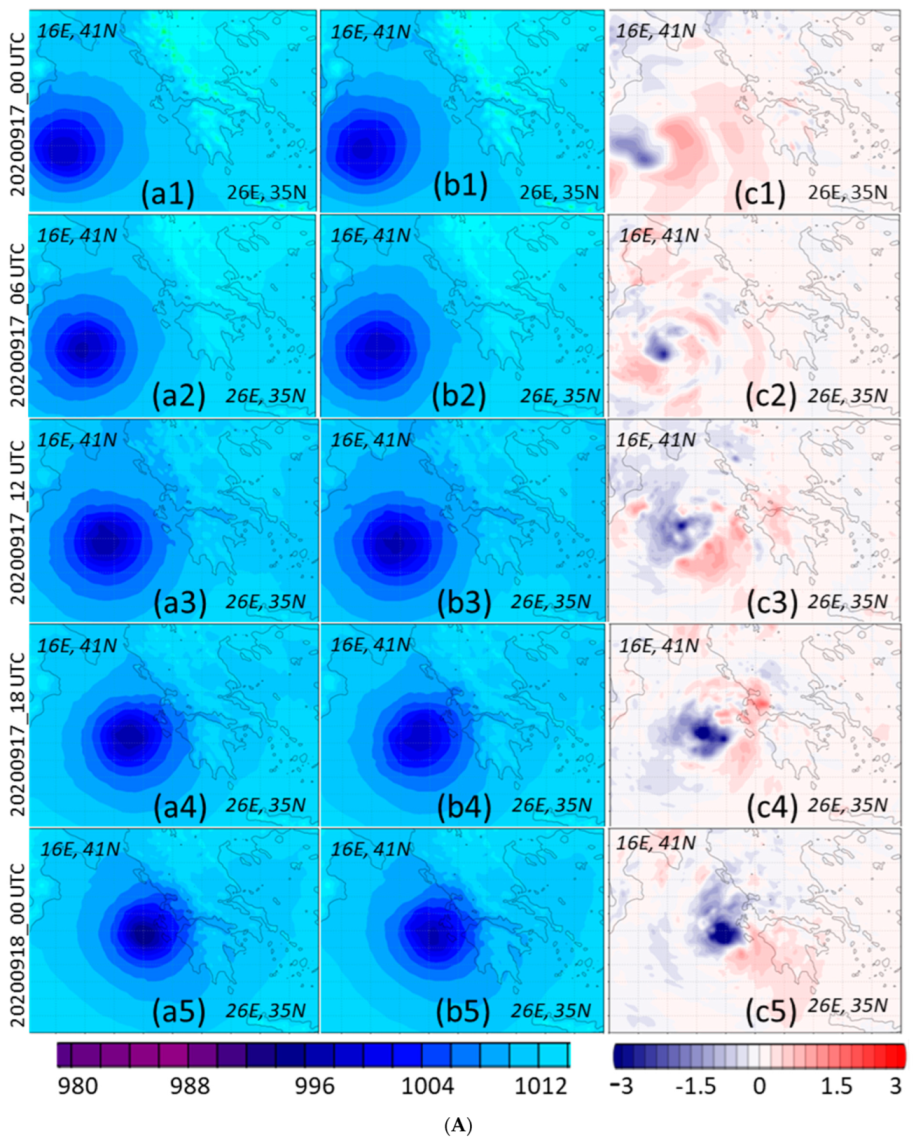
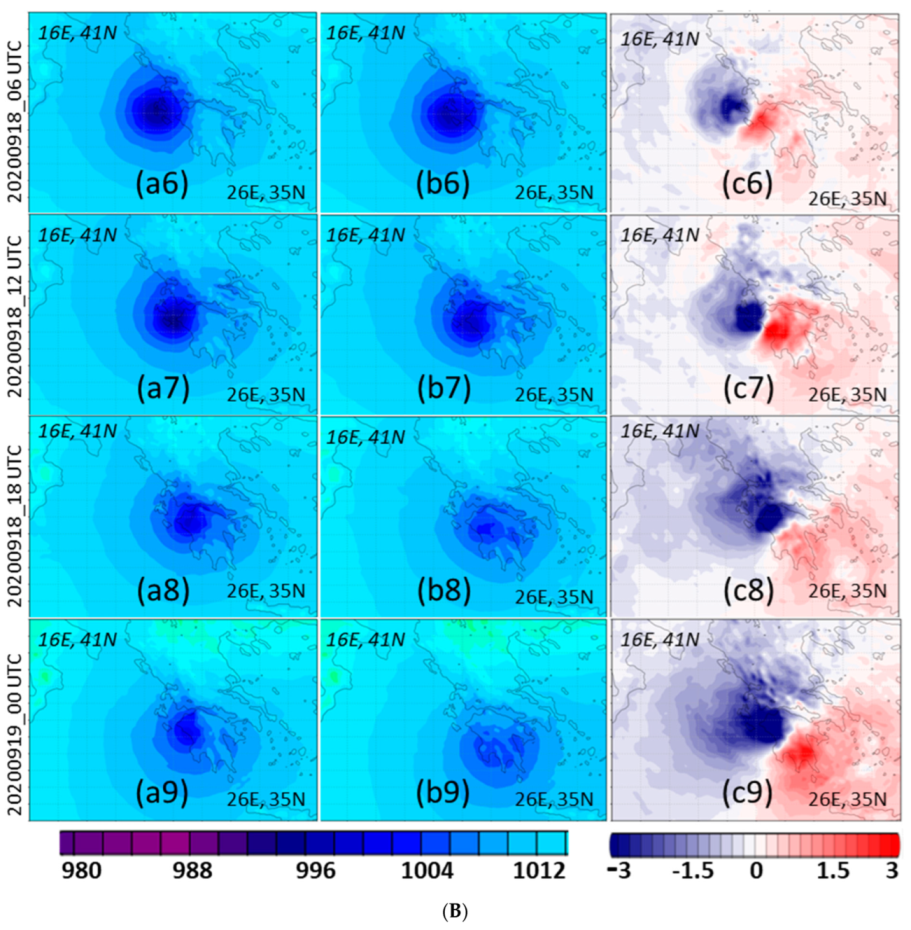
These features are highlighted in
Figure 3A,B. Here, the PMSL of the target area is shown for the hindcasts with (left column) and without Aeolus (middle column)-assimilated data. From their differences (right column), it becomes clear that the medicane with Aeolus-assimilated data is deeper, regarding PMSL, located relatively north as it approaches the coastline. As an independent objective comparison, the hindcasts can be compared with the PMSL analysis of the German Weather Service (DWD) [
33] (
Figure 4). Again, it is clear from
Figure 3B(a9,b9) and
Figure 4i that the PMSL of the medicane without Aeolus assimilation is misplaced at the end of the period in contrast to the Aeolus hindcast.
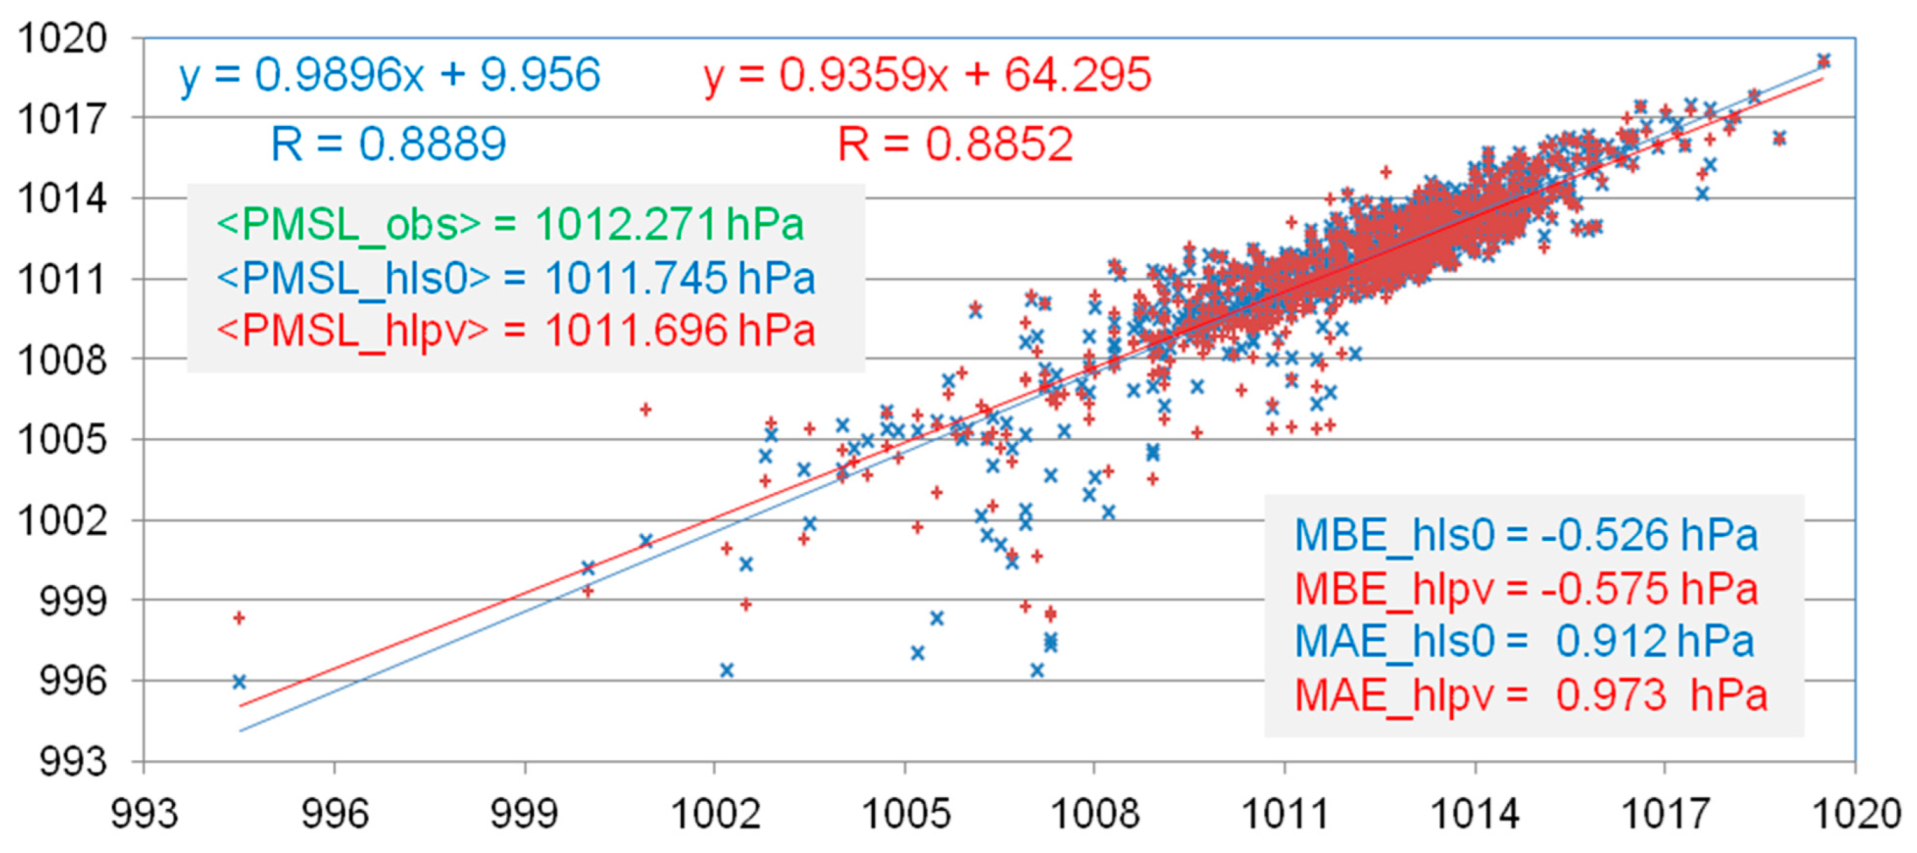
A scatter plot of the PMSL for the model values of the hindcasts against available observations from the Greek meteorological stations (
Figure 1b) is given in
Figure 5. The model values from the Aeolus hindcast are better correlated, as can be seen from the corresponding trend lines and correlation coefficients (R) against the non-Aeolus hindcast. A similar feature stands true for the corresponding average over all stations, where Aeolus is closer to observations along with the mean bias (MBE) and mean absolute (MAE) errors, which are both smaller for Aeolus. Their values displayed also in
Figure 5.
3.2. Precipitation Evaluation
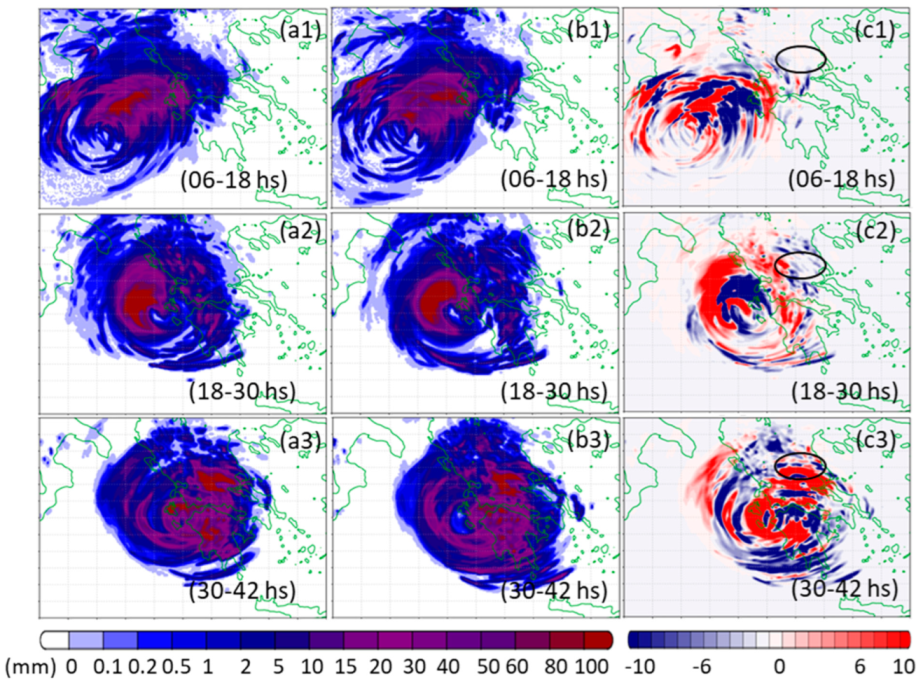
The precipitation associated with the medicane is displayed in
Figure 6. The accumulated precipitation is given in 12 h intervals to comply with the observed values of the available meteorological stations. The considered periods are from 17 September 06 UTC to 18 September 18 UTC. In the left and middle columns, the hindcast precipitation with and without Aeolus assimilation is presented along with the differences between the two given in the right column.
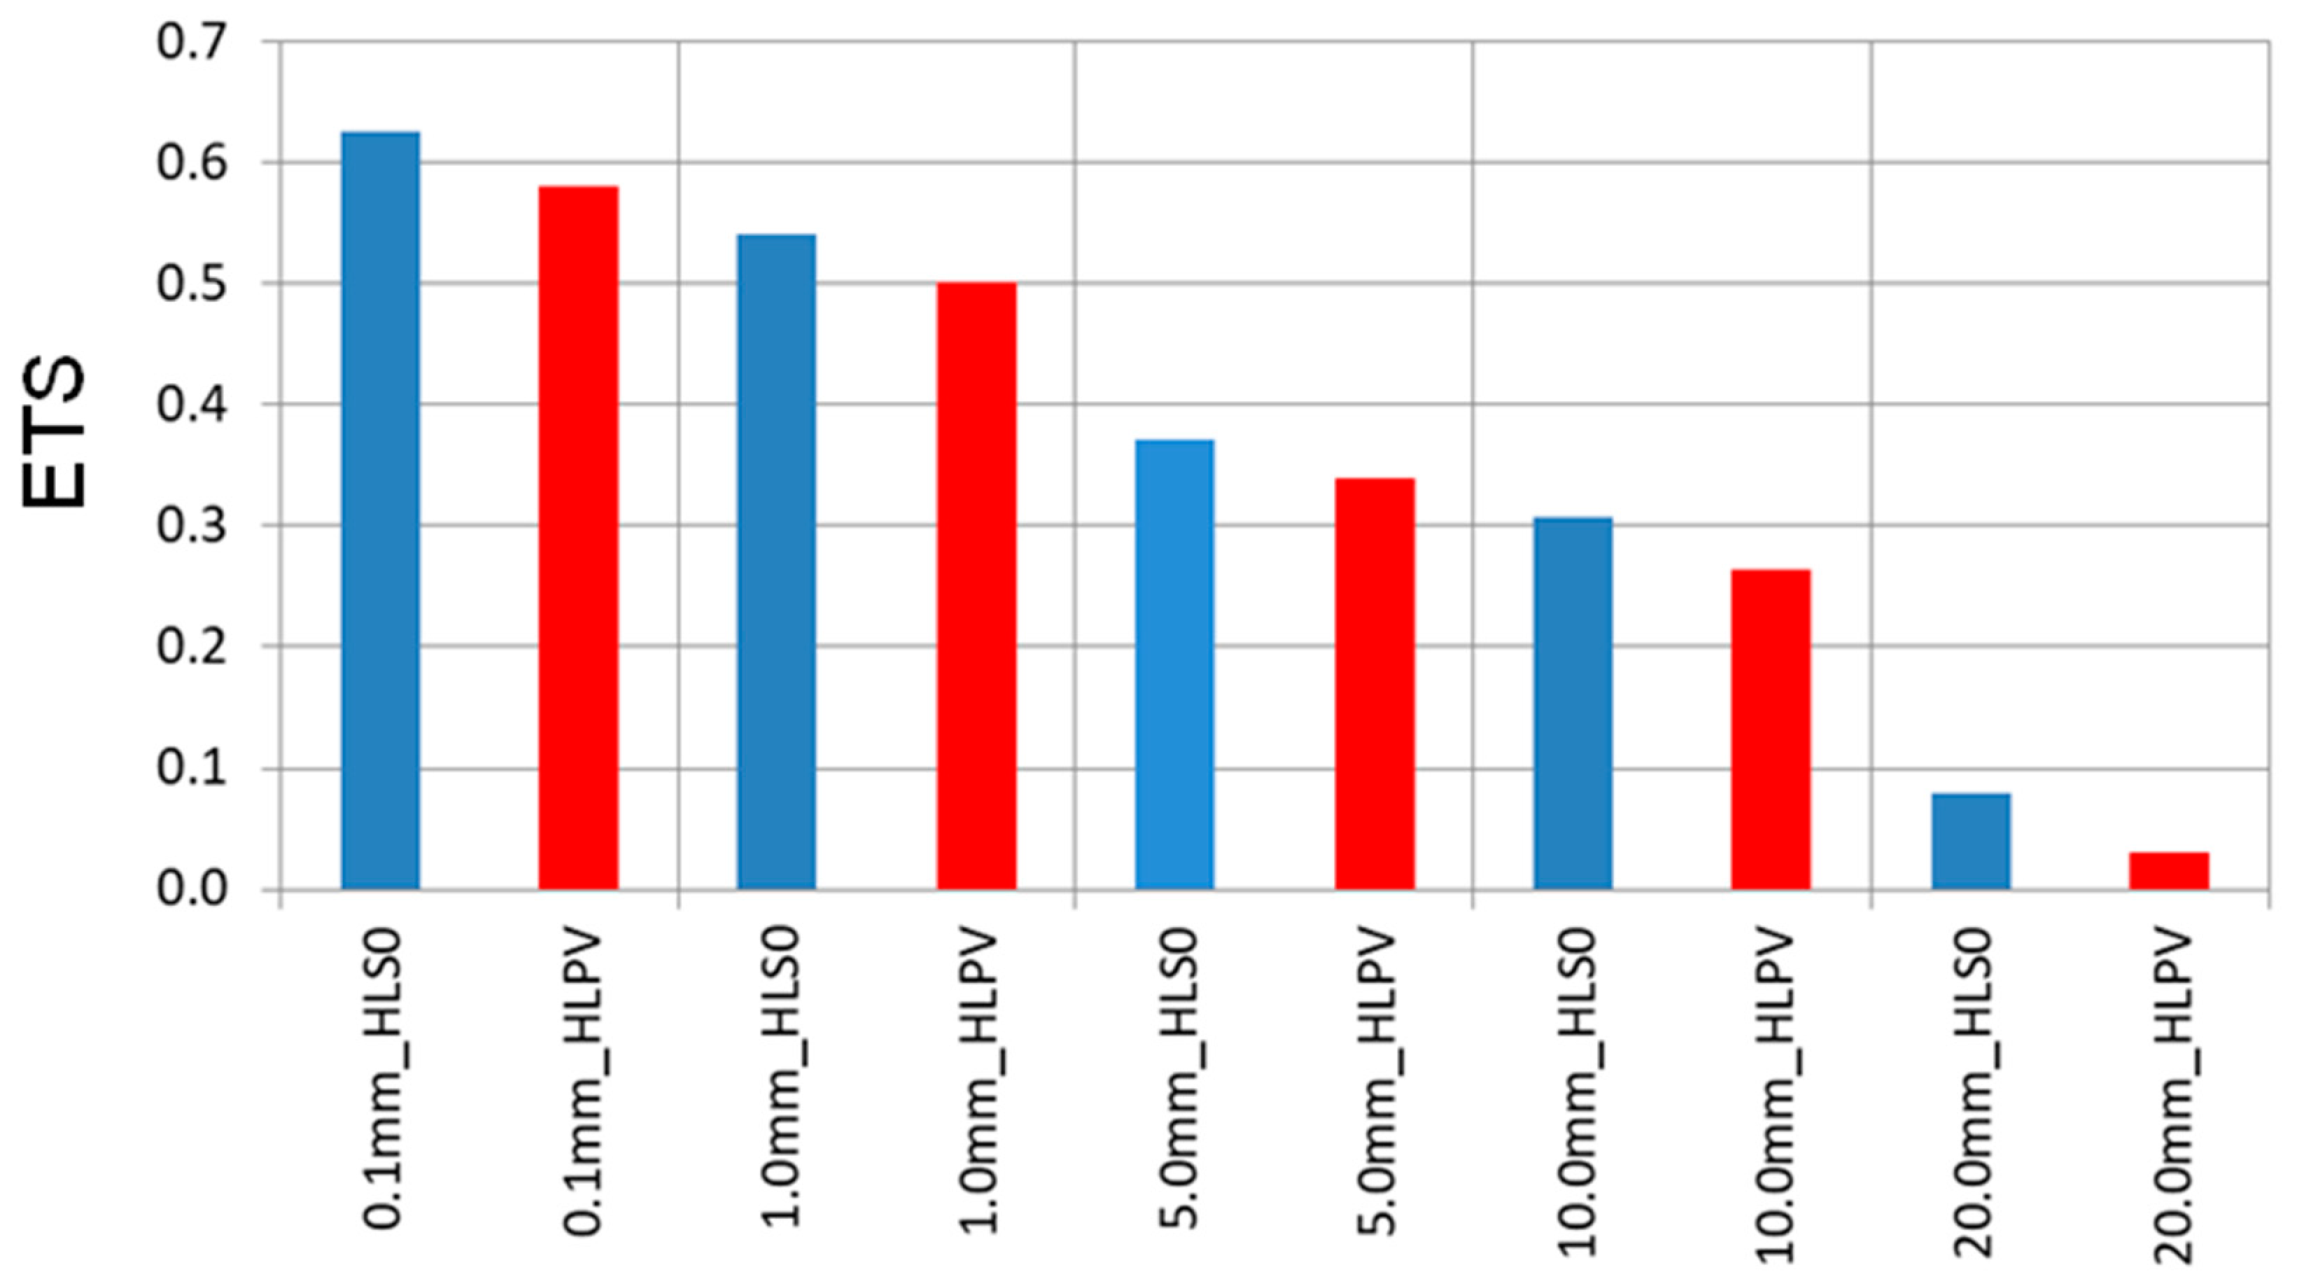
Both runs show clearly the extreme precipitation that was recorded in the western and central parts of the country. However, their differences display a relative increase in the central parts for the Aeolus hindcast. As in PMSL, the evaluated equivalent threat scores (ETS) regarding the synoptic observations favor the Aeolus hindcast for all the considered precipitation thresholds up to 20 mm (
Figure 7).
4. Discussion and Conclusions
On 22 August 2018, the ESA launched the Aeolus satellite, equipped with cutting-edge DWL technology, to address the global wind data deficit. This achievement marked a significant advancement in improving NWP models, as Aeolus could collect highly accurate wind profile data from space, filling a crucial gap in global wind measurements. The successful integration of Aeolus data into NWP models, especially at the ECMWF, led to its operational data assimilation on 9 January 2020.
In a comprehensive study assessing Aeolus’s impact, the authors focused on a severe weather event, the development of the IANOS TLC. In addition to the comparative evaluation of very-high-value remote-sensing data via a regional NWP model, this was a very challenging study. It can be placed alongside a wide number of studies [
7,
8,
9,
10,
11,
25,
26,
27,
28] regarding this extreme weather system, whose strength might be considered a significant warning sign regarding climate change [
34].
The evaluation of Aeolus data was performed with the COSMO model in hindcast mode, utilizing ECMWF analysis data from two experiments. The analyses included the conventional and satellite observations of the operational system of the ECMWF. The analyses of the control experiment (hlpv) did not include the Aeolus assimilation, whereas the ones of the Aeolus experiment (hls0) included Aeolus Rayleigh-clear plus Mie-cloudy assimilation. The first experiment used the assimilated Aeolus data, and the second did not. Particular emphasis was placed on precipitation. Their findings demonstrated that the assimilated Aeolus data closely aligned with ground observations from HNMS synoptic meteorological stations. Comparative graphs revealed notable differences in accumulated precipitation and mean sea level pressure.
Furthermore, the study delved into tracking and modeling results, employing a color-coded legend to distinguish between Aeolus-assimilated and non-Aeolus data. In general, the tracking paths corresponded with existing literature, but a crucial difference emerged at one point when Aeolus data proved advantageous. To investigate this anomaly, the study artificially extracted PMSL data, revealing that the Aeolus-informed path initially aligned with observations but diverged as the hindcast progressed. This suggested that the non-Aeolus run exhibited spatial inaccuracies, particularly regarding PMSL and 12 h accumulated precipitation.
Additional analysis uncovered disparities in PMSL values, longitude, and latitude. The Aeolus hindcast consistently showed lower PMSL values and better alignment with analysis, except for an instance in which Aeolus data indicated deeper PMSL values as IANOS approached the coastline. These findings were corroborated by comparisons with analyses from DWD. From the better threat scores of precipitation as well as the PMSL statistics, it might be tentatively considered, ad hoc, that the improved wind data provided by Aeolus also improve the representation of the atmospheric dynamics, leading to an overall better description of the medicane and its ambient environment in the corresponding hindcast run. Nevertheless, this is a single case, and such a claim might be premature. However, this study marks the beginning of further investigations into severe weather cases preferably spanning all seasons. Further, the methodology presented here is expected to serve as a benchmark and motivation for future efforts within the meteorological community.
Author Contributions
Conceptualization, I.M. and E.A.; methodology, E.A.; software, E.A.; validation, all authors; formal analysis, E.A. and I.P.; investigation, E.A.; resources, E.A. and I.M.; data curation, E.A.; writing—original draft preparation, E.A. and I.M.; writing—review and editing, all authors; visualization, E.A.; supervision, I.M.; project administration, I.M. and P.N. All authors have read and agreed to the published version of the manuscript.
Funding
This research received no external funding.
Data Availability Statement
The model output was stored in the ECMWF’s file storage system (ECFS) in the domain of HNMS. Due to its very large data volume, some arrangements regarding data availability with E.A. might be necessary in connection with the standard policies of ECMWF and HNMS.
Acknowledgments
We would like to express our deep appreciation to the European Organisation for the Exploitation of Meteorological Satellites (EUMETSAT), the European Space Agency (ESA), and the European Centre for Medium-Range Weather Forecasts (ECMWF) for providing invaluable data that has been used in our simulations. We also thank HNMS for providing the computational resources at the ECMWF supercomputing system. We would like to extend our gratitude to Michael Rennie, scientist at ECMWF, for his valuable support in using Aeolus data in our simulation. His expertise and knowledge have been instrumental in ensuring the accuracy and reliability of our analysis.
Conflicts of Interest
The authors declare no conflict of interest.
References
- Simmons, A.J.; Hollingsworth, A. Some aspects of the improvement in skill of numerical weather prediction. Q. J. R. Meteorol. Soc. 2002, 128, 647–677. [Google Scholar] [CrossRef]
- Geer, A.J.; Baordo, F.; Bormann, N.; Chambon, P.; English, S.J.; Kazumori, M.; Lawrence, H.; Lean, P.; Lonitz, K.; Lupu, C. The growing impact of satellite observations sensitive to humidity, cloud and precipitation. Q. J. R. Meteorol. Soc. 2017, 143, 3189–3206. [Google Scholar] [CrossRef]
- Stoffelen, A.; Marseille, G.J.; Bouttier, F.; Vasiljevic, D.; de Haan, S.; Cardinali, C. ADM-Aeolus Doppler wind lidar observing system simulation experiment. Q. J. R. Meteorol. Soc. 2006, 132, 1927–1947. [Google Scholar] [CrossRef]
- Baker, W.E.; Atlas, R.M.; Cardinali, C.; Clement, A.; Emmitt, G.D.; Gentry, B.M.; Hardesty, R.M.; Källén, E.; Kavaya, M.J.; Langland, R.; et al. Lidar-measured wind profiles: The missing link in the global observing system. Bull. Am. Meteorol. Soc. 2014, 95, 543–564. [Google Scholar] [CrossRef]
- Horányi, A.; Cardinali, C.; Rennie, M.; Isaksen, L. The assimilation of horizontal line-of-sight wind information into the ECMWF data assimilation and forecasting system. Part I: The assessment of wind impact. Q. J. R. Meteorol. Soc. 2015, 141, 1223–1232. [Google Scholar] [CrossRef]
- Illingworth, A.J.; Battaglia, A.; Bradford, J.; Forsythe, M.; Joe, P.; Kollias, P.; Lean, K.; Lori, M.; Mahfouf, J.-F.; Mello, S.; et al. WIVERN: A new satellite concept to provide global in-cloud winds, precipitation and cloud properties. Bull. Am. Meteorol. Soc. 2018, 99, 1669–1687. [Google Scholar] [CrossRef]
- Rennie, M.P.; Isaksen, L. The NWP Impact of Aelus Level-2B Winds at ECMWF. Technical Memo 864. ECMWF. 2020. Available online: https://www.ecmwf.int/sites/default/files/elibrary/2020/19538-nwp-impact-aeolus-level-2b-winds-ecmwf.pdf (accessed on 24 October 2023).
- Rennie, M.P.; Isaksen, L.; Weiler, F.; de Kloe, J.; Kanitz, T.; Reitebuch, O. The impact of Aeolus wind retrievals on ECMWF global weather forecasts. Q. J. R. Meteorol. Soc. 2021, 147, 3555–3586. [Google Scholar] [CrossRef]
- Pourret, V.; Šavli, M.; Mahfouf, J.-F.; Raspaud, D.; Doerenbecher, A.; Bénichou, H. Operational assimilation of Aeolus winds in the Météo-France global NWP model ARPEGE. Q. J. R. Meteorol. Soc. 2022, 148, 2652–2671. [Google Scholar] [CrossRef]
- Salonen, K.; Haase, G.; Eresmaa, R.; Hohti, H.; Järvinen, H. Towards the operational use of Doppler radar radial winds in HIRLAM. Atmos. Res. 2011, 100, 190–200. [Google Scholar] [CrossRef]
- Marinescu, P.J.; Cucurull, L.; Apodaca, K.; Bucci, L.; Genkova, I. The characterization and impact of Aeolus wind profile observations in NOAA’s regional tropical cyclone model (HWRF). Q. J. R. Meteorol. Soc. 2022, 148, 3491–3508. [Google Scholar] [CrossRef]
- Varlas, G.; Pytharoulis, I.; Steeneveld, G.-J.; Katsafados, P.; Papadopoulos, A. Investigating the impact of sea surface temperature on the development of the Mediterranean tropical-like cyclone “Ianos” in 2020. Atmos. Res. 2023, 291, 106827. [Google Scholar] [CrossRef]
- Lagouvardos, K.; Karagiannidis, A.; Dafis, S.; Kalimeris, A.; Kotroni, V. Ianos—A Hurricane in the Mediterranean. Bull. Am. Meteorol. Soc. 2022, 103, E1621–E1636. [Google Scholar] [CrossRef]
- Zimbo, F.; Ingemi, D.; Guido, G. The Tropical-like Cyclone “Ianos” in September 2020. Meteorology 2022, 1, 29–44. [Google Scholar] [CrossRef]
- Prat, A.C.; Federico, S.; Torcasio, R.C.; D’Adderio, L.P.; Dietrich, S.; Panegrossi, G. Evaluation of the Sensitivity of Medicane Ianos to Model Microphysics and Initial Conditions Using Satellite Measurements. Remote Sens. 2021, 13, 4984. [Google Scholar] [CrossRef]
- D’Adderio, L.P.; Casella, D.; Dietrich, S.; Sanò, P.; Panegrossi, G. GPM-CO observations of Medicane Ianos: Comparative analysis of precipitation structure between development and mature phase. Atmos Res. 2022, 273, 106174. [Google Scholar] [CrossRef]
- Vourlioti, P.; Mamouka, T.; Agrafiotis, A.; Kotsopoulos, T. Medicane Ianos: 4D-Var Data Assimilation of Surface and Satellite Observations into the Numerical Weather Prediction Model WRF. Atmosphere 2022, 13, 1683. [Google Scholar] [CrossRef]
- Steppeler, J.; Doms, G.; Schättler, U.; Bitzer, H.W.; Gassmann, A.; Damrath, U.; Gregoric, G. Meso-gamma scale forecasts using the nonhydrostatic model LM. Meteorol. Atmos. Phys. 2003, 82, 75–96. [Google Scholar] [CrossRef]
- Baldauf, M.; Seifert, A.; Förstner, J.; Majewski, D.; Raschendorfer, M.; Reinhart, T. Operational Convective-Scale Numerical Weather Prediction with the COSMO Model: Description and Sensitivities. Mon. Weather Rev. 2011, 139, 3887–3905. [Google Scholar] [CrossRef]
- Available online: https://www.cosmo-model.org/content/model/documentation/core/default.htm (accessed on 24 October 2023).
- Available online: https://www.cosmo-model.org/content/model/documentation/journals/default.htm (accessed on 24 October 2023).
- Lux, O.; Wernham, D.; Bravetti, P.; McGoldrick, P.; Lecrenier, O.; Riede, W.; D’Ottavi, A.; De Sanctis, V.; Schillinger, M.; Lochard, J.; et al. High-power and frequency-stable ultraviolet laser performance in space for the wind lidar on Aeolus. Opt. Lett. 2020, 45, 1443–1446. [Google Scholar] [CrossRef]
- Lux, O.; Lemmerz, C.; Weiler, F.; Kanitz, T.; Wernham, D.; Rodrigues, G.; Hyslop, A.; Lecrenier, O.; McGoldrick, P.; Fabre, F.; et al. ALADIN laser frequency stability and its impact on the Aeolus wind error. Atmos. Meas. Tech. 2021, 14, 6305–6333. [Google Scholar] [CrossRef]
- Nastos, P.T.; Karavana Papadimou, K.; Matsangouras, I.T. Mediterranean tropical-like cyclones: Impacts and composite daily means and anomalies of synoptic patterns. Atmos. Res. 2018, 208, 156–166. [Google Scholar] [CrossRef]
- Ferrarin, C.; Pantillon, F.; Davolio, S.; Bajo, M.; Miglietta, M.M.; Avolio, E.; Carrió, D.S.; Pytharoulis, I.; Sanchez, C.; Patlakas, P.; et al. Assessing the coastal hazard of Medicane Ianos through ensemble modeling. Nat. Hazards Earth Syst. Sci. 2023, 23, 2273–2287. [Google Scholar] [CrossRef]
- Toomey, T.; Amores, A.; Marcos, M.; Orfila, A.; Romero, R. Coastal Hazards of Tropical-Like Cyclones Over the Mediterranean Sea. J. Geophys. Res. Oceans 2022, 127, e2021JC017964. [Google Scholar] [CrossRef]
- Diakakis, M.; Mavroulis, S.; Filis, C.; Lozios, S.; Vassilakis, E.; Naoum, G.; Soukis, K.; Konsolaki, A.; Kotsi, E.; Theodorakatou, D.; et al. Impacts of Medicanes on Geomorphology and Infrastructure in the Eastern Mediterranean, the Case of Medicane Ianos and the Ionian Islands in Western Greece. Water 2023, 15, 1026. [Google Scholar] [CrossRef]
- Androulidakis, Y.; Makris, C.; Mallios, Z.; Pytharoulis, I.; Baltikas, V.; Krestenitis, Y. Storm surges and coastal inundation during extreme events in the Mediterranean Sea: The IANOS Medicane. Nat. Hazards 2023, 117, 939–978. [Google Scholar] [CrossRef]
- Avgoustoglou, E.; Voudouri, A.; Carmona, I.; Bucchignani, E.; Levi, Y.; Bettems, J.-M. A Methodology towards the Hierarchy of COSMO Parameter Calibration Tests via the Domain Sensitivity Over the Mediterranean Area. COSMO Technical Report No. 42. 2020. Available online: http://www.cosmo-model.org/content/model/cosmo/techReports/docs/techReport42.pdf (accessed on 24 October 2023). [CrossRef]
- Avgoustoglou, E.; Carmona, I.; Voudouri, A.; Levi, Y.; Will, A.; Bettems, J.M. Calibration of COSMO model in the Central-Eastern Mediterranean area adjusted over the domains of Greece and Israel. Atmos. Res. 2022, 279, 106362. [Google Scholar] [CrossRef]
- Available online: https://www.dwd.de/EN/specialusers/research_education/seminar/2018/cosmo_training_2018/tutorial18_en.pdf?__blob=publicationFile&v=2 (accessed on 24 October 2023).
- Description. Available online: https://www.ecmwf.int/en/computing/our-facilities/supercomputer-facility (accessed on 24 October 2023).
- Available online: https://www.wetter3.de/archiv_dwd_dt.html (accessed on 24 October 2023).
- Available online: https://en.wikipedia.org/wiki/Cyclone_Ianos (accessed on 26 October 2023).
| Disclaimer/Publisher’s Note: The statements, opinions and data contained in all publications are solely those of the individual author(s) and contributor(s) and not of MDPI and/or the editor(s). MDPI and/or the editor(s) disclaim responsibility for any injury to people or property resulting from any ideas, methods, instructions or products referred to in the content. |
© 2023 by the authors. Licensee MDPI, Basel, Switzerland. This article is an open access article distributed under the terms and conditions of the Creative Commons Attribution (CC BY) license (https://creativecommons.org/licenses/by/4.0/).


 ,
, 


