
Water–Rock Interactions, Genesis Mechanism, and Mineral Scaling of Geothermal Waters in Northwestern Sichuan, SW China


Abstract
:1. Introduction
2. Materials and Methods
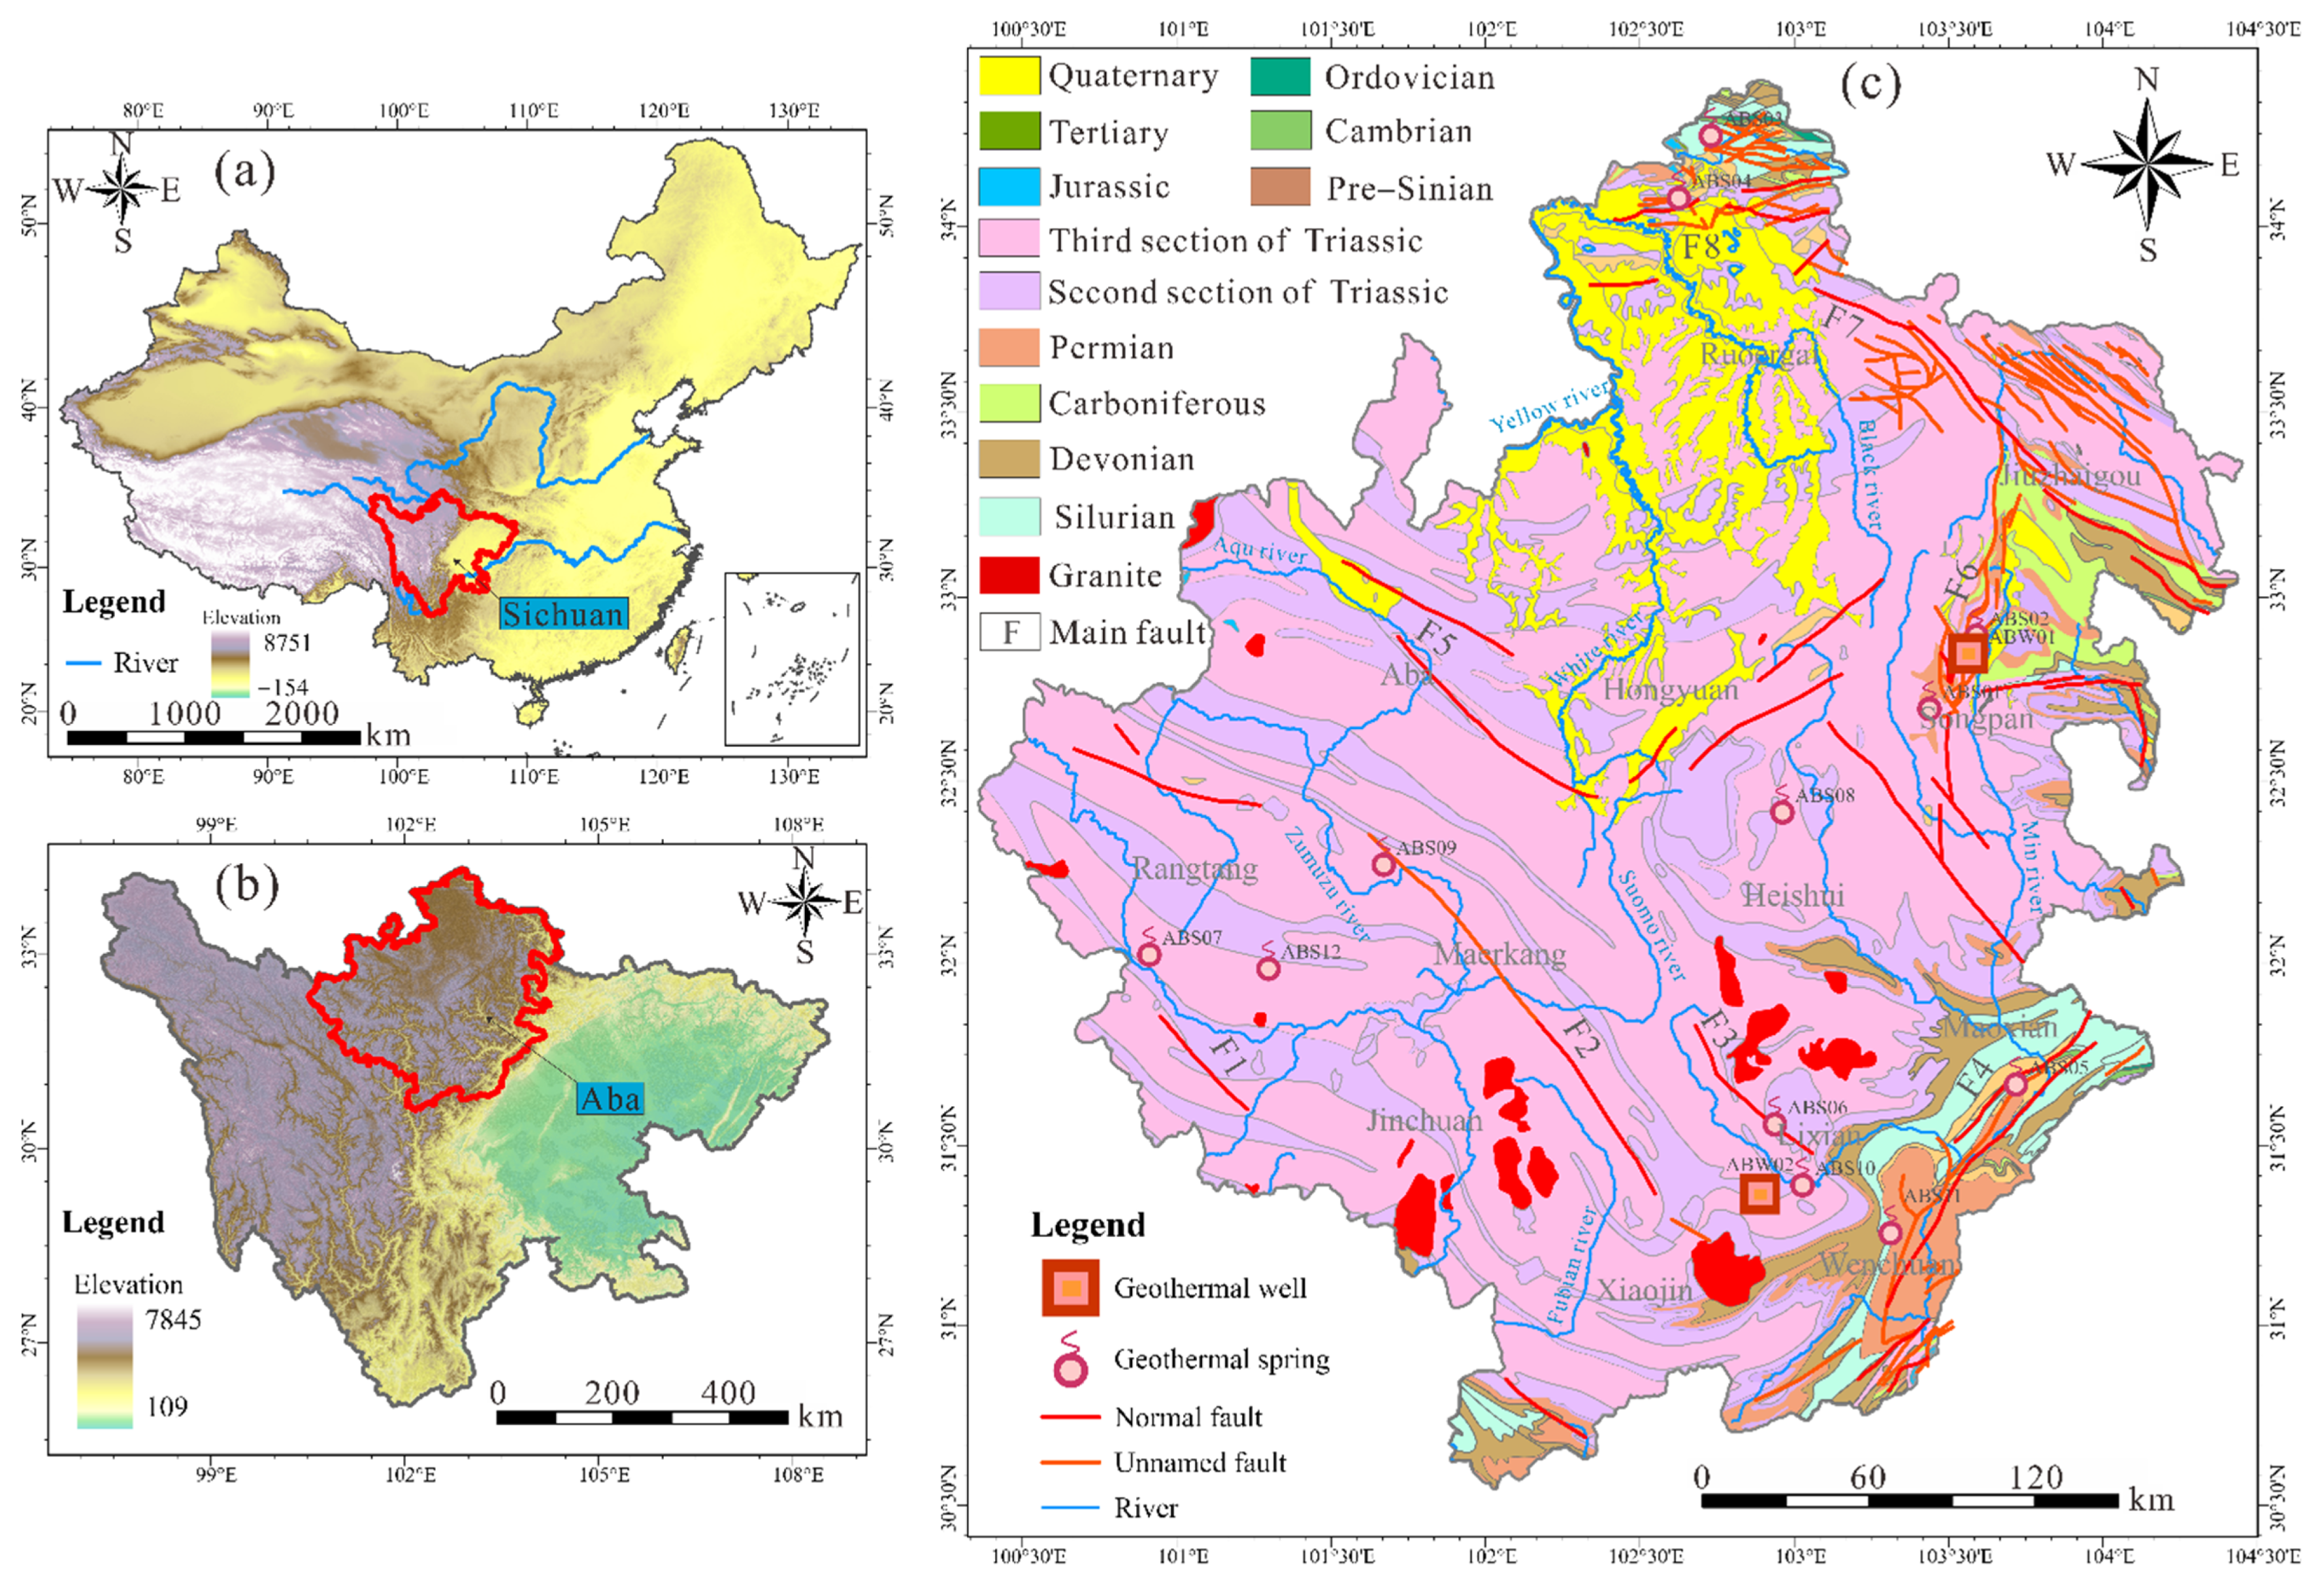
2.1. Geological Setting
2.2. Methods
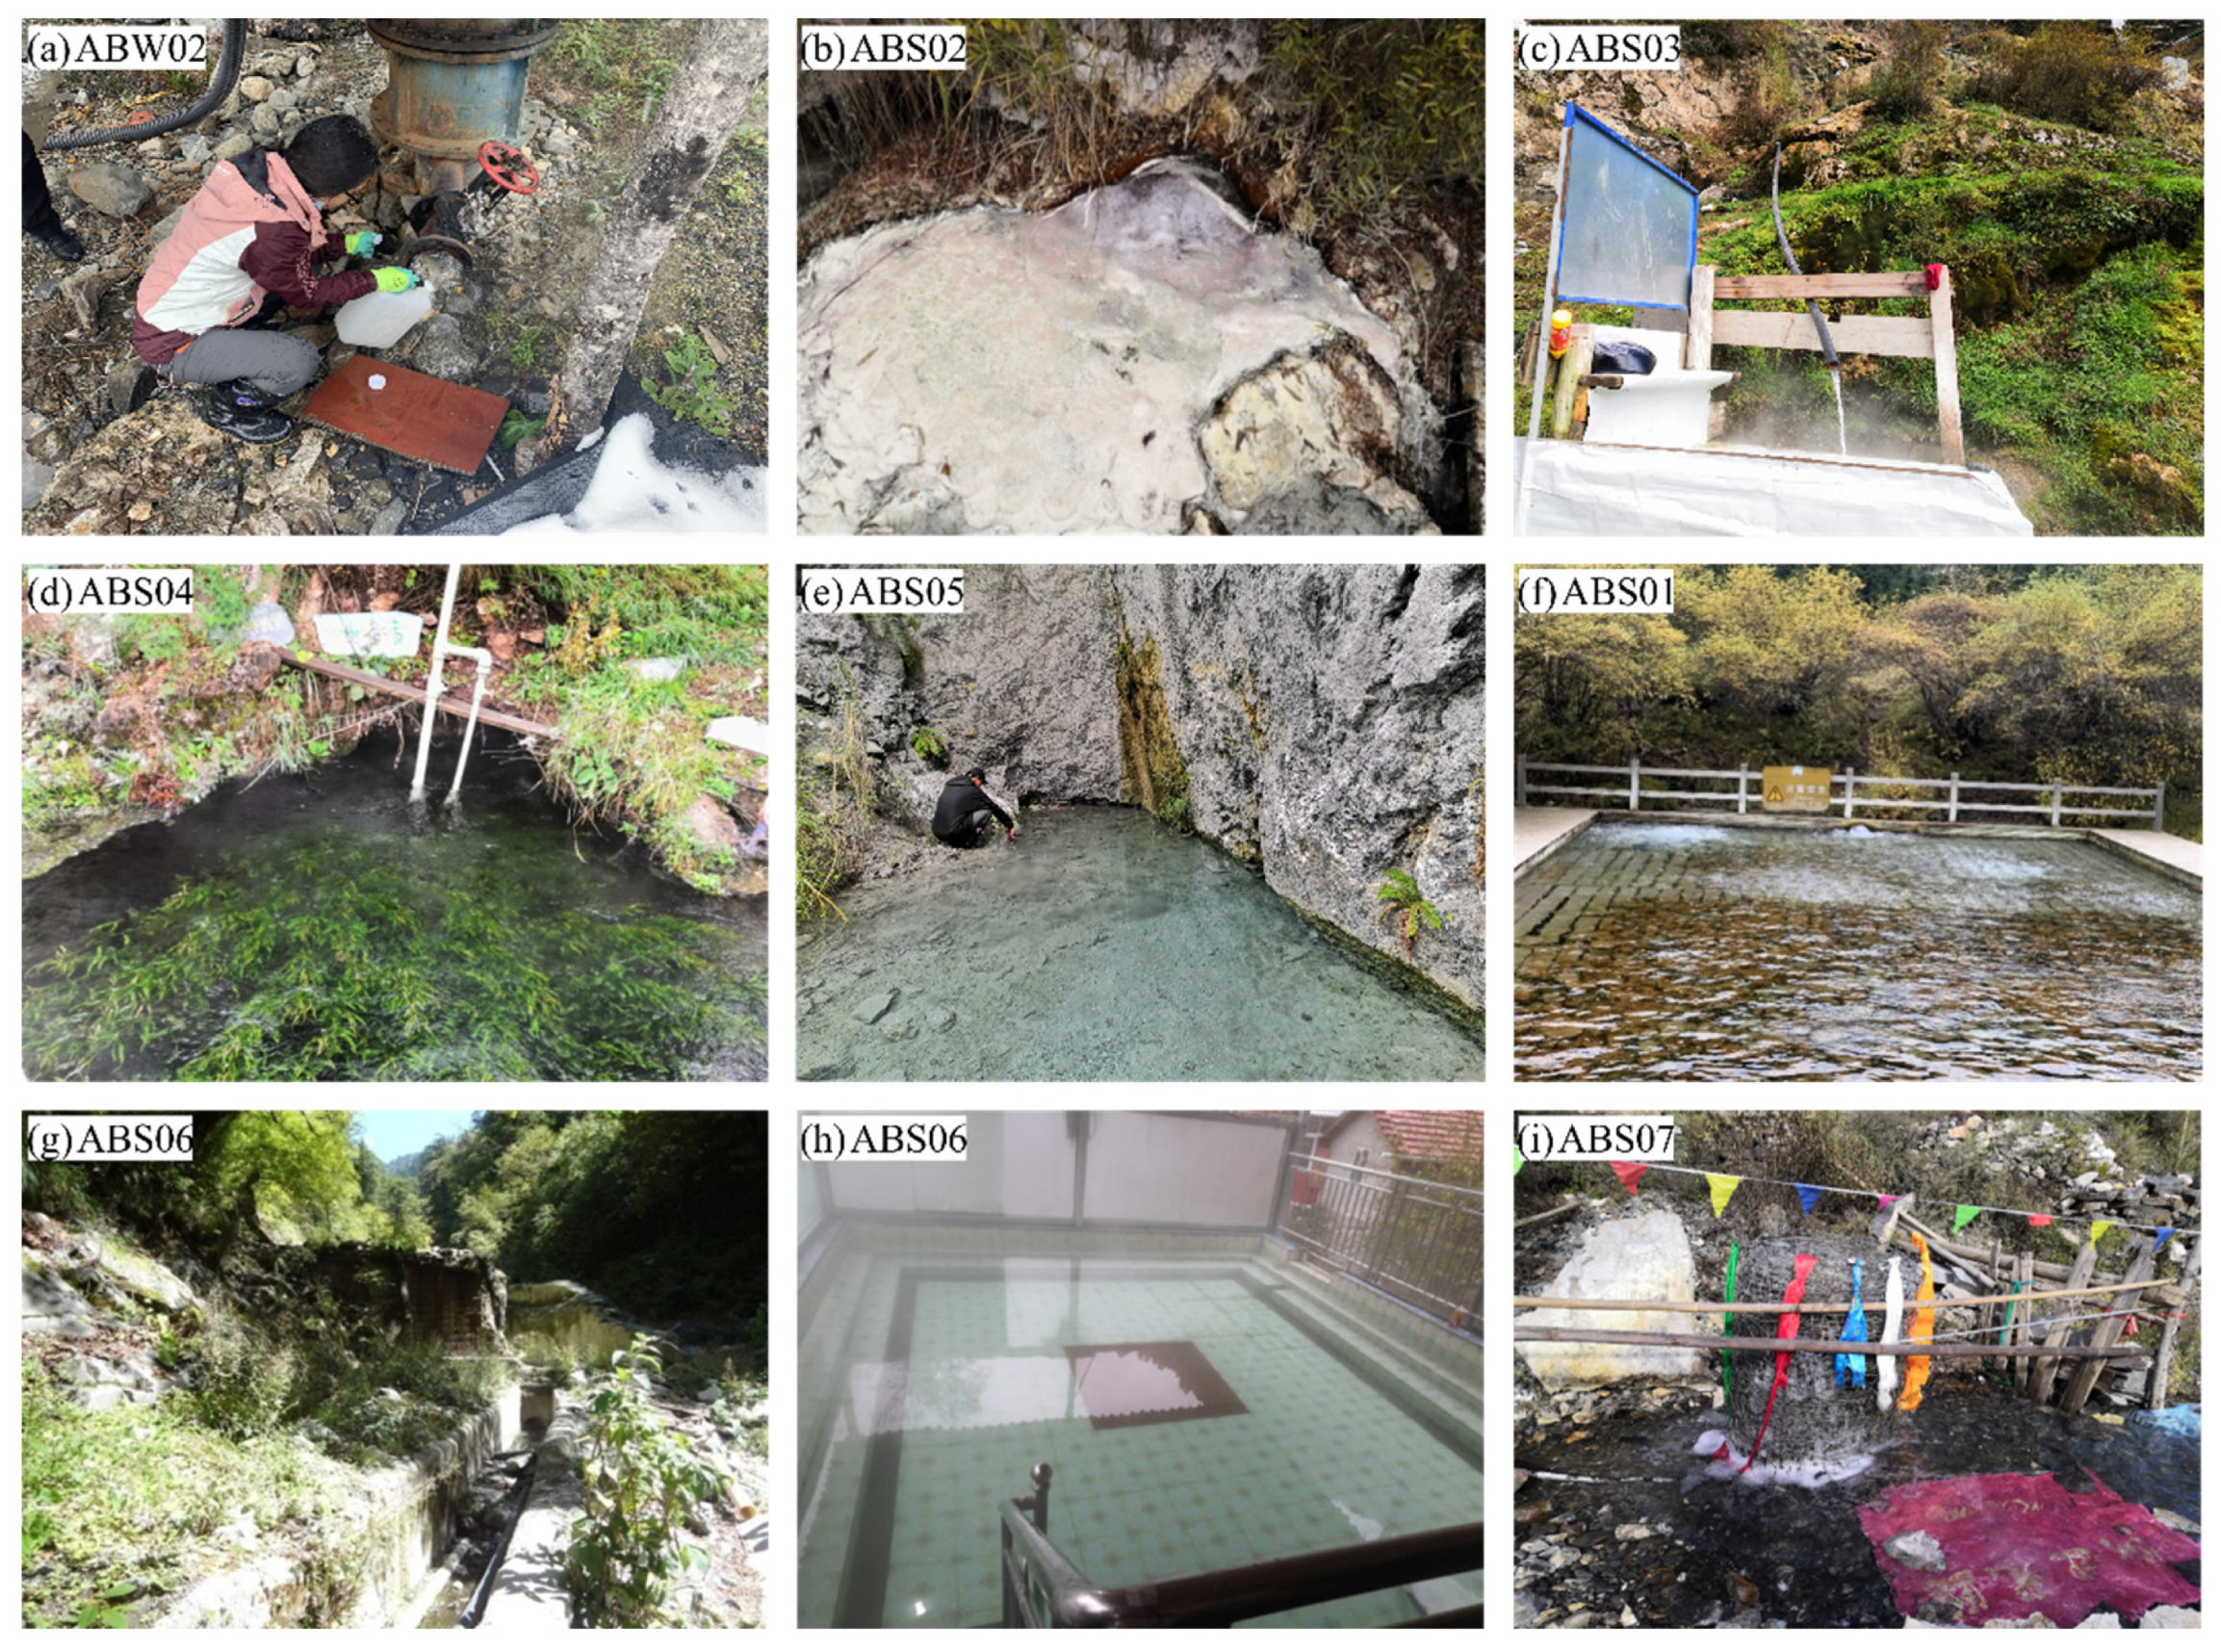
2.2.1. Sampling and Analysis
2.2.2. Geothermometer
2.2.3. Saturation Index
2.2.4. Scaling Trend
3. Results
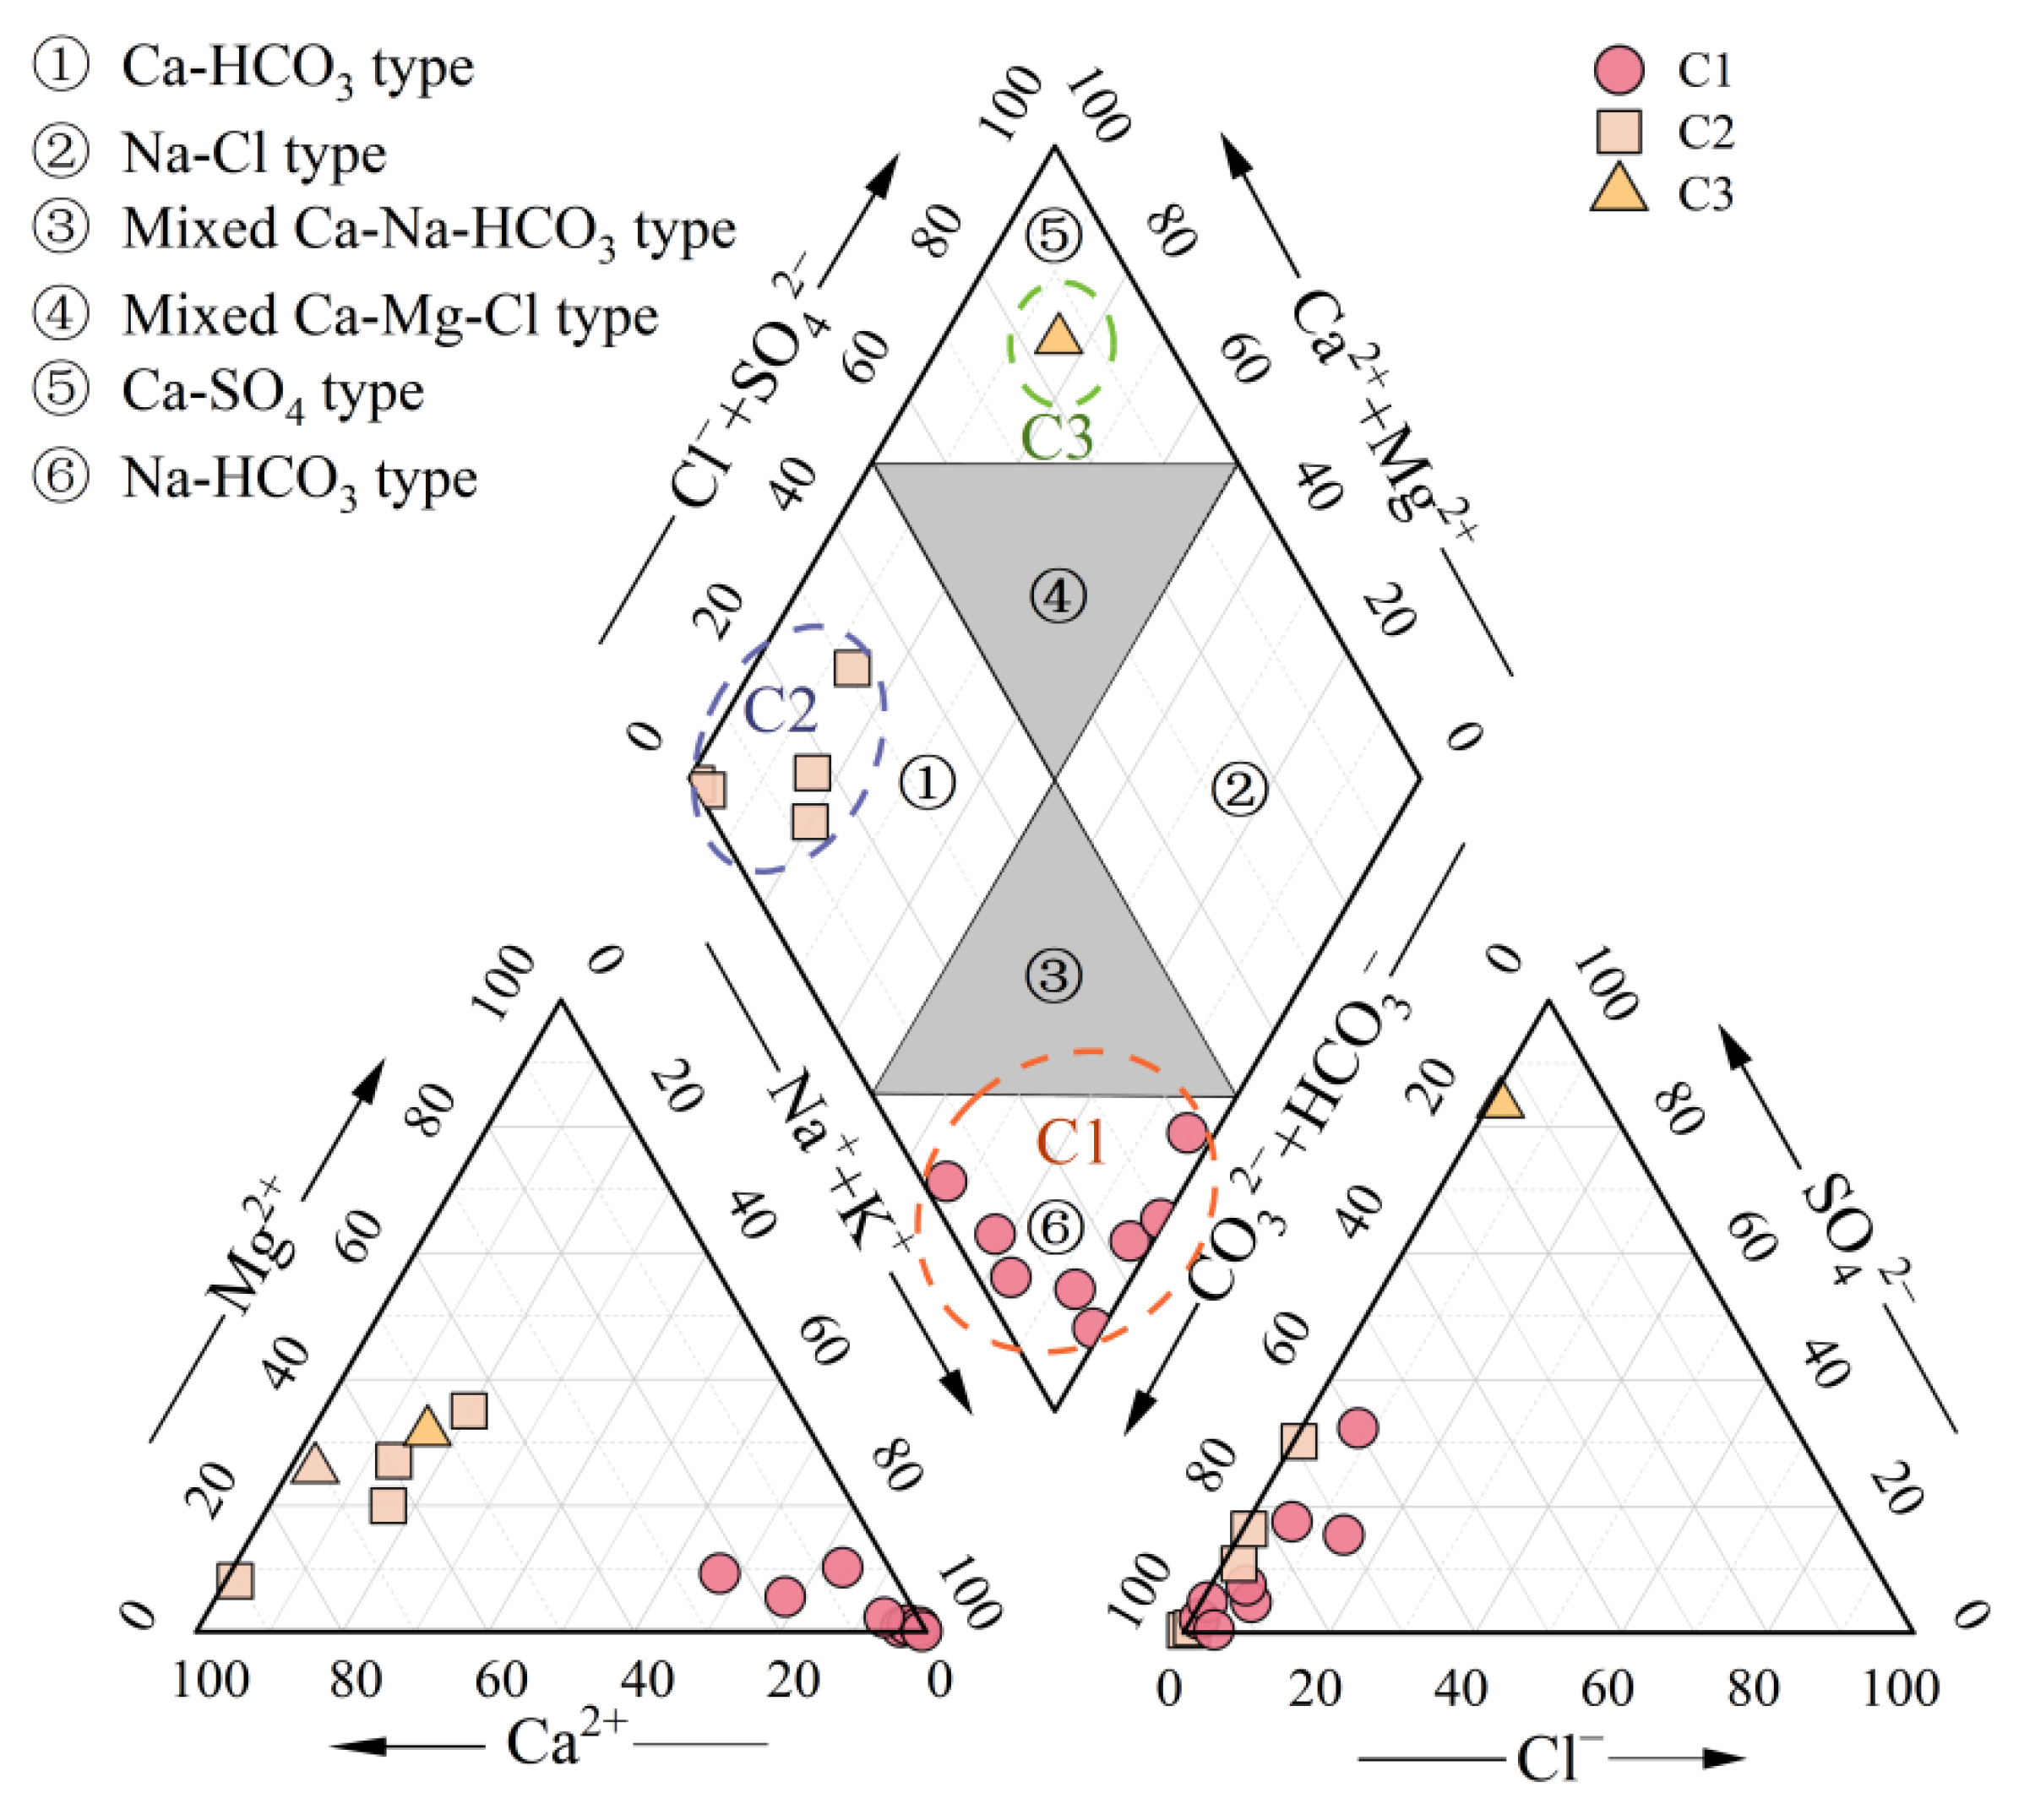
3.1. Hydrochemcial Facies
- (1)
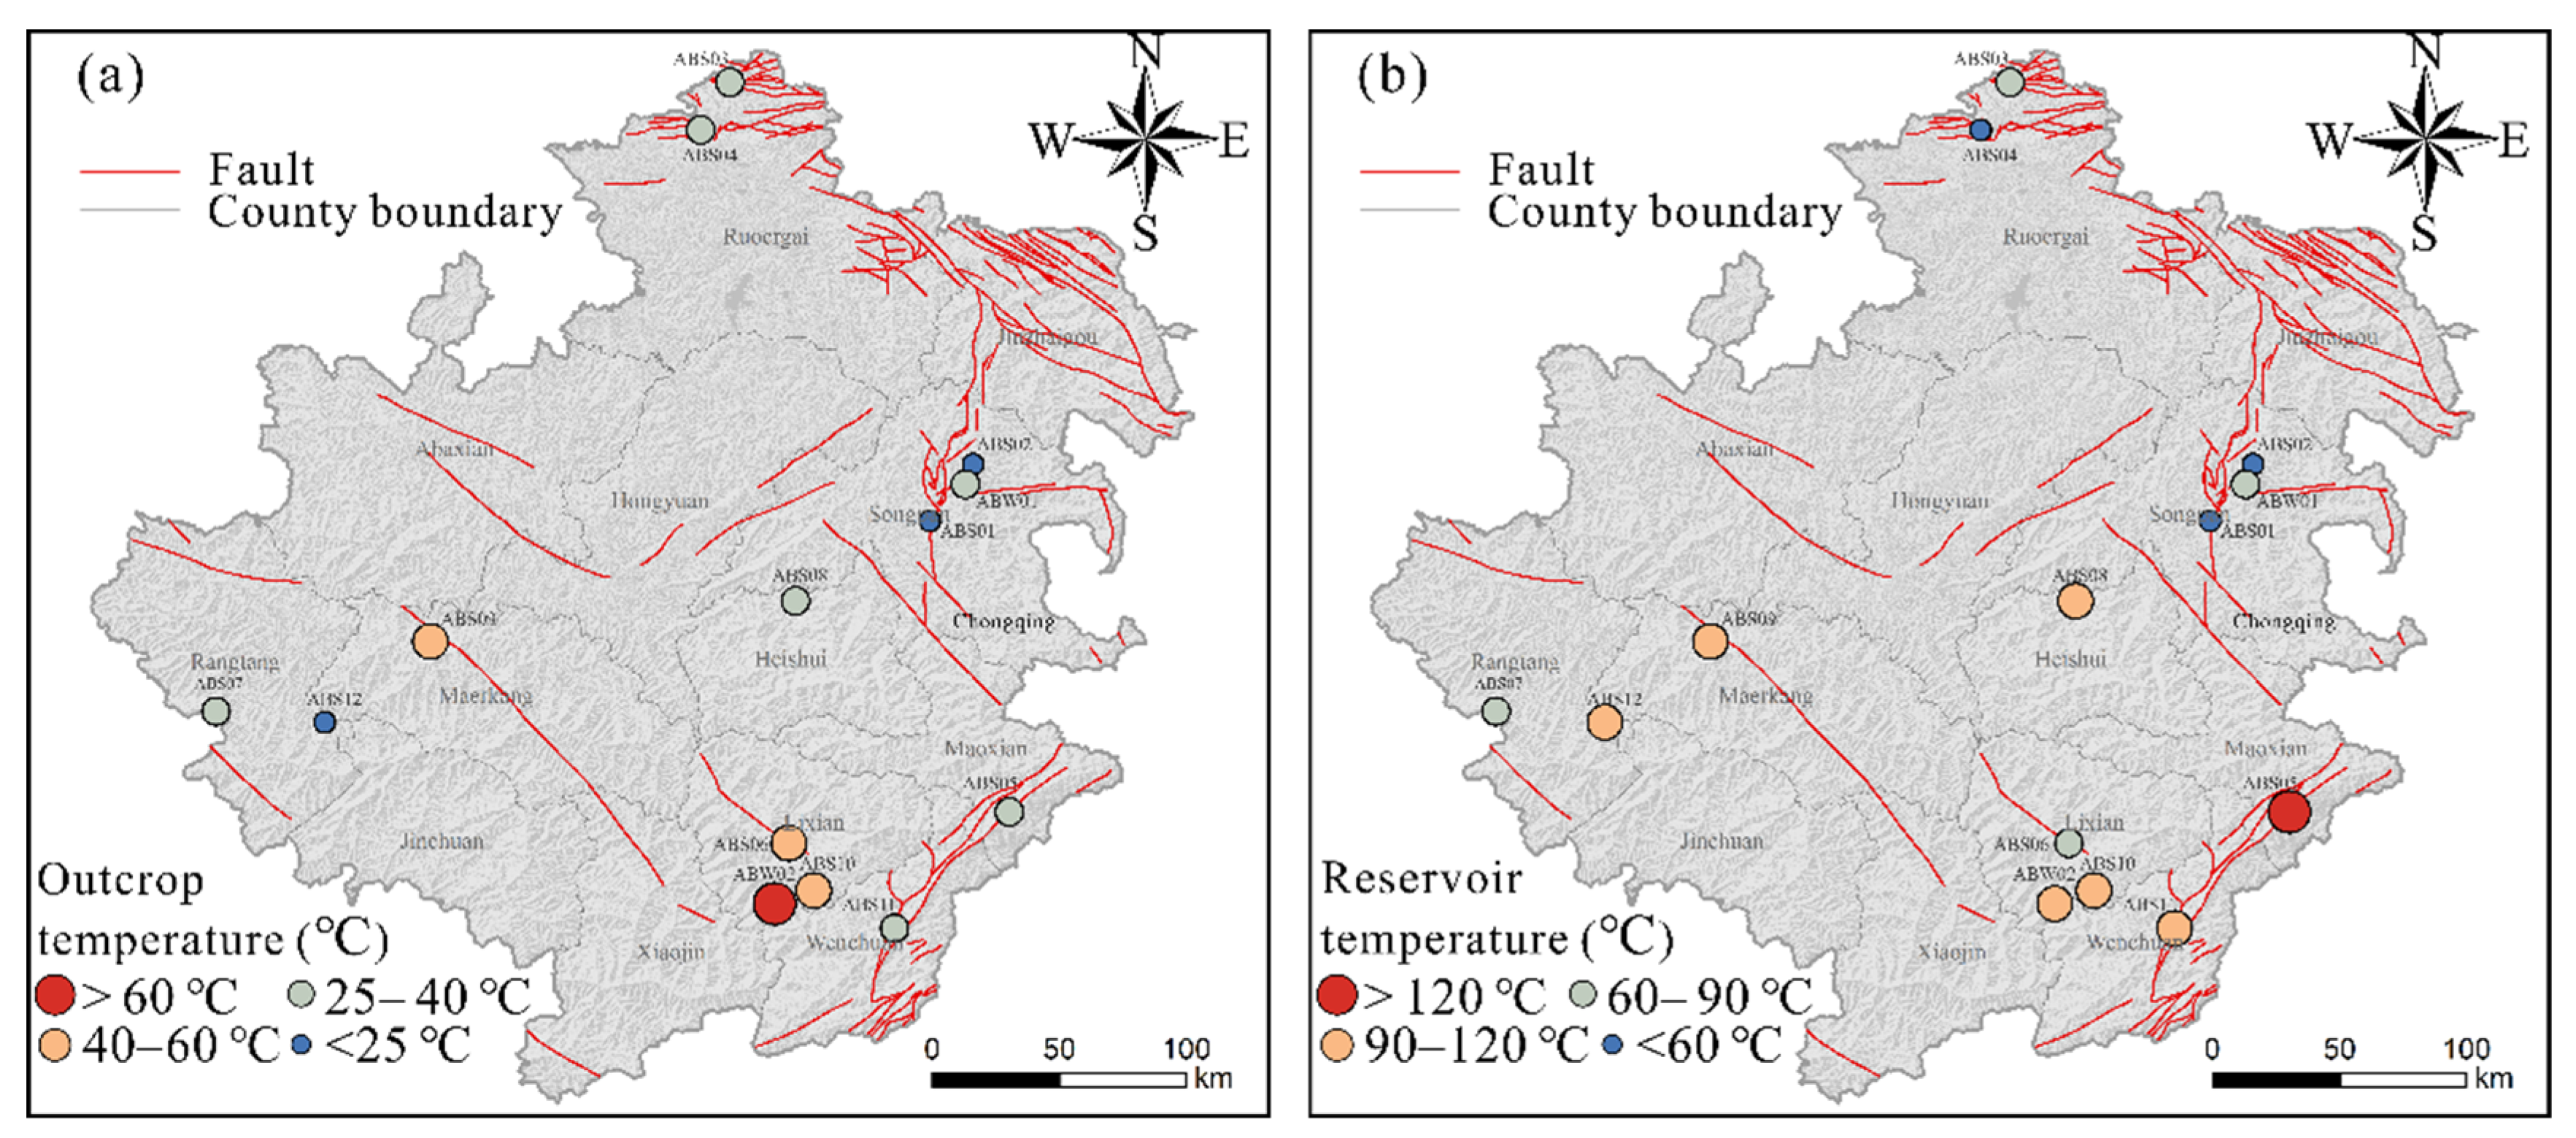
- Class 1 geothermal water
- (2)
- Class 2 geothermal water
- (3)
- Class 3 geothermal water
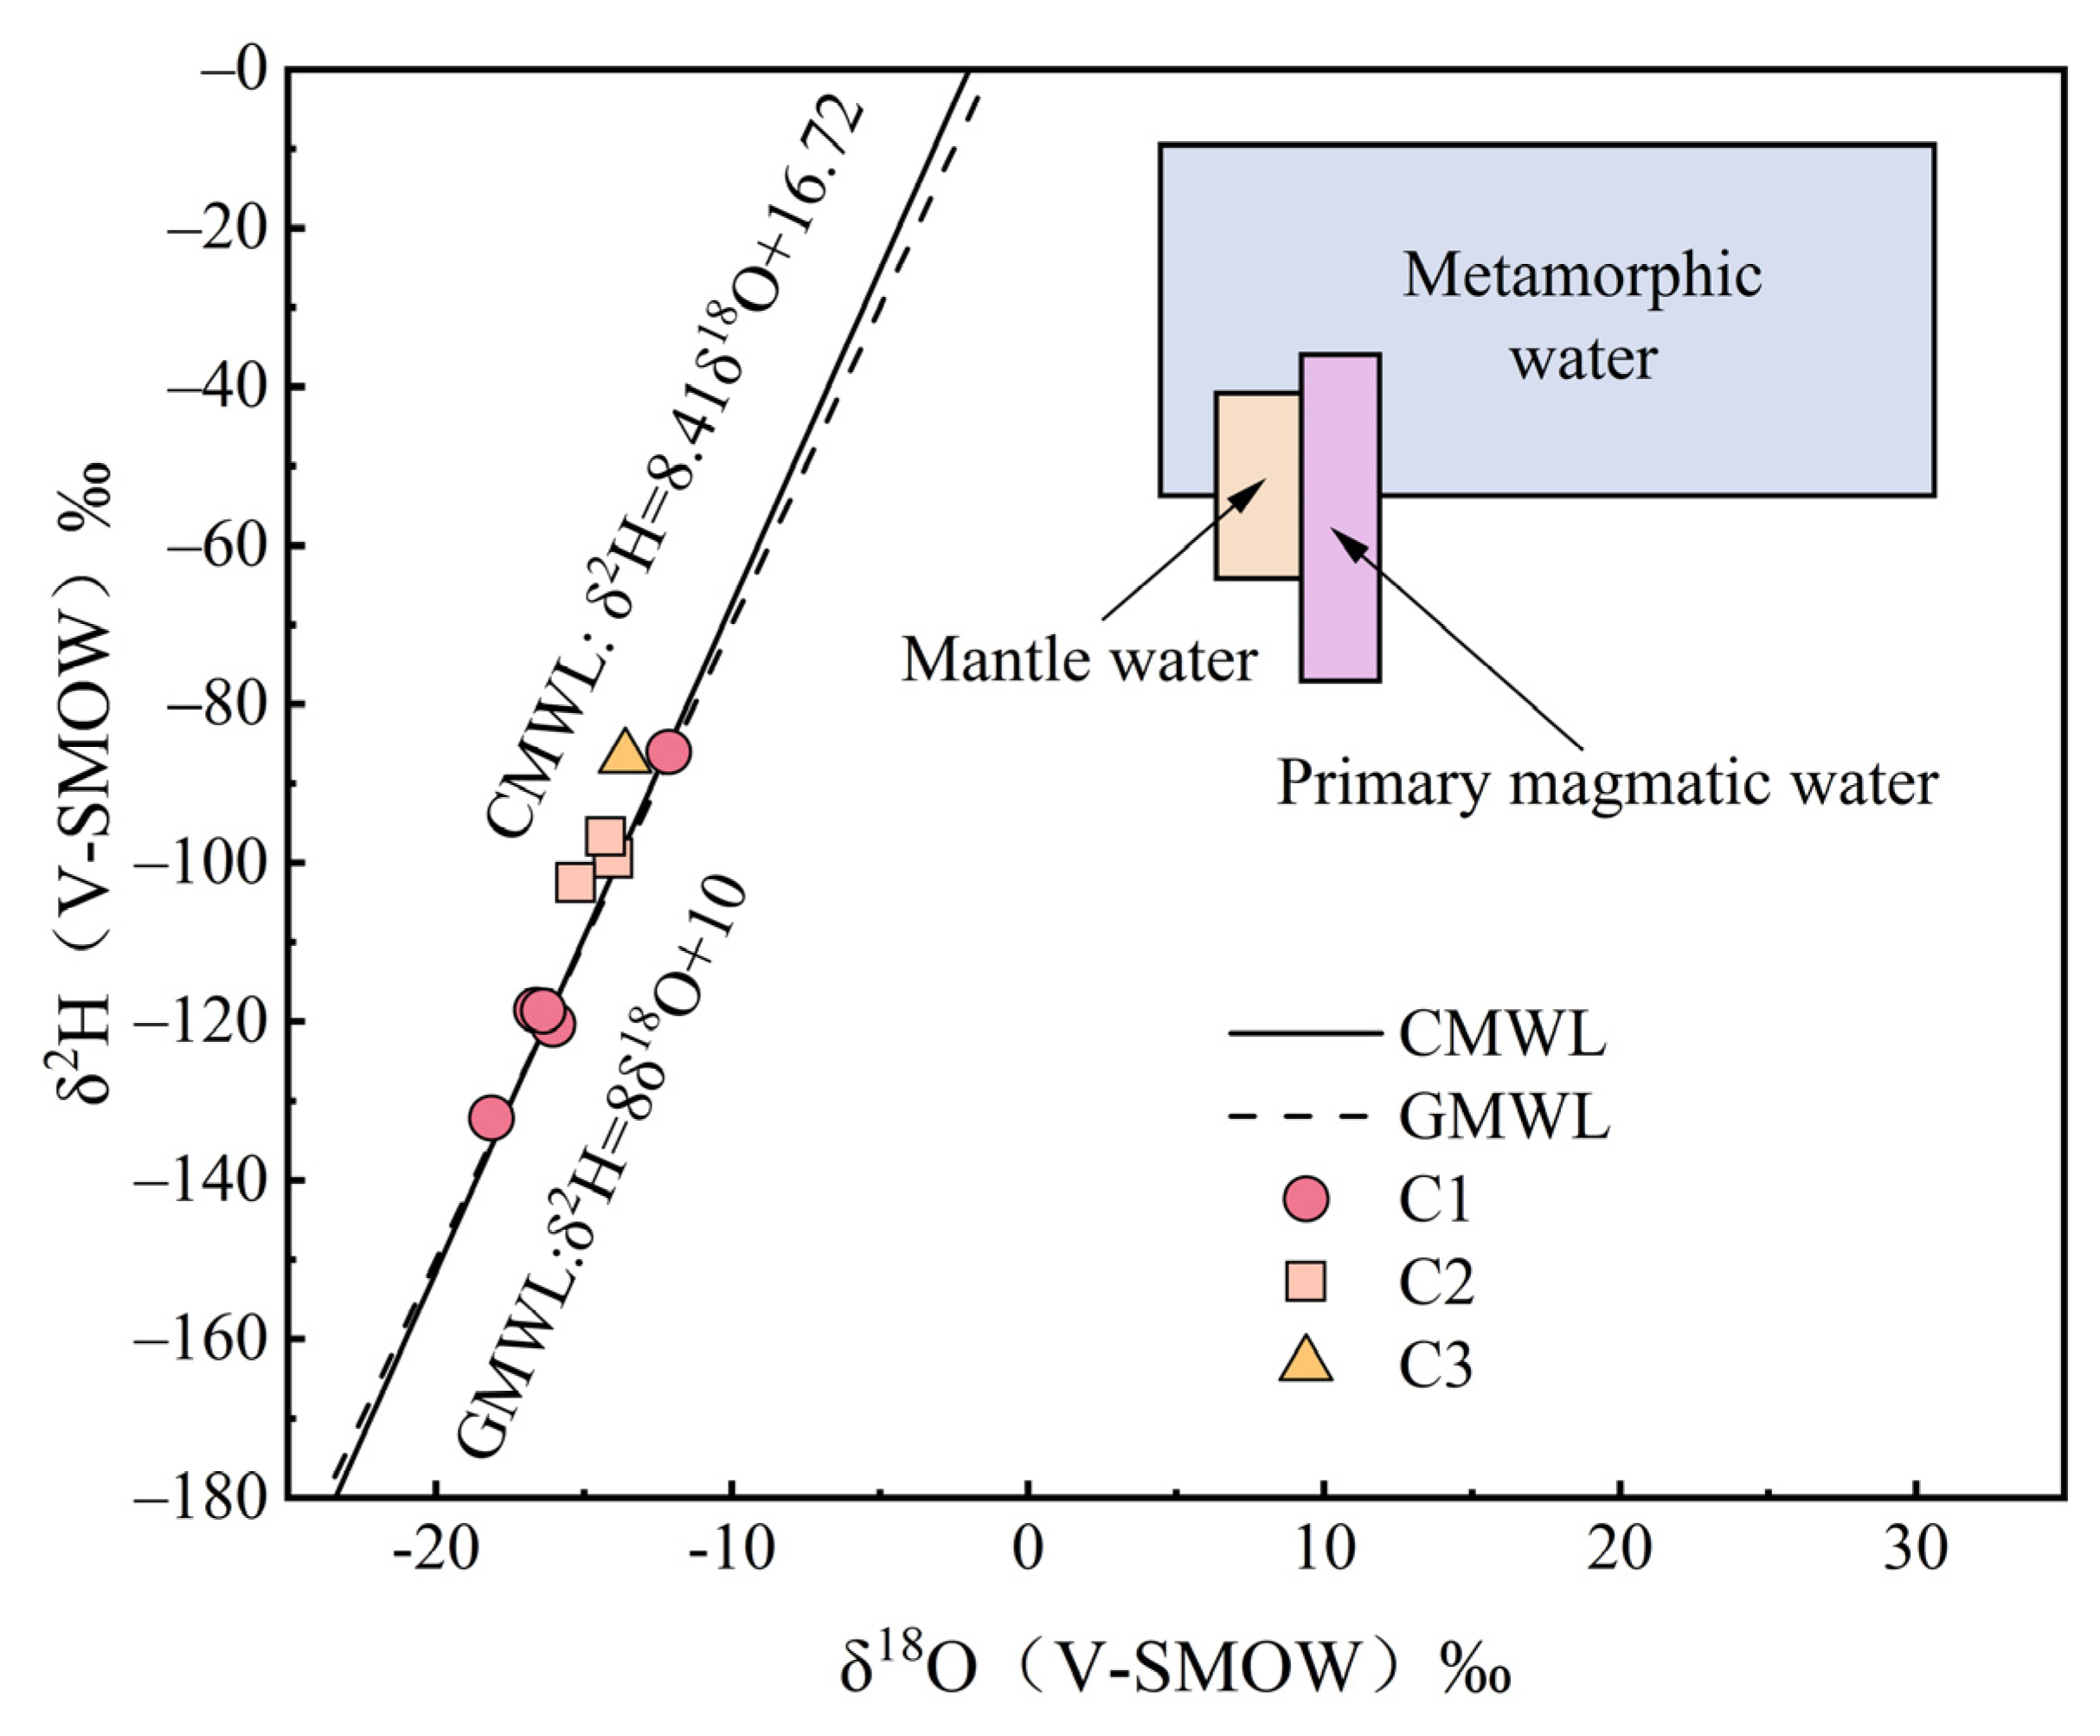
3.2. Oxygen and Hydrogen Isotopes (δ18O and δ2H)
4. Discussion
4.1. Ion Source Analysis
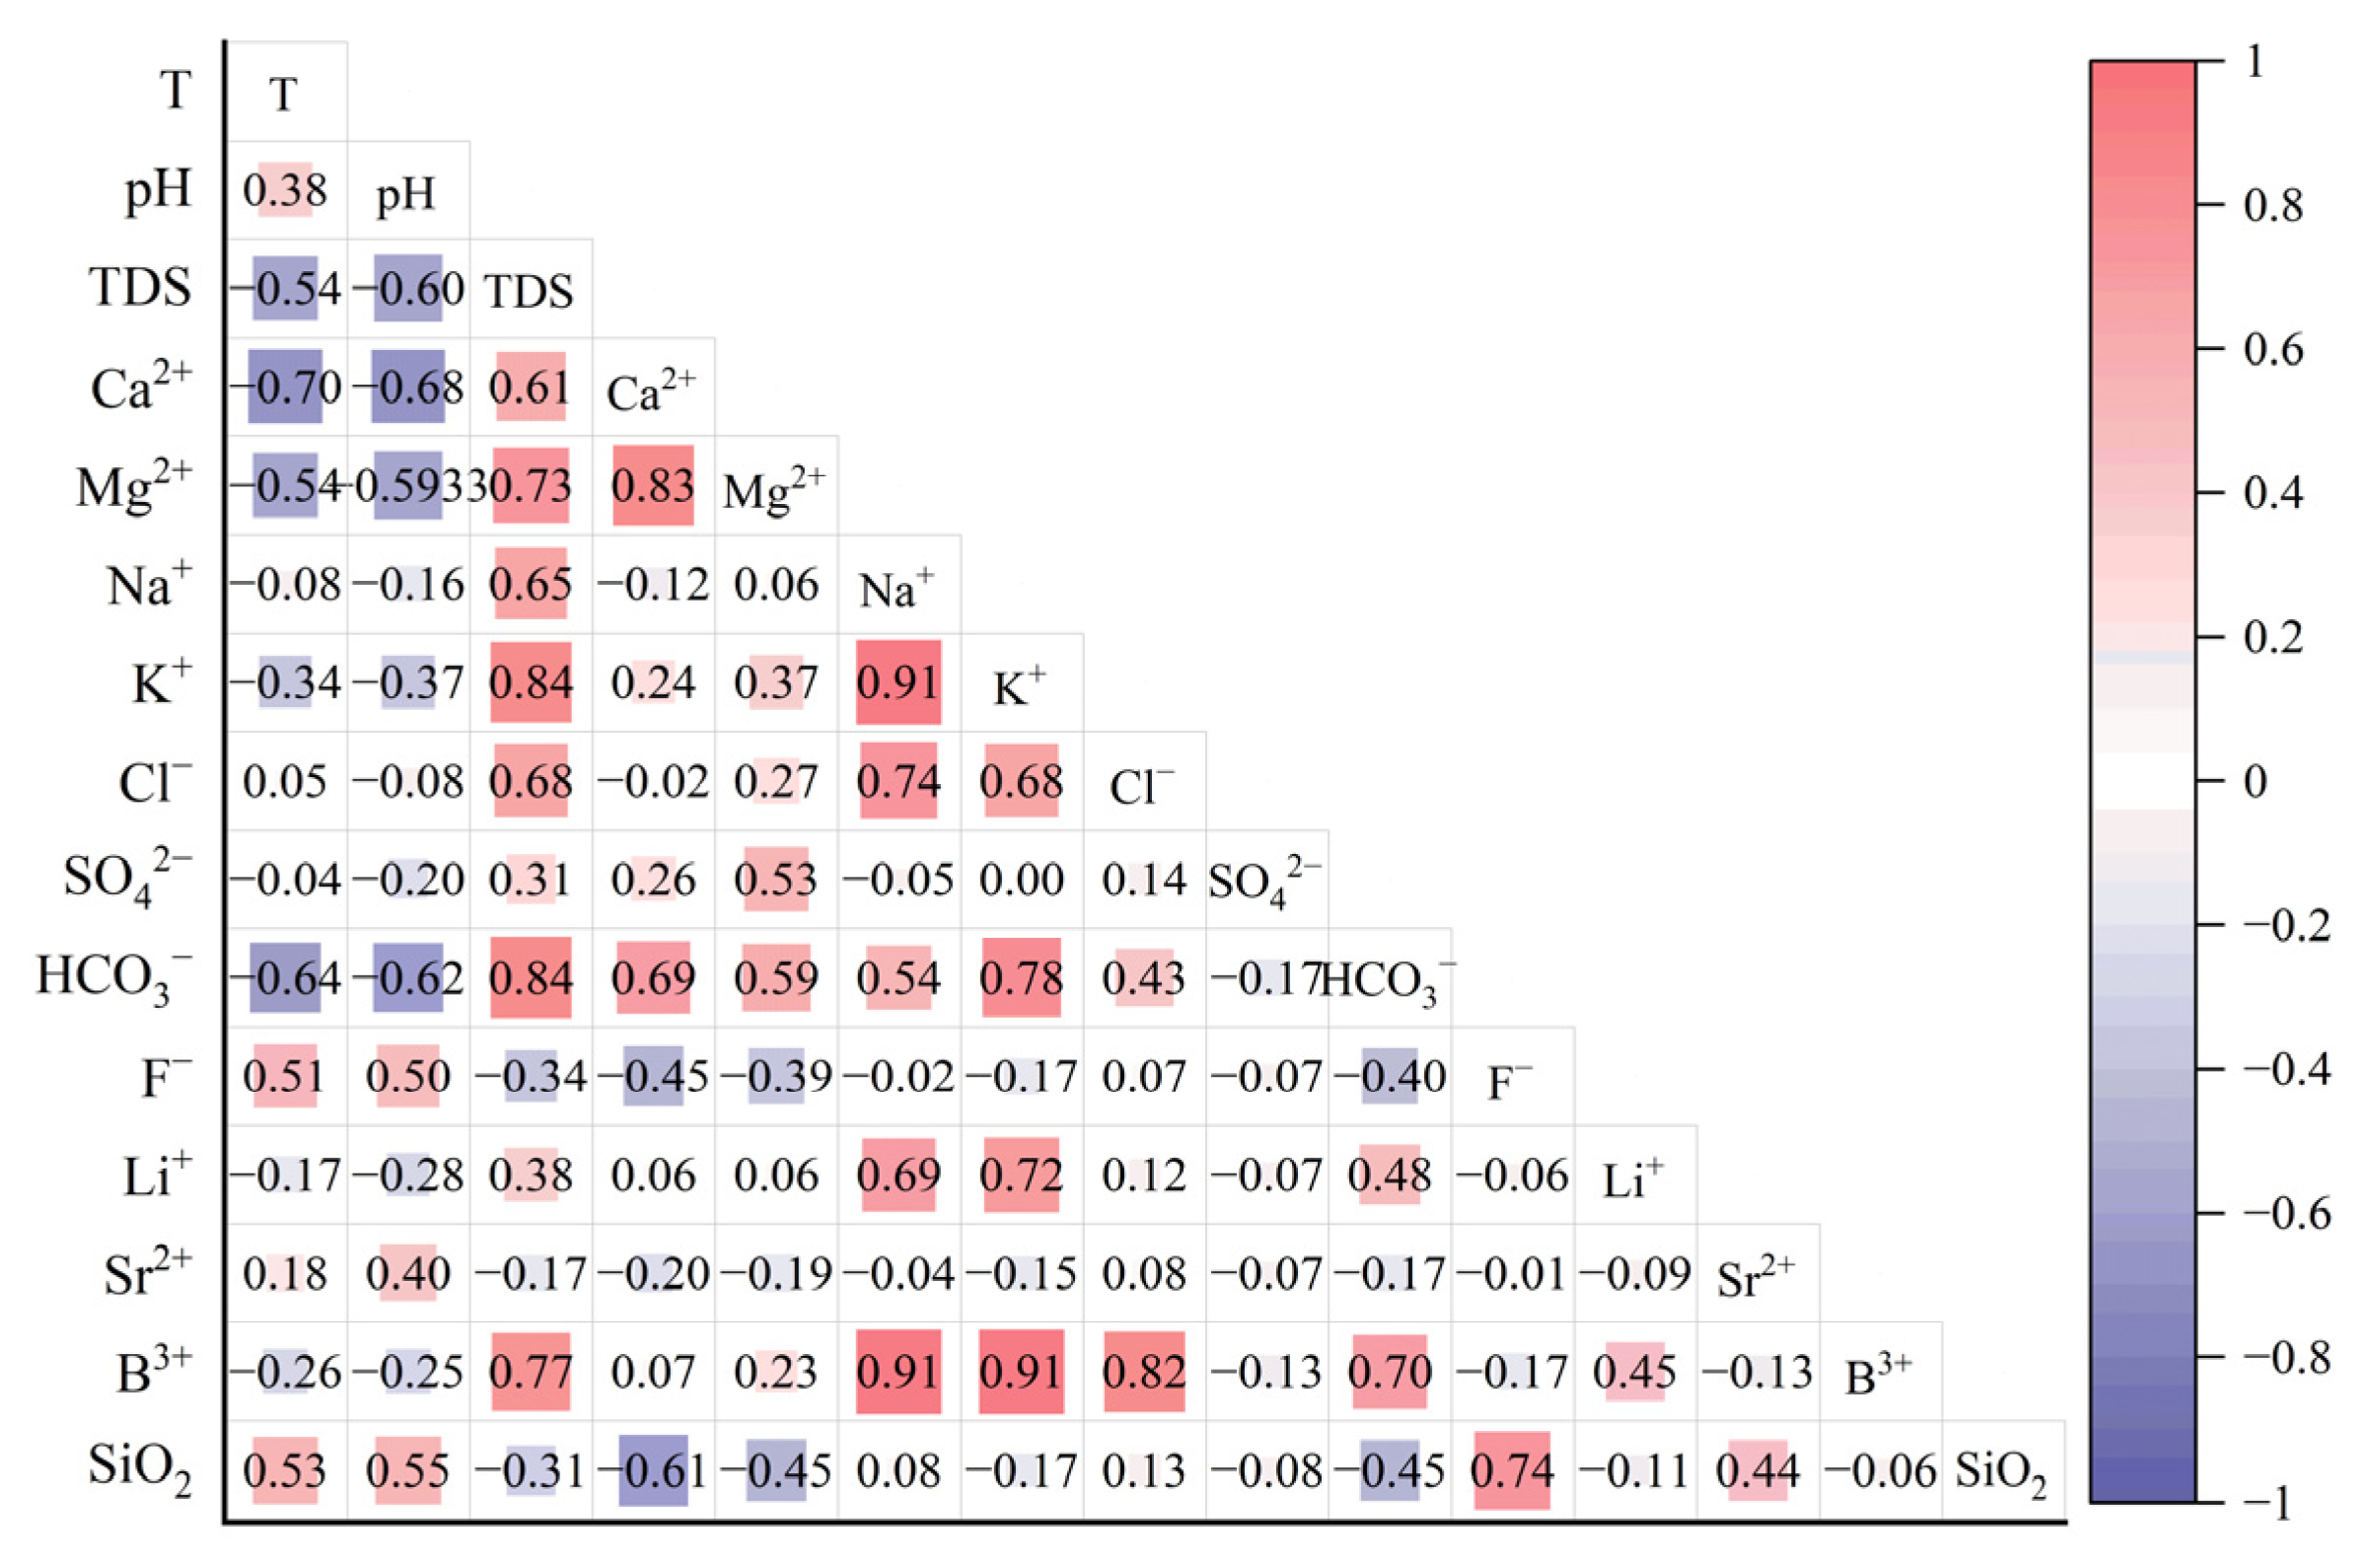
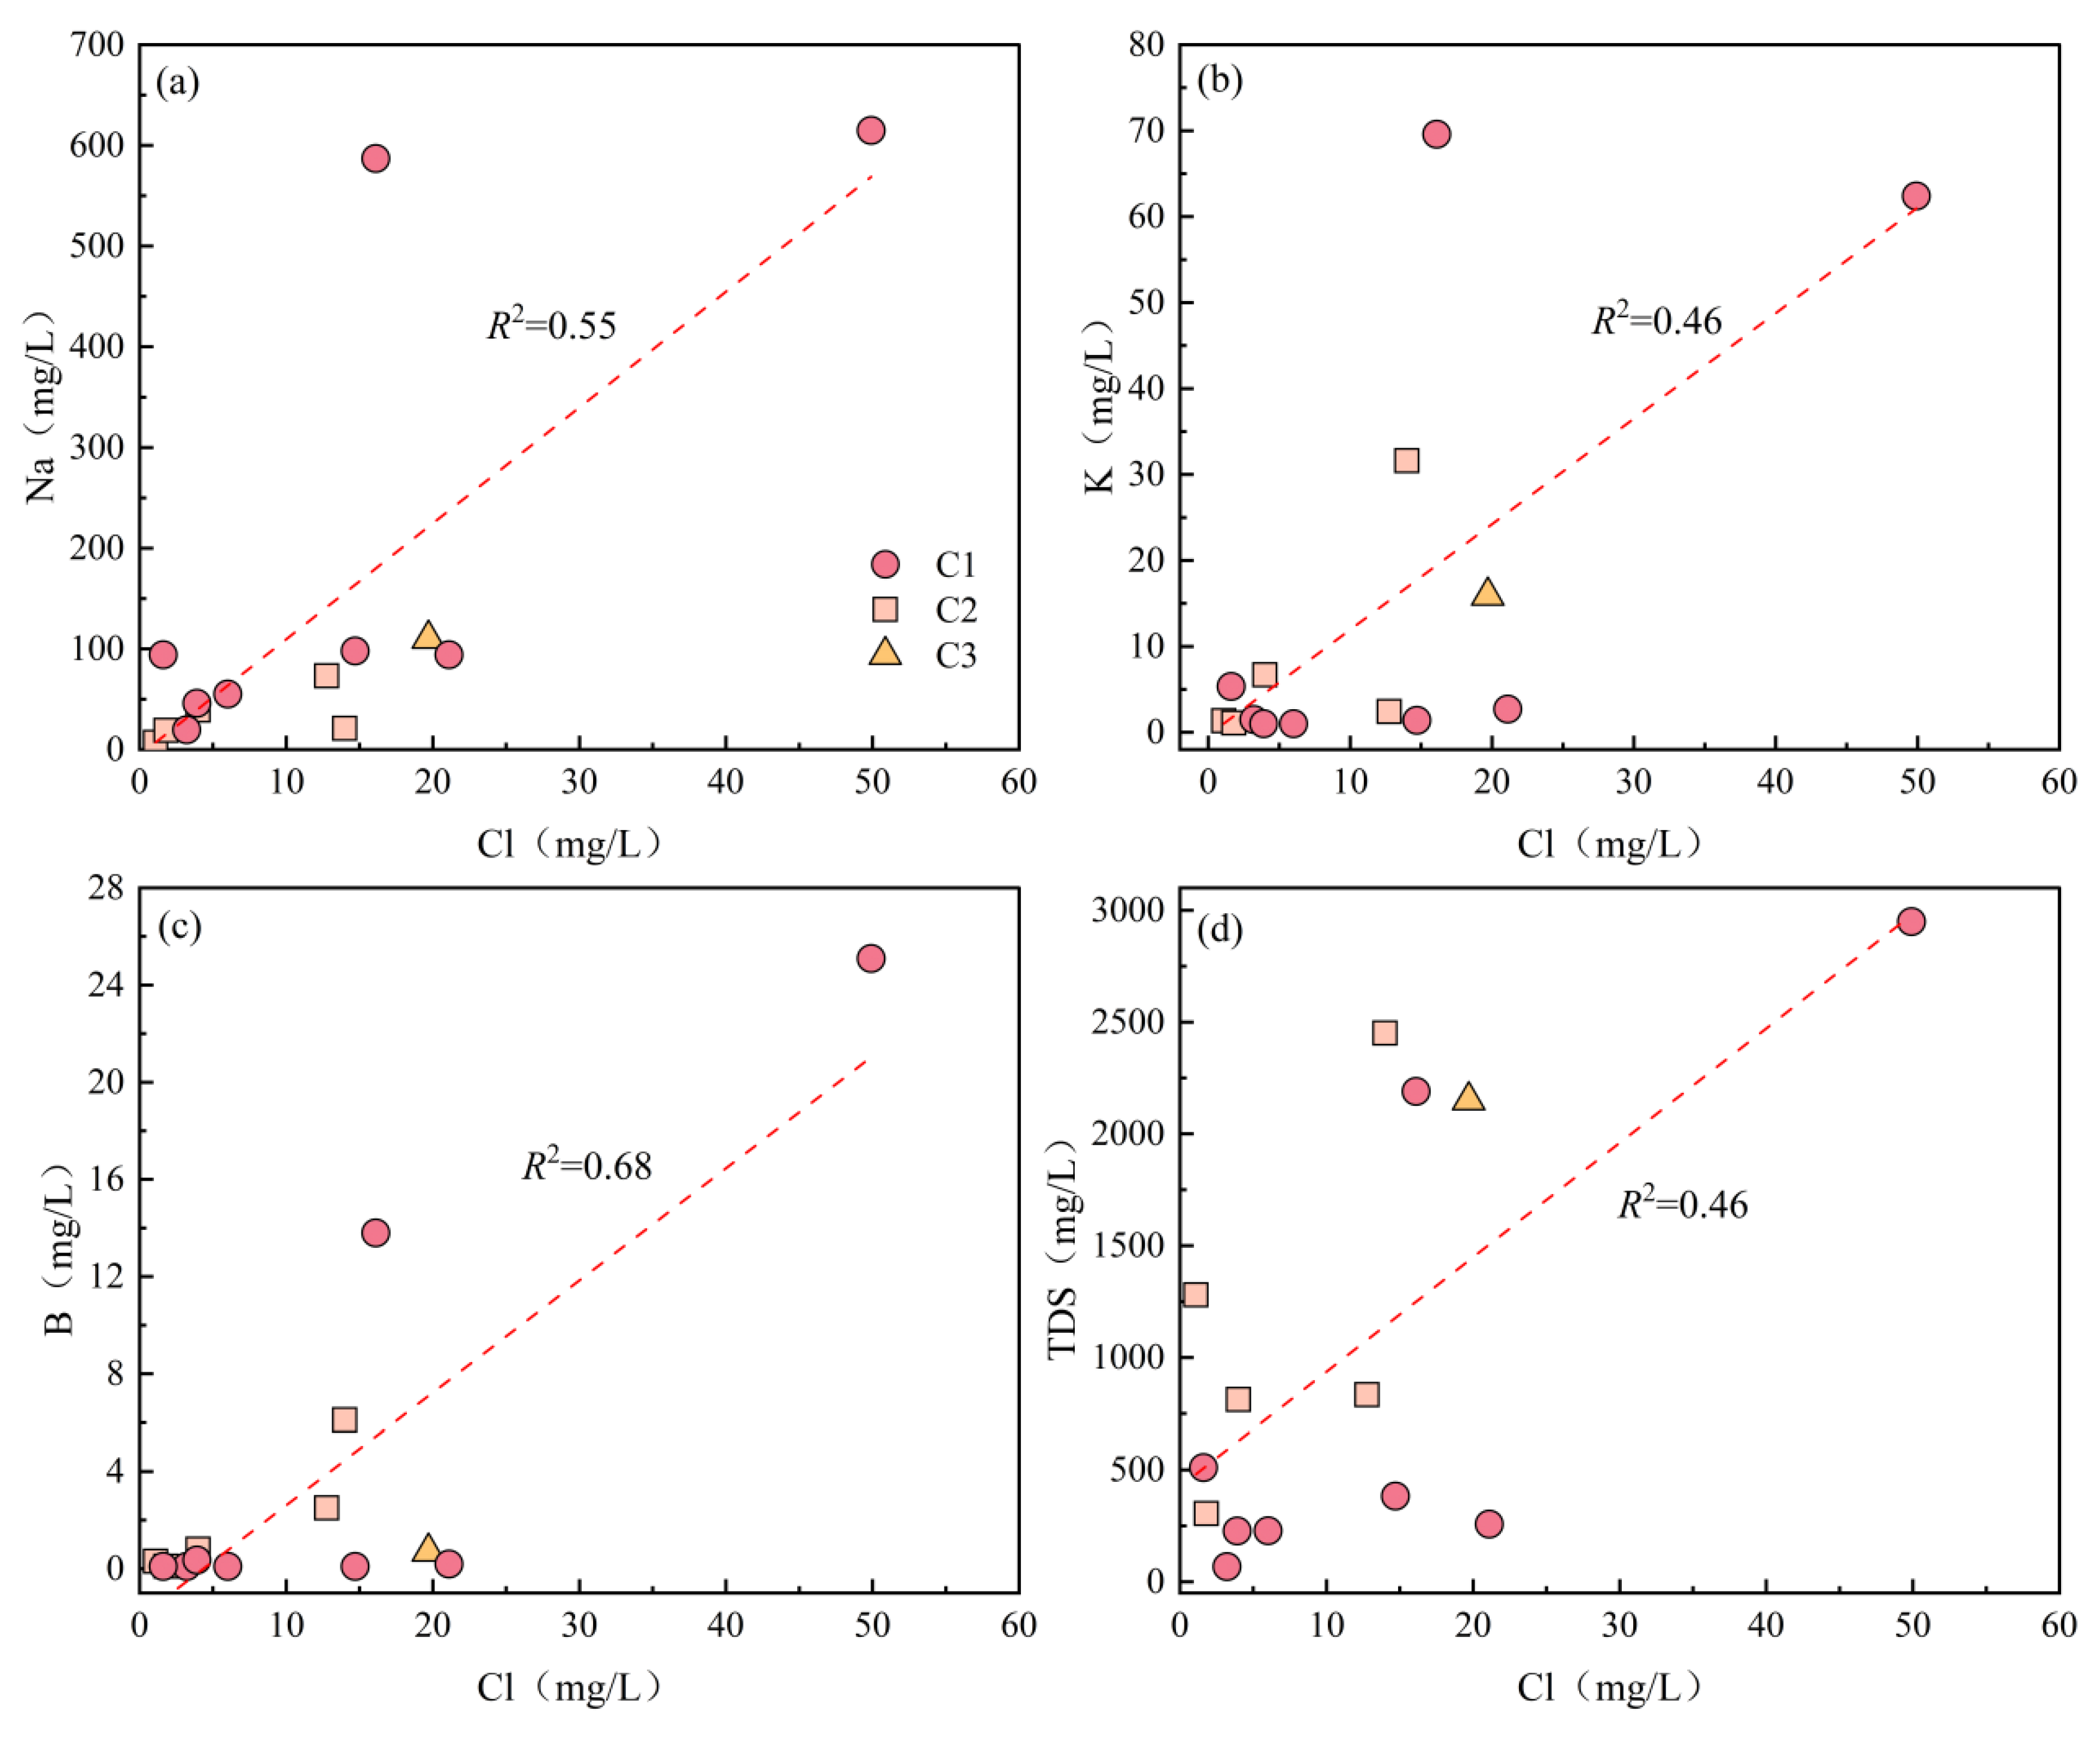
4.1.1. Correlation Analysis of Hydrochemical Parameters
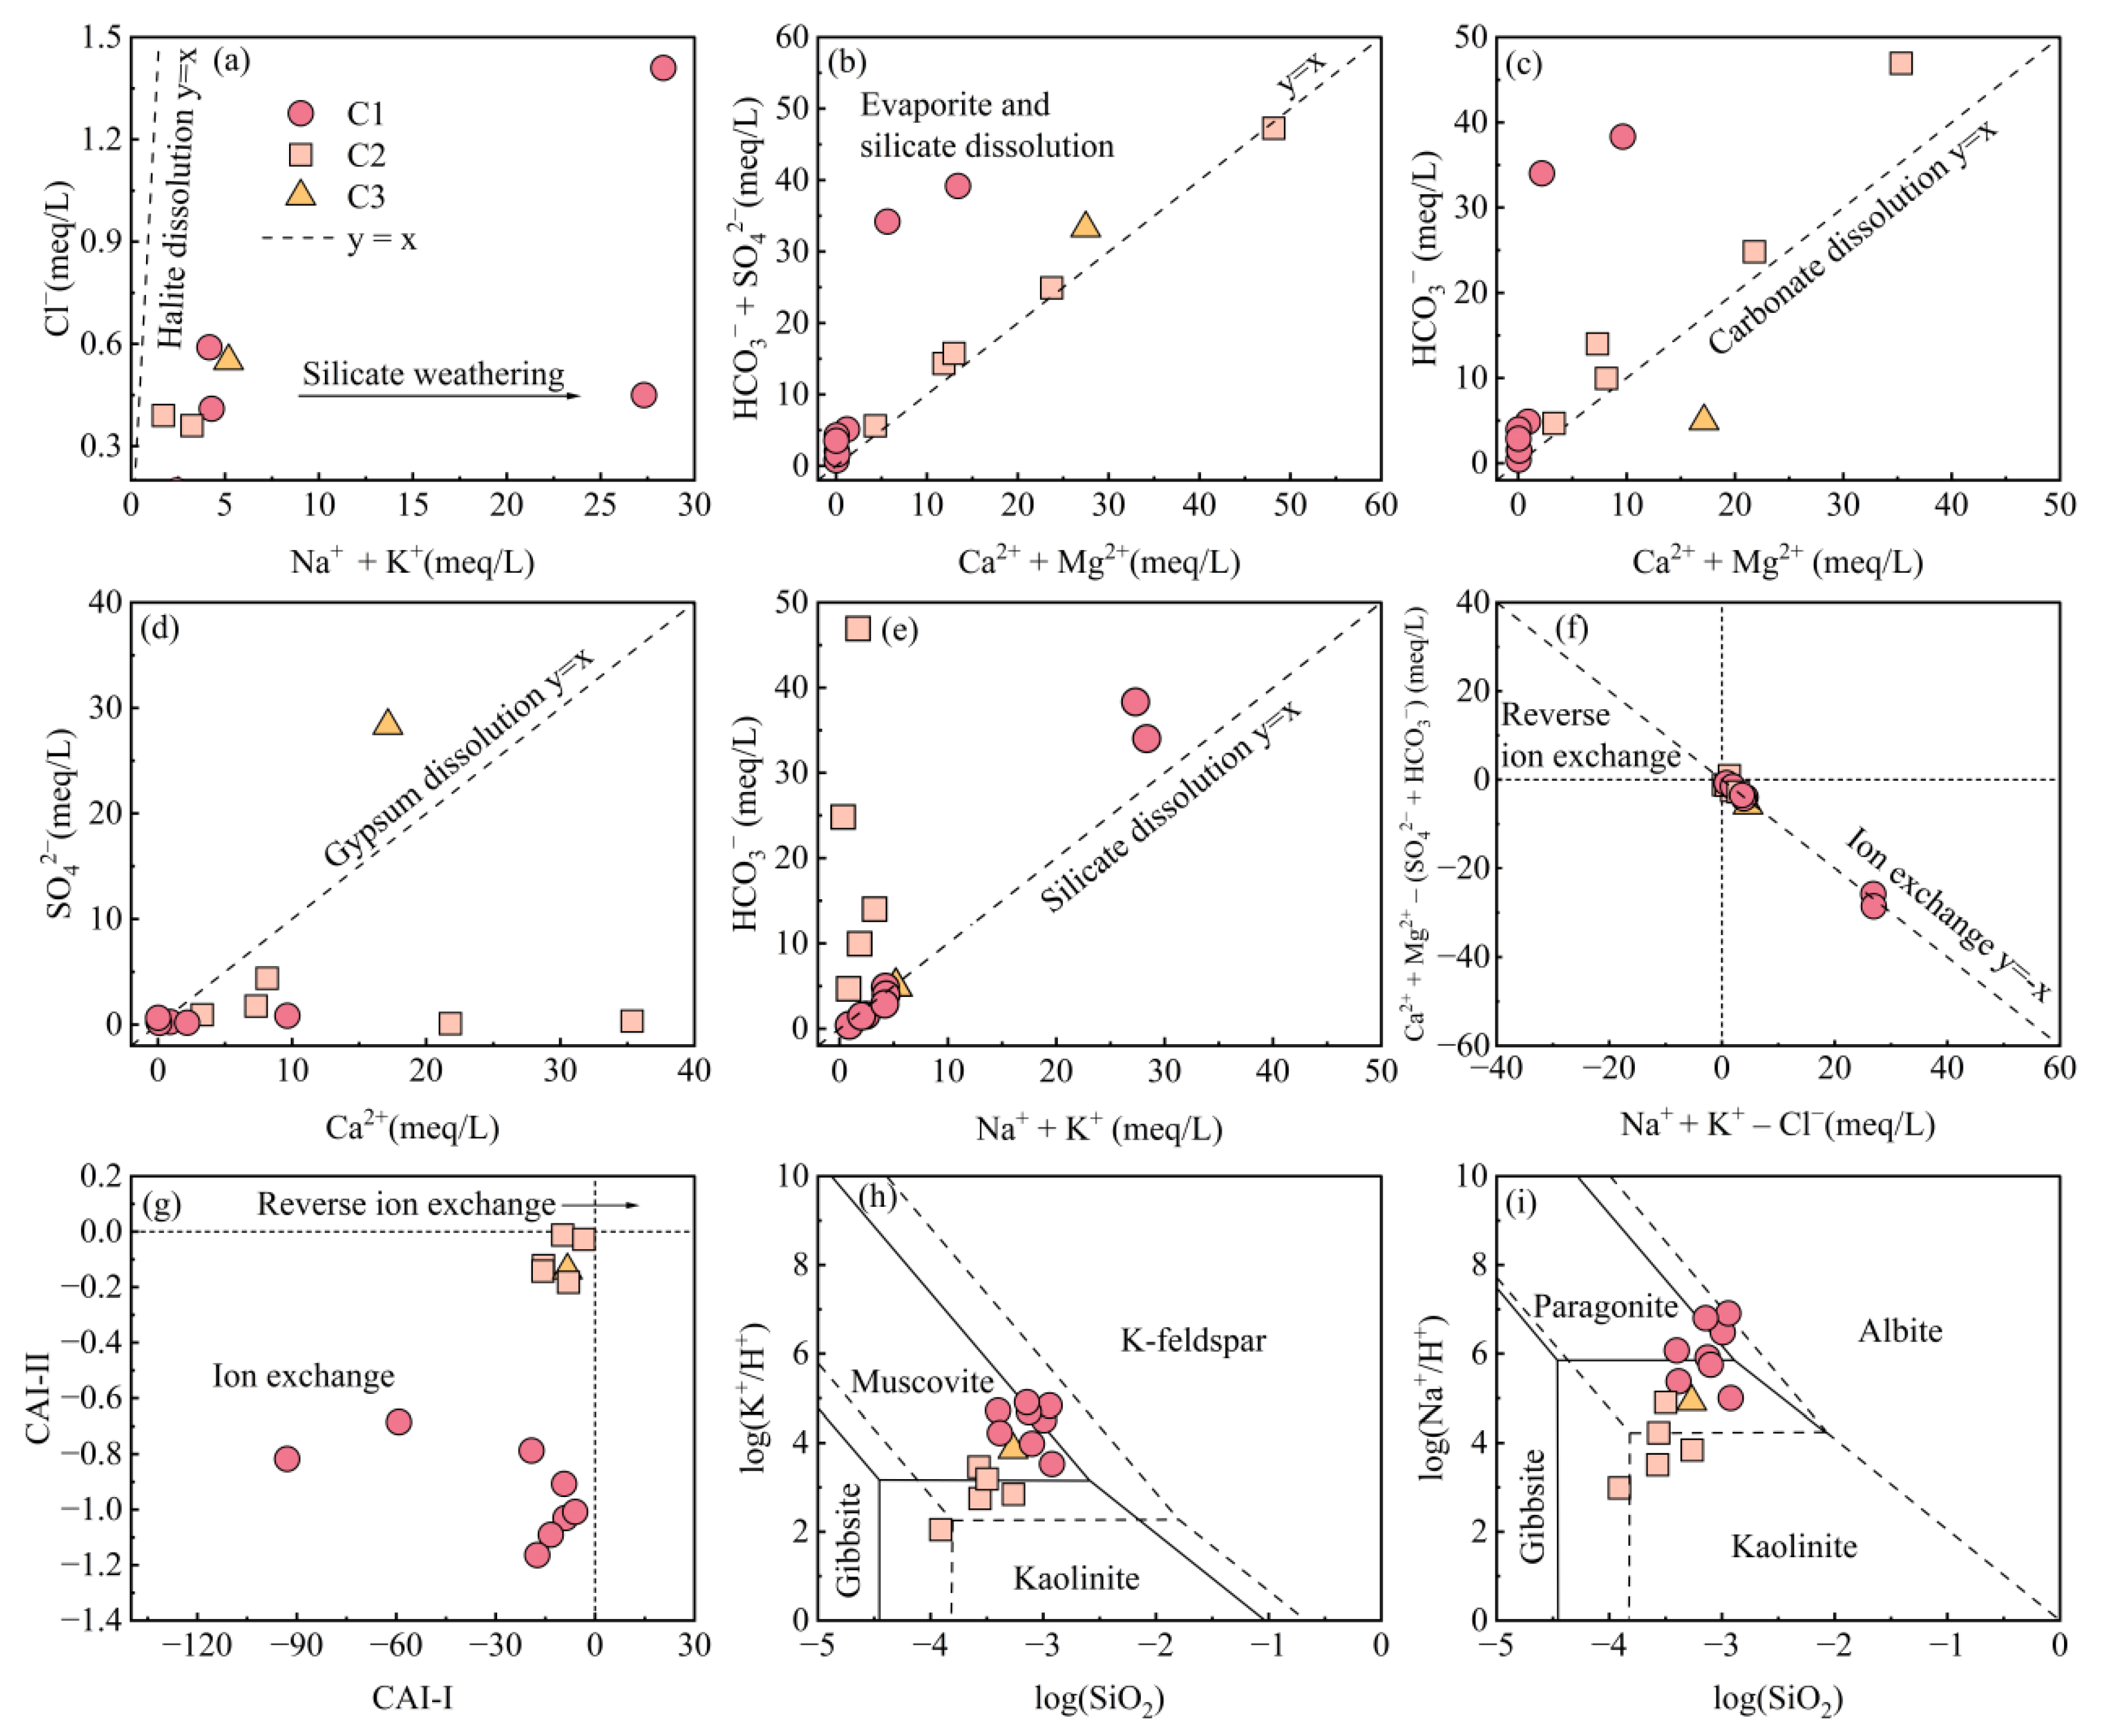
4.1.2. Ion Ratio Analysis
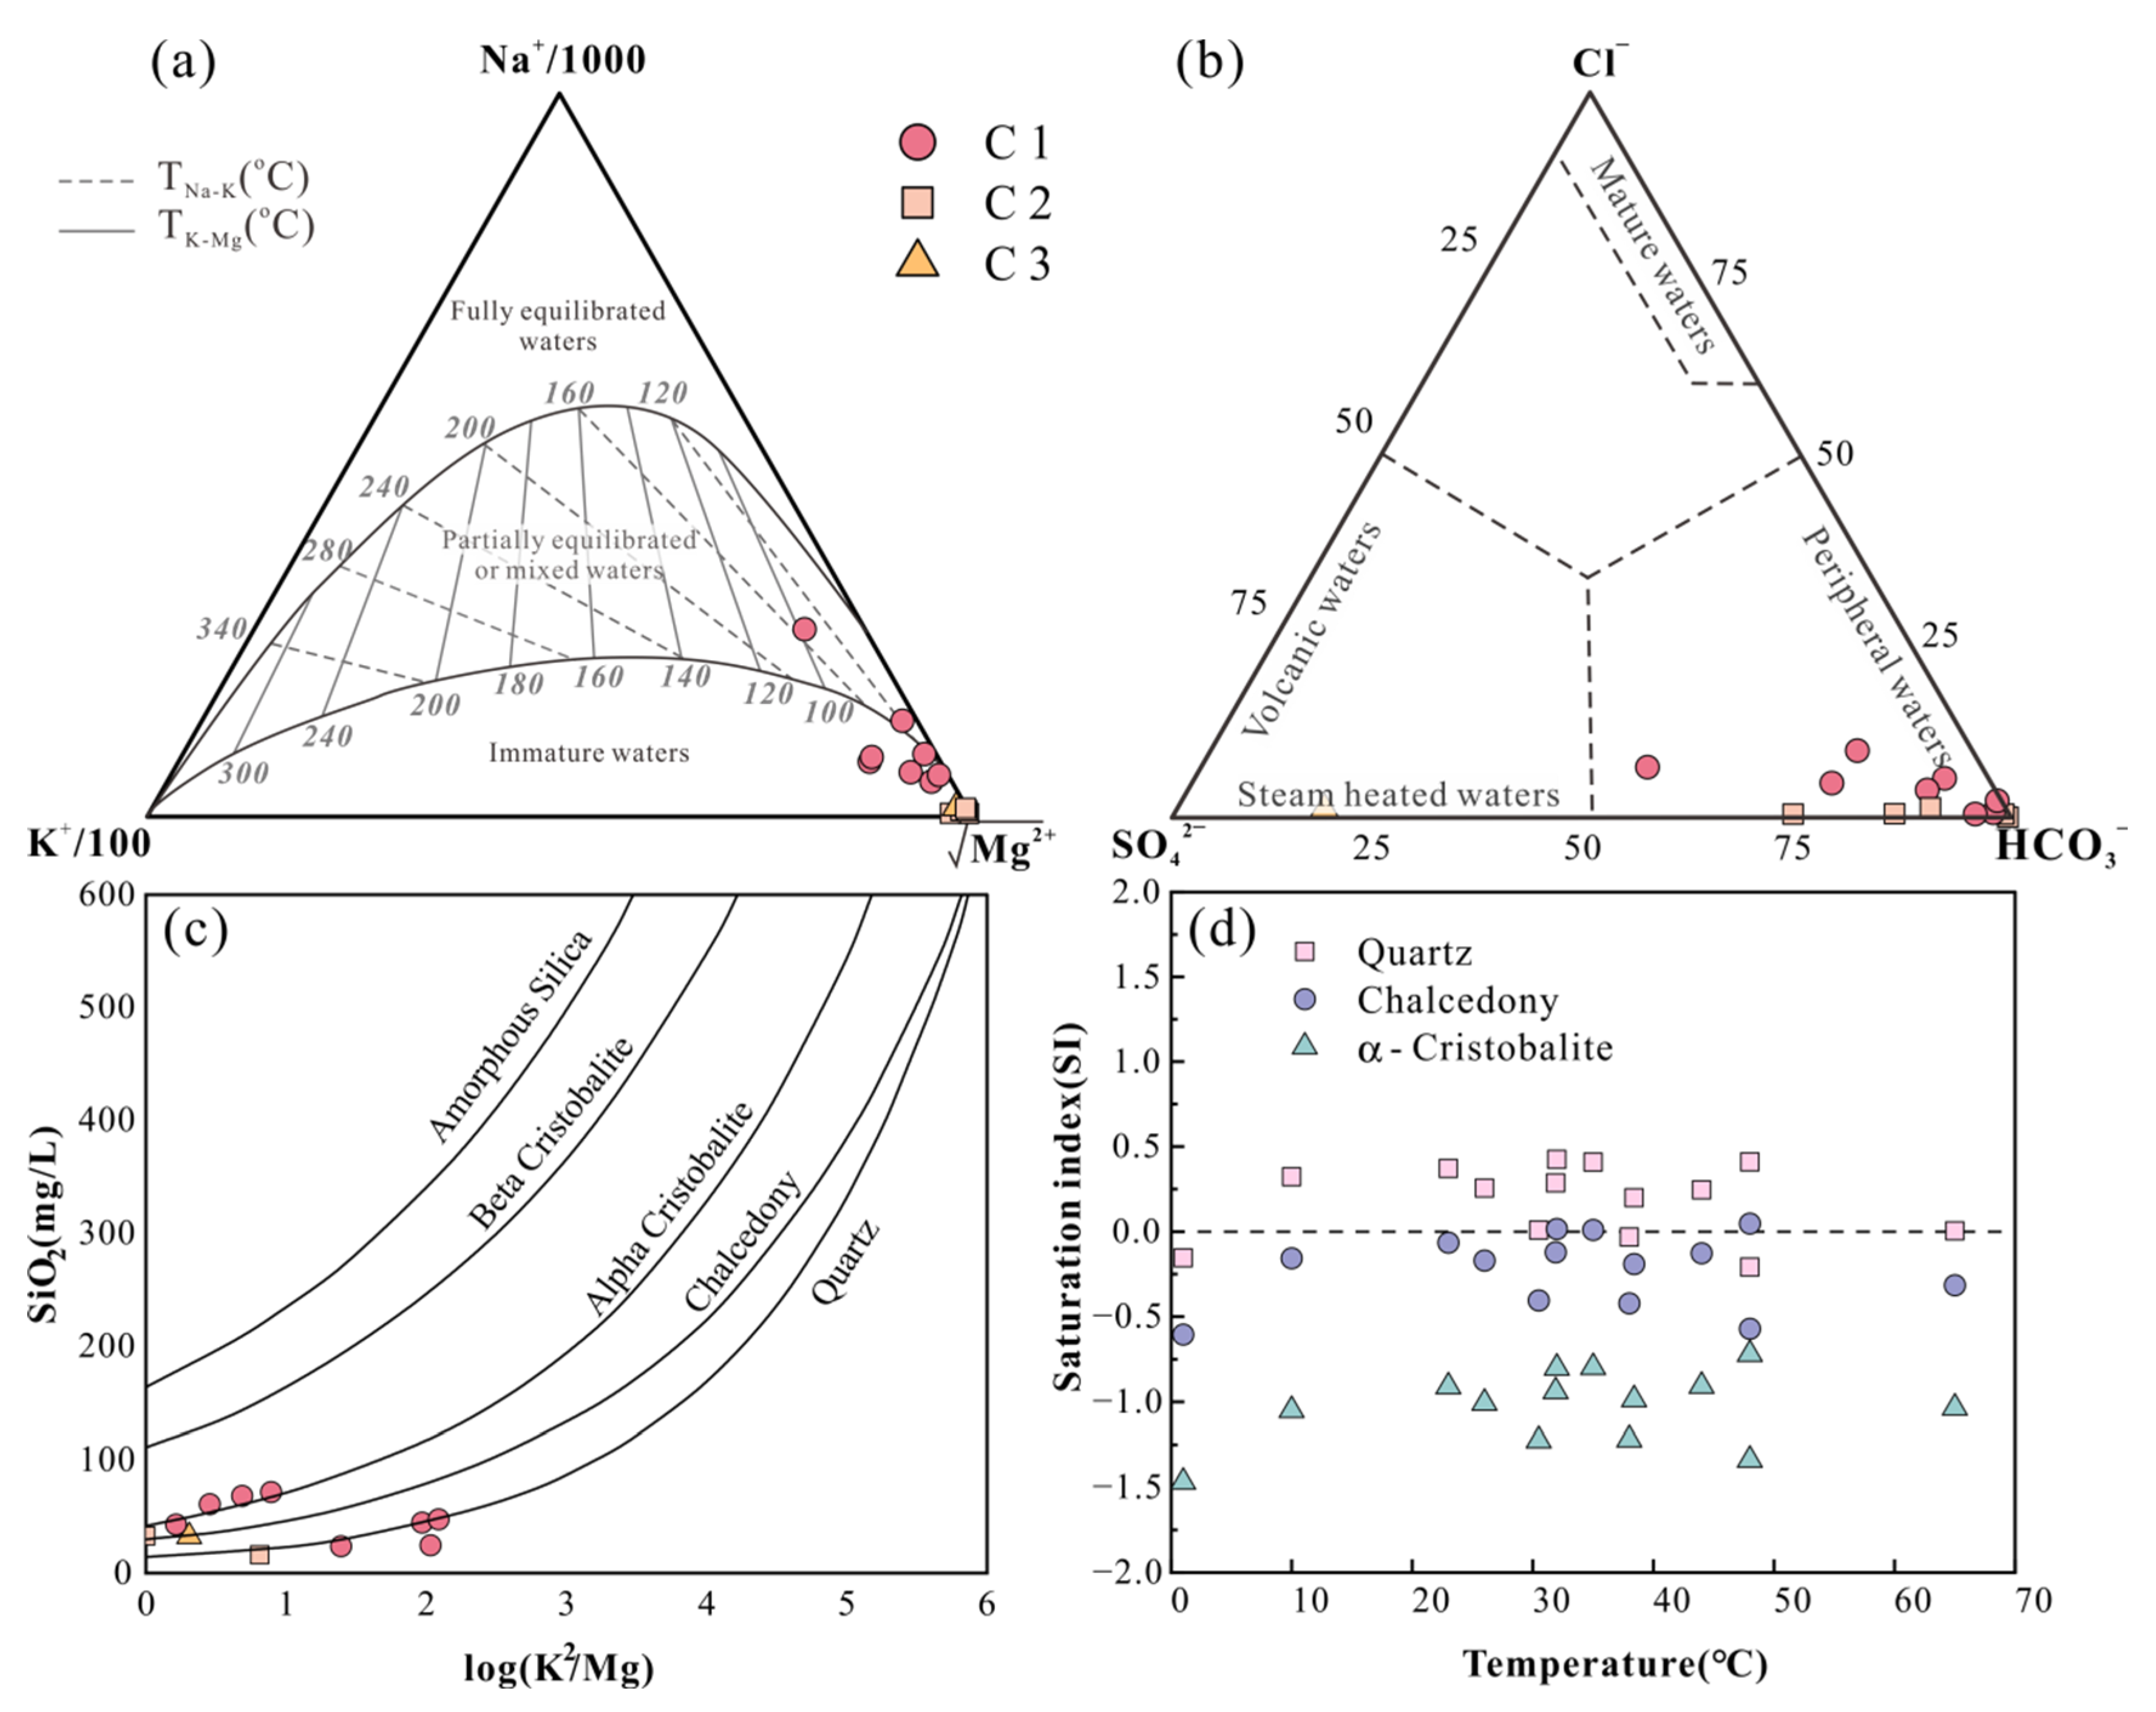
4.2. Geothermal Reservoir Temperature
4.2.1. Water–Rock Equilibrium State
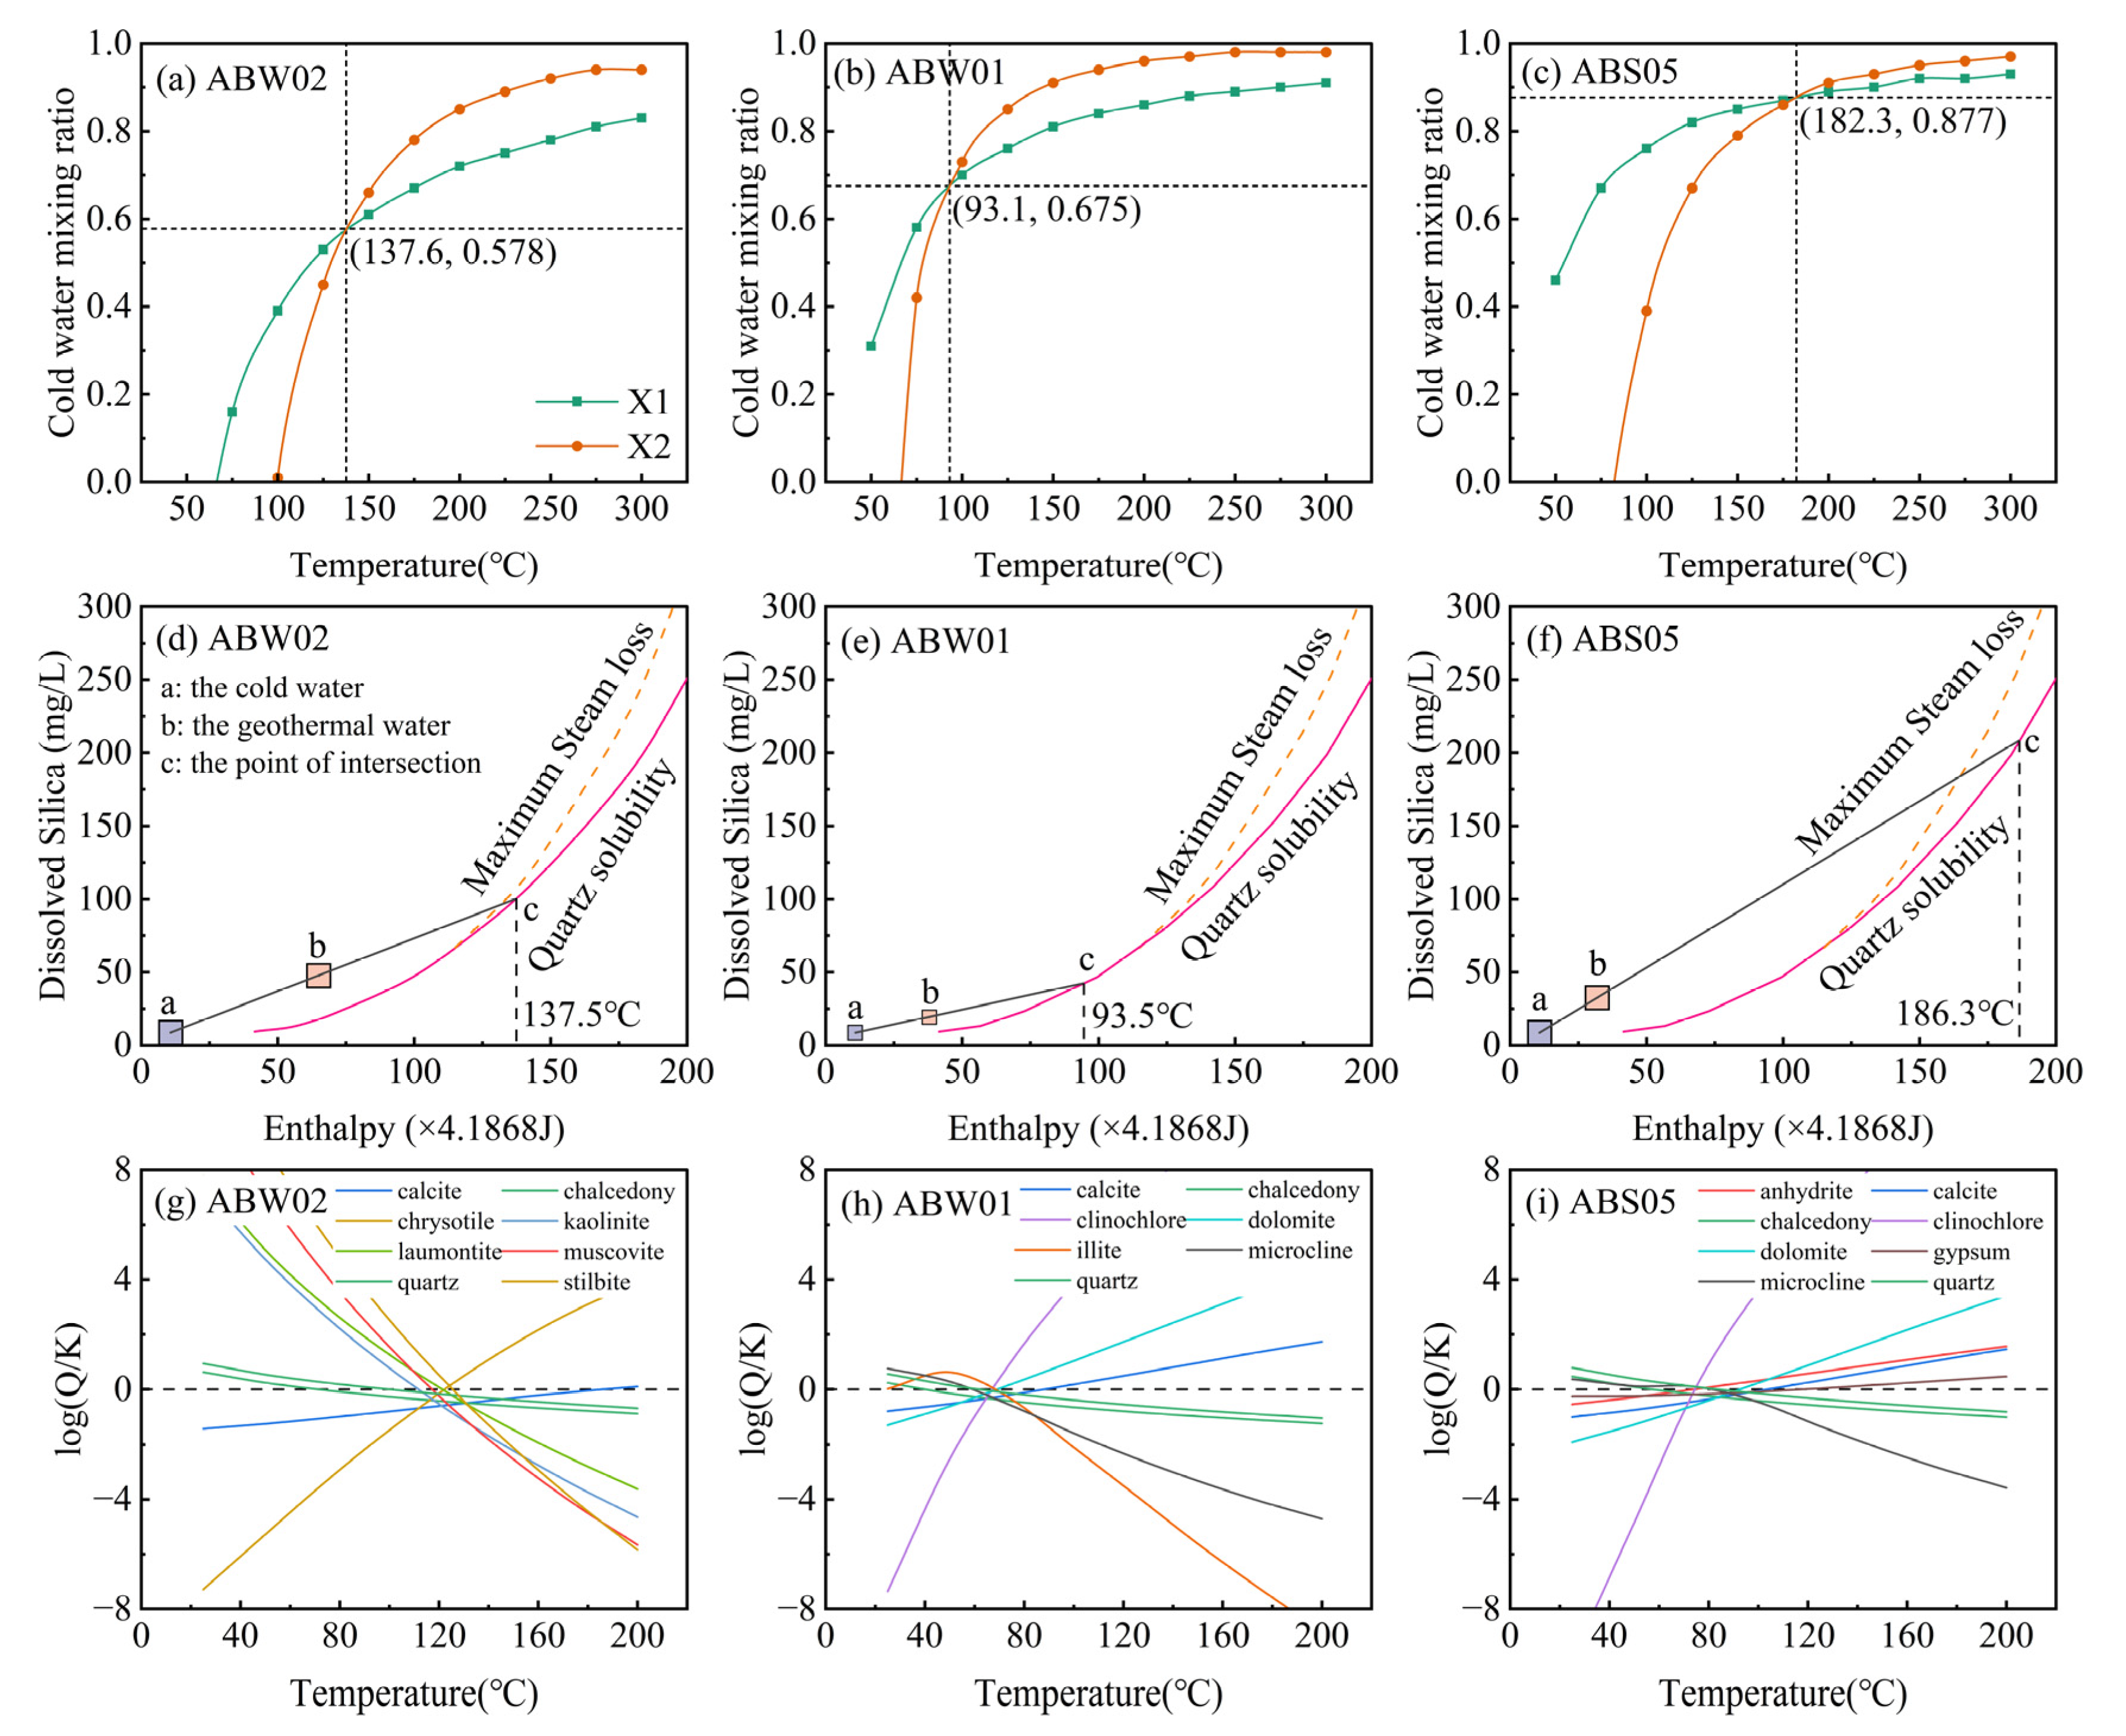
4.2.2. SiO2 Geothermometer
4.2.3. Silicon Enthalpy Mixing Model
4.2.4. Multi–Mineral Equilibrium Simulation
4.3. Recharge Sources Traced by δ2H and δ18O
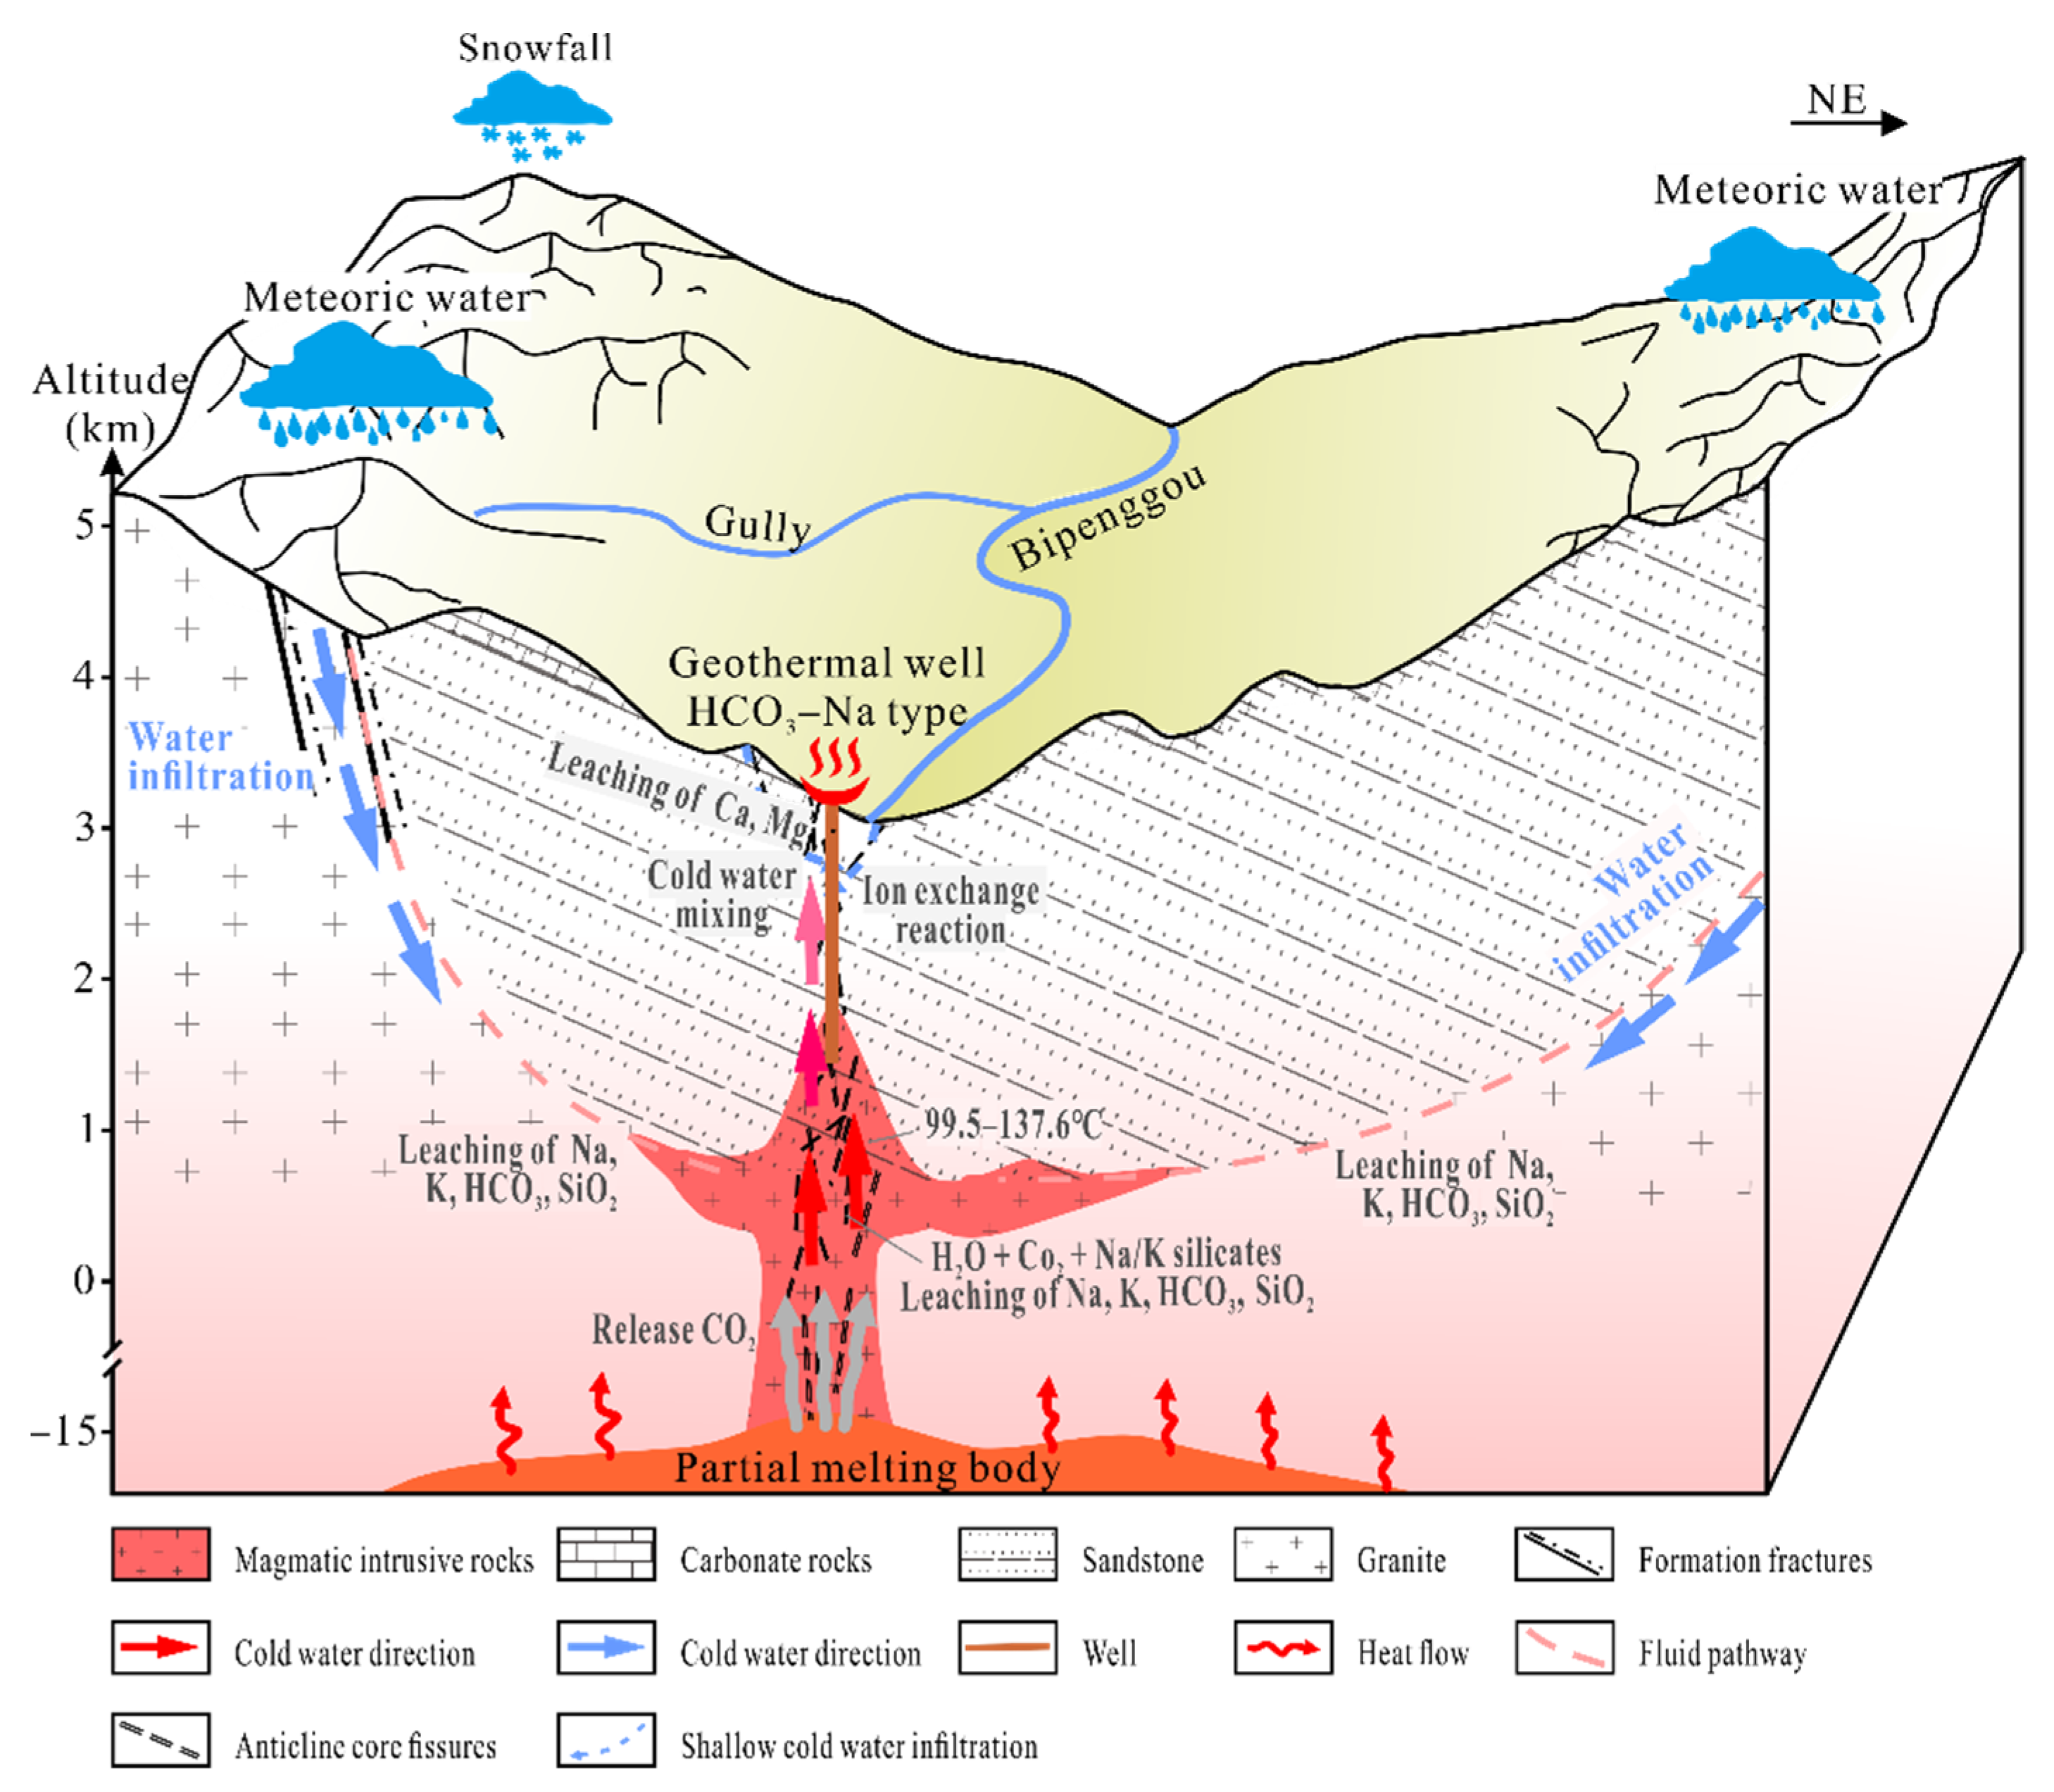
4.4. Genesis Model of Geothermal Water
4.4.1. Contact–Type of Intrusion Zone
4.4.2. Carbonate–Type in Carbonate ROCK Areas
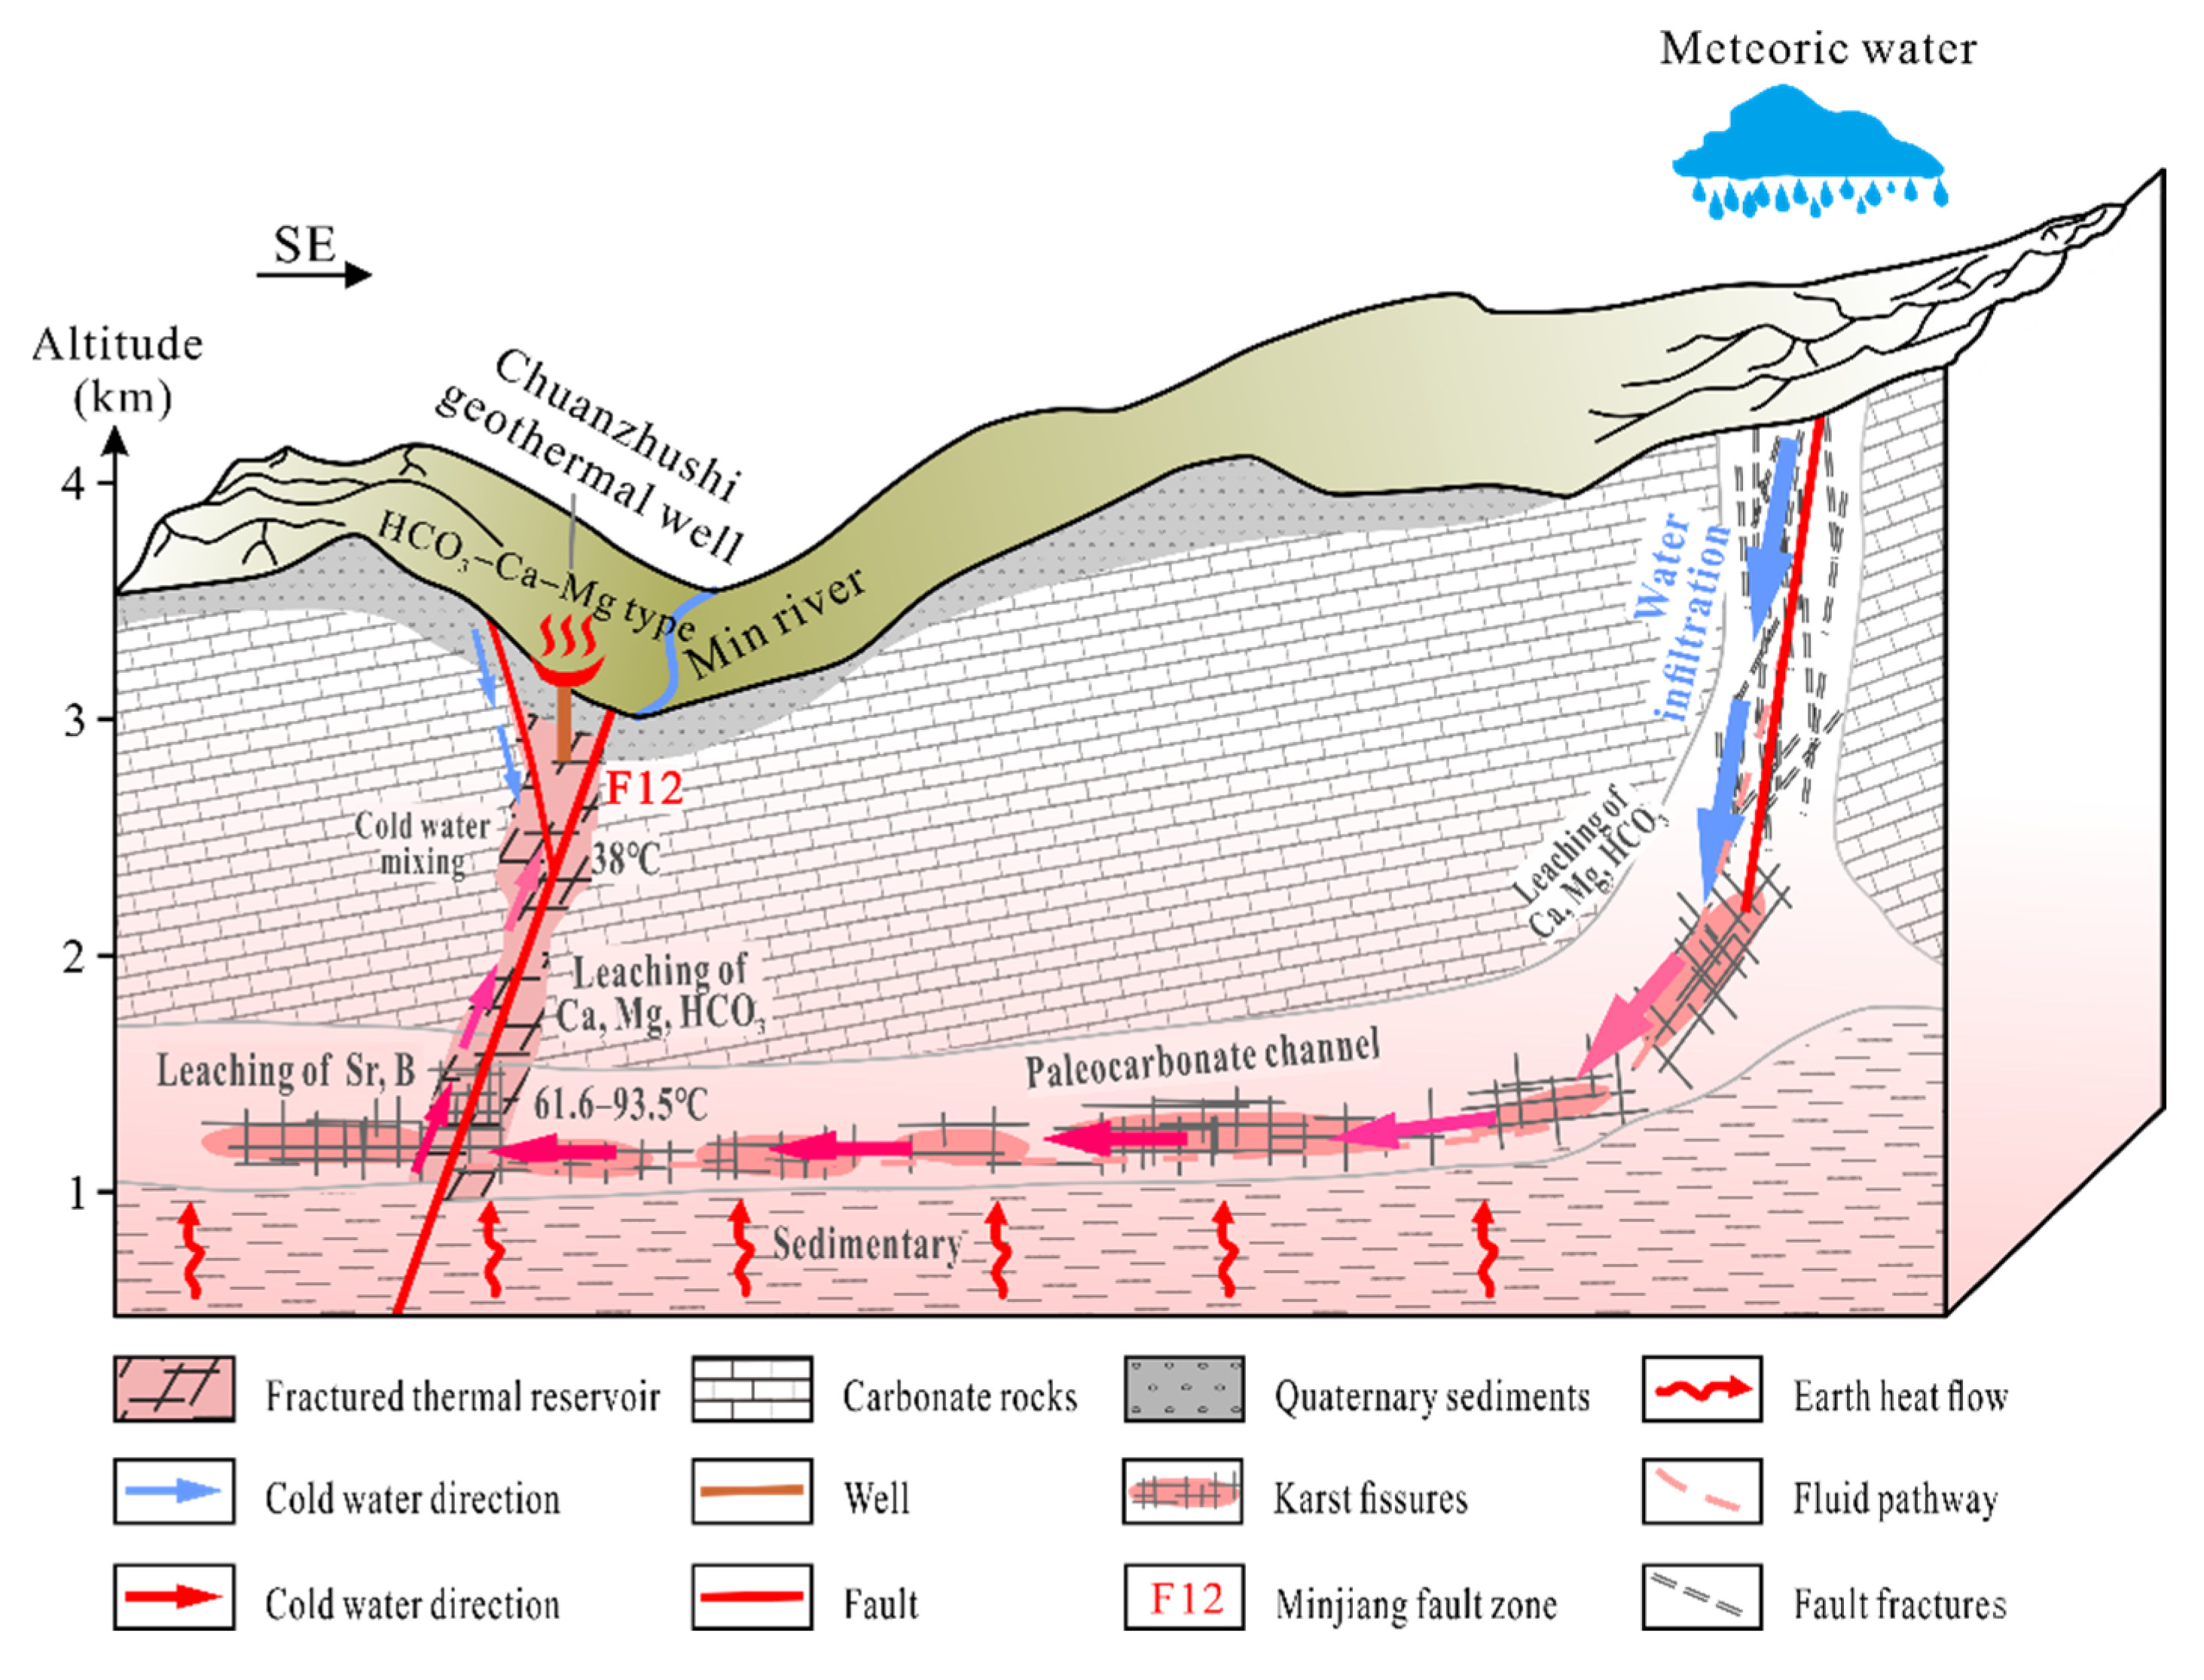
4.4.3. Fracture–Type Controlled by Deep and Large Faults
4.5. Prediction of Scaling Trends
4.5.1. Scaling Trend of Calcium Carbonate
4.5.2. Scaling Trend of Calcium Sulfate
4.5.3. Scaling Trend of Amorphous Silica
5. Conclusions
- (1)
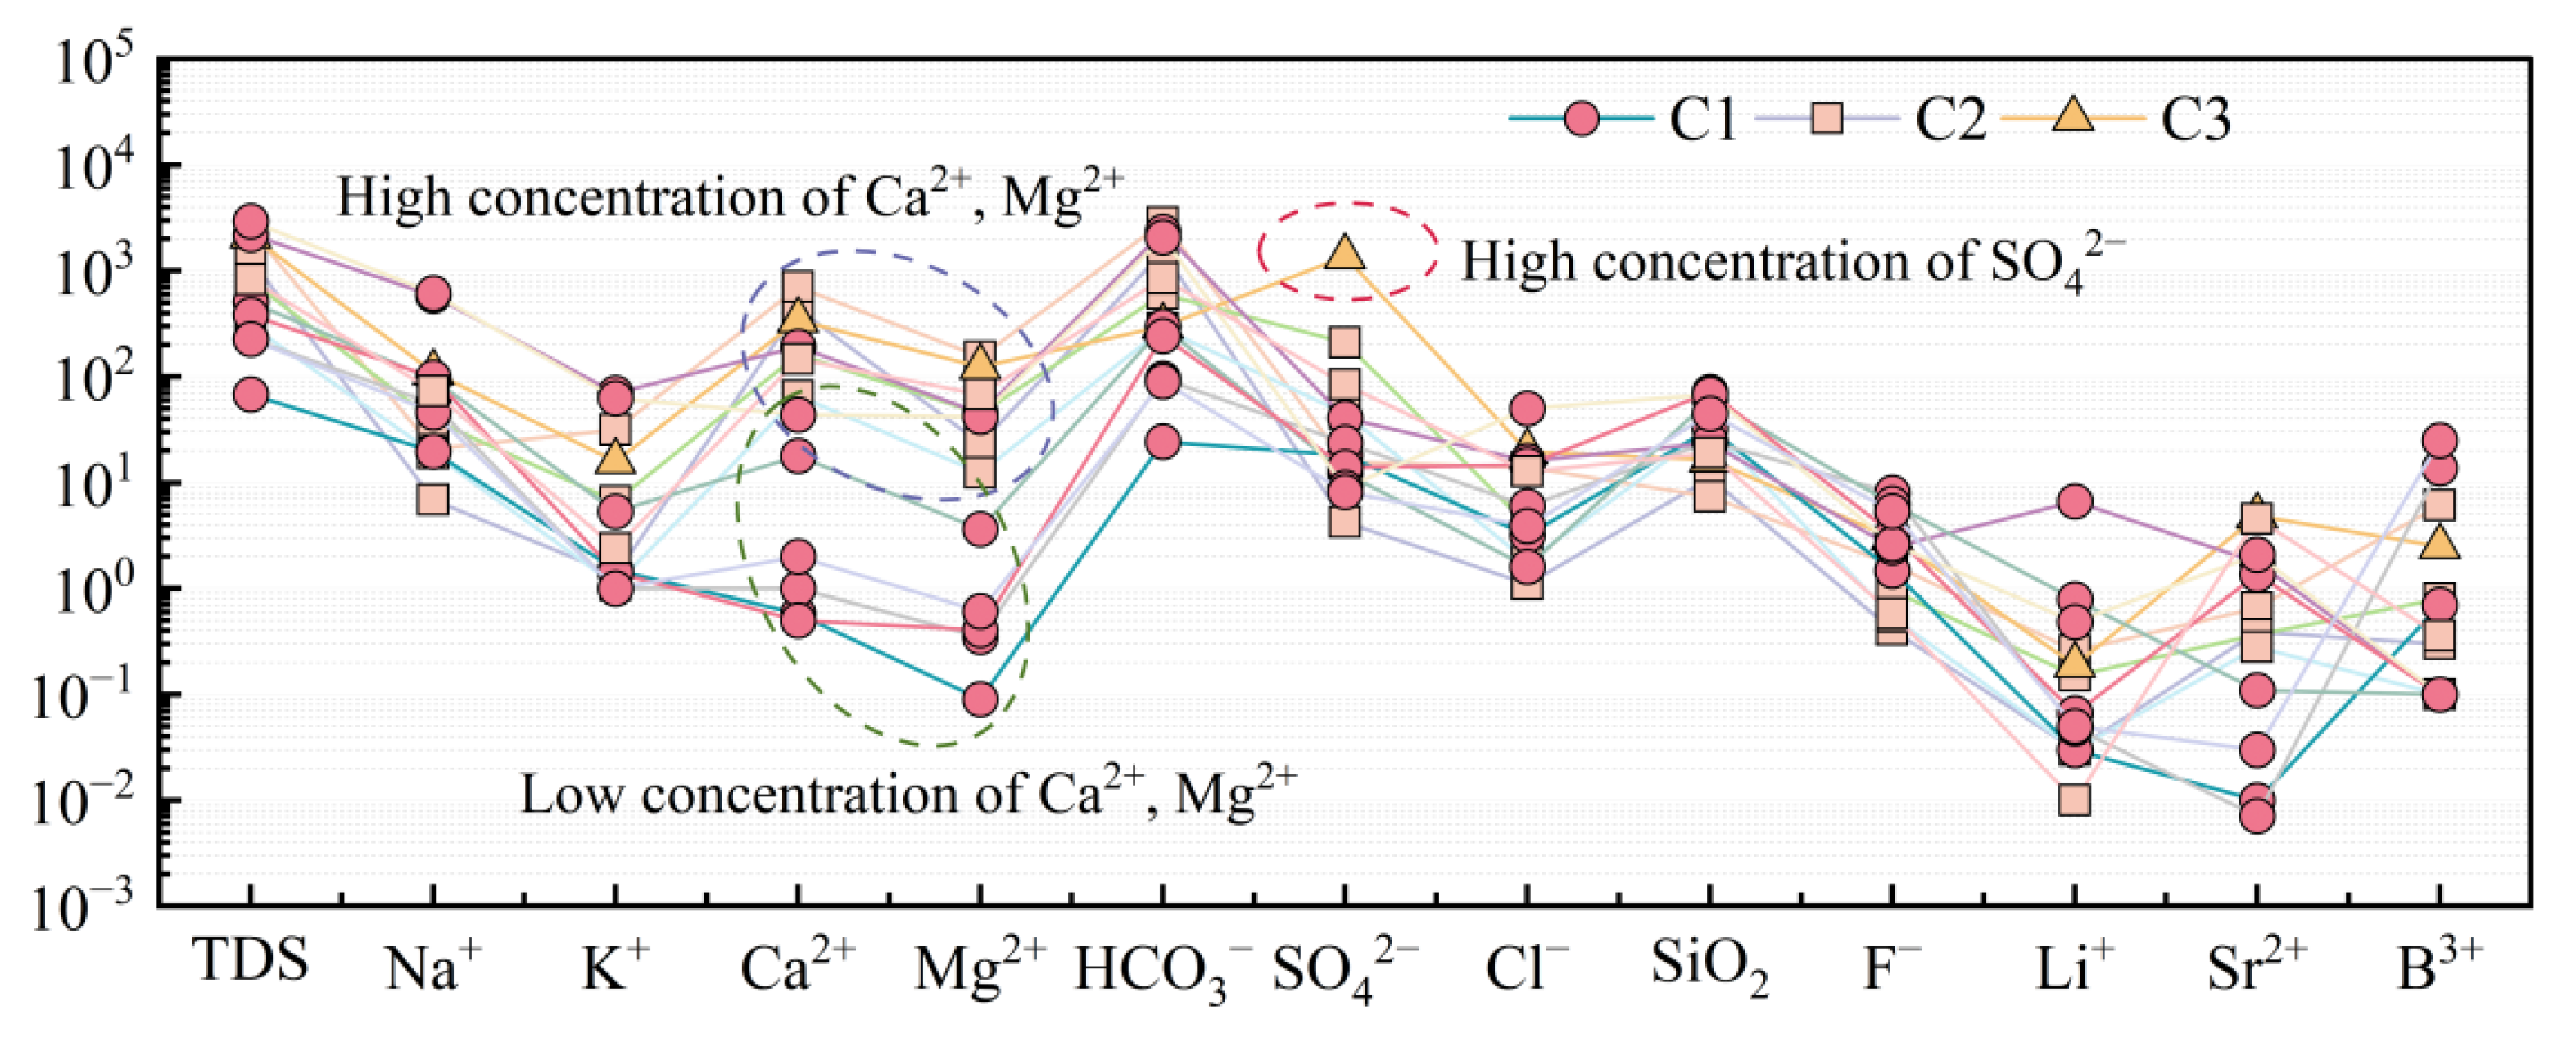
- Aba’s geothermal water was recharged by atmospheric precipitation. Three types of geothermal waters recharge at 3209–4982 m, 3621–3824 m, 3236 m, respectively. Class 1 geothermal water was found across Aba area’s southern region. Hydrochemistry types included HCO3–Na and HCO3–SO4–Na. High concentrations of HCO3− and Na+ were due to water, CO2, and sodium silicate mineral reactions and positive cation exchange. Class 2 geothermal water in northern Aba contained both HCO3–Ca and HCO3–Ca–Mg types, which generated significant amounts of HCO3−, Ca2+, and Mg2+ through carbonate mineral dissolution. Class 3 geothermal water in eastern Aba had a high SO42− concentration due to oxidation of sulfides and gypsum mineral dissolution. It was SO4–Ca–Mg type water.
- (2)
- The geothermal reservoir temperature ranges for Class 1 geothermal water 74.9–137.6 °C, whereas Class 2 had lower temperature range at 38.7–93.5 °C. Geothermal water of Class 3 (ABS05) had a reservoir temperature of 85.9–100 °C and the initial temperature of up to 186.3 °C.
- (3)
- The Aba geothermal water genesis model comprised three primary types: (1) the contact type, which was magma residual heat in Li, Maerkang, and Rantang counties’ intrusive zones; (2) carbonate–type geothermal water controlled by deep and large fractures, which took geothermal gradient as the heat source and carbonates as the thermal reservoir; and (3) the fracture type with high SO42− concentration, which was controlled by a deep, large fault and was generally found in the upper plate of the Maowen fault.
- (4)
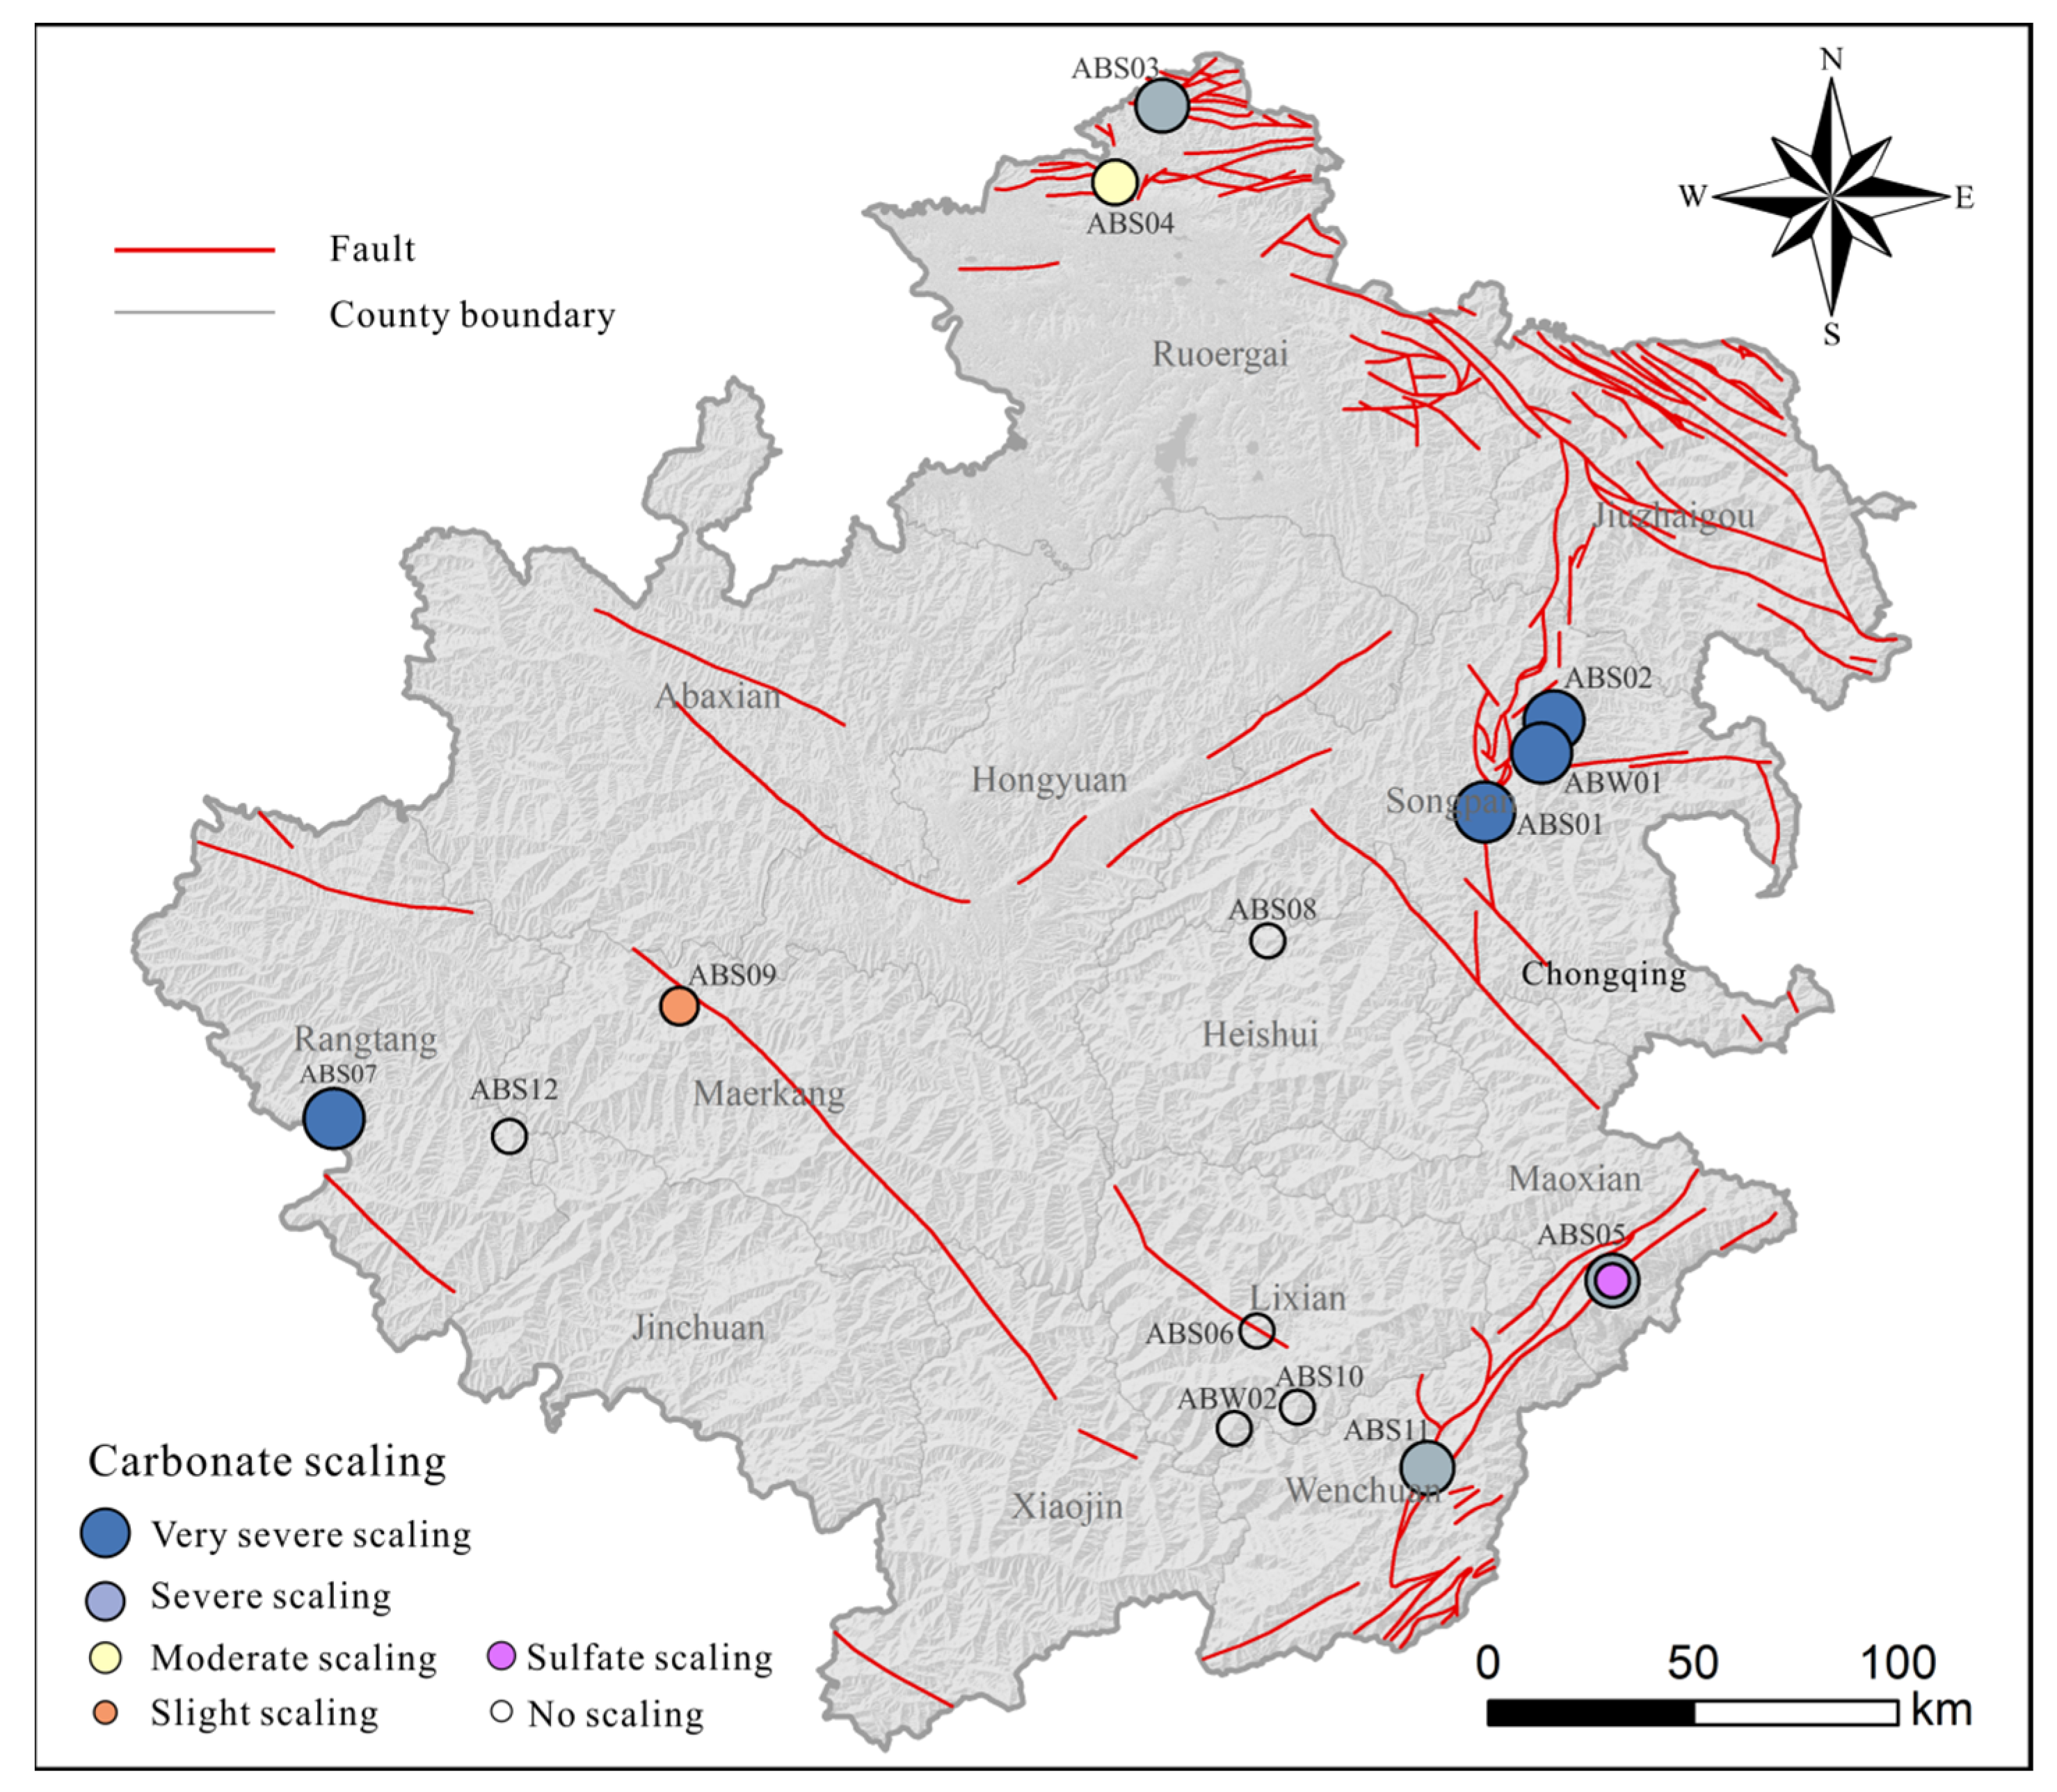
- ABS07, ABS09, and AB12 of Class 1 geothermal water will have slight to very serious calcium carbonate scaling, while ABS06, ABS08, ABS11, ABS12, and ABW02 will not. Class 2 geothermal water will have serious to very serious calcium carbonate scaling. Geothermal water in Class 3 will have severe calcium sulfate and calcium carbonate scaling.
Author Contributions
Funding
Data Availability Statement
Acknowledgments
Conflicts of Interest
References
- Capaccioni, B.; Vaselli, O.; Tassi, F.; Santo, A.P.; Huertas, A.D. Hydrogeochemistry of the thermal waters from the Sciacca Geothermal Field (Sicily, southern Italy). J. Hydrol. 2011, 396, 292–301. [Google Scholar] [CrossRef]
- Craig, J.; Absar, A.; Bhat, G.; Cadel, G.; Hafiz, M.; Hakhoo, N.; Kashkari, R.; Moore, J.; Ricchiuto, T.E.; Thurow, J. Hot springs and the geothermal energy potential of Jammu & Kashmir State, N.W. Himalaya, India. Earth-Sci. Rev. 2013, 126, 156–177. [Google Scholar]
- Lu, L.; Pang, Z.; Kong, Y.; Guo, Q.; Wang, Y.; Xu, C.; Gu, W.; Zhou, L.; Yu, D. Geochemical and isotopic evidence on the recharge and circulation of geothermal water in the Tangshan Geothermal System near Nanjing, China: Implications for sustainable development. Hydrogeol. J. 2018, 26, 1705–1719. [Google Scholar] [CrossRef]
- Wang, C.; Zheng, M. Hydrochemical Characteristics and Evolution of Hot Fluids in the Gudui Geothermal Field in Comei County, Himalayas. Geothermics 2019, 81, 243–258. [Google Scholar] [CrossRef]
- Asta, M.P.; Gimeno, M.J.; Auqué, L.F.; Gómez, J.; Acero, P.; Lapuente, P. Hydrochemistry and geothermometrical modeling of low-temperature Panticosa geothermal system (Spain). J. Volcanol. Geotherm. Res. 2012, 235–236, 84–95. [Google Scholar] [CrossRef]
- Li, J.; Sagoe, G.; Yang, G.; Liu, D.; Li, Y. The application of geochemistry to bicarbonate thermal springs with high reservoir temperature: A case study of the Batang geothermal field, western Sichuan Province, China. J. Volcanol. Geotherm. Res. 2019, 371, 20–31. [Google Scholar] [CrossRef]
- Sun, M.; Zhang, X.; Yuan, X.; Yu, Z.; Xiao, Y.; Wang, Y.; Zhang, Y. Hydrochemical Characteristics and Genetic Mechanism of Geothermal Springs in the Aba Area, Western Sichuan Province, China. Sustainability 2022, 14, 12824. [Google Scholar] [CrossRef]
- Wang, Y.; Yuan, X.; Zhang, Y.; Zhang, X.; Xiao, Y.; Duo, J.; Huang, X.; Sun, M.; Lv, G. Hydrochemical, D–O–Sr isotopic and electromagnetic characteristics of geothermal waters from the Erdaoqiao area, SW China: Insights into genetic mechanism and scaling potential. Ore Geol. Rev. 2023, 158, 105486. [Google Scholar] [CrossRef]
- Chauhan, V.; Saevarsdottir, G.; Tesfahunegn, Y.A.; Asbjornsson, E.; Gudjonsdottir, M. Computational study of two-phase flashing flow in a calcite scaled geothermal wellbore. Geothermics 2021, 97, 102239. [Google Scholar] [CrossRef]
- Zhao, H.; Huang, Y.; Deng, S.; Wang, L.; Peng, H.; Shen, X.; Ling, D.; Liu, L.; Liu, Y. Research progress on scaling mechanism and anti-scaling technology of geothermal well system. J. Dispers. Sci. Technol. 2022, 44, 1657–1670. [Google Scholar] [CrossRef]
- Tian, J.; Pang, Z.; Wang, Y.; Guo, Q. Fluid geochemistry of the Cuopu high temperature geothermal system in the eastern Himalayan syntaxis with implication on its genesis. Appl. Geochem. 2019, 110, 104422. [Google Scholar] [CrossRef]
- Ahada, C.P.S.; Suthar, S. Hydrochemistry of groundwater in North Rajasthan, India: Chemical and multivariate analysis. Environ. Earth Sci. 2017, 76, 203. [Google Scholar] [CrossRef]
- Xiao, Y.; Hao, Q.; Zhang, Y.; Zhu, Y.; Yin, S.; Qin, L.; Li, X. Investigating sources, driving forces and potential health risks of nitrate and fluoride in groundwater of a typical alluvial fan plain. Sci. Total Environ. 2022, 802, 149909. [Google Scholar] [CrossRef]
- Zhang, X.; Deng, C.; Feng, T.; Zhang, Y. Geochemical Investigations of the Geothermal Waters in the Kangding Area, SW China: Constraints from Hydrochemistry and D-O-T Isotopy. Water 2023, 15, 2761. [Google Scholar] [CrossRef]
- Chandrajith, R.; Barth, J.A.C.; Subasinghe, N.D.; Merten, D.; Dissanayake, C.B. Geochemical and isotope characterization of geothermal spring waters in Sri Lanka: Evidence for steeper than expected geothermal gradients. J. Hydrol. 2013, 476, 360–369. [Google Scholar] [CrossRef]
- Li, X.; Huang, X.; Liao, X.; Zhang, Y. Hydrogeochemical Characteristics and Conceptual Model of the Geothermal Waters in the Xianshuihe Fault Zone, Southwestern China. Int. J. Environ. Res. Public Health 2020, 17, 500. [Google Scholar] [CrossRef]
- Wei, M.; Tian, T.; Sun, Y.; Li, X. A study of the scaling trend of thermal groundwater in Kangding county of Sichuan. Hydrogeol. Eng. Geol. 2012, 39, 132–138. (In Chinese) [Google Scholar]
- Liu, W.; Guan, L.; Liu, Y.; Xie, X.; Zhang, M.; Chen, B.; Xu, S.; Sano, Y. Fluid geochemistry and geothermal anomaly along the Yushu-Ganzi-Xianshuihe fault system, eastern Tibetan Plateau: Implications for regional seismic activity. J. Hydrol. 2022, 607, 127554. [Google Scholar] [CrossRef]
- Qi, J.; Xu, M.; An, C.; Wu, M.; Zhang, Y.; Li, X.; Zhang, Q.; Lu, G. Characterizations of geothermal springs along the Moxi deep fault in the western Sichuan plateau, China. Phys. Earth Planet. Inter. 2017, 263, 12–22. [Google Scholar] [CrossRef]
- Zhang, J.; Li, W.; Tang, X.; Tian, J.; Wang, Y.; Guo, Q.; Pang, Z. Geothermal data analysis at the high-temperature hydrothermal area in Western Sichuan. Sci. China Earth Sci. 2017, 60, 1507–1521. [Google Scholar] [CrossRef]
- Zhang, W.; Wang, G.; Xing, L.; Li, T.; Zhao, J. Geochemical response of deep geothermal processes in the Litang region, Western Sichuan. Energy Explor. Exploit. 2019, 37, 626–645. [Google Scholar] [CrossRef]
- Tang, X.; Zhang, J.; Pang, Z.; Hu, S.; Tian, J.; Bao, S. The eastern Tibetan Plateau geothermal belt, western China: Geology, geophysics, genesis, and hydrothermal system. Tectonophysics 2017, 717, 433–448. [Google Scholar] [CrossRef]
- Zhang, X.; Liu, J.; Guo, B.; Wang, Z.; Li, Y. Temporal and spatial characteristics of snow cover in Aba, Sichuan from 2000 to 2015. J. Arid Land Resour. Environ. 2019, 33, 131–136. [Google Scholar]
- Wang, E.; Meng, K.; Su, Z.; Meng, Q.; Chu, J.J.; Chen, Z.; Wang, G.; Shi, X.; Liang, X. Block rotation: Tectonic response of the Sichuan basin to the southeastward growth of the Tibetan Plateau along the Xianshuihe-Xiaojiang fault. Tectonics 2014, 33, 686–718. [Google Scholar] [CrossRef]
- Fournier, R.O. Chemical geothermometers and mixing models for geothermal systems. Geothermics 1977, 5, 41–50. [Google Scholar] [CrossRef]
- Singh, C.K.; Kumar, A.; Shashtri, S.; Kumar, A.; Kumar, P.; Mallick, J. Multivariate statistical analysis and geochemical modeling for geochemical assessment of groundwater of Delhi, India. J. Geochem. Explor. 2017, 175, 59–71. [Google Scholar] [CrossRef]
- Klapper, H.S.a.; Bäßler, R.b.; Sobetzki, J.b.; Weidauer, K.b.; Stürzbecher, D.b. Corrosion resistance of different steel grades in the geothermal fluid of Molasse Basin (Article). Mater. Corros. 2013, 64, 764–771. [Google Scholar] [CrossRef]
- Pátzay, G.; Stáhl, G.; Kármán, F.H.; Kálmán, E. Modeling of scale formation and corrosion from geothermal water. Electrochim. Acta 1998, 43, 137–147. [Google Scholar] [CrossRef]
- Mundhenk, N.; Huttenloch, P.; Sanjuan, B.; Kohl, T.; Steger, H.; Zorn, R. Corrosion and scaling as interrelated phenomena in an operating geothermal power plant. Corros. Sci. 2013, 70, 17–28. [Google Scholar] [CrossRef]
- Piper, A. A Graphic Procedure in the Geochemical Interpretation of Water-Analyses. Eos Trans. Am. Geophys. Union 1944, 25, 914–923. [Google Scholar] [CrossRef]
- Arnórsson, S. The use of mixing models and chemical geothermometers for estimating underground temperatures in geothermal systems. J. Volcanol. Geotherm. Res. 1985, 23, 299–335. [Google Scholar] [CrossRef]
- Arnórsson, S.; Andrésdóttir, A. Processes controlling the distribution of boron and chlorine in natural waters in Iceland. Geochim. Cosmochim. Acta 1995, 59, 4125–4146. [Google Scholar] [CrossRef]
- Guo, Q.; Wang, Y. Geochemistry of hot springs in the Tengchong hydrothermal areas, Southwestern China. J. Volcanol. Geotherm. Res. 2012, 215–216, 61–73. [Google Scholar] [CrossRef]
- Yi, L.; Qi, J.; Li, X.; Xu, M.; Zhang, X.; Zhang, Q.; Tang, Y. Geochemical characteristics and genesis of the high-temperature geothermal systems in the north section of the Sanjiang Orogenic belt in southeast Tibetan Plateau. J. Volcanol. Geotherm. Res. 2021, 414, 107244. [Google Scholar] [CrossRef]
- Zhang, Y.; Dai, Y.; Wang, Y.; Huang, X.; Xiao, Y.; Pei, Q. Hydrochemistry, quality and potential health risk appraisal of nitrate enriched groundwater in the Nanchong area, southwestern China. Sci. Total Environ. 2021, 784, 147186. [Google Scholar] [CrossRef] [PubMed]
- Holland, H.D. Solutions, minerals and equilibria: R. M. Garrels and C. L. Christ: Harper and Row, New York, 1965. 450 pp. $14.25. Geochim. Cosmochim. Acta 1966, 30, 457–458. [Google Scholar] [CrossRef]
- Giggenbach, W.F. Geothermal solute equilibria. derivation of Na-K-Mg-Ca geoindicators. Geochim. Cosmochim. Acta 1988, 52, 2749–2765. [Google Scholar] [CrossRef]
- Zhang, Y.; Xu, M.; Li, X.; Qi, J.; Zhang, Q.; Guo, J.; Yu, L.; Zhao, R. Hydrochemical Characteristics and Multivariate Statistical Analysis of Natural Water System: A Case Study in Kangding County, Southwestern China. Water 2018, 10, 80. [Google Scholar] [CrossRef]
- Giggenbach, W.F.; Glover, R.B. Tectonic regime and major processes governing the chemistry of water and gas discharges from the rotorua geothermal field, New Zealand. Geothermics 1992, 21, 121–140. [Google Scholar] [CrossRef]
- Giggenbach, W.F. Collection and analysis of geothermal and volcanic water and gas discharges. Chem. Div. DSIR Rep. 1989, 2401, 81. [Google Scholar]
- Pang, Z.-H.; Reed, M. Theoretical Chemical Thermometry on Geothermal Waters: Problems and Methods. Geochim. Cosmochim. Acta 1998, 62, 1083–1091. [Google Scholar] [CrossRef]
- Tian, J.; Pang, Z.; Guo, Q.; Wang, Y.; Li, J.; Huang, T.; Kong, Y. Geochemistry of geothermal fluids with implications on the sources of water and heat recharge to the Rekeng high-temperature geothermal system in the Eastern Himalayan Syntax. Geothermics 2018, 74, 92–105. [Google Scholar] [CrossRef]
- Cheng, Y.; Pang, Z.; Kong, Y.; Chen, X.; Wang, G. Imaging the heat source of the Kangding high-temperature geothermal system on the Xianshuihe fault by magnetotelluric survey. Geothermics 2022, 102, 102386. [Google Scholar] [CrossRef]
- Zhang, X.G. Application of isotopic geochemistry in geothermal exploration. Hydrogeol. Eng. Geol. 1988, 1, 28–31. [Google Scholar]
- Craig, H. Isotopic variations in meteoric waters. Science 1961, 133, 1702–1703. [Google Scholar] [CrossRef]
- Kong, Y.; Wang, K.; Li, J.; Pang, Z. Stable Isotopes of Precipitation in China: A Consideration of Moisture Sources. Water 2019, 11, 1239. [Google Scholar] [CrossRef]
- Blasch, K.W.; Bryson, J.R. Distinguishing sources of ground water recharge by using δ2H and δ18O. Groundwater 2007, 45, 294–308. [Google Scholar] [CrossRef]
- Yu, J.; Zhang, H.; Yu, F.; Liu, D. Oxygen and hydrogen isotopic compositions of meteoric waters in the eastern part of Xizang. Chin. J. Geochem. 1984, 13, 93–101. [Google Scholar] [CrossRef]
- Ke, B.; Wu, Y.; Tian, M.; Li, C.; Song, P. Hydrogeochemical characteristics and formation mechanism of Jiyu Hot Spring in Sichuan. Ground Water 2022, 44, 7–10. (In Chinese) [Google Scholar]
- Gabriella Stahl, E.K. Study of calcite scaling and corrosion processes in geothermal systems. Geothermics 2000, 29, 105–119. [Google Scholar] [CrossRef]
- Bjørnstad, T.; Stamatakis, E. Mechanisms of mineral scaling in oil and geothermal wells studied in laboratory experiments by nuclear techniques. Czechoslov. J. Phys. 2006, 56, 405–416. [Google Scholar] [CrossRef]
- Arthur, P.; Schmidt, F.A.H.; van Os, B.J.H.; Schuiling, R.D. Production of 210Pb from a Slochteren Sandstone gas reservoir. Appl. Geochem. 2000, 15, 1317–1329. [Google Scholar]
- Holl, H.G.; Hurter, S.; Saadat, A.; Köhler, S.; Huenges, E. First-hand experience in a second-hand borehole: Hydraulic experiments and scaling in the geothermal well Groß Schönebeck after reopening. In Proceedings of the International Geothermal Conference, Reykjavík, Iceland, September, 2003; Available online: https://www.researchgate.net/profile/Markus-Wolfgramm/publication/266880623_First_hand_experience_in_a_second_hand_borehole_Hydraulic_experiments_and_scaling_in_the_geothermal_well_Gross_Schonebeck_after_reopening/links/5448b1b20cf22b3c14e318dc/First-hand-experience-in-a-second-hand-borehole-Hydraulic-experiments-and-scaling-in-the-geothermal-well-Gross-Schoenebeck-after-reopening.pdf (accessed on 24 September 2023).
- Gunnarsson, I.; Arnórsson, S. Impact of silica scaling on the efficiency of heat extraction from high-temperature geothermal fluids. Geothermics 2005, 34, 320–329. [Google Scholar] [CrossRef]
- Demir, M.M.; Baba, A.; Atilla, V.; Inanli, M. Types of the scaling in hyper saline geothermal system in northwest Turkey. Geothermics 2014, 50, 1–9. [Google Scholar] [CrossRef]
- Jones, B. Review of aragonite and calcite crystal morphogenesis in thermal spring systems. Sediment. Geol. 2017, 354, 9–23. [Google Scholar] [CrossRef]
- Wanner, C.; Eichinger, F.; Jahrfeld, T.; Diamond, L.W. Causes of abundant calcite scaling in geothermal wells in the Bavarian Molasse Basin, Southern Germany. Geothermics 2017, 70, 324–338. [Google Scholar] [CrossRef]
- MacAdam, J.; Parsons, S.A. Calcium carbonate scale formation and control. Rev. Environ. Sci. Biotechnol. 2004, 3, 159–169. [Google Scholar] [CrossRef]
- Alroomi, Y.M.; Hussain, K.F. Potential kinetic model for scaling and scale inhibition mechanism. Desalination 2016, 393, 186–195. [Google Scholar] [CrossRef]
- Larson, T.E.; Sollo, F.W., Jr. Loss in Water Main Carrying Capacity. J.-Am. Water Work. Assoc. 1967, 59, 1565–1572. [Google Scholar] [CrossRef]
- Zhang, H.; Hu, Y.; Yun, Z.; Qu, Z. Applying Hydro-Geochemistry Simulating Technology to Study Scaling of the High-Temperature Geothermal Well in Kangding County. Adv. New Renew. Energy 2016, 4, 111–117. (In Chinese) [Google Scholar] [CrossRef]


| Method | Equation | No. | Reference |
|---|---|---|---|
| Larson Index (LI) | LI = ([Cl−] + [SO42−])/[ALK] | (6) | [17,27] |
| Ryzner Index (RI) | RI = 2pH1 − pH2 | (7) | [17,28,29] |
| pH1 = log[Ca2+] − log[ALK] + Kc | (8) | ||
| pH2 = log[Ca2+] − log[ALK] + Ke | (9) | ||
| T(°F) = 32 + 9/5 × T | (10) | ||
| Relative saturation of gypsum (R.Sgypsum) | R.Sgypsum = 10^(logCa2+ + logSO42− − logKgypsum) | (11) | [17] |
| Relative saturation of silica (R.SSiO2) | R.SSiO2 = SiO2/(2.446 × 10,000 × e^(−1553/Tk)) | (12) |
| ID | Name | Class | Altitude (m) | T (°C) | pH | TDS (mg/L) | δ2H | δ18O | Recharge Elevation (m) | No Steam Loss (°C) | Maximum Steam Loss (°C) | Reservoir Lithology | |
|---|---|---|---|---|---|---|---|---|---|---|---|---|---|
| ABS06 a | Guergou | 1 | 2583 | 48.0 | 9.1 | 68 | −118.5 | −16.6 | 4459 | 70.1 | 74.9 | Granite | |
| ABS07 a | Kejiu | 1 | 3083 | 26.0 | 7.0 | 2190 | −120.3 | −16.1 | 4529 | 71.6 | 76.1 | Sandstone | |
| ABS08 b | Xiadagai | 1 | 2369 | 35.0 | 9.1 | 229 | −86.0 | −12.1 | 3209 | 111.3 | 110.7 | Calcisilicarenite | |
| ABS09 b | Baoyan | 1 | 2640 | 48.0 | 7.4 | 511 | – | – | – | 119.4 | 117.7 | Slate/Phyllite | |
| ABS10 b | Jiashikou | 1 | 2925 | 44.0 | 9.3 | 384 | – | – | – | 117.0 | 115.6 | Gravel–bearing sandstone | |
| ABS11 b | Guanyinmiao | 1 | 2612 | 32.0 | 7.5 | 2949 | – | – | – | 96.6 | 98.1 | Limestone/Dolomite | |
| ABS12 d | Youri | 1 | 3920 | 23.0 | 9.5 | 227.4 | −118.6 | −16.4 | 4463 | 94.9 | 96.6 | Sandstone | |
| ABW02 a | Bipenggou | 1 | 3067 | 65.0 | 8.1 | 258 | −132.1 | −18.1 | 4982 | 99.5 | 100.6 | Granite | |
| ABS01 a | Erdaohai | 2 | 3430 | 18.3 | 6.5 | 1280 | −99.4 | −14.0 | 3725 | 29.8 | 38.7 | Limestone | |
| ABS02 a | Yuanshanzi | 2 | 3081 | 10.5 | 6.6 | 2450 | – | – | – | 55.6 | 62.0 | Limestone/Dolomite | |
| ABS03 a | Jiangzha | 2 | 3253 | 38.4 | 6.6 | 812 | −102.5 | −15.3 | 3844 | 83.0 | 86.2 | Siliceous dolomite | |
| ABS04 a | Heta | 2 | 3360 | 30.5 | 7.3 | 305 | −96.7 | −14.3 | 3621 | 56.4 | 62.6 | Conglomerate mixed with metamorphic limestone | |
| ABW01 c | Chuanzhusi | 2 | 3010 | 38.0 | 7.4 | 834 | – | – | – | 61.6 | 67.4 | limestone | |
| ABS05 a | Jiyugou | 3 | 1703 | 31.9 | 7.2 | 2150 | −86.7 | −13.6 | 3236 | 82.6 | 85.9 | Metamorphic dolomite | |
| ID | Ca2+ | Mg2+ | Na+ | K+ | Cl− | SO42− | HCO3− | F− | Li+ | Sr2+ | B3+ | SiO2 | Hydrochemical type |
| ABS06 | 0.6 | 0.1 | 19.7 | 1.5 | 3.2 | 18.2 | 24.5 | 1.5 | 0.03 | 0.01 | 0.1 | 23.8 | HCO3–SO4–Na |
| ABS07 | 193.0 | 45.2 | 587.0 | 69.6 | 16.1 | 40.8 | 2339.0 | 2.5 | 6.7 | 1.8 | 13.8 | 24.7 | HCO3–Na |
| ABS08 | 1.0 | 0.4 | 55.2 | 1.0 | 6.0 | 23.7 | 96.1 | 8.4 | 0.1 | 0.01 | 0.1 | 60.9 | HCO3–Na |
| ABS09 | 18.0 | 3.7 | 94.2 | 5.3 | 1.6 | 12.3 | 297.0 | 6.3 | 0.8 | 0.1 | 0.1 | 71.7 | HCO3–Na |
| ABS10 | 0.5 | 0.4 | 97.9 | 1.4 | 14.7 | 14.0 | 243.0 | 3.3 | 0.1 | 136.0 | 0.1 | 68.3 | HCO3–Na |
| ABS11 | 43.5 | 41.7 | 615.0 | 62.4 | 49.9 | 9.0 | 2075.0 | 2.6 | 0.5 | 2.1 | 25.1 | 44.7 | HCO3–Na |
| ABS12 | 2.0 | 0.6 | 46.0 | 1.0 | 3.9 | 8.2 | 90.0 | 5.4 | 0.1 | 0.03 | 0.4 | 43.0 | HCO3–Na |
| ABW02 | 0.5 | 0.1 | 94.2 | 2.7 | 21.1 | 31.1 | 176.5 | 9.3 | 0.1 | 0.01 | 0.2 | 47.6 | HCO3–Na |
| ABS01 | 436.0 | 23.3 | 6.9 | 1.3 | 1.1 | 4.2 | 1514.0 | 0.4 | 0.03 | 0.4 | 0.3 | 7.4 | HCO3–Ca |
| ABS02 | 707.0 | 154.0 | 20.9 | 31.6 | 14.0 | 15.8 | 2863.0 | 1.7 | 0.3 | 0.7 | 6.1 | 16.2 | HCO3–Ca–Mg |
| ABS03 | 163.0 | 44.6 | 39.0 | 6.7 | 4.0 | 210.0 | 606.8 | 1.0 | 0.2 | 0.4 | 0.8 | 32.7 | HCO3–SO4–Ca–Mg |
| ABS04 | 66.0 | 12.4 | 18.9 | 1.1 | 1.8 | 44.8 | 285.0 | 0.5 | 0.03 | 0.3 | 0.1 | 16.5 | HCO3–Ca |
| ABW01 | 146.3 | 68.1 | 73.1 | 2.4 | 12.8 | 84.0 | 854.3 | 0.6 | 0.01 | 4.6 | 2.5 | 19.1 | HCO3–Ca–Mg |
| ABS05 | 343.0 | 124.0 | 110.0 | 15.9 | 19.7 | 1360.0 | 301.6 | 3.0 | 0.2 | 4.8 | 0.7 | 32.4 | SO4–Ca–Mg |
| ABD01 | 59.9 | 10.4 | 17.1 | 1.5 | 1.8 | 55.3 | 221.9 | 0.1 | 0.1 | 0.3 | 0.1 | 8.5 | HCO3–Ca |
| ID | Class | Cl ion Milligram Equivalent Ratio | RI1 | RI2 | RI (Average) | Scaling Trend of Carbonate Minerals | R.Sgypsum | R.SSiO2 |
|---|---|---|---|---|---|---|---|---|
| ABS06 | 1 | 10.4% | 9.2 | 10.5 | 9.9 | No scaling | 0.0001 | 0.1 |
| ABS07 | 1 | 1.1% | 3.1 | 3.7 | 3.4 | Very severe | 0.0194 | 0.2 |
| ABS08 | 1 | 7.6% | 8.0 | 8.9 | 8.5 | No scaling | 0.0002 | 0.4 |
| ABS09 | 1 | 0.9% | 5.8 | 7.1 | 6.4 | Slight | 0.0014 | 0.4 |
| ABS10 | 1 | 8.8% | 7.3 | 8.5 | 7.9 | No scaling | 0.0001 | 0.4 |
| ABS11 | 1 | 4.0% | 3.8 | 4.6 | 4.2 | Severe | 0.0008 | 0.3 |
| ABS12 | 1 | 6.3% | 7.5 | 8.0 | 7.7 | No scaling | 0.0001 | 0.3 |
| ABW02 | 1 | 14.4% | 8.0 | 9.5 | 8.8 | No scaling | 0.0001 | 0.2 |
| ABS01 | 2 | 0.1% | 3.5 | 3.8 | 3.7 | Very severe | 0.0039 | 0.1 |
| ABS02 | 2 | 0.8% | 2.8 | 2.8 | 2.8 | Very severe | 0.0454 | 0.2 |
| ABS03 | 2 | 0.8% | 4.4 | 5.4 | 4.9 | Severe | 0.1360 | 0.2 |
| ABS04 | 2 | 0.9% | 5.4 | 6.1 | 5.8 | Moderate | 0.0186 | 0.1 |
| ABW01 | 2 | 2.2% | 3.4 | 4.4 | 3.9 | Very severe | 0.0498 | 0.1 |
| ABS05 | 3 | 1.6% | 3.9 | 4.7 | 4.3 | Severe | 1.1424 | 0.2 |
Disclaimer/Publisher’s Note: The statements, opinions and data contained in all publications are solely those of the individual author(s) and contributor(s) and not of MDPI and/or the editor(s). MDPI and/or the editor(s) disclaim responsibility for any injury to people or property resulting from any ideas, methods, instructions or products referred to in the content. |
© 2023 by the authors. Licensee MDPI, Basel, Switzerland. This article is an open access article distributed under the terms and conditions of the Creative Commons Attribution (CC BY) license (https://creativecommons.org/licenses/by/4.0/).
Share and Cite
Lv, G.; Zhang, X.; Wei, D.; Yu, Z.; Yuan, X.; Sun, M.; Kong, X.; Zhang, Y. Water–Rock Interactions, Genesis Mechanism, and Mineral Scaling of Geothermal Waters in Northwestern Sichuan, SW China. Water 2023, 15, 3730. https://doi.org/10.3390/w15213730
Lv G, Zhang X, Wei D, Yu Z, Yuan X, Sun M, Kong X, Zhang Y. Water–Rock Interactions, Genesis Mechanism, and Mineral Scaling of Geothermal Waters in Northwestern Sichuan, SW China. Water. 2023; 15(21):3730. https://doi.org/10.3390/w15213730
Chicago/Turabian StyleLv, Guosen, Xu Zhang, Denghui Wei, Zhongyou Yu, Xingcheng Yuan, Minglu Sun, Xiangxinyu Kong, and Yunhui Zhang. 2023. "Water–Rock Interactions, Genesis Mechanism, and Mineral Scaling of Geothermal Waters in Northwestern Sichuan, SW China" Water 15, no. 21: 3730. https://doi.org/10.3390/w15213730