Article

Infiltration Measurements during Dry Conditions in an Urban Park in Ljubljana, Slovenia

1
Geological Survey of Slovenia, 1000 Ljubljana, Slovenia
2
Faculty of Civil and Geodetic Engineering, University of Ljubljana, 1000 Ljubljana, Slovenia
*
Author to whom correspondence should be addressed.
Water 2023, 15(20), 3635; https://doi.org/10.3390/w15203635
Submission received: 27 September 2023 / Revised: 12 October 2023 / Accepted: 16 October 2023 / Published: 17 October 2023

Abstract

:
A thorough understanding of the hydrologic mechanisms that control the movement of water through the soil is essential for developing effective stormwater management strategies. Infiltration is critical for determining the amount of water entering the soil and controlling surface runoff. Spatial and temporal variations in soil properties strongly affect infiltration rates, which underscores the importance of evaluating field-specific values for hydraulic conductivity, which are also highly dependent on the chosen measurement and evaluation methods. The objective of this study is to determine and compare soil hydraulic conductivity under dry conditions using two field measurement techniques, namely the double-ring infiltrometer (DRI) and the mini-disk infiltrometer (MDI). The results demonstrate the importance of performing multiple replicates of infiltration tests, especially during the dry season, as the initial dry surface caused deviations in hydraulic conductivity estimates for both methods used (DRI and MDI). Significant spatial variability was observed within the radius of the test replicates over short distances (<1 m). In addition, experimental infiltration curves for a selected site were used to evaluate and compare soil hydraulic parameters through infiltration modeling. In general, the Philip, Green-Ampt, and Smith-Parlange theoretical models showed a better fit to the experimental DRI data than the semi-empirical Horton model.

1. Introduction

In urban areas, the natural terrain is being largely displaced by impervious surfaces, accompanied by removal of vegetation and soil compaction [1,2,3]. The accompanying increase in artificial drainage leads to a significant reduction in natural infiltration, accelerated stormwater runoff, alteration of natural flow patterns, and increased flood risk [4,5], which also has the potential for transport of sediment and potentially toxic materials [6,7]. Although some studies imply an increase in groundwater recharge rates due to reduced evapotranspiration and leaky utility lines [8,9], land sealing can reduce groundwater recharge [10,11]. The net effect is difficult to predict as every city has different settings and climatic conditions [12]. The urban impacts on the environment are generally exacerbated by climate change, particularly due to altered intensity, duration, and frequency of rainfall [4,13,14]. In some areas, stormwater runoff is discharged into combined sewers, which are at risk of overflowing during severe storms, posing a threat to surface and groundwater quality [2,14,15].
Recent research in urban water management has focused on utilizing infiltration-based green stormwater infrastructure (GSI) systems (e.g., rain gardens, green roofs, permeable pavements, bioretention basins, infiltration trenches) to mitigate runoff into channels, increase stormwater retention, and delay the time of infiltration [2,16,17,18,19]. A fundamental prerequisite for the design and post-construction performance of GSI is a good understanding of local conditions and hydrologic soil parameters [18,20]. By carefully considering uncertainties and implementing design strategies that enhance and maintain infiltration, the lifespan of GSI systems can be extended [18]. Additionally, hydrological models can be used to predict and optimize the system performance [21,22].
One of the crucial parameters needed for effective water management in relation to the soil is field hydraulic conductivity, which has been reported to exhibit considerable statistical variability, both spatially and temporally across seasons [23,24,25,26,27]. Factors such as physical properties of the soil, moisture content, and flow barriers can all affect its value. Estimation of hydraulic conductivity is also highly dependent on the technique used, i.e., the type and proper use of the instrument, as well as the evaluation methods. Laboratory methods typically rely on applying Darcy’s law in a single dimension and offer the benefit of being conducted under controlled conditions. However, they are considered disadvantageous compared to field methods because they introduce potential disturbance during soil sample collection and manipulation that do not adequately reflect natural conditions [18,28,29]. To estimate field-specific near-surface hydraulic conductivity, various field devices are recommended for infiltration rate testing, e.g., the single-ring infiltrometer, the double-ring infiltrometer, the Philip-Dunne permeameter, the Modified Philip-Dunne infiltrometer, the tension infiltrometer, the mini-disk infiltrometer, the automated SATURO infiltrometer, the air-entry permeameter, the Guelph permeameter, and the borehole permeameter [18], and comparison among the results of different applied instruments is still debated in the literature [30,31,32,33,34].
Field experimental data can also be used in various infiltration models, each aimed at understanding different factors that influence infiltration processes. Some models are simple and easy to use, while others are complex and require more data and computational resources to run. Numerous infiltration models have been developed in recent decades to predict infiltration rates. A detailed review of existing infiltration methods has been provided by [35,36,37]. Although most models are considered versatile for a variety of applications, each model has its own specific set of assumptions and limitations, making it difficult to determine their suitability for use with real-world data [36]. Experimental field data are required to adjust individual model parameters until the model accurately represents the observed data.
The study was initiated in response to the local community stormwater management challenges, which prompted us to explore GSI solutions that rely on a comprehensive assessment of soil hydraulic properties for their design. Our primary focus was to evaluate and characterize the soil hydraulic conductivity under atypical dry conditions by applying and comparing the response of two field measurement techniques, namely the double-ring infiltrometer (DRI) and the mini-disk infiltrometer (MDI). This topic is ripe for further investigation to solidify the correlations between the results of these two instruments and to evaluate their reliability and limitations, especially in the context of extreme conditions. Additionally, the aim of the study was to provide the range of soil hydraulic parameters by means of four distinct infiltration models. Evaluating the optimal values of soil hydraulic parameters and determining the best-fitting theoretical infiltration model is a crucial step in rainfall-runoff modeling, as it significantly influences the partitioning of rainfall into losses and effective rainfall, and thus runoff. Therefore, the results presented are useful to hydrologic modelers because field measurements of soil infiltration are usually rare or unavailable for hydrologic modeling purposes, leaving the choice of infiltration model and parameter values to the modeler. In addition to wider applicability, the results will play a vital role in local urban water management by optimizing the local hydrologic model and developing plans to alleviate load on sewage systems.

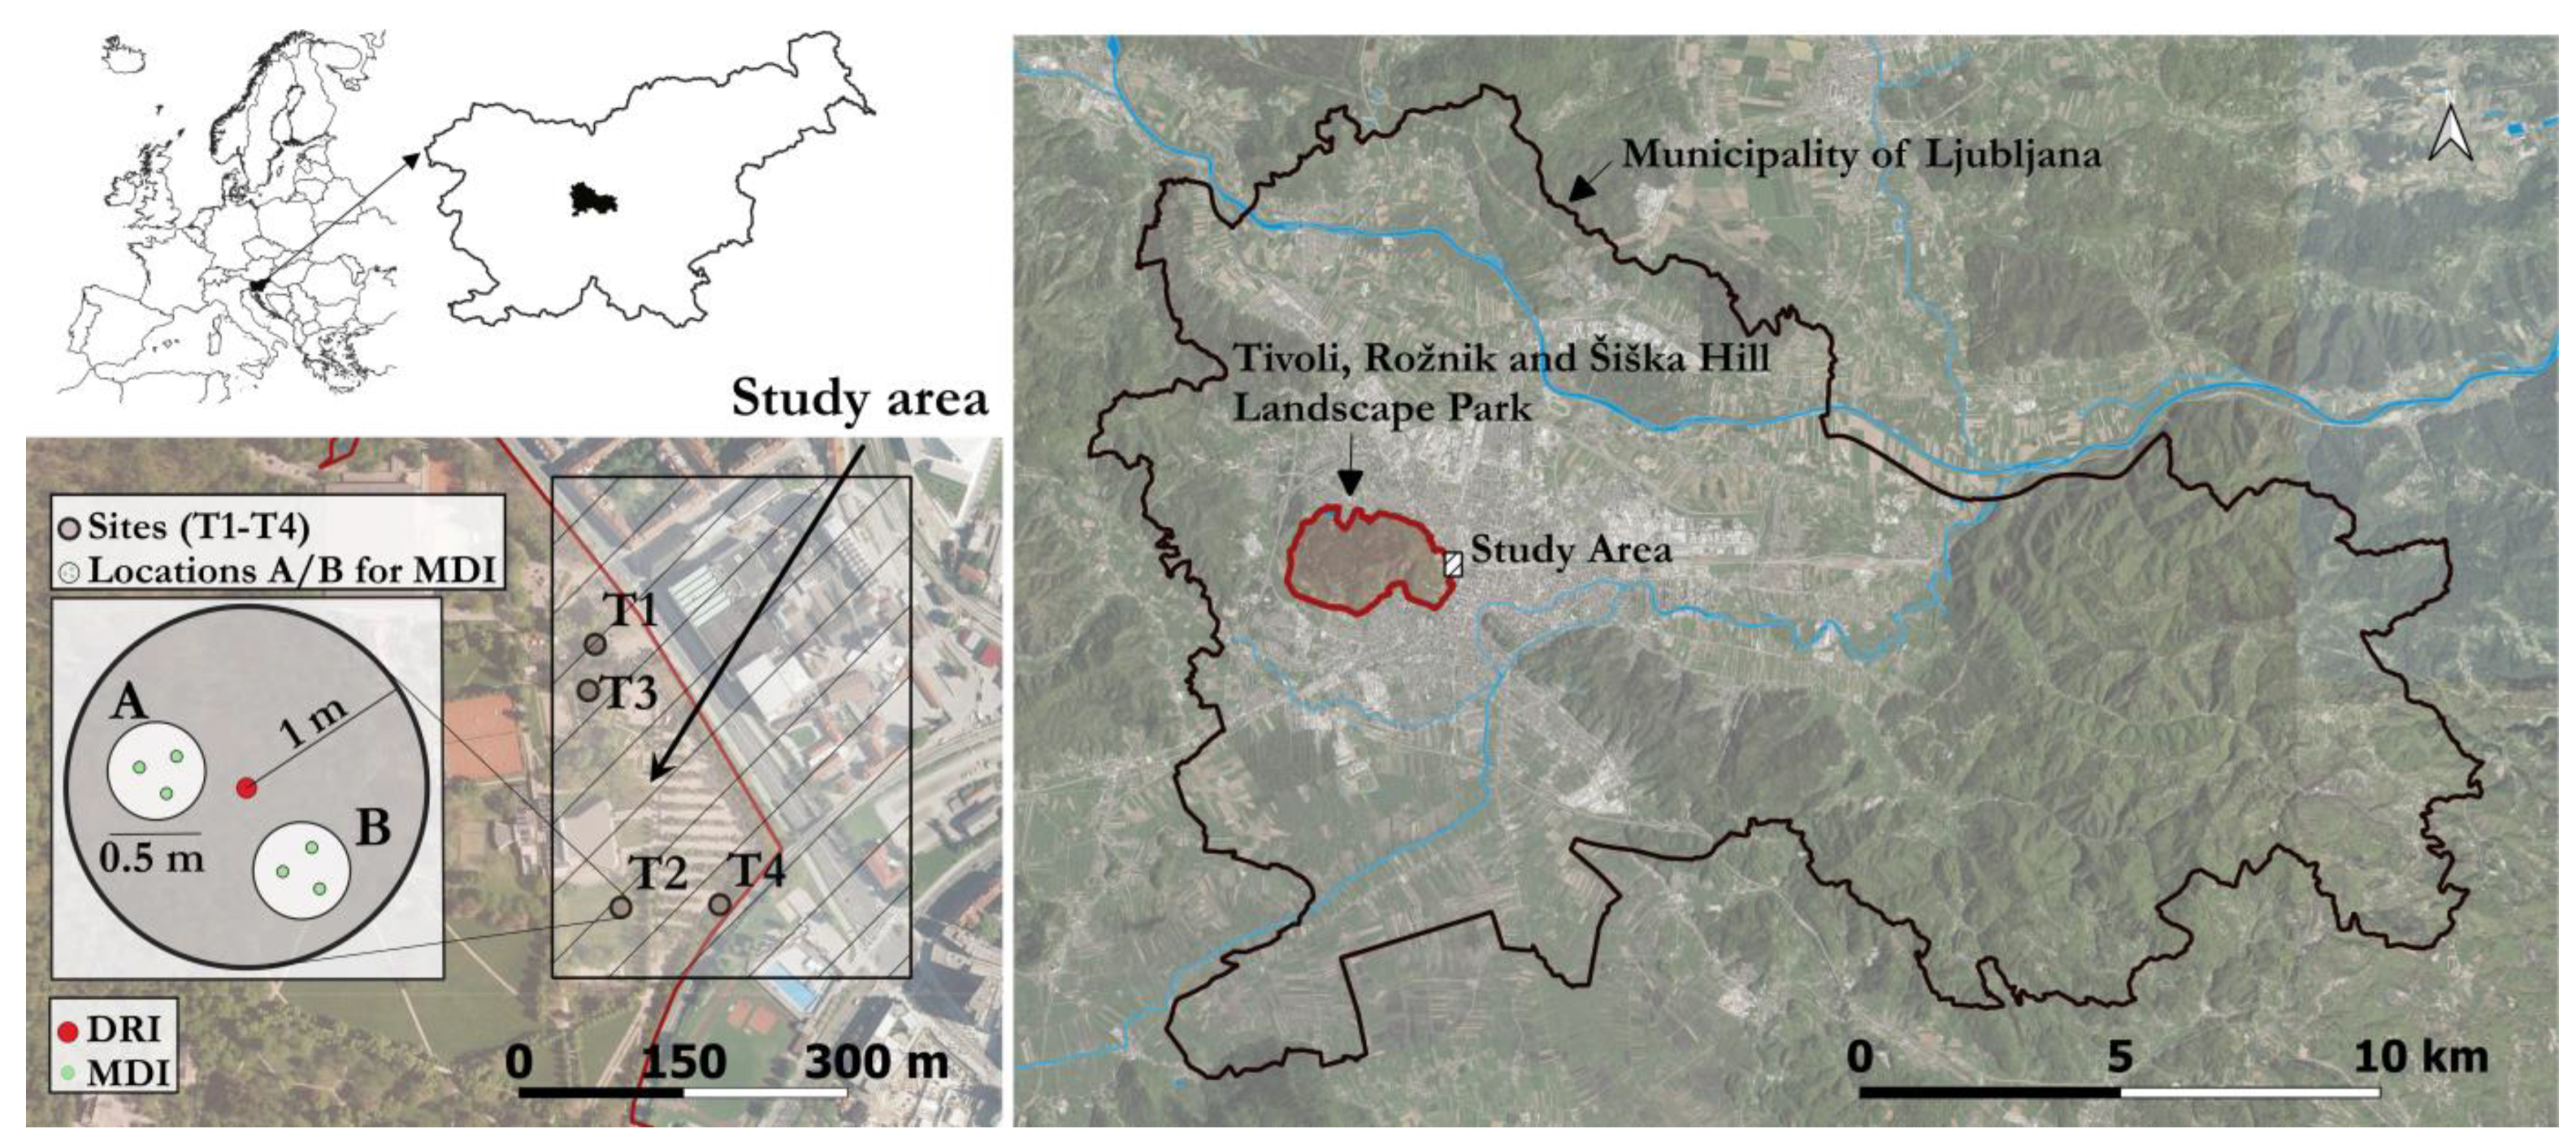
2. Materials and Methods

The approximately 4 ha study area is located in the eastern part of the Tivoli, Rožnik and Šiška Hill Landscape Park, in the central part of Ljubljana, Slovenia (Figure 1). Infiltration tests were conducted at the edge of an urban area at the transition between Ljubljansko polje aquifer, which consists mainly of alluvial deposits of carbonate gravel with layers of conglomerate, and the Šiška Hill and Rožnik, composed of impermeable Permo-Carboniferous clay shale, sandstone, and siltstone [38,39,40,41]. The natural soil type in the hilly hinterland is dystric cambisoil, while in the investigated unpaved surfaces of urban Park Tivoli the alluvial gravel is covered with fluvial and lacustrine sediments consisting of silty gravel, clay, organic clay, peat, silt, and sand [40,41].
The investigated area is characterized by a temperate continental climate. The long-term mean annual temperature is 10.8 °C, but there is a statistically significant increase between 1970 and 2021, reflecting global warming [42]. In contrast, the mean annual precipitation does not show an increasing trend over the same period (1970–2021), but rather more frequent extreme seasonal conditions. The long-term average of precipitation (1970–2022) is 1371 mm/year with a standard deviation of 170 mm/year [42].
The study was conducted during the dry summer months between June and August 2022. Total precipitation between January and August 2022 was 432 mm, which is the lowest value for the same 8-month period since 1970 or about half of the 8-month average between 1970 and 2022 (829 mm) [42]. Moreover, the mean annual temperature in 2022 was 12.9 °C, the highest since 1970, and 2.1 °C above the long-term annual average (1970–2021) [42].
The hydraulic and spatial design of water drainage in the study area is not adapted to the increasing frequency and intensity of heavy rainfall events, mainly due to its insufficient capacity. A considerable amount of stormwater is discharged into the combined sewer system, making it susceptible to overflows. This situation causes street underpasses and garages in the city to flood with increasing frequency. The most straightforward and practical solution to this problem would involve implementing GSI systems. However, in order to design the most efficient system, it is imperative to obtain the most accurate estimate of local soil permeability, particularly under extreme conditions that are likely to become common.
Infiltration tests were performed at four sites (T1–T4) in the study area (Figure 1) using two types of infiltrometers—a double-ring infiltrometer (DRI) and a mini-disk infiltrometer (MDI). The DRI infiltration tests were conducted at the midpoint of each site (T1–T4), while the MDI measurements were taken at two locations (A and B) within a 1 m radius of DRI position (Figure 1, bottom left). At each location—A and B—3 repeated MDI measurements were made so that the instrument was positioned within a 0.5 m diameter each time. Thus, a total of 6 infiltration tests were performed with MDI at each site T1–T4.
DRI measurements, on the other hand, are much more time consuming and require large quantities of water, particularly during the dry season. Water was not available at the study area, so it had to be transported several times, which was the major technical constraint. Nevertheless, the test was successfully repeated at the same location at least once at 3 of 4 measuring sites, whereas in most comparable research studies, only one DRI measurement was usually taken at the site during the same conditions (e.g., [30,31,32]). When our tests were repeated, preference was given to the sites where an unusually high infiltration rate had been observed in the initial test. Therefore, three consecutive measurements were carried out at T3, and two consecutive measurements were performed at T1 and T4. Only one measurement was performed at T2.
Prior to the start of the experiment, soil texture and soil moisture at each site were estimated by the feel method [43,44], whereas sun exposure and vegetation were estimated by appearance (Table 1).
A double-ring infiltrometer (DRI) is a cylindrical infiltrometer used to measure infiltration under saturated conditions [45], according to the standardized method [46]. At the selected sites, the inner (φ 31 cm) and outer ring (φ 62 cm) were manually inserted 5 cm into the ground and filled with a constant head of water (5 cm) that was maintained in both rings for the duration of the experiment. Infiltration was measured in the inner ring using the Mariott device, which ensures a constant water inflow. Saturated hydraulic conductivity was calculated using Equation (1) [33,47,48], which is based on the principles of infiltration from ring infiltrometers described in studies [49,50]:
K s = q s H B 1 d + B 2 a + 1 α ( B 1 d + B 2 a ) + 1  
where K s is the saturated hydraulic conductivity (cm/s), q s is the quasi-steady infiltration rate (cm/s), H is the steady depth of ponded water in ring (cm), a is the inner ring radius (cm), d is the depth of ring insertion into the soil (cm), B 1   and B 2 are dimensionless quasi-empirical constants (for d > 3 and H > 5 cm: B 1 = 0.316π, B 2 = 0.184π), and α is the soil macroscopic capillary length (1/cm). Based on soil texture-structure categories [51], the estimated soil macroscopic capillary length was set at 0.12/cm, which is common for most structured soils from clay to loams [51].
The mini-disk infiltrometer (MDI) is a simplified version of tension infiltrometer used to measure unsaturated hydraulic conductivity [52]. The single tube is divided into two chambers, both filled with water. The lower chamber serves as a reservoir for the water that infiltrates into the soil through the bottom, which is sealed with a 0.3 cm thick, porous, sintered stainless-steel disk with a diameter of 4.5 cm. The infiltration rate is controlled by the pressure head (from −7 to −0.5 cm), which is determined by the suction control tube in the upper Mariott chamber. The pressure head was set to −2 cm, which is considered adequate for most soils [52]. The drop in water level was recorded manually in regular time intervals between 30 s and 2 min. Before starting the experiment, grass debris and surface roots were removed, and a thin layer of fine sand was sprinkled on the soil to ensure a solid contact of the infiltrometer with the surface.
The unsaturated hydraulic conductivity K(h), also referred to as near-saturated hydraulic conductivity by [53], was determined according to the recommendations in the METER Group user manual for the mini-disk infiltrometer [52]—using the method suggested by Zhang [54], where the measured cumulative infiltration is plotted versus the square root of time and fitted to Philip’s infiltration equation [55] (Equation (2)) to obtain K h   as follows (Equations (2) and (3)):
I = C 1 t 1 / 2 + C 2 t
K h = C 2 A
where I ( c m ) is the cumulative infiltration, t ( s ) is time, C 1 ( c m / s 1 / 2 ) , and C 2 ( c m / s ) are parameters related to soil sorptivity and hydraulic conductivity, respectively, where C 2 also represents the slope of the curve of the cumulative infiltration vs. the square root of time. A ( ) is a value relating the van Genuchten parameters α ( c m 1 ) and n ( ) for 12 soil texture classes [56] to the disk radius r 0 ( c m ) , applied pressure head h 0 ( c m ) [57], and a constant c ( ) as follows [32]:
A = 11.65 n 0.1 1 e x p [ c n 1.9 α h 0 ] ( α r 0 ) 0.91             ( c = 2.92   i f   n 1.9 ; c = 7.5   i f   n < 1.9 )
In a study by Dohnal et al. [53], an improved equation was introduced to estimate A when n < 1.35 (Equation (5)). The default value for n according to [56] in the METER Group manual [52] is above 1.35 for all soil types studied, except for clay loam, which is slightly below the threshold, i.e., 1.31. On the other hand, Dohnal et al. [53] state in their conclusions that such low n values are not exceptional even for sandy loams and silt loams. Therefore, Equation (5) was used to compare the calculated K(h) values according to Equation (3).
A = 11.65 n 0.82 1 e x p [ 34.65 n 1.19 α h 0 ] ( α r 0 ) 0.6                   ( i f   n < 1.35 )
In order to compare unsaturated hydraulic conductivity K h determined from MDI measurements (Equation (3)) with the saturated hydraulic conductivity K s determined from DRI (Equation (1)), the method by Kutilek and Nielsen was applied [32,58]:
I C 1 t 1 / 2 + m K s t
where C 1 ( c m / s 1 / 2 ) is a coefficient related to sorptivity [59] and m = 0.667 .
Infiltration curves obtained at site T2 were used to calibrate and evaluate hydraulic parameters of three theoretical models, namely Green-Ampt (GA), Philip (PH), and Smith-Parlange (SP) [55,60,61] (Table 2), which are derived from Richard’s partial differential equation that describes the flow of water through unsaturated porous media under various boundary conditions. In addition, the semi-empirical Horton model (HO) [62] was used (Table 2). For each method, the expression for potential infiltration rate f p after ponding conditions ( t > t p ) was applied, as the infiltration curve obtained from DRI field experiment assumes the soil is already saturated. The same applies for cumulative infiltration, which is usually expressed by direct integration of infiltration rate over time. For practical reasons, only two expansion terms of Philips’ infinite series derivation of Richards’ equation were used, since in this way a consistent infiltration rate at short times can be obtained [55].
Calibration of the applied models (i.e., determination of the parameters related to the soil properties) were performed in the web-based interactive computational environment JupyterLab [63] using Python 3. In order to find roots of non-linear Green-Ampt and Smith-Parlange equations for cumulative infiltration, function fsolve from SciPy was used. The parameters of Horton’s model were evaluated from the measured infiltration data as described in [64,65], i.e., by subtracting the value of f c from experimental values of f p and further by plotting the natural logarithm of the difference l n f p f c vs. the time ( t ) in order to find the slope that defines unknown parameter k , whereas f 0 was determined from the intercept f 0 f c = e i n t e r c e p t [64].
The best fit of GA, SP, and PH models was determined based on a series of successive calculations using a previously defined range of unknown variables that comply with reference values. The most optimal fit between pairwise predicted and observed values for each consecutive combination was determined using mean absolute error (MAE). The evaluated parameters were compared with theoretical values published in the literature.

3. Results and Discussion

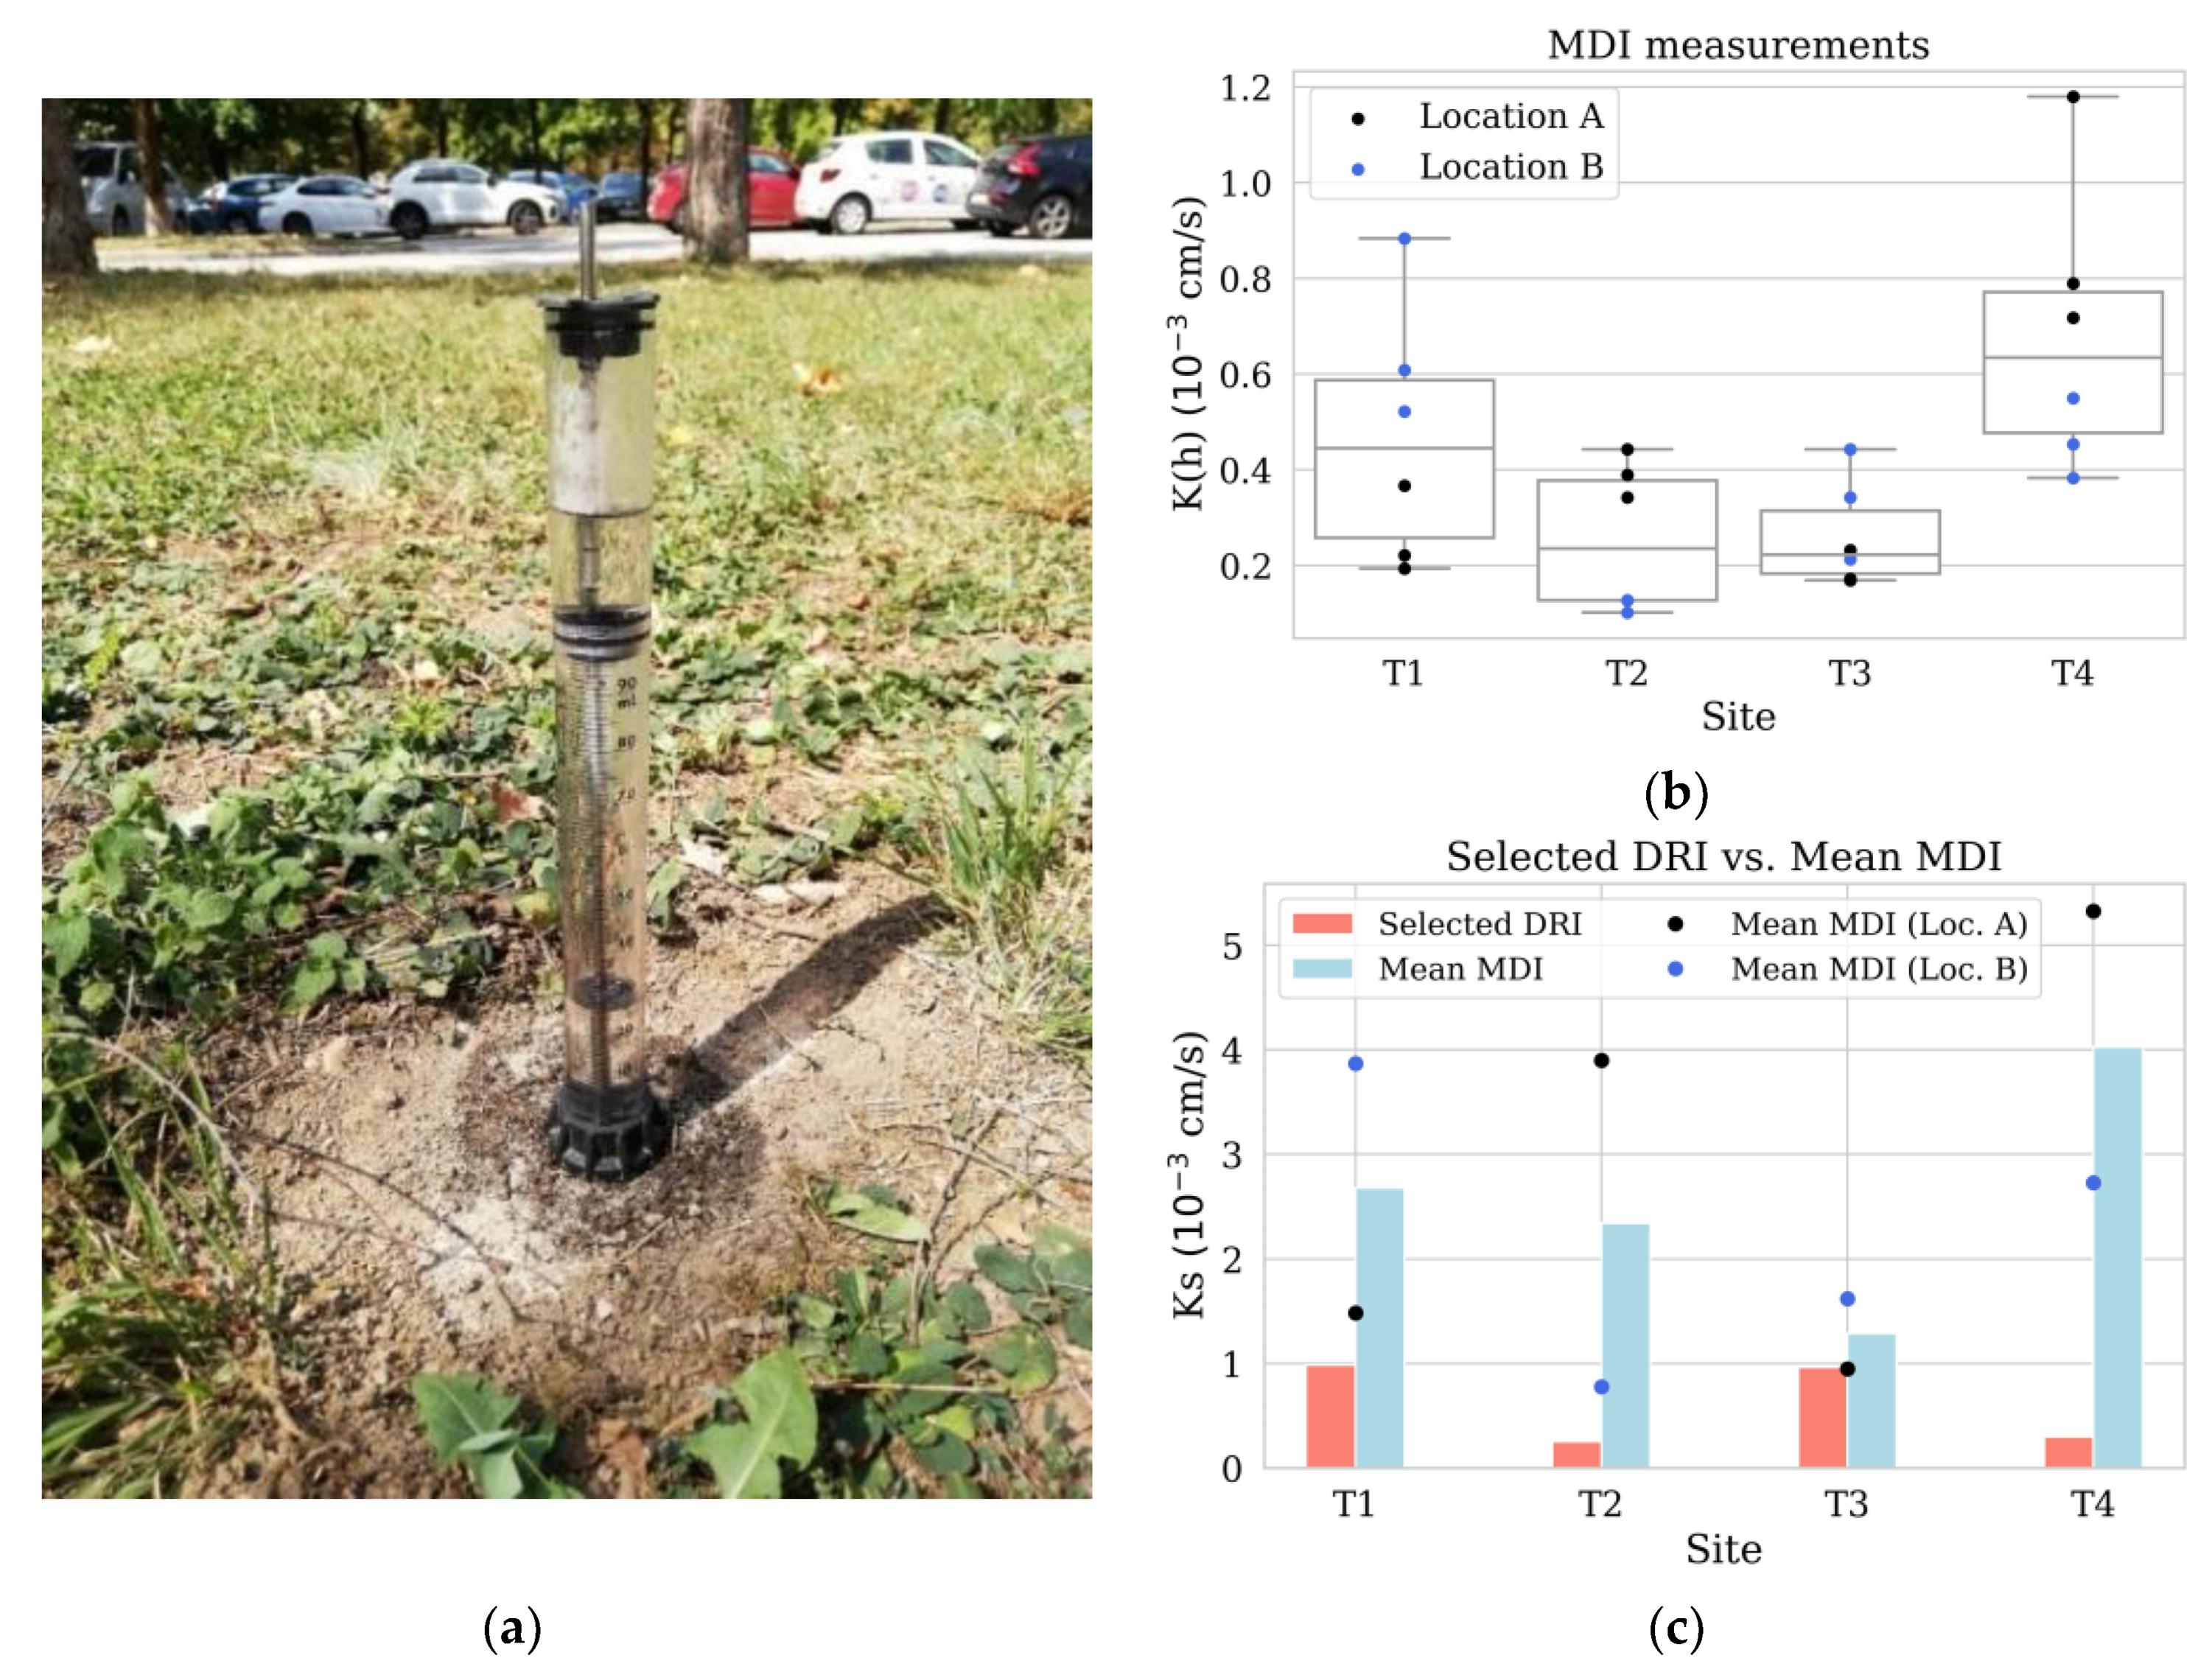
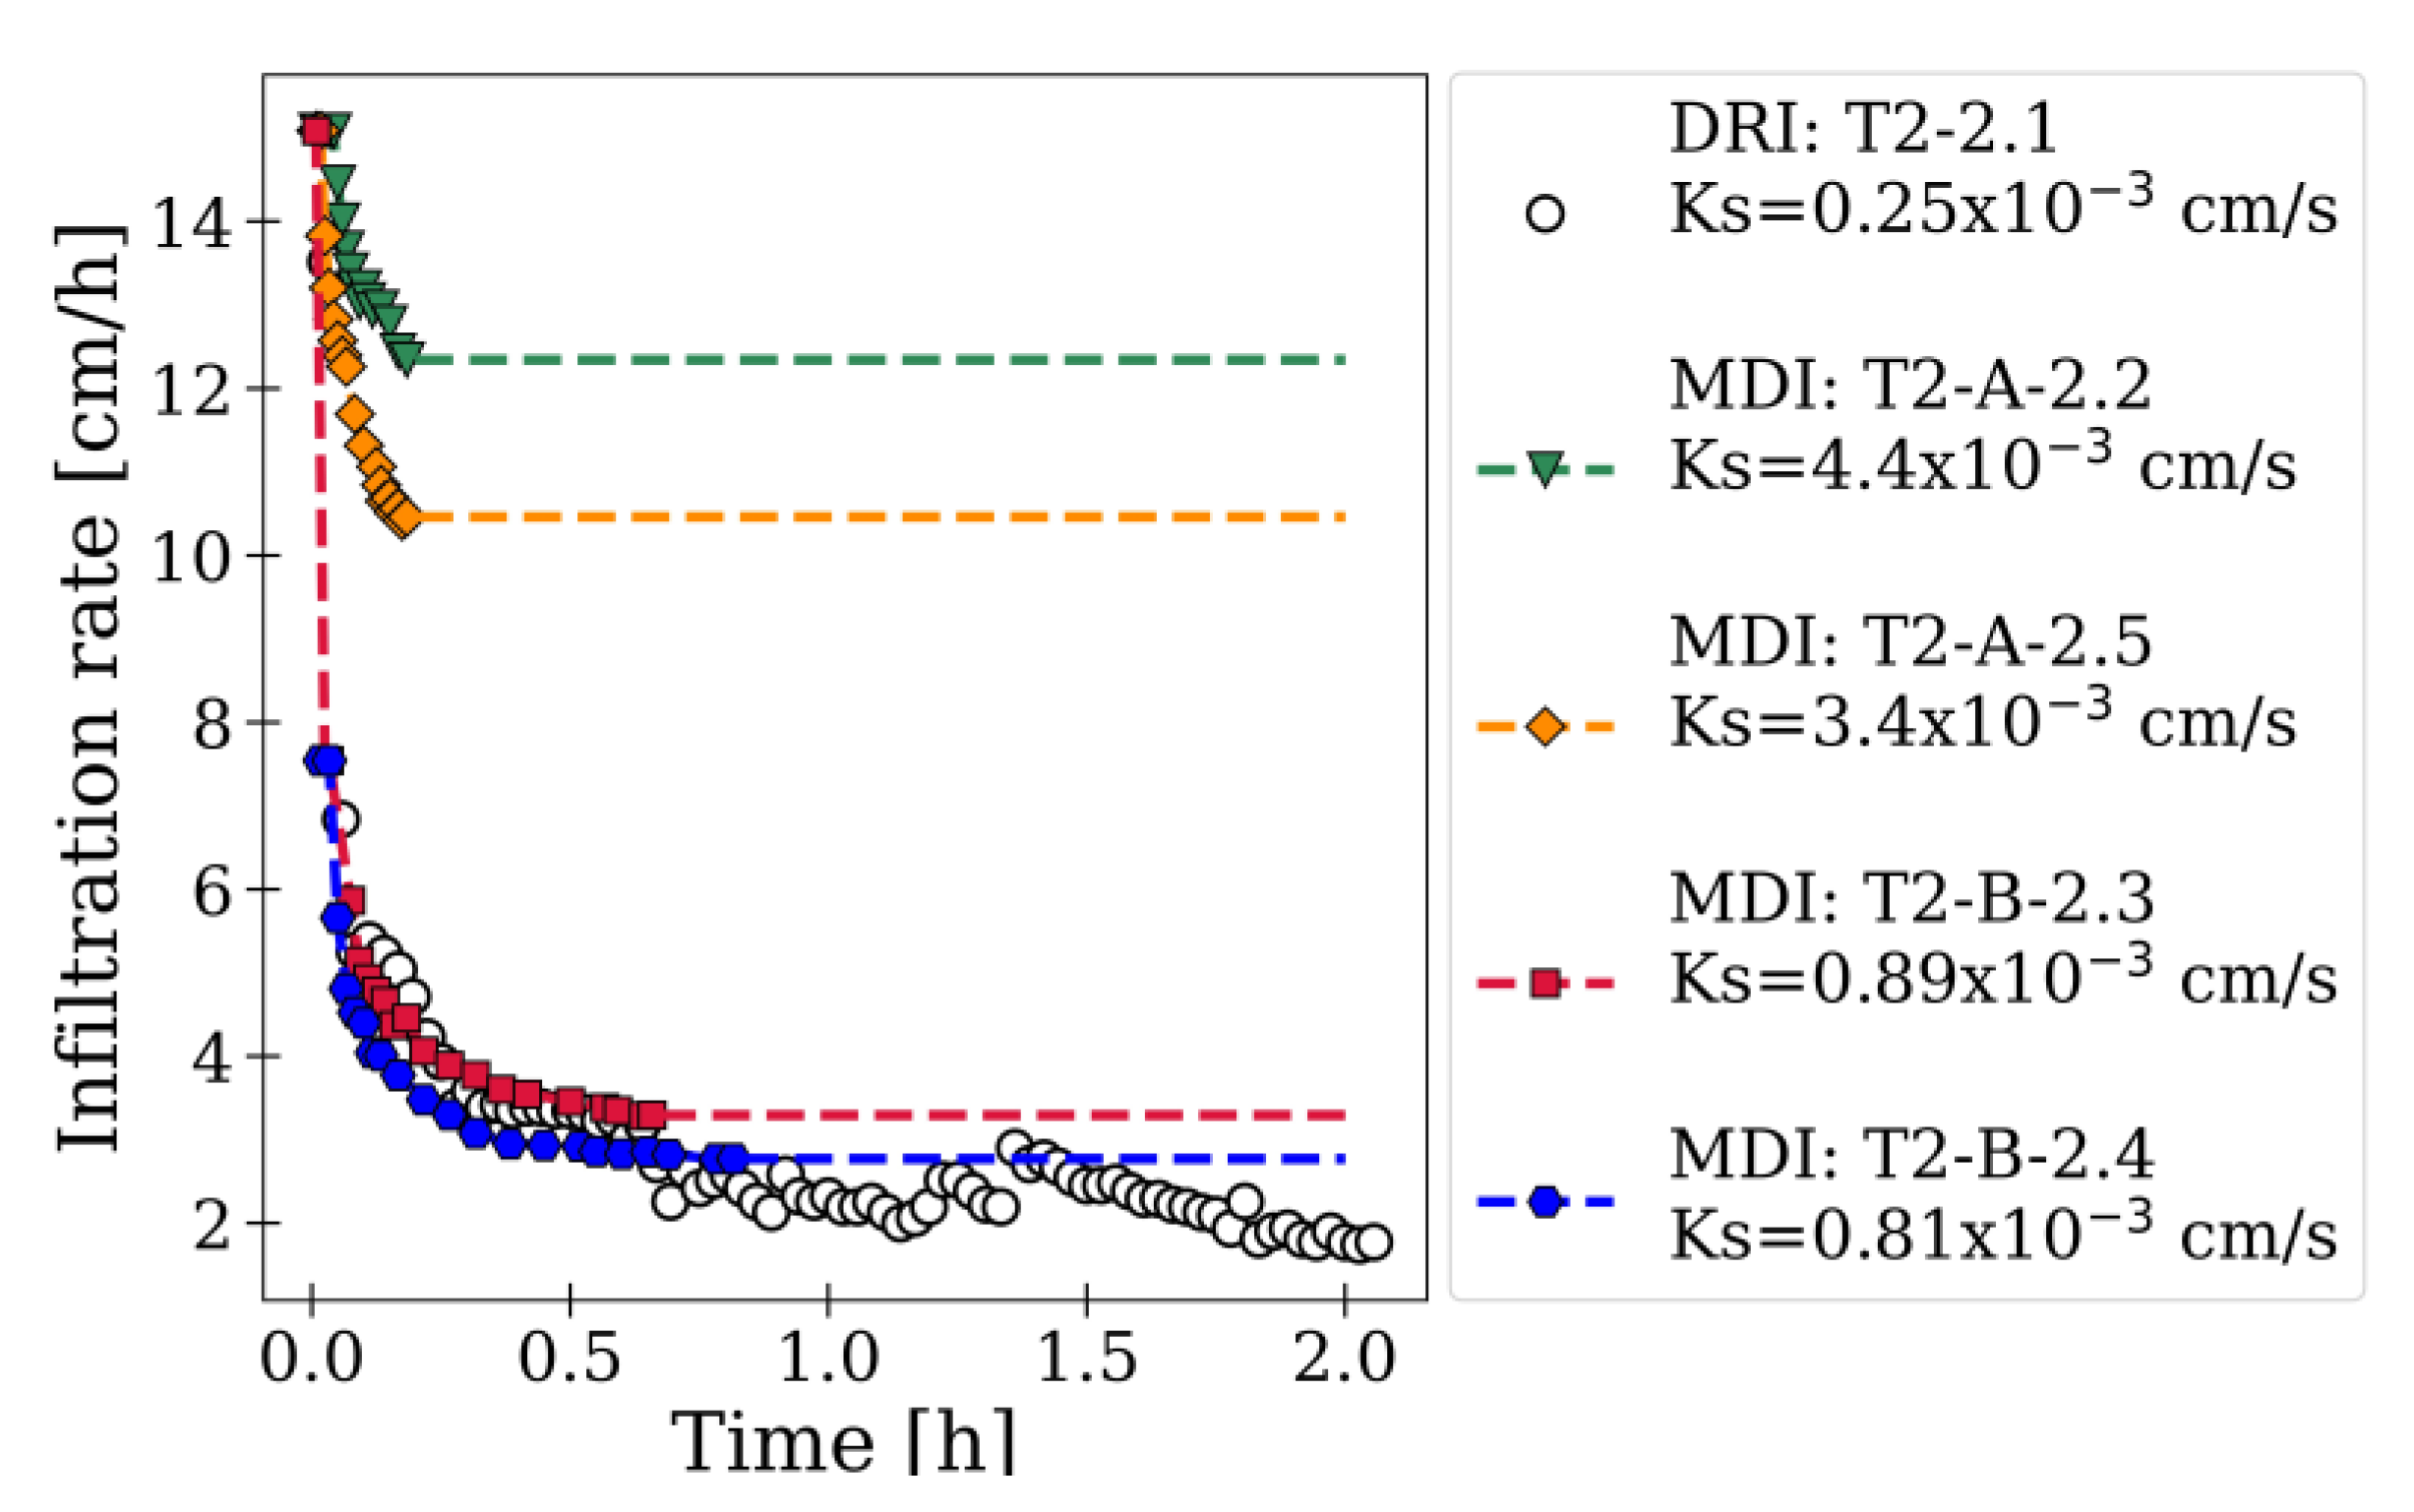
3.1. Infiltration Measurement Results

In general, no technical problems or irregularities were detected during the performance of DRI infiltration tests, except for the unusually higher infiltration rate that was observed during the first measurements at sites T1 and T3 (No. D1.1 and D3.1) (Table 3). In contrast, the first measurements at sites T2 and T4 (No. D2.1 and D4.1) corresponded to the expected infiltration in this soil type. Estimated saturated hydraulic conductivity K s D R I ranges from 10−4 to 10−3 cm/s (Table 3) and is closely related to this course of experiments. K s D R I is significantly lower at T2 and T4, respectively. The discrepancy in infiltration rate between the first two replicates (D1.1 vs. D1.2 and D3.1 vs. D3.2) at T1 and T3 is also reflected in characteristically different values of K s D R I , i.e., evaluation for D1.1 and D3.1 is about three times higher compared to D1.2 and D3.2. This could be attributed to several different factors.
According to [31], increased initial infiltration observed with the DRI method may result from the soil disturbance during the ring insertion process, as well as the presence of macropores and preferential pathways. High initial infiltration rate could also be related to the relatively high matric potential gradient of an initially dry soil [66], while higher antecedent soil moisture limits infiltration rate [67,68]. The results obtained at T1 and T3 indicate that investigated soil during the initial test (D1.1 and D3.1) may not have been in a fully saturated state, which is otherwise required for a reliable performance and evaluation of DRI measurements. This could be possible, especially since the initial test was stopped at least once earlier than usual due to the rapid consumption of the available water. The difference in K s D R I between the second two replicates (D3.2 and D3.3) at site T3 is notably smaller, which suggests that the results at the same site would become more consistent once the soil reaches a sufficient degree of saturation. The K s D R I values determined from the DRI measurements show no discernible correlation with initial soil moisture evaluated at the uppermost soil surface, which underscores the potential importance of soil properties that extend throughout the entire depth of the ring insertion.
In fact, infiltration rate and hydraulic conductivity can both be affected by the actual depth at which the ring is inserted. As pointed out by Fatehnia et al. [69], deeper ring insertions tend to yield lower infiltration rates due to reduced lateral flow and vice versa. Fan et al. [70] stated that ring insertion depth should be much deeper than the values recommended by ASTM [46], namely between 19–22 cm, which can be extremely difficult to implement in practice [69]. However, in this study, a shallow ring insertion depth of 5 cm was used at all sites, not solely at T1 and T3.
It is important to emphasize that in most other similar research studies, measurements with DRI are not performed repeatedly at the same location and under the same conditions (e.g., [30,31,32]). A definitive explanation for the high infiltration rate in the initial tests at two sites would require a more extensive data set with a larger number of measurements and replicates. Therefore, the two extreme K s D R I values (No. D1.1 and D3.1) were excluded from further analysis (Table 3). For further evaluations, we adopted the ‘selected value’ of K s D R I * , which presents the mean measured K s D R I   value when at least two values were available at the site and the single measured K s D R I value when only one was available at the site (Table 3).
MDI measurements were generally smooth, but characteristic lateral infiltration of water was observed, particularly where the soil surface was very dry (Figure 2a). The unsaturated hydraulic conductivity K h M D I was on the order of 10−4 cm/s for the majority of measurements when A is considered according to Equation (4) (Table 3). The most uniform values with the lowest coefficient of variation (CV) of 41.7% were obtained at site T3 (Table 3), indicating a relatively high degree of soil homogeneity, while the highest CV was observed at site T2 (Table 3). However, the observed CV was significantly lower when considered for each individual location A and B within the site (T1–T4) radius. Considering results by test location (A and B) within each site, T2-A and T2-B actually exhibit the lowest CV of 13.0% and 12.5%, respectively (Table 3). This highlights the laterally variable conditions of surface soil properties over short distances (<1 m), which was also observed in the analysis of surface soil type (Table 3).
Unexpectedly high K h M D I values were observed at site T4 despite visibly dry soil surface with sparsely grown grass (Figure 2a). This is contrary to the established understanding in the literature that the water repellency effect caused by dry conditions and high temperatures would result in low K h values [32,71,72]. A possible explanation could be the need to adjust the suction rate, possibly due to a slightly higher proportion of sandy components in the soil texture. However, this problem did not manifest in other locations with similar proportions of sandy components (e.g., T1). Incorrectly placed equipment is an unlikely cause, since measurements were conducted by the same person at all sites. Another plausible hypothesis is that the discrepancy in K h M D I values is due to significant lateral infiltration during measurements using the MDI technique, especially since infiltration of water from MDI was faster than at other sites tested. Lateral infiltration was visible at the soil surface (as shown in Figure 2a) and could have a substantial impact on the overall soil hydraulic conductivity. However, further investigation with many more replicates at the same site, with different suction rates and under different conditions, would be required to confirm this.
Table 3 displays evaluated K h values from MDI measurements— K ( h ) M D I , the corresponding K s value, according to the Equation (6)— K s M D I , and the calculated ratio with respect to the selected K s value from DRI at the considered site— K s D R I * . The mean ratio of K h to K s , determined by MDI and DRI, respectively, ranges from 0.27 to 2.27, relative to the site studied. This range exceeds the previously reported intervals of 0.5 to 0.67 by [31] and 0.19 to 0.75 by [32]. The most striking differences are observed just at T4, where the evaluated K ( h ) M D I values are unexpectedly high compared to the K s D R I * . In contrast, infiltration tests conducted at sites T1, T2, and T3 exhibit certain ratios that closely align with the expected values, although there are discernible differences between locations (Loc.) A and B within the radius of the test replicates (Figure 2b,c). The average K ( h ) M D I / K s D R I * ratio for location T2-B represents the closest match to the previously reported intervals, i.e., 0.47.
For location T2-A, where the predominant soil texture was determined to be clay loam, the n value is less than 1.35 [52,56], which is the threshold for using an improved Equation (5) to calculate A and further K ( h ) M D I according to [52,53]. Moreover, Dohnal et al. [53] state that such low n values are not exceptional even for sandy loams. Therefore, we used the van Genuchten parameters for clay loam according to [52] and calculated A according to Equation (5), not only for location T2-A, but for all locations. The updated K ( h ) M D I values are given in parentheses in Table 3. From the results, it appears that the choice of van Genuchten parameters has a significant effect on the calculated values of K ( h ) M D I . Changing the parameters seems to be reasonable for location T2-A with the actual clay loam texture, where the   K ( h ) M D I / K s D R I * ratio improved to better match the previously reported values. On the other hand, it is less likely that this parameter choice is appropriate for site T4, especially since the high   K ( h ) M D I values were most likely obtained due to rapid infiltration. At sites T1 and T3, the ratio of   K ( h ) M D I / K s D R I * deteriorates significantly compared to the previously reported values.
Figure 2c shows a comparison of the selected K s D R I * obtained from DRI and the K s values obtained by MDI, respectively. The best agreement was observed at T3, with a mean   K s M D I / K s D R I * ratio of 1.3, which can be attributed to the high degree of soil homogeneity as well as the greater number of test replicates when using DRI. Figure 2c also confirms the distinct spatial difference between in-site locations A and B, especially at sites T1, T2, and T4. The overall mean K s M D I / K s D R I * ratio for all sites is 6.7 and 4.4 when site T4 is excluded, which is consistent with the findings of [32], who reported deviations up to 5.8. The K s M D I values were determined according to Equation (6) and therefore do not directly use van Genuchten parameters. Nevertheless, a tentative calculation of the K s M D I   coefficient of variation (CV) by site and location showed no significant improvements to   K ( h ) M D I CV. Although the ratios of   K ( h ) M D I / K s D R I * and K s M D I / K s D R I * are different, we did not find any advantage of calculating K s M D I values for comparing MDI and DRI results.
The results demonstrate that the highest Ks values obtained from DRI do not necessarily coincide with the highest values obtained from MDI, even when the measurements are taken at the same site. This divergence was also previously reported [32,59] and likely depends on the characteristics of the method and instrument used, as either matrix flow or macropore flow is relatively dominant in the soil being examined.
Reference values from several sources were used to establish a benchmark for the K s values assessed [73,74,75,76], but priority was given to USDA classification [76] because it provides reference values based on both soil texture and bulk density. The range of Ks values associated with different soil textures may overlap at their boundaries, and when changes in bulk density are considered, these values may vary by an order of magnitude. Given that the investigated soils belong to the medium density bulk class, the K s D R I values fall within the range typically associated with sandy clay loam (0.1–2 × 10⁻³ cm/s) and sandy loam (0.5–5 × 10⁻³ cm/s), which is consistent with the qualitative assessment of the soil texture at T1, T2, and T3. In contrast, T4 exhibits greater similarity to sandy clay loam than sandy loam.
While the infiltration rate obtained by MDI at location T2-B agreed relatively well with the DRI measurement, a significant deviation was observed at location T2-A, emphasizing the high spatial variability of the soil hydraulic properties. An in-depth analysis of the DRI infiltration curves revealed that their shape at site T2 most closely match the theoretical predictions. Since infiltration rate is a quantity normalized by the area of the infiltration surface [31], we were able to compare the characteristic experimental curves obtained by DRI and MDI (as shown in Figure 3). Our study uncovered a significant discrepancy between the results of MDI measurements at locations A and B within a radius of 1 m. This conclusion is further reinforced by the evaluated values of K s .
Despite the presence of less permeable upper layers in the study area, the results of infiltration tests indicate that local infiltration capacity may be sufficient to develop GSI solutions. This also has utility for local water resource planning and management.

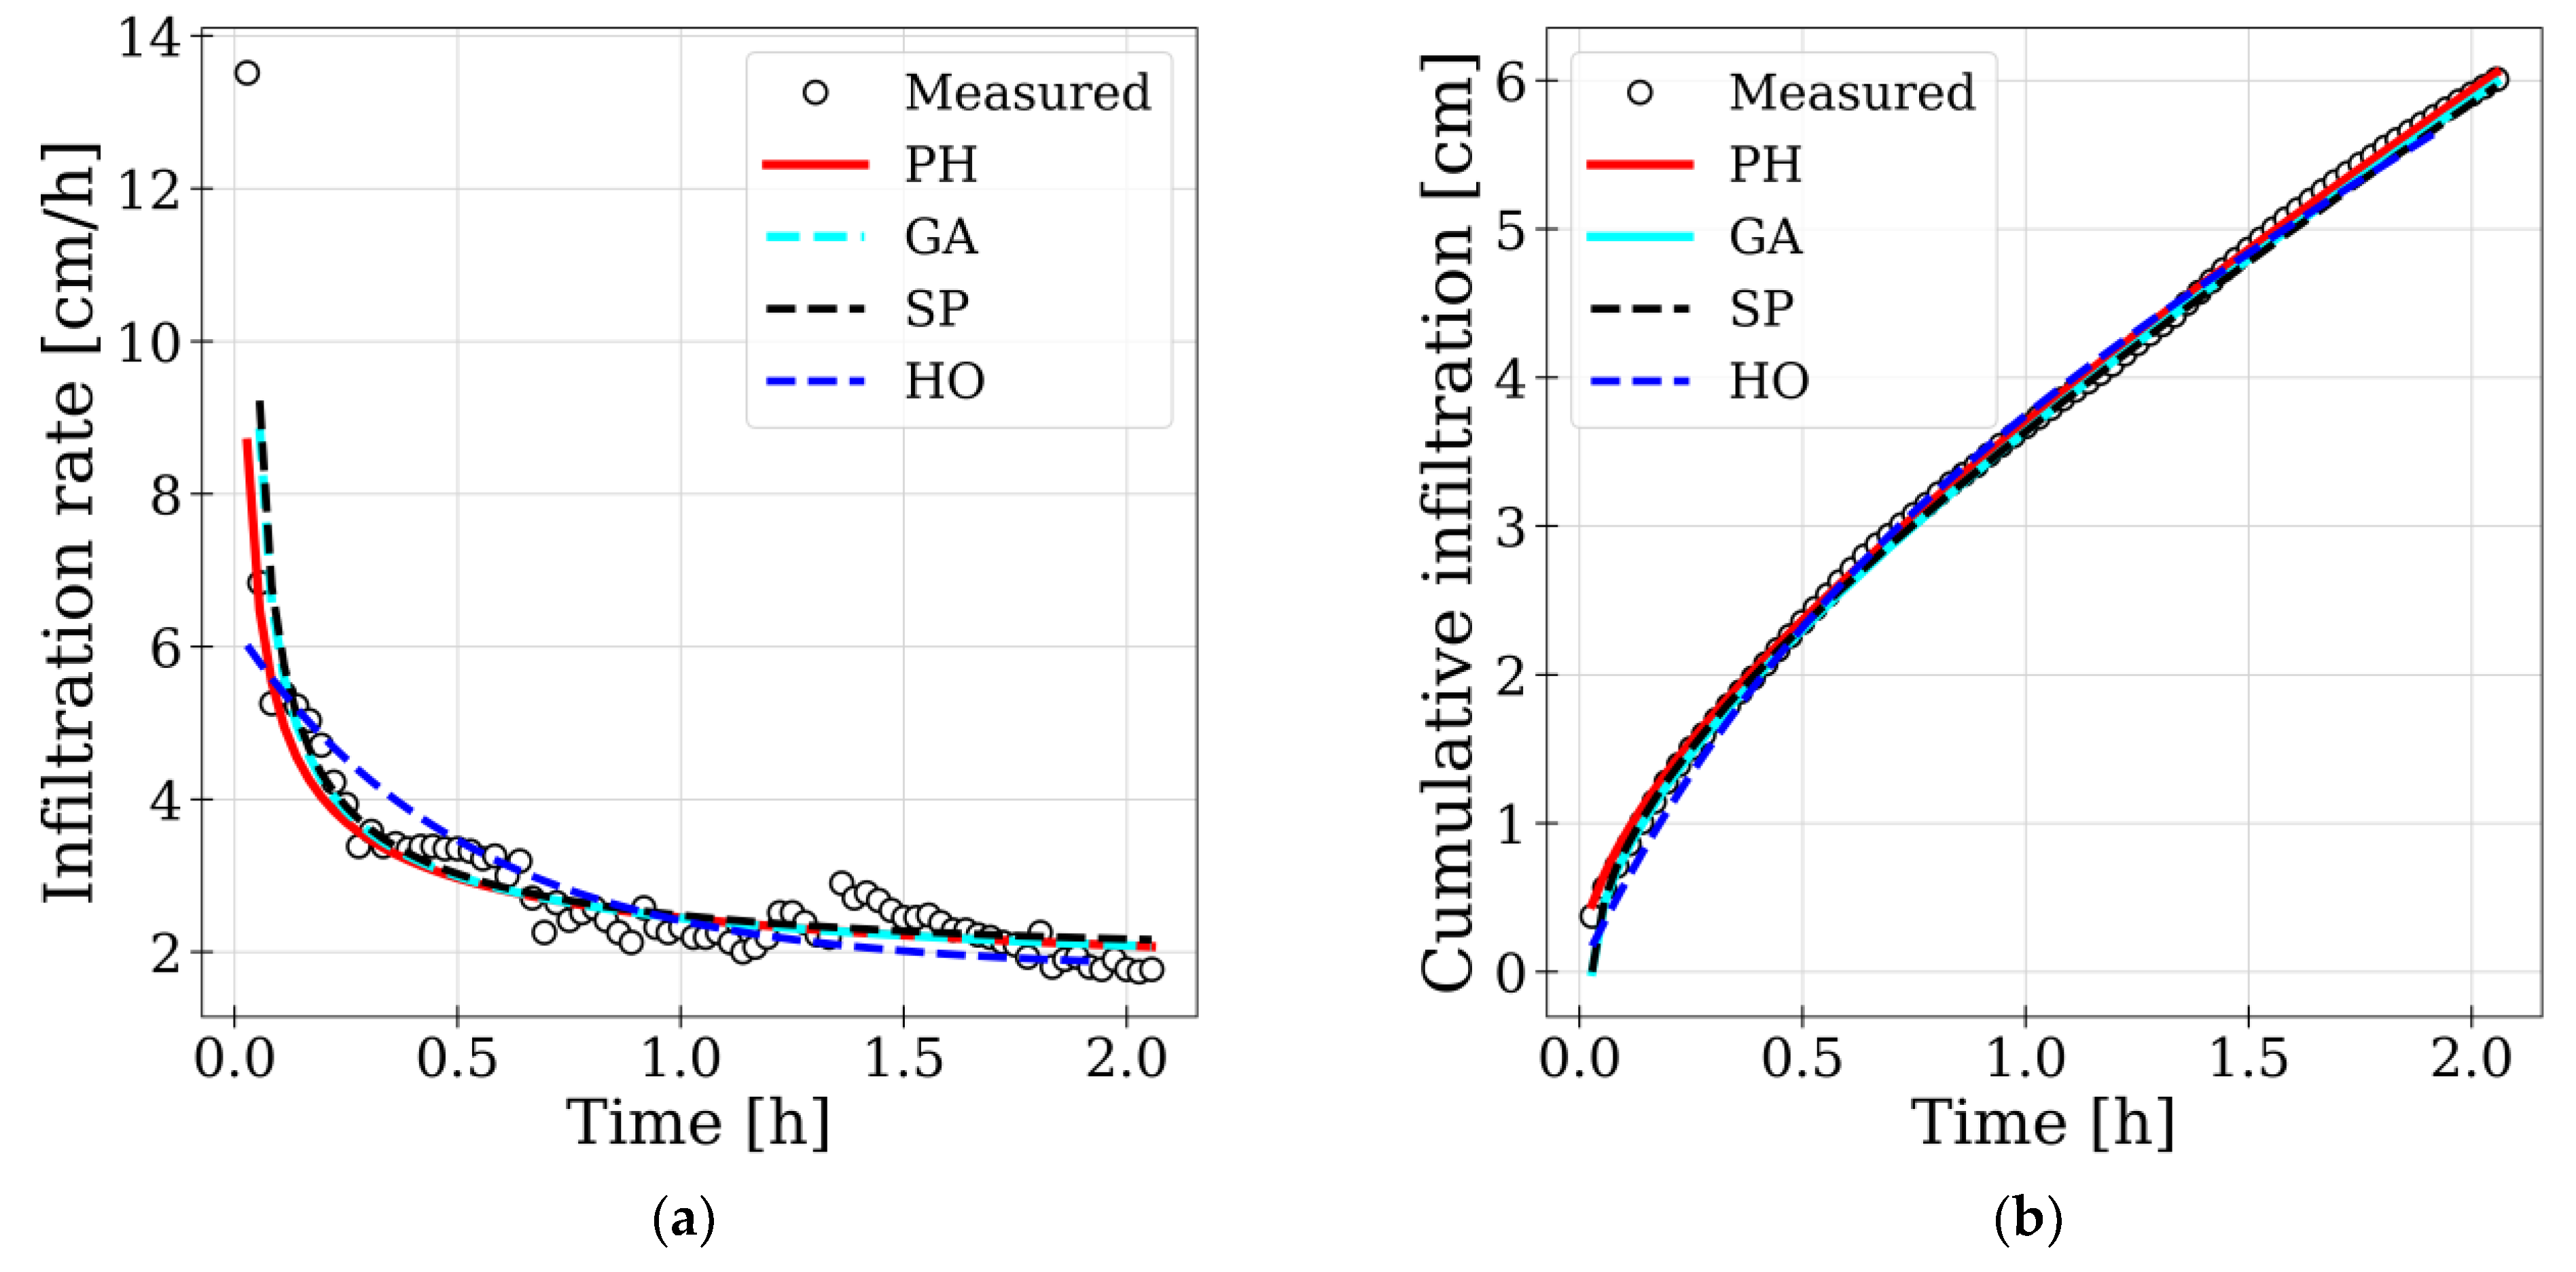
3.2. Infiltration Modeling

For site T2, experimental infiltration curves were used to evaluate soil hydraulic parameters using four different commonly used infiltration models for comparative analysis. All models considered were found to fit the experimental data, except for the initial two minutes of the measurement. In general, the Philip (PH), Green-Ampt (GA), and Smith-Parlange (SP) models demonstrated a better fit of the infiltration rate compared to the semi-empirical Horton (HO) model, but this difference is not as prominent when examining the cumulative infiltration curve (Figure 4). Using the HO model, we were able to assess the initial infiltration capacity ( f 0 = 6.26   c m / h ) , the final constant infiltration rate ( f c = 1.77   c m / h ) , and Horton’s dimensionless coefficient ( k = 1.95 ) , but it does not provide the key parameter of interest, K S .
The best fit of the parameters of the GA, SP, and PH models (Table 4) was determined by local calibration, i.e., by performing a series of successive calculations and identifying the input combination that yielded the lowest MAE between observed and predicted value. The first value in Table 4 denotes the best fit value, while the values in parentheses represent the range of the top 20 combinations. A larger range implies that the model is less sensitive to changes in particular parameter and vice versa.
Among the optimal variants, the PH model, which requires only three input variables, exhibited the highest MAE among the three theoretical models evaluated, while the SP model, which requires five input variables, had the lowest MAE. The key parameter that we aimed to estimate, K S , was found to be the lowest, i.e., at 0.33 × 10⁻³ cm/s using the PH model and the highest, i.e., at 0.56 × 10⁻³ cm/s using the SP model. The PH model provided the closest match to the Ks value obtained by the Equation (1) with 0.25 × 10⁻³ cm/s.
The accuracy of the estimated initial hydraulic conductivity ( K i ) within the SP model may not be entirely reliable, because it appears in a difference term ( K s   K i ) of the equation and is generally significantly smaller compared to K s , even 5–7 orders of magnitude smaller than its value at saturation according to [77]. As a result, the sensitivity of the SP model to changes in this particular parameter is limited.
Since the initial and saturated water content were not evaluated in the field, a difference value ( θ s θ i ) was used as an input parameter in the GA and SP models. A relatively wide range of input values resulted in small MAEs, which applies for both models. This suggests that the step size employed was sufficiently small and the models are not very sensitive to changes in this specific parameter. Assuming that the saturated water content ( θ s ) is equal to the porosity ( Φ ) [78], which typically ranges from 0.33 to 0.46 for sandy clay loam [73,75], the initial water content ( θ i ) should be less than 20%.
Capillary length ( G ) is a key parameter used to describe the relative strength of capillary forces compared to gravitational forces during movement of water in unsaturated soils. The reference input range for modeling was defined according to [79,80] with a step size of 1 cm. The optimal fitting value was at the lower limit of the predefined range ( G = 5 c m ) and falls into the moderate soil capillarity category according to [81,82]. Thus, it can be excluded that either capillarity or gravity has a significant dominance over the other. The determined value is generally in agreement with the reference values [82] but may indicate the presence of larger macropores.
According to [73,75], the characteristic suction head ( ψ ) of sandy clay loam can range from 4.42 to 108.0 cm, so the optimal fit value in the GA model, ψ = 8.5 c m , was at the lower limit of this range, indicating the presence of a larger pore size [73] as well as a high hydraulic conductivity value associated with greater water content and saturated conditions during the performance of the DRI infiltration test [77]. Moreover, the lower soil suction may also be related to high air temperature, which decreases surface tension.

4. Conclusions

In the first part of the study, two types of infiltrometers, i.e., the double-ring infiltrometer (DRI) and the mini-disk infiltrometer (MDI), were employed to compare the assessment of hydraulic conductivity and response of the two instruments during the dry season in the central urban park of Ljubljana, Slovenia.
The study confirmed that the unsaturated hydraulic conductivity, denoted as K(h) and determined with MDI, is generally lower than the saturated hydraulic conductivity ( K s ) determined with DRI, although unexpectedly high K h values were obtained with MDI at site T4 with visibly dry soil surface and sparsely growing grass. This is contrary to the common perception in the literature that dry conditions and high temperatures cause low K h values due to water repellency [32,71,72]. One possible explanation could be the need to adjust the suction rate, possibly due to a slightly higher proportion of sandy components in the soil texture, but this problem did not occur in other sites with similar proportions of sandy components. We therefore speculate whether the discrepancy could also be attributed to the rapid and lateral infiltration visible at the soil surface, which can strongly influence the overall hydraulic conductivity of the soil. However, further studies with many more replicates at the same site, with different suction rates and under different conditions, would be needed to confirm this. It is also clear from the results that the choice of van Genuchten parameters has a significant influence on the calculated values of K(h) and that K(h) is spatially variable over short distances (<1 m), i.e., between in-site locations A and B.
Another anomaly was observed using DRI, where atypically high infiltration rates were observed in the first measurement at two of the four sites (T1 and T3), resulting in K s evaluations about three times higher than those of subsequent replicates at the same spot and under the same conditions. The elevated initial infiltration rates are primarily attributed to the local presence of macropores and preferential pathways, as it was also established by modeling in the second part, but insufficient soil saturation during the initial measurements, possibly due to the prevailing dry conditions, could also be a possible contributing factor. Despite the anomalies, almost all of the values obtained are consistent with the range suggested by USDA values for field texture. This indicates that the determined values are reliable, but that the lateral deviations are large and significant.
In the second part of the study, we used experimental infiltration curves from a selected site to estimate hydraulic parameters using four different infiltration models. In general, the theoretical models of Philip (PH), Green-Ampt (GA), and Smith-Parlange (SP) demonstrated a better fit to the experimental DRI data than the semi-empirical model of Horton (HO). Among the optimal variants, the SP model, which requires the largest number of different input variables, yielded the lowest MAE. The value of K s obtained using the PH model, the simplest of the three theoretical models used, most closely matched the K s value obtained from the USDA Equation (1) [48].

Author Contributions

Conceptualization, methodology, and supervision, M.Š.; measurements, software, formal analysis, investigation and visualization, J.S.; writing—original draft, J.S.; writing—review and editing, M.Š. and J.P. All authors have read and agreed to the published version of the manuscript.

Funding

This research was partially funded by the Slovenian Research Agency (ARRS), grant number P2-0180 (Water Science and Technology, and Geotechnical Engineering: Tools and Methods for Process Analyses and Simulations, and Development of Technologies). The study was carried out within the scope of the ongoing research projects J2-4489, J6-4628, and N2-0313 supported by the Slovenian Research and Innovation Agency as well as the CELSA project entitled “Interception experimentation and modelling for enhanced impact analysis of nature-based solutions”.

Data Availability Statement

Data is contained within the article.

Acknowledgments

The authors would like to thank the anonymous reviewers for their valuable comments, which improved the quality of the paper.

Conflicts of Interest

The authors declare no conflict of interest.

References

  1. Chithra, S.V.; Harindranathan Nair, M.V.; Amaranth, A.; Anjana, N.S. Impacts of Impervious Surfaces on the Environment. Int. J. Eng. Sci. Invent. 2015, 4, 27–31. [Google Scholar]
  2. Deska, I.; Mrowiec, M.; Ociepa, E.; Michniewski, M. Impact of the Hydrogel Amendment and the Dry Period Duration on the Green Roof Retention Capacity. Ecol. Chem. Eng. S 2020, 27, 357–371. [Google Scholar] [CrossRef]
  3. Brilly, M.; Rusjan, S.; Vidmar, A. Monitoring the Impact of Urbanisation on the Glinscica Stream. Phys. Chem. Earth 2006, 31, 1089–1096. [Google Scholar] [CrossRef]
  4. Miller, J.D.; Hess, T. Urbanisation Impacts on Storm Runoff along a Rural-Urban Gradient. J. Hydrol. 2017, 552, 474–489. [Google Scholar] [CrossRef]
  5. Rezaei, A.R.; Ismail, Z.B.; Niksokhan, M.H.; Ramli, A.H.; Sidek, L.M.; Dayarian, M.A. Investigating the Effective Factors Influencing Surface Runoff Generation in Urbacatchments—A Review. Desalination Water Treat. 2019, 164, 276–292. [Google Scholar] [CrossRef]
  6. Ponting, J.; Kelly, T.J.; Verhoef, A.; Watts, M.J.; Sizmur, T. The Impact of Increased Flooding Occurrence on the Mobility of Potentially Toxic Elements in Floodplain Soil—A Review. Sci. Total Environ. 2021, 754, 142040. [Google Scholar] [CrossRef]
  7. Chen, Y.; Shi, X.; Jin, X.; Jin, P. Characteristics of Overflow Pollution from Combined Sewer Sediment: Formation, Contribution and Regulation. Chemosphere 2022, 298, 134254. [Google Scholar] [CrossRef]
  8. Barron, O.V.; Donn, M.J.; Barr, A.D. Urbanisation and Shallow Groundwater: Predicting Changes in Catchment Hydrological Responses. Water Resour. Manag. 2013, 27, 95–115. [Google Scholar] [CrossRef]
  9. Passarello, M.C.; Sharp, J.M.; Pierce, S.A. Estimating Urban-Induced Artificial Recharge: A Case Study for Austin, TX. Environ. Eng. Geosci. 2012, 18, 25–36. [Google Scholar] [CrossRef]
  10. Grischek, T.; Nestler, W. Urban Groundwater in Dresen, Germany. Hydrogeol. J. 1996, 4, 48–63. [Google Scholar] [CrossRef]
  11. Rose, S.; Peters, N.E. Effects of Urbanization on Streamflow in the Atlanta Area (Georgia, USA): A Comparative Hydrological Approach. Hydrol. Process 2001, 15, 1441–1457. [Google Scholar] [CrossRef]
  12. Minnig, M.; Moeck, C.; Radny, D.; Schirmer, M. Impact of Urbanization on Groundwater Recharge Rates in Dübendorf, Switzerland. J. Hydrol. 2018, 563, 1135–1146. [Google Scholar] [CrossRef]
  13. Zeng, F.; Ma, M.G.; Di, D.R.; Shi, W.Y. Separating the Impacts of Climate Change and Human Activities on Runoff: A Review of Method and Application. Water 2020, 12, 2201. [Google Scholar] [CrossRef]
  14. Fortier, C.; Mailhot, A. Climate Change Impact on Combined Sewer Overflows. J. Water Resour. Plan. Manag. 2015, 141, 04014073. [Google Scholar] [CrossRef]
  15. Tavakol-Davani, H.; Goharian, E.; Hansen, C.H.; Tavakol-Davani, H.; Apul, D.; Burian, S.J. How Does Climate Change Affect Combined Sewer Overflow in a System Benefiting from Rainwater Harvesting Systems? Sustain. Cities Soc. 2016, 27, 430–438. [Google Scholar] [CrossRef]
  16. Fu, X.; Hopton, M.E.; Wang, X. Assessment of Green Infrastructure Performance through an Urban Resilience Lens. J. Clean. Prod. 2021, 289, 125146. [Google Scholar] [CrossRef]
  17. Zabret, K.; Šraj, M. Rainfall Interception by Urban Trees and Their Impact on Potential Surface Runoff. Clean 2019, 47, 1800327. [Google Scholar] [CrossRef]
  18. Ebrahimian, A.; Sample-Lord, K.; Wadzuk, B.; Traver, R. Temporal and Spatial Variation of Infiltration in Urban Green Infrastructure. Hydrol. Process 2020, 34, 1016–1034. [Google Scholar] [CrossRef]
  19. Davis, A.P.; Hunt, W.F.; Traver, R.G.; Clar, M. Bioretention Technology: Overview of Current Practice and Future Needs. J.Environ.Eng. 2009, 135, 109–117. [Google Scholar] [CrossRef]
  20. Raška, P.; Bezak, N.; Ferreira, C.S.S.; Kalantari, Z.; Banasik, K.; Bertola, M.; Bourke, M.; Cerdà, A.; Davids, P.; Madruga de Brito, M.; et al. Identifying Barriers for Nature-Based Solutions in Flood Risk Management: An Interdisciplinary Overview Using Expert Community Approach. J. Environ. Manag. 2022, 310, 114725. [Google Scholar] [CrossRef]
  21. Štajdohar, M.; Brilly, M.; Šraj, M. The Influence of Sustainable Measures on Runoff Hydrograph from an Urbanized Drainage Area. Acta Hydrotech. 2016, 29, 145–162. [Google Scholar]
  22. Yang, Y.; Chui, T.F.M. Hydrologic Performance Simulation of Green Infrastructures: Why Data-Driven Modelling Can Be Useful? In New Trends in Urban Drainage Modelling, Proceedings of the 11th International Conference on Urban Drainage Modelling (UDM), Palermo, Italy, 23–26 September, 2018; Mannina, G., Ed.; Springer International Publishing: Cham, Switzerland, 2019; pp. 480–484. [Google Scholar]
  23. Chowdary, V.M.; Rao, M.D.; Jaiswal, C.S. Study of Infiltration Process under Different Experimental Conditions. Agric. Water Manag. 2006, 83, 69–78. [Google Scholar] [CrossRef]
  24. Söderberg, M.H. Measuring Soil Infiltration Rates in Cultivated Land. Master’s Thesis, Stockholm University, Stockholm, Sweden, 2015. [Google Scholar]
  25. Mubarak, I.; Angulo-Jaramillo, R.; Mailhol, J.C.; Ruelle, P.; Khaledian, M.; Vauclin, M. Spatial Analysis of Soil Surface Hydraulic Properties: Is Infiltration Method Dependent? Agric. Water Manag. 2010, 97, 1517–1526. [Google Scholar] [CrossRef]
  26. Zhou, X.; Lin, H.S.; White, E.A. Surface Soil Hydraulic Properties in Four Soil Series under Different Land Uses and Their Temporal Changes. Catena 2008, 73, 180–188. [Google Scholar] [CrossRef]
  27. Stolte, J.; Van Venrooij, B.; Zhang, G.; Trouwborst, K.O.; Liu, G.; Ritsema, C.J.; Hessel, R. Land-Use Induced Spatial Heterogeneity of Soil Hydraulic Properties on the Loess Plateau in China. Catena 2003, 54, 59–75. [Google Scholar] [CrossRef]
  28. Kumar, S.; Sekhar, M.; Reddy, D.V.; Mohan Kumar, M.S. Estimation of Soil Hydraulic Properties and Their Uncertainty: Comparison between Laboratory and Field Experiment. Hydrol. Process 2010, 24, 3426–3435. [Google Scholar] [CrossRef]
  29. Muñoz-Carpena, R.; Regalado, C.M.; Álvarez-Benedi, J.; Bartoli, F. Field Evaluation of the New Philip-Dunne Permeameter for Measuring Saturated Hydraulic Conductivity. Soil. Sci. 2002, 167, 9–24. [Google Scholar] [CrossRef]
  30. Ronayne, M.J.; Houghton, T.B.; Stednick, J.D. Field Characterization of Hydraulic Conductivity in a Heterogeneous Alpine Glacial Till. J. Hydrol. 2012, 458–459, 103–109. [Google Scholar] [CrossRef]
  31. Ghosh, B.; Pekkat, S. A Critical Evaluation of Measurement Induced Variability in Infiltration Characteristics for a River Sub-Catchment. Measurement 2019, 132, 47–59. [Google Scholar] [CrossRef]
  32. Radinja, M.; Vidmar, I.; Atanasova, N.; Mikoš, M.; Šraj, M. Determination of Spatial and Temporal Variability of Soil Hydraulic Conductivity for Urban Runoff Modelling. Water 2019, 11, 941. [Google Scholar] [CrossRef]
  33. Bodhinayake, W.; Cheng Si, B.; Noborio, K. Determination of Hydraulic Properties in Sloping Landscapes from Tension and Double-Ring Infiltrometers. Vadose Zone J. 2004, 3, 964–970. [Google Scholar]
  34. Angulo-Jaramillo, R.; Vandervaere, J.-P.; Âphanie Roulier, S.; Thony, J.-L.; Gaudet, J.-P.; Vauclin, M. Field Measurement of Soil Surface Hydraulic Properties by Disc and Ring Infitrometers A Review and Recent Developments. Soil. Tillage Res. 2000, 55, 1–29. [Google Scholar] [CrossRef]
  35. Morbidelli, R.; Corradini, C.; Saltalippi, C.; Flammini, A.; Dari, J.; Govindaraju, R.S. Rainfall Infiltration Modeling: A Review. Water 2018, 10, 1873. [Google Scholar] [CrossRef]
  36. Mishra, S.K.; Tyagi, J.V.; Singh, V.P. Comparison of Infiltration Models. Hydrol. Process 2003, 17, 2629–2652. [Google Scholar] [CrossRef]
  37. Šraj, M.; Dirnbek, L.; Brilly, M. The Influence of Effective Rainfall on Modeled Runoff Hydrograph. J. Hydrol. Hydromech. 2010, 58, 3–14. [Google Scholar] [CrossRef]
  38. Žlebnik, L. Pleistocene Deposits of the Kranj, Sora and Ljubljana Fields. Geologija 1971, 14, 5–51. (In Slovene) [Google Scholar]
  39. Premru, U. Geological Map of SFRJ 1: 100000 Sheet Ljubljana. Geologija 1974, 17, 497–499. [Google Scholar]
  40. Drobne, F.; Mencej, Z.; Brilly, M. Review and Additions to the Expert Basis for Determining the Water Protection Zones of Current and Prospective Water Sources for the City of Ljubljana and Its Surroundings; Interpreter for Maps of Water Protection Zones: Ljubljana, Slovenia, 1997. (In Slovene) [Google Scholar]
  41. Prestor, J.; Urbanc, J.; Janža, M.; Peternel Rikanovič, R.; Bizjak, M.; Medič, M.; Strojan, M. Review and Additions to the Expert Basis for Determining the Protection Zones of Water Resources for the Central Drinking Water Supply System in the City of Ljubljana—Ljubljansko Polje; Geological Survey of Slovenia: Ljubljana, Slovenia, 2002. (In Slovene) [Google Scholar]
  42. ARSO ARSO Meteorological Achive. Available online: https://meteo.arso.gov.si/met/sl/archive/ (accessed on 15 December 2022).
  43. Ritchey, E.L.; Mcgrath, J.M.; Gehring, D. Determining Soil Texture by Feel. Agric. Nat. Resour. Publ. Coop. Ext. Serv. 2015, 1, 1–4. [Google Scholar]
  44. Klocke, N.L.; Fischbach, P.E. G84-690 Estimating Soil Moisture by Appearance and Feel; Historical Materials from University of Nebraska-Lincoln Extension: Lincoln, NE, USA, 1984. [Google Scholar]
  45. Smith, R.E. Infiltration Theory for Hydrologic Applications; American Geophysical Union: Washington, DC, USA, 2002; ISBN 0875903193. [Google Scholar]
  46. Standard D3385-09; Standard Test Method for Infiltration Rate of Soils in Field Using Double-Ring Infiltrometer. ASTM: West Conshohocken, PA, USA, 2009.
  47. Arriaga, F.J.; Kornecki, T.S.; Balkcom, K.S.; Raper, R.L. A Method for Automating Data Collection from a Double-Ring Infiltrometer under Falling Head Conditions. Soil. Use Manag. 2010, 26, 61–67. [Google Scholar] [CrossRef]
  48. USDA. Soil Survey Field and Laboratory Methods Manual, Soil Survey Investigations Report No. 51; Version 2; USDA: Washington, DC, USA, 2014. [Google Scholar]
  49. Reynolds, W.D.; Elrick, D.E. Ponded Infiltration From a Single Ring: I. Analysis of Steady Flow. Soil. Sci. Soc. Am. J. 1990, 54, 1233–1241. [Google Scholar] [CrossRef]
  50. Youngs, E.G.; Leeds-Harrison, P.B.; Elrick, D.E. The Hydraulic Conductivity of Low Permeability Wet Soils Used as Landfill Lining and Capping Material: Analysis of Pressure Infiltrometer Measurements. Soil. Technol. 1995, 8, 153–160. [Google Scholar] [CrossRef]
  51. Elrick, D.E.; Reynolds, W.D.; Tan, K.A. Hydraulic Conductivity Measurements in the Unsaturated Zone Using Improved Well Analyses. Groundw. Monit. Remediat. 1989, 9, 184–193. [Google Scholar] [CrossRef]
  52. Decagon Devices. METER Group Mini Disk Infiltrometer—User’s Manual; Decagon Devices Inc.: Pullman, WA, USA, 2021. [Google Scholar]
  53. Dohnal, M.; Dusek, J.; Vogel, T. Improving Hydraulic Conductivity Estimates from Minidisk Infiltrometer Measurements for Soils with Wide Pore-Size Distributions. Soil. Sci. Soc. Am. J. 2010, 74, 804–811. [Google Scholar] [CrossRef]
  54. Zhang, R. Infiltration Models for the Disk Infiltrometer. Soil Sci. Soc. Am. J. 1996, 61, 1597–1603. [Google Scholar] [CrossRef]
  55. Philip, J.R. The Theory of Infiltration: 4. Sorptivity and Algebraic Infiltration Equations. Soil. Sci. 1957, 84, 257–264. [Google Scholar] [CrossRef]
  56. Carsel, R.F.; Parrish, R.S. Developing Joint Probability Distributions of Soil Water Retention Characteristics. Water Resour. Res. 1988, 24, 755–769. [Google Scholar] [CrossRef]
  57. Bátková, K.; Miháliková, M.; Matula, S. Hydraulic Properties of a Cultivated Soil in Temperate Continental Climate Determined by Mini Disk Infiltrometer. Water 2020, 12, 843. [Google Scholar] [CrossRef]
  58. Kutilek, M.; Nielsen, D.R. Soil Hydrology; Schweizerbart Science Publishers: Stuttgart, Germany, 1992; ISBN 9783510653874. [Google Scholar]
  59. Fodor, N.; Sándor, R.; Orfanus, T.; Lichner, L.; Rajkai, K. Evaluation Method Dependency of Measured Saturated Hydraulic Conductivity. Geoderma 2011, 165, 60–68. [Google Scholar] [CrossRef]
  60. Green, W.H.; Ampt, G.A. Studies in Soil Physics: Part 1. The Flow of Air and Water through Soils. J. Agric. Sci. 1911, 4, 11–24. [Google Scholar]
  61. Smith, R.E.; Parlange, J.-Y. A Parameter-Efficient Hydrologic Infiltration Model. Water Resour. Res. 1978, 14, 533–538. [Google Scholar] [CrossRef]
  62. Horton, R.E. Analysis of Runoff-Plat Experiments with Varying Infiltration-Capacity. Rep. Pap. 1939, 20, 693–711. [Google Scholar] [CrossRef]
  63. Kluyver, T.; Ragan-Kelley, B.; Pérez, F.; Granger, B.; Bussonnier, M.; Frederic, J.; Kelley, K.; Hamrick, J.; Grout, J.; Corlay, S.; et al. Jupyter Notebooks—A Publishing Format for Reproducible Computational Workflows. In Proceedings of the Positioning and Power in Academic Publishing: Players, Agents and Agendas—Proceedings of the 20th International Conference on Electronic Publishing, ELPUB 2016, Göttingen, Germany, 7–9 June 2016; pp. 87–90. [Google Scholar]
  64. Turner, E.R. Comparison of Infiltration Equations and Their Field Validation with Rainfall Simulation. Master Thesis, University of Maryland, College Park, MD, USA, 2006. [Google Scholar]
  65. Farid, H.U.; Mahmood-Khan, Z.; Ahmad, I.; Shakoor, A.; Anjum, M.N.; Iqbal, M.M.; Mubeen, M.; Asghar, M. Estimation of Infiltration Models Parameters and Their Comparison to Simulate the Onsite Soil Infiltration Characteristics. Int. J. Agric. Biol. Eng. 2019, 12, 84–91. [Google Scholar] [CrossRef]
  66. Lili, M.; Bralts, V.F.; Yinghua, P.; Han, L.; Tingwu, L. Methods for Measuring Soil Infiltration: State of the Art. Int. J. Agric. Biol. Eng. 2008, 1, 22–30. [Google Scholar] [CrossRef]
  67. Zhang, S.Y.; Hopkins, I.; Guo, L.; Lin, H. Dynamics of Infiltration Rate and Field-Saturated Soil Hydraulic Conductivity in a Wastewater- Irrigated Cropland. Water 2019, 11, 1632. [Google Scholar] [CrossRef]
  68. Turner, D.P.; Sumner, M.E. The Influence of Initial Soil Moisture Content on Field Measured Infiltration Rates. Water SA 1978, 4, 1–8. [Google Scholar]
  69. Fatehnia, M.; Tawfiq, K.; Ye, M. Estimation of Saturated Hydraulic Conductivity from Double-Ring Infiltrometer Measurements. Eur. J. Soil. Sci. 2016, 67, 135–147. [Google Scholar] [CrossRef]
  70. Fan, G.; Han, Y.; Song, M. Experimental Study on the Reasonable Inbuilt-Ring Depth of Soil One-Dimensional Infiltration Experiment in Field. In Proceedings of the Computer and Computing Technologies in Agriculture V, CCTA 2011, IFIP Advances in Information and Communication Technology, Beijing, China, 29–31 October 2011; Springer: Berlin/Heidelberg, Germany, 2012; Volume 368, pp. 427–436. [Google Scholar]
  71. De Jonge, L.W.; Jacobsen, O.H.; Moldrup, P. Soil Water Repellency: Effects of Water Content, Temperature, and Particle Size. Soil. Sci. Soc. Am. J. 1999, 63, 437–442. [Google Scholar] [CrossRef]
  72. Leelamanie, D.A.L.; Karube, J. Effects of Organic Compounds, Water Content and Clay on the Water Repellency of a Model Sandy Soil. Soil. Sci. Plant Nutr. 2007, 53, 711–719. [Google Scholar] [CrossRef]
  73. Akan, A.O.; Houghtalen, R.J. Urban Hydrology, Hydraulics, and Stormwater Quality: Engineering Applications and Computer Modeling; John Wiley & Sons: Hoboken, NJ, USA, 2003; ISBN 0471431583. [Google Scholar]
  74. Rawls, W.J.; Brakensiek, D.L.; Saxton, K.E. Estimation of Soil Water Properties. Trans. ASAE 1982, 25, 1316–1320. [Google Scholar] [CrossRef]
  75. Rawls, W.J.; Asce, M.; Brakensiek, D.L.; Miller, N. Green-ampt Infiltration Parameters from Soils Data. J. Hydraul. Eng. 1983, 109, 62–70. [Google Scholar] [CrossRef]
  76. USDA Soil. Survey Manual; USDA Soil: Waverly, IA, USA, 2017. [Google Scholar]
  77. Lu, N.; Likos, W.J. Rate of Capillary Rise in Soil. J. Geotech. Geoenviron. Eng. 2004, 130, 646–650. [Google Scholar] [CrossRef]
  78. Oleszczuk, R.; Truba, M. The Analysis of Some Physical Properties of Drained Peat-Moorsh Soil Layers. Ann. Wars. Univ. Life Sci.-SGGW. Land. Reclam. 2013, 45, 41–48. [Google Scholar] [CrossRef]
  79. Aldrees, A.; Nachabe, M. Capillary Length and Field Capacity in Draining Soil Profiles. Water Resour. Res. 2019, 55, 4499–4507. [Google Scholar] [CrossRef]
  80. Lehmann, P.; Bickel, S.; Wei, Z.; Or, D. Physical Constraints for Improved Soil Hydraulic Parameter Estimation by Pedotransfer Functions. Water Resour. Res. 2020, 56, e2019WR025963. [Google Scholar] [CrossRef]
  81. Elrick, D.E.; Reynolds, W.D. Methods for Analyzing Constant-Head Well Permeameter Data. Soil. Sci. Soc. Am. J. 1992, 56, 320–323. [Google Scholar] [CrossRef]
  82. Di Prima, S.; Stewart, R.D.; Castellini, M.; Bagarello, V.; Abou Najm, M.R.; Pirastru, M.; Giadrossich, F.; Iovino, M.; Angulo-Jaramillo, R.; Lassabatere, L. Estimating the Macroscopic Capillary Length from Beerkan Infiltration Experiments and Its Impact on Saturated Soil Hydraulic Conductivity Predictions. J. Hydrol. 2020, 589, 125159. [Google Scholar] [CrossRef]
Figure 1. Study area and schematic presentation of DRI and MDI measurements.
Water 15 03635 g001
Figure 2. Lateral infiltration of water observed during infiltration measurement using MDI at T4 (a), results of K(h) using MDI at each site (T1–T4) and in-site location A and B (b), and comparison of Ks for both instruments—DRI and MDI, namely selected DRI ( K s D R I * ) at each site (T1–T4) and mean K s M D I at each site (T1–T4) and in-site location A and B (c).
Water 15 03635 g002
Figure 3. Comparison of infiltration rate from DRI and MDI measurements at site T2; markers represent measured data, while MDI dashed lines are extrapolated over considered time scale.
Water 15 03635 g003
Figure 4. Fitted curves of Philip (PH), Horton (HO), Green-Ampt (GA), and Smith-Parlange (SP) infiltration models to the measured infiltration data at site T2: infiltration rate (a) and cumulative infiltration (b).
Water 15 03635 g004
Table 1. Assessment of soil texture, soil moisture, sun exposure, and vegetation at each site.
SiteSoil Texture [43]Moisture [44]Sun ExposureVegetation
T1sandy loammoistmostly shadeddense grass
T2sandy clay loamslightly moistsunlitdense grass
T3sandy clay loammoistmostly shadeddense grass
T4sandy loamdrysunlitsparsely grown grass
Table 2. Equations and parameters of applied infiltration models.
Infiltration ModelInfiltration Rate
Green-Ampt f p ( t ) = K S ψ ( θ s θ i ) F ( t ) + 1 (7)
Smith-Parlange f p ( t ) = K S + γ ( K S K i ) ( exp γ F G ( θ s θ i ) 1 ) (8)
Horton f p ( t ) = f 0 + f 0 f c     e k t (9)
Philip f p ( t ) = 1 2 S t 1 / 2 + c K S (10)
Infiltration ModelCumulative Infiltration
Green-Ampt F ( t ) = K t + ψ ( θ s θ i ) l n ( 1 + F t ψ ( θ s θ i ) ) (11)
Smith-Parlange F t = K S K i t 1 γ + G ( θ s θ i ) l n ( 1 + 1 γ exp γ F t G ( θ s θ i ) 1 ) (12)
Horton F t = f c t + ( f 0 f c ) k [ 1 e k t ] (13)
Philip F t = S t 1 / 2 + c K S t (14)
AbbreviationParameterUnit
f p potential infiltration rate (capacity) after time of ponding ( t > t p )(cm/s)
F cumulative infiltration(cm)
t time(s)
θ s saturated water content(-)
θ i initial water content(-)
ψ average suction across the wetting front(cm)
K S saturated hydraulic conductivity(cm/s)
K i initial hydraulic conductivity(cm/s)
G capillary length scale(cm)
γ dimensionless Smith-Parlange coefficient (usually 0.8–0.85)(-)
S sorptivity( c m / s 1 2 )
c soil dependent dimensionless Philip coefficient(-)
f 0 initial infiltration capacity(cm/s)
f c final constant infiltration rate(cm/s)
k Horton dimensionless coefficient that depends on the initial water content and the application rate(-)
Table 3. Ks and K(h) results of DRI and MDI measurements.
SiteNo.Loc.Soil TypeKsDRI
(Equation (1))
[10−3 cm/s]
KsDRI*
[10−3 cm/s]
K(h)MDI
(Equation (3))
[10−3 cm/s]
KsMDI
(Equation (6))
[10−3 cm/s]
K(h)MDI
/KsDRI*
KsMDI/
KsDRI*
CV of K(h)MDI [%]
Loc./Site
T1D1.1 SL2.99 *0.98
D1.2 0.98
M1.1T1-ASL 0.19 (0.05)1.080.19 (0.05)1.1035.956.2
M1.3 0.22 (0.05)1.220.22 (0.05)1.24
M1.4 0.37 (0.09)2.150.38 (0.09)2.18
M1.2T1-BSL 0.61 (0.15)3.370.62 (0.15)3.4228.1
M1.5 0.88 (0.21)5.180.90 (0.21)5.26
M1.6 0.52 (0.12)3.060.53 (0.12)3.11
T2D2.1 SCL0.250.25
M2.1T2-ACL 0.39 (0.16)3.881.56 (0.64)15.3513.060.1
M2.2 0.44 (0.18)4.421.76 (0.72)17.48
M2.5 0.34 (0.14)3.401.36 (0.56)13.45
M2.3T2-BSCL 0.13 (0.04)0.890.52 (0.16)3.5112.5
M2.4 0.13 (0.03)0.810.52 (0.12)3.20
M2.6 0.10 (0.03)0.650.40 (0.12)2.55
T3D3.1 SCL2.39 *0.97
D3.2 0.83
D3.3 1.10
M3.1T3-ASCL 0.17 (0.04)1.060.18 (0.04)1.1018.941.7
M3.2 0.23 (0.03)0.700.24 (0.03)0.73
M3.4 0.17 (0.04)1.090.18 (0.04)1.13
M3.3T3-BSCL 0.44 (0.05)1.340.45 (0.05)1.3934.7
M3.5 0.21 (0.06)1.350.22 (0.06)1.40
M3.6 0.34 (0.09)2.180.35 (0.09)2.26
T4D4.1 SL0.180.30
D4.2 0.41
M4.1T4-ASL 0.79 (0.19)4.562.63 (0.63)15.2627.742.6
M4.2 1.18 (0.28)6.953.93 (0.93)23.26
M4.5 0.72 (0.17)4.462.40 (0.57)14.93
M4.3T4-BSL 0.45 (0.11)2.651.50 (0.37)8.8718.2
M4.4 0.55 (0.13)3.281.83 (0.43)10.98
M4.6 0.38 (0.09)2.251.27 (0.30)7.53
Notes: * Extreme values excluded; No.: measurement number: capital letter D for DRI measurements, and capital letter M for MDI measurements; Soil type abbreviations: SL: sandy loam, CL: clay loam, SCL: sandy clay loam; KsDRI*: Selected Ks value from DRI at the considered site; columns K(h)MDI and K(h)MDI/KsDRI*: first value considers A according to Equation (4), the second value in parentheses considers A according to Equation (5); CV: Coefficient of variation [%] that considers the first value in K(h)MDI column.
Table 4. The optimal fit of parameters of Philip (PH), Green-Ampt (GA), and Smith-Parlange (SP) infiltration models.
ParameterGreen-AmptSmith-ParlangePhilip
K S   ( 10 3 c m / s ) 0.42 (0.39–0.44)0.56 (0.53–0.58)0.33 (0.14–0.42)
θ s θ i   ( ) 0.27 (0.27–0.45)0.29 (0.28–0.41)/
ψ   ( c m ) 8.5 (4.5–9.5)//
G   ( c m ) /5.0 (5.0–7.0)/
K i ( 10 3 c m / s ) /0.022 (0.008–0.025)/
S ( 10 3 c m / s 1 / 2 ) //0.69 (0.58–0.86)
Disclaimer/Publisher’s Note: The statements, opinions and data contained in all publications are solely those of the individual author(s) and contributor(s) and not of MDPI and/or the editor(s). MDPI and/or the editor(s) disclaim responsibility for any injury to people or property resulting from any ideas, methods, instructions or products referred to in the content.

