Article

Quantification of Spatiotemporal Variability of Evapotranspiration (ET) and the Contribution of Influencing Factors for Different Land Cover Types in the Yunnan Province

1
College of Earth Sciences, Chengdu University of Technology, Chengdu 610059, China
2
College of Resources and Environment, Chengdu University of Information Technology, Chengdu 610225, China
*
Author to whom correspondence should be addressed.
Water 2023, 15(18), 3309; https://doi.org/10.3390/w15183309
Submission received: 7 August 2023 / Revised: 14 September 2023 / Accepted: 18 September 2023 / Published: 19 September 2023

Abstract

:
Evapotranspiration (ET) is an important component of terrestrial ecosystems and is sensitive to climate and land-use change due to its obvious link to ecohydrological processes. Therefore, understanding the spatiotemporal variability of evapotranspiration and its drivers under different land cover types plays an important role in estimating the impact of environmental change on the regional water cycle. In this study, we first estimated the spatiotemporal variations of ET for different land cover types in the Yunnan Province from 2001 to 2020 using the MODIS-Terra ET product (MOD16A2.06) and meteorological datasets, and quantified the contribution of six factors: namely, temperature (TEMP), precipitation (PRCP), relative humidity (RH), wind speed (WDSP), soil moisture (SLME), NDVI, elevation, and slope, to the ET under different land cover types by using a ridge regression model. We then discussed the main reasons for the differences in ET in the Yunnan Province under different land cover types. The conclusions are as follows: during the study period, the annual mean ET ranged from 27 to 1183 mm, and there was a large spatial heterogeneity in its spatial distribution, with the smallest increasing trend of 2.1 mm/year in agricultural land and the largest increasing trend of 4.7 mm/year in grassland. Except for cropland, the sum of the relative contributions of the three influence factors, precipitation (PRCP), NDVI, and elevation, to all land cover types exceeded 40%, making them the most dominant factors influencing ET changes in the Yunnan Province. This study provides a comprehensive assessment of the impacts of climate, vegetation, topography, and soils on ET, and contributes to the development of appropriate water resource management policies for different subsurface types in the context of climate warming and revegetation programs.

1. Introduction

Evapotranspiration (ET) is an important component linking the water, energy, and carbon cycles, reflecting an important physical process of interaction between the atmosphere, vegetation, and soil [1,2,3,4]. ET directly affects the total water resources of a region by returning more than 60% of global terrestrial precipitation to the atmosphere [5]. Also, ET is critical for modeling terrestrial ecosystems, assessing soil moisture stress, and estimating water use for agricultural irrigation. Because ET is involved in multiple processes in terrestrial ecosystems, it is sensitive to climate and land use change [6,7,8]. The significant changes that have occurred in ET over the past few decades on spatiotemporal scales, in conjunction with climate change and human activities, have far-reaching implications for water resources management, the ecosystem, and economic and social development [9,10,11,12]. Therefore, the study of ET trends and their drivers from multi-year datasets is important to ensure the efficient use of water resources and ecological protection.
Evapotranspiration remains the most controversial component of the water cycle due to subsurface spatial heterogeneity, complex near-surface meteorological conditions, and the dynamic variability in water–heat transport processes [13,14]. The accurate estimation of the spatial and temporal variability of surface evapotranspiration (ET) on regional scales currently faces great challenges. In recent decades, scholars have conducted a large number of ET estimation studies around site, basin, and regional scales in order to estimate ET more accurately [15,16,17]. Among them, in situ measurements, such as eddy covariance techniques, liquid-flow measurements, and Bowen’s ratio system, are considered to be relatively reliable methods for estimating ET [18,19], but they are made on small scales (station scales), are not representative of entire ecosystems, and are difficult to generalize to regional or even global scales [17,20]. With the development of remote sensing technology, many process-driven physical models and data-driven models have been developed to accurately estimate ET on regional and global scales. Process-driven physical models such as the Surface Energy Balance System (SEBS) [21], Surface Energy Balance Algorithm for Land (SEBAL) [22], Penman-Monteith (PM) equation based on the Moderate Resolution Imaging Spectroradiometer (MODIS) LAI [23,24], and Priestley-Taylor (PT) algorithm [25,26] et al., compared to data-driven models, can characterize the interactions between the atmosphere, vegetation, and soils, which in turn are more conducive to the study of physical processes in the hydrologic cycle, energy balance, climate, and biogeochemical cycles of ET [8]. Relevant studies [24,27] have demonstrated that the accuracy and timeliness of existing MOD16 products can meet the needs of large-scale, long-term ET change studies to a certain extent.
Climate change has gained prominence in recent years and the water cycle and atmospheric circulation have been altered as a result, with significant impacts on ET [28,29,30]. The study of changes in ET is necessary to understand the extent of changes in the water cycle and energy transport processes. Factors affecting ET can be divided into two categories: climatic conditions (water and energy supply) and surface characteristics. Climatic conditions such as temperature, precipitation, relative humidity, and wind speed affect ET by changing the amount of moisture and energy. Surface characteristics such as land cover type, soil moisture content, vegetation cover, etc., lead to changes in ET by altering water–heat transport processes. Fu et al. [31] investigated the trend of ET in China between 2000 and 2019 using the MOD16 product and attributed the significant increase in ET to climate change, with precipitation being the most important factor. Similarly, Yang et al. [32] suggested that in the Qilian Mountains of NW China, climate change is also directly responsible for the rise in ET, where P (precipitation) is the dominant factor. There have been just as many studies of surface features, especially vegetation changes. Shao et al. [33] used the PT-JPL model to study ET change on the Loess Plateau and found that vegetation greening was the main driver of ET change. In the Loess Plateau region, where the impact of afforestation projects is high, vegetation greening is the dominant factor in the interannual variability of ET in 56% of the region, with a relative contribution of 93% of NDVI [34]. Therefore, it is particularly important to study the important factors affecting the changes in ET.
In the past decades, scholars have conducted in-depth studies on the spatiotemporal trends of ET and its drivers in China; however, studies on the trends of ET and its drivers under different land cover types are still lacking. In order to better understand the regional hydrologic cycle, it is important to quantify the contribution of influences to ET under different land cover types. Since changes in land cover types are influenced by climate change and human activities such as afforestation, urbanization, and returning farmland to the forest and grassland, different land cover types tend to reflect different ET trends and different dominant factors. Moreover, because different land cover types have different land cover, surface albedo, and soil moisture content, their corresponding ET amounts can vary widely. For example, Lin et al. [35] used a generalized nonlinear-complementary model (nonlinear-CR) to address the attribution of ET changes in different land cover types on the Tibetan Plateau, which showed that the dominant factor for ET changes in wet areas such as forests and shrubs between 1961 and 2014 was available energy, whereas in arid areas, such as deserts, ET changes were determined by water and energy factors. Therefore, an in-depth understanding of the individual impacts of different land cover types on ET is important for the development of targeted water management measures in the Yunnan Province, especially in the face of rapid climate change and frequent land resource management and planning.
The aim of this study was to use the MODIS-Terra ET product based on the Penman-Monteith (PM) method to explore: (1) the spatiotemporal patterns of ET change in the Yunnan Province from 2001 to 2020; (2) the quantification of the contribution of each influencing factor to ET and the identification of the main drivers of the different land cover types; and (3) the attribution of the differences in ET under different land cover types.

2. Materials and Methods
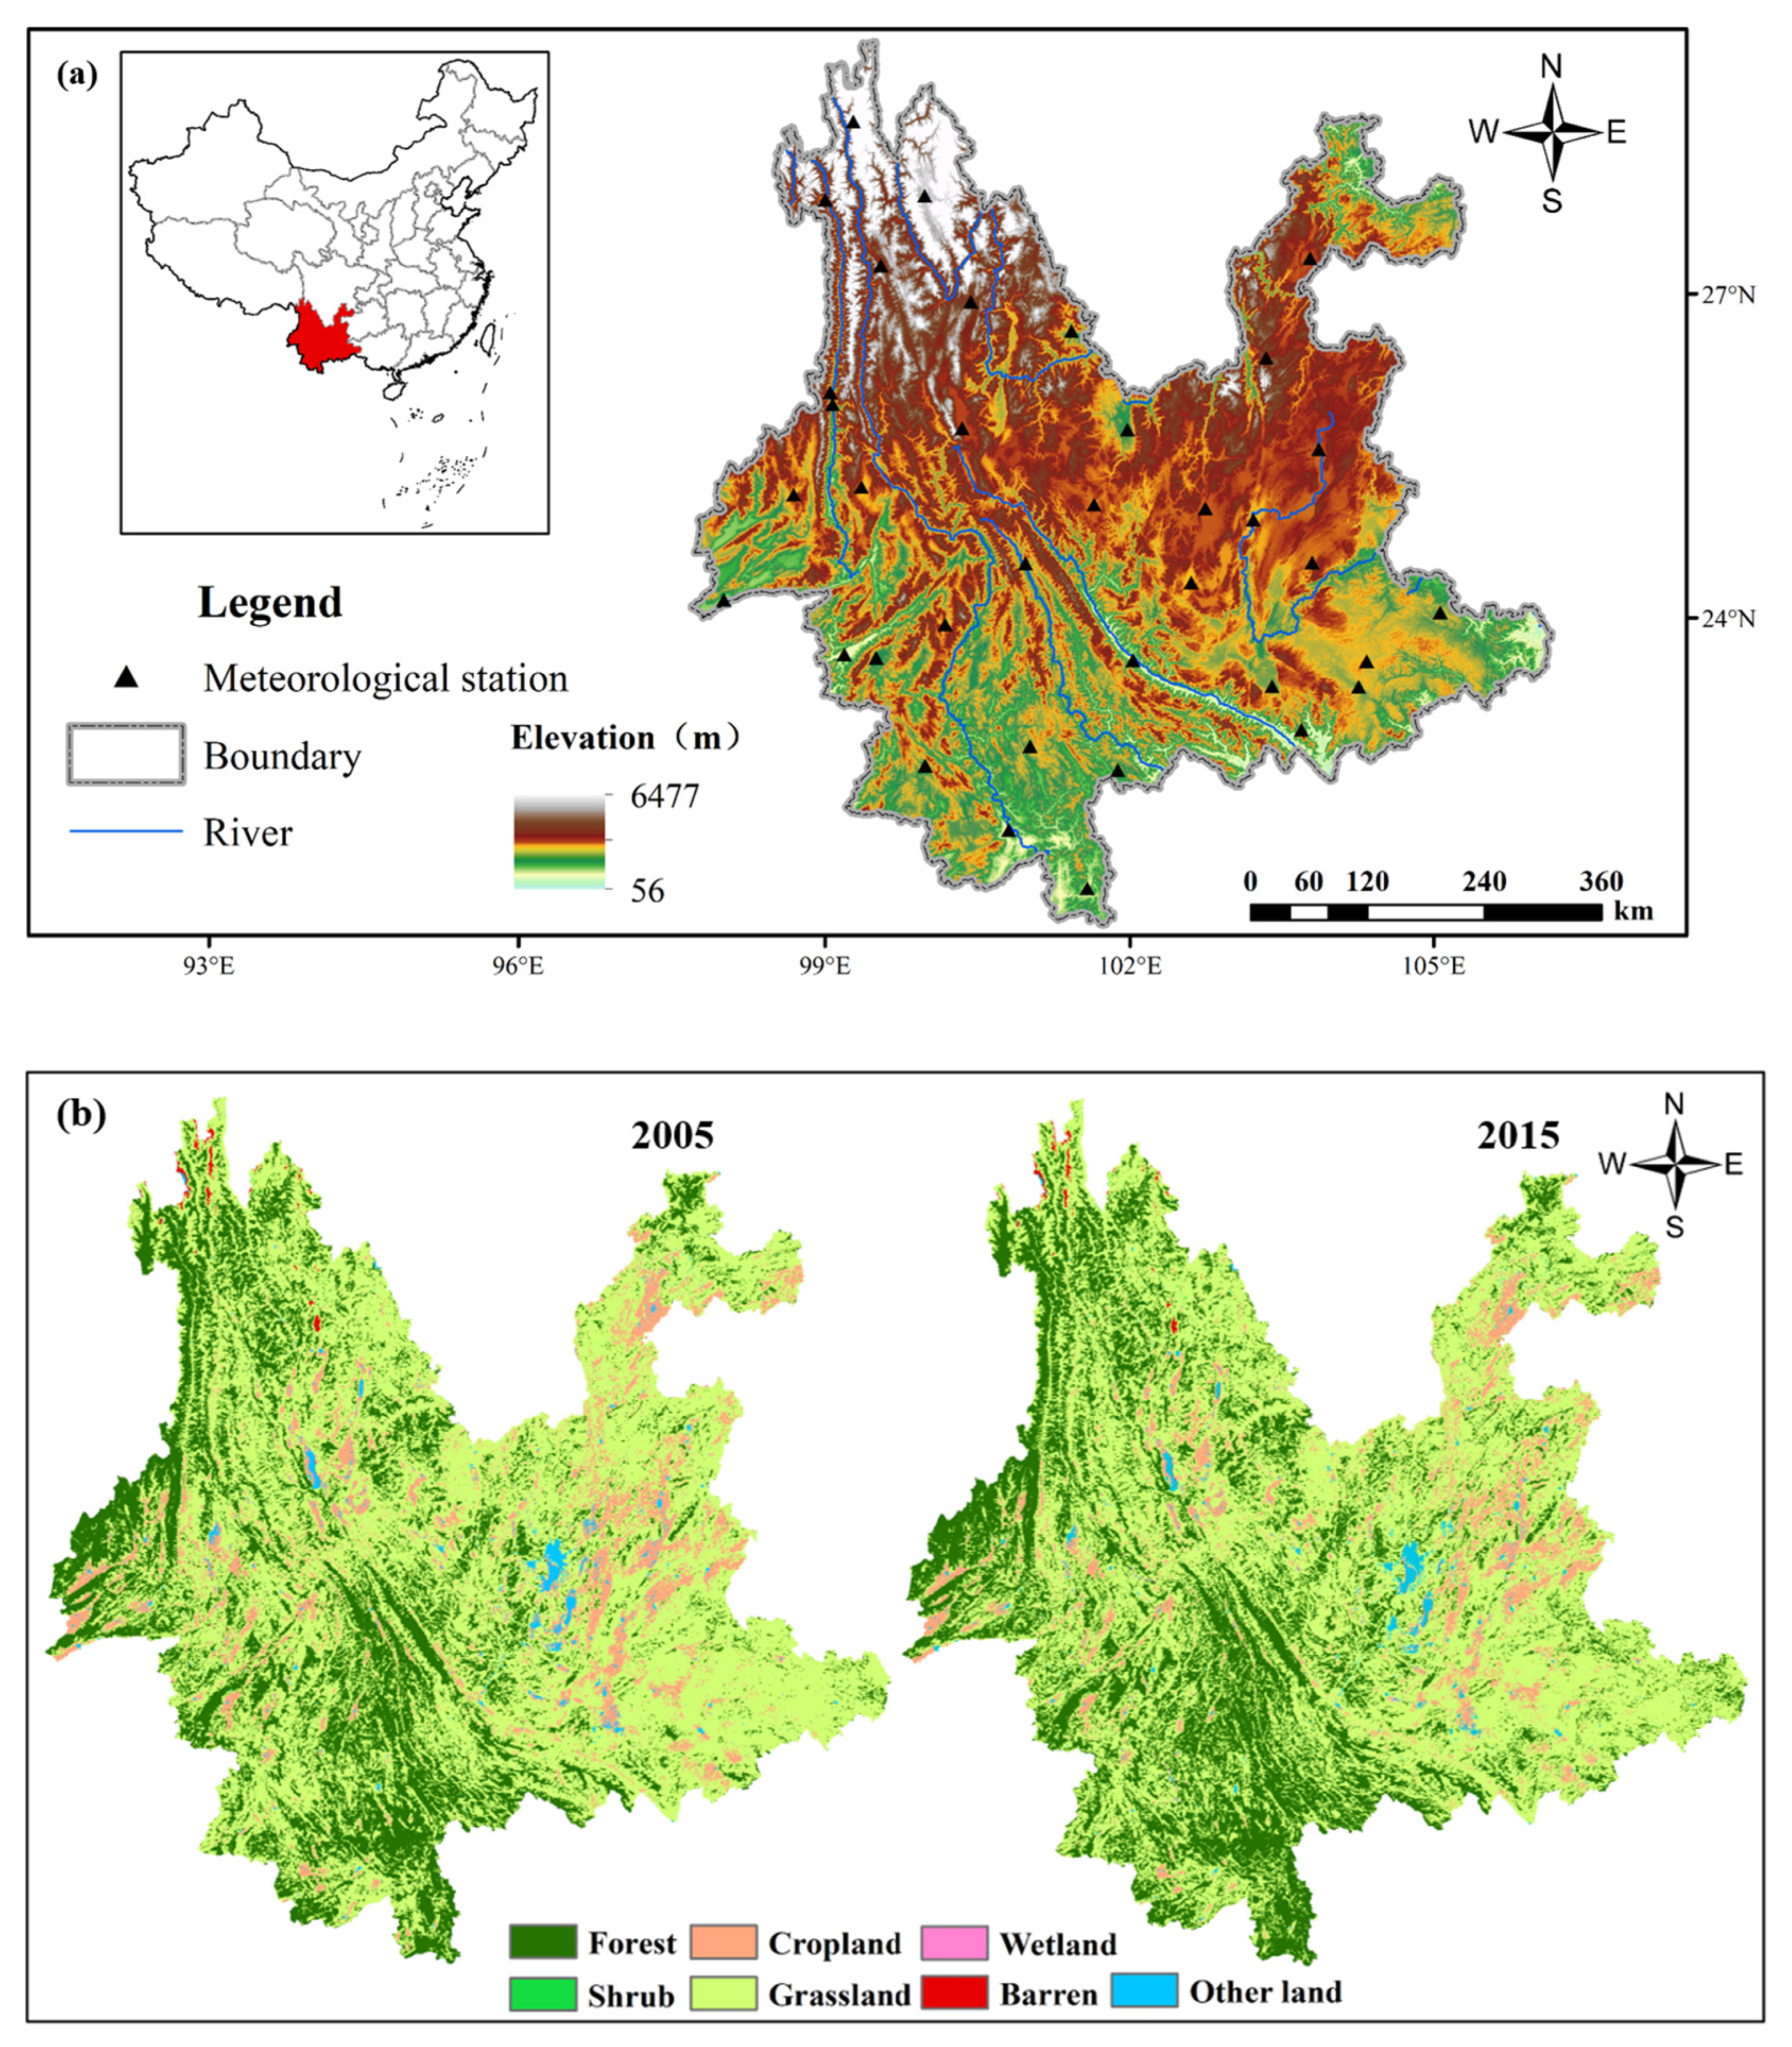
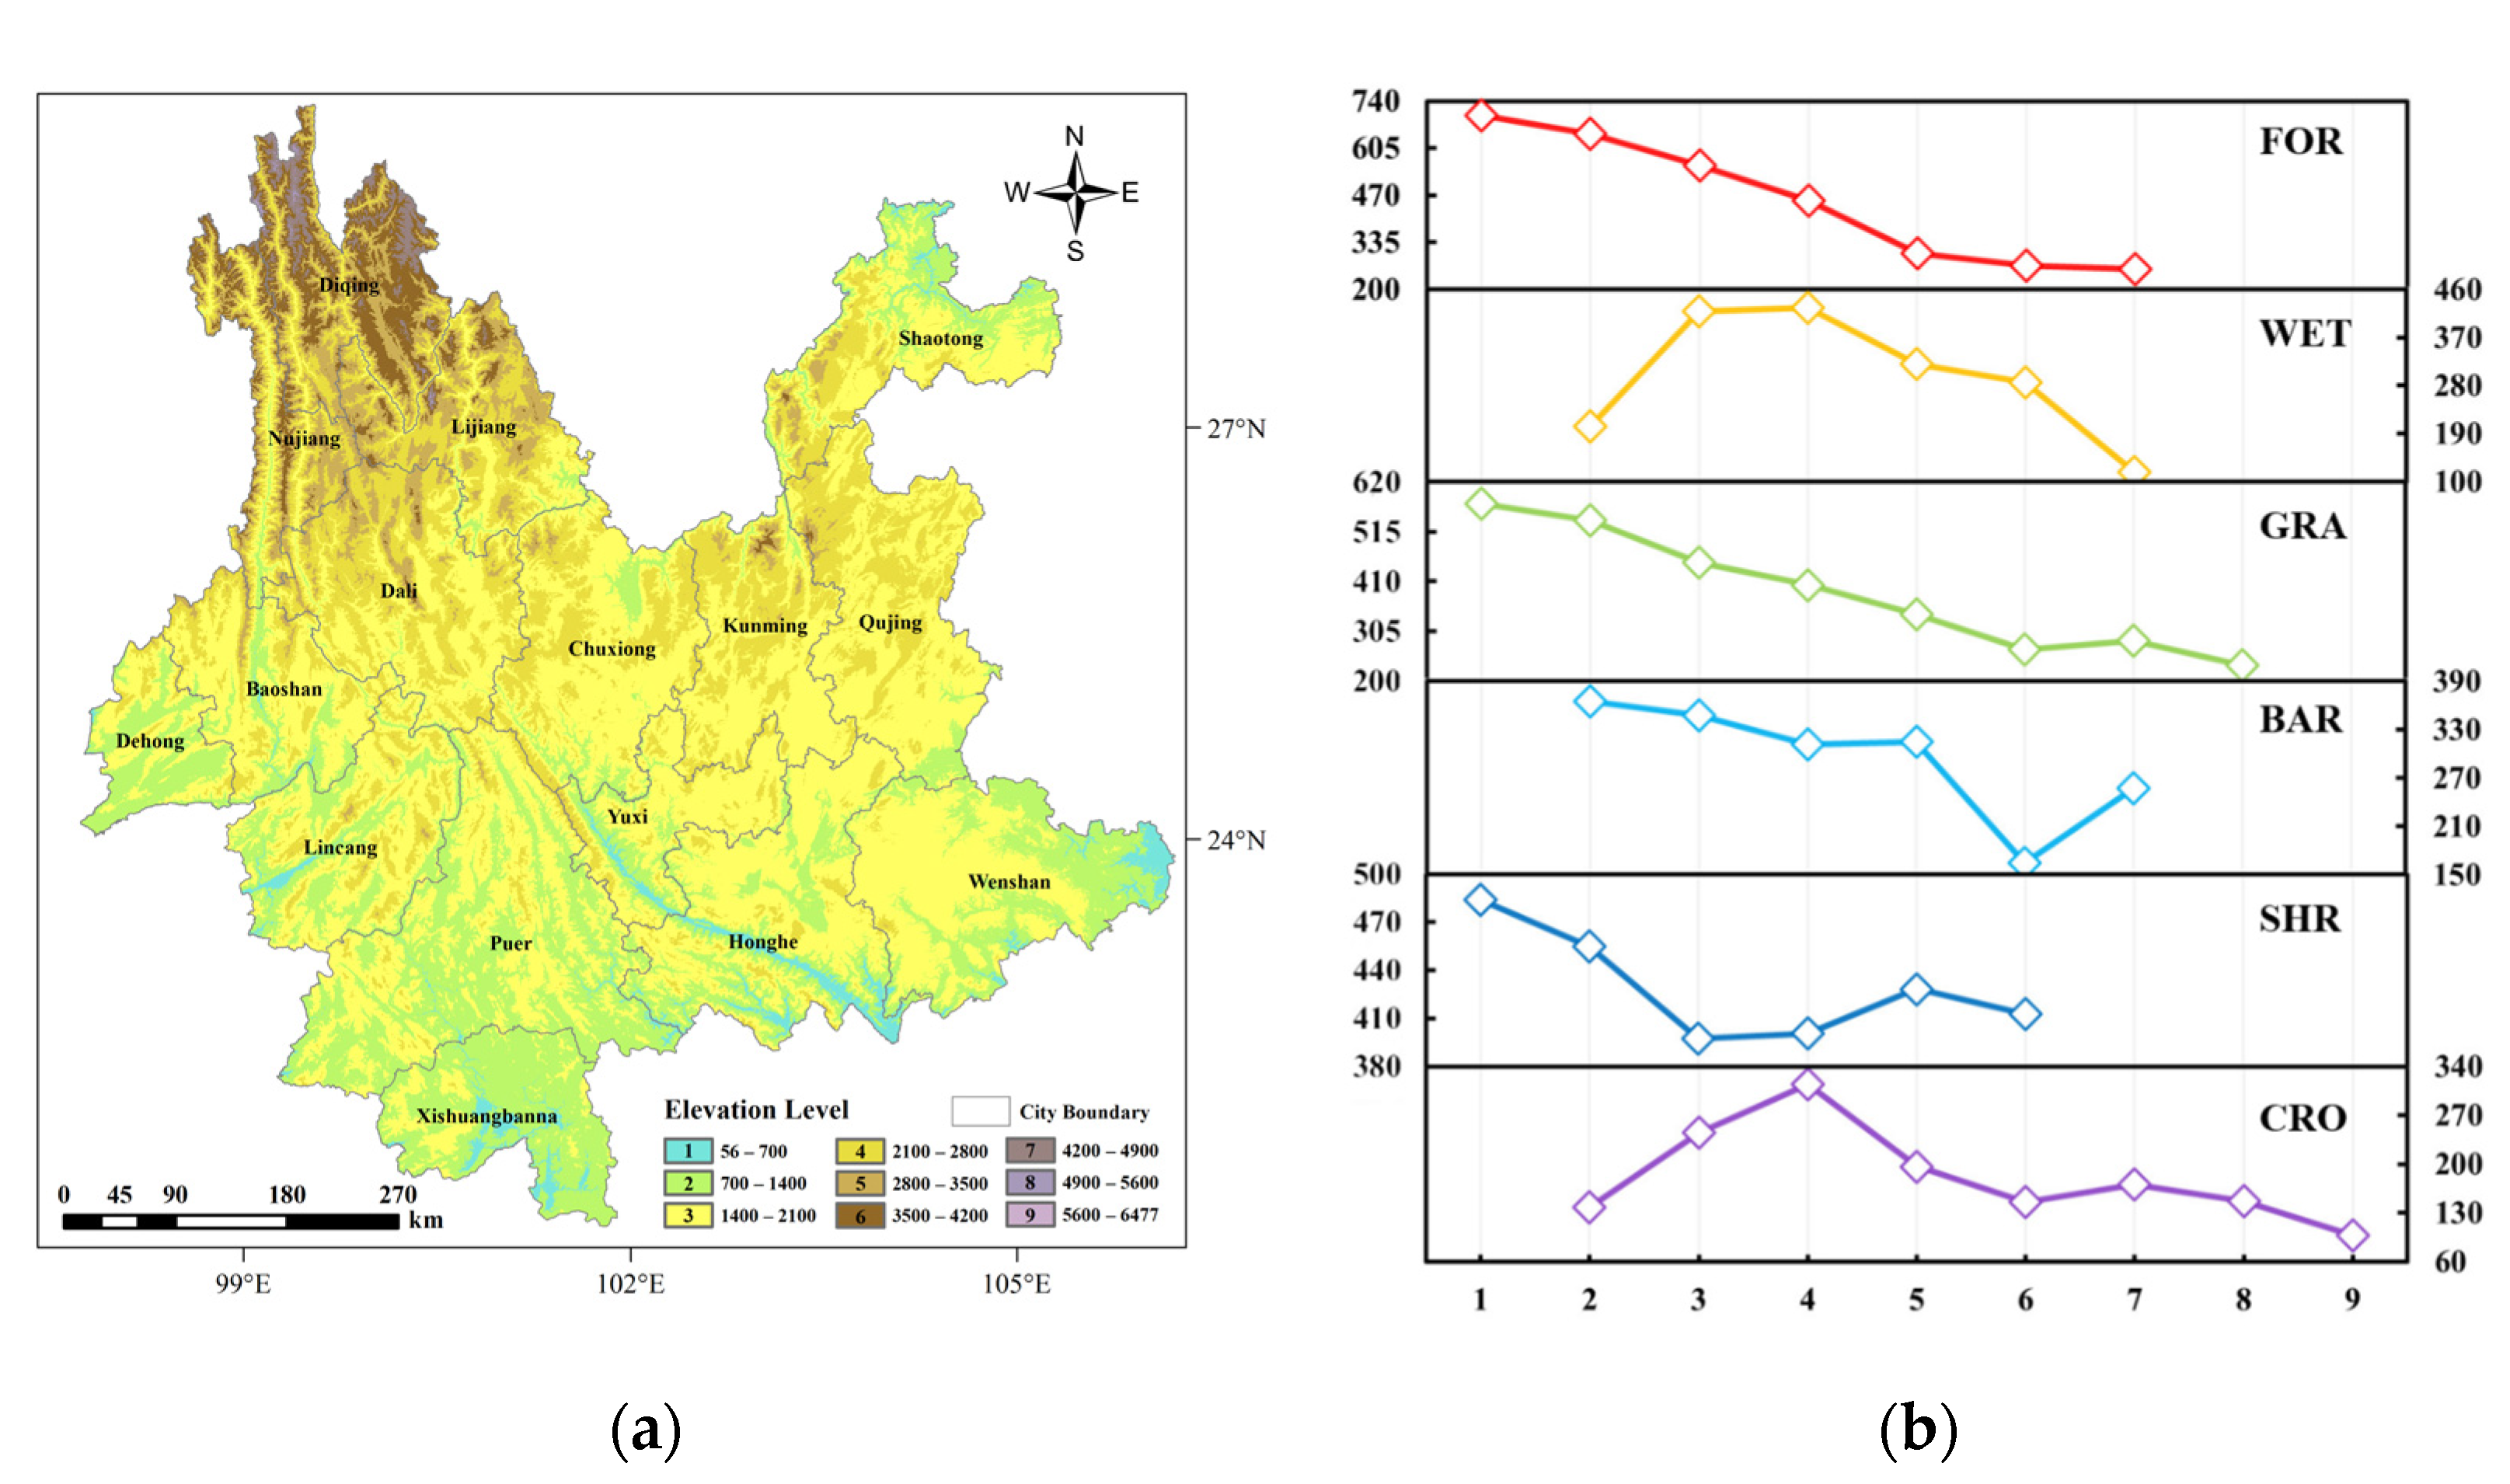
2.1. Study Area

The Yunnan Province, between latitude 21°8′–29°15′ N and longitude 97°31′–106°11′ E, is bordered by Guizhou and Guangxi in the east, Sichuan in the north, Tibet in the northwest, Myanmar in the west, and Laos and Vietnam in the south (Figure 1). The Yunnan Province is 56~6477 m above sea level, the terrain is high in the northwest and low in the southeast, declining step by step from north to south, and is a mountainous plateau terrain, with the mountainous area accounting for 88.64% of the total area of the province. The Yunnan Province is rich in land cover types, covering almost all of China’s land cover types, including a very vast area of grassland, which accounts for about 62.7% of the total area of the Yunnan Province, and the second largest area of forest, which accounts for about 27.8% of the total area of the Yunnan Province. The Yunnan climate basically belongs to the subtropical and tropical monsoon climate; northwestern Yunnan is a plateau mountainous climate. Across the Yangtze River, Pearl River, Yuanjiang River, Lancang River, Nujiang River, and Daying River are 6 major water systems. The average annual temperature is high in the southeast and low in the northwest, ranging from 0.6 °C to 26.6 °C, and the areas with greater precipitation are concentrated in the western and southeastern margins, ranging from 651.3 mm to 1695.2 mm, and the wet and dry seasons are distinct, with 85% of the total annual rainfall in the wet season (May–October, the rainy season), and 15% of the total annual rainfall in the dry season (November–April, the dry season). The average annual precipitation and average annual temperature varies widely from region to region.

2.2. Data Sources

2.2.1. ET Data

The MODIS-Terra ET product (MOD16A2.06) obtained from the U.S. Geological Survey (https://earthexplorer.usgs.gov/ (accessed on 9 April 2023)) as the ET data source for this study is an 8-day composite produced with a 500-m pixel resolution. The dataset includes total evapotranspiration (ET), potential evapotranspiration (PET), latent heat flux (LE), and potential latent heat flux (PLE). The evapotranspiration in the MOD16 model was estimated using the algorithm developed by Mu et al. [23] and subsequently improved by Mu et al. [24] The algorithm used for the MOD16 data product collection is based on the logic of the Penman–Monteith equation with input datasets including land cover type (MOD12Q1), FPAR/LAI (MOD15A2), surface albedo data (MCD43B2/MCD43B3), and daily meteorological datasets from MERRA GMAO. The MOD16 model is regarded as the base model for the MODIS evapotranspiration model, which pre-gives surface impedances based on the land cover type, and the magnitude of individual impedances is obtained through a semi-empirical relationship with the vegetation index.

2.2.2. Influencing Factors for Analysis Data

In this paper, a total of eight influencing factors, namely, TEMP, PRCP, RH, WDSP, SLME, NDVI, elevation, and slope, were selected to study the relationship between them and ET. Among them, the temperature, precipitation, air humidity, and wind speed data come from the National Earth System Science Data Center (http://www.geodata.cn/ (accessed on 14 April 2023)), which contains meteorological data with a spatial resolution of 1 km over the land area of China, and the data are obtained based on the reanalysis of meteorological data through spatial downscaling. The NDVI data were obtained from google (https://earthengine.google.com/ (accessed on 14 April 2023)), which was generated from the “MODIS/006/MOD09GA” surface reflectance composite with a spatial resolution of 463.313 m. The ASTER DEM data were obtained from NASA Earthdata (https://search.earthdata.nasa.gov/ (accessed on 15 April 2023)), which provides 30-m spatial resolution DEM data covering the global landmass, and the slope data were generated from the ASTER DEM data. Soil moisture was obtained from the NASA Earthdata (https://search.earthdata.nasa.gov/ (accessed on 15 April 2023)) Global Land Data Assimilation System (GLDAS) 2.1, which provides four soil moisture bands of 0–10 cm, 10–40 cm, 40–100 cm, and 100–200 cm, which were summed to obtain 0–2 m depth soil moisture data. The spatial resolution of the integrated soil moisture data at a depth of 2 metres is 27,830 m. Soil moisture data were interpolated to 500 m resolution by kriging, data for other impact factors were preprocessed by projection rastering and cropping, and the resolution of the impact factor data at 500 m resolution obtained from resampling was consistent with that of the ET data.

2.2.3. Land Cover Data

The land cover data are from NASA Earthdata (https://search.earthdata.nasa.gov/ (accessed on 15 April 2023)). The MCD12Q1V006 product has a spatial resolution of 500 m. The product provides global land cover types in six different classification schemes, the first of which uses the annual International Geosphere–Biosphere Program (IGBP). The first of these is an annual International Geosphere–Biosphere Program (IGBP) classification with 17 bands. We reclassified the Yunnan Province based on its land cover as a forest, shrub, grassland (including savanna: 10–30% tree cover (canopy > 2 m), woody savanna: 30–60% tree cover (canopy > 2 m), and grassland: predominantly annual herbaceous (<2 m)), wetland, agricultural land, bare land, urban and built-up land, water bodies, and snow and ice. Since the MOD16 ET product uses the leaf area index to indirectly reflect the soil moisture content and does not have data on water and the built-up area, six of the land cover types, namely, forests, shrubs, grasslands, wetlands, farmland, and bare land, were selected to analyze the spatiotemporal changes in ET and the contribution of the influencing factors in the Yunnan Province.

2.3. Methods

2.3.1. Trend Analysis

Theil-Sen [36,37] is a median-based nonparametric slope estimator for estimating time-series trends of variables in each pixel. The method reduces the effects of the measurement error and outliers by using the median as a function. The equations are as follows:
β = M e d i a n X j X i j i , i < j
where j and i are used as ordinal numbers of the years, and Xj and Xi represent the variable X’s values within individual pixels during years j and i, respectively. The parameter β signifies the trend of change, with β > 0 denoting an ascending trend and β < 0 indicating a descending trend.

2.3.2. Significance Test

The nonparametric Mann–Kendall [38,39] test was used to assess the significance of long-term trends in different variables. The method does not require the sequence data to follow a normal distribution or a linear trend and is not significantly affected by a few missing values or outliers. Henceforth, it is advocated and extensively employed by the World Meteorological Organization as a standard practice for assessing trends within hydrometeorological temporal data sequences [40,41].
For the time series X = {x1, x2, …, xn}, the test statistic S is defined as:
S = i = 1 n 1 j = i + 1 n s g n x j x i
where n is the length of the time series. The sign function sgn() is computed as:
θ = x j x i
s g n θ =   1 , θ > 0   0 , θ = 0 1 , θ < 0 .
If S is positive (or negative), it indicates a positive (or negative) trend in the time series. S = 0 indicates that there is no potential. When n ≥ 10, the significance of the trend can be tested by the following steps.
The variance of S is given by:
V a r S = n n 1 2 n + 5 / 18 .
Therefore, the standardized normality test statistic Z is calculated as:
Z = S 1 V a r S , S > 0   0 , S = 0 S + 1 V a r S , S < 0
α is defined as the significance test level, Z ( 1 α ) / 2 is defined as the standard normal variance, and Z > Z ( 1 α ) / 2 indicates a significant change in the increase or decrease of the time series. In this study, we set the significance level at α = 0.05.

2.3.3. Correlation Analysis

Pearson correlation coefficients (PCCs) were used to calculate correlation coefficients between ET and various meteorological factors and NDVI in each pixel. The formula is as follows:
R = i = 1 n x i x ¯ y i y ¯ i = 1 n x i x ¯ 2 i = 1 n y i y ¯ 2
where n is the length of the time series, i is the number of years, xi and yi are the values of the two factors x, y in year i, and x, y are the n-year averages of the two factors.

2.3.4. Ridge Regression

A common problem in the practice of a regression analysis is multicollinearity. It has a significant negative impact on the least squares estimator. A number of shrinkage estimators have been developed to correct for this problem, prominently among which is the ridge regression model proposed by Hoerl and Kennard [42]. It essentially penalizes the least squares loss by applying a ridge penalty to the regression coefficients. While ridge regression may lead to a reduction in fitting precision, it concurrently yields regression coefficients of greater realism and reliability, accompanied by diminished mean square errors. The least squares estimation for the model is expressed as follows:
β ^ k = X X + k I p 1 X y
where X = X 1 , , X n and k denotes the ridge coefficient, which is determined from the ridge trace plot. When the trajectories of all regression coefficients in the ridge trace plot tend to be stable, the smallest k is chosen as the ridge coefficient. When multicollinearity exists, that is, two or more covariates in the model are highly correlated, X X does not exist, so a constant matrix k I p k 0 is added to significantly reduce the likelihood of X X + k I p singularity.
The ridge regression equation is as follows:
y i = β ^ 0 + β ^ 1 x 1 + β ^ 2 x 2 + + β ^ k x k .
If we normalize yi and xi, z y = y i y ¯ σ ^ y , z x j = x i j x ¯ j σ ^ j .
The normalized equation is shown below:
z ^ y = b ^ 1 z x 1 + b ^ 2 z x 2 + + b ^ k z x k .
b ^ k denotes the degree of influence of each factor on ET; if b ^ k   > 0, it means that the factor has a positive effect on ET, and if b ^ k   < 0, it means that the factor has a negative effect on ET.
The relative contribution of each influencing factor to ET is calculated from Equation (11).
C p = b ^ p b ^ 1 + b ^ 2 + + b ^ k
where C p is the relative contribution of an influencing factor to ET and b ^ p is the regression coefficient for each influencing factor in the standardized equation.

3. Results

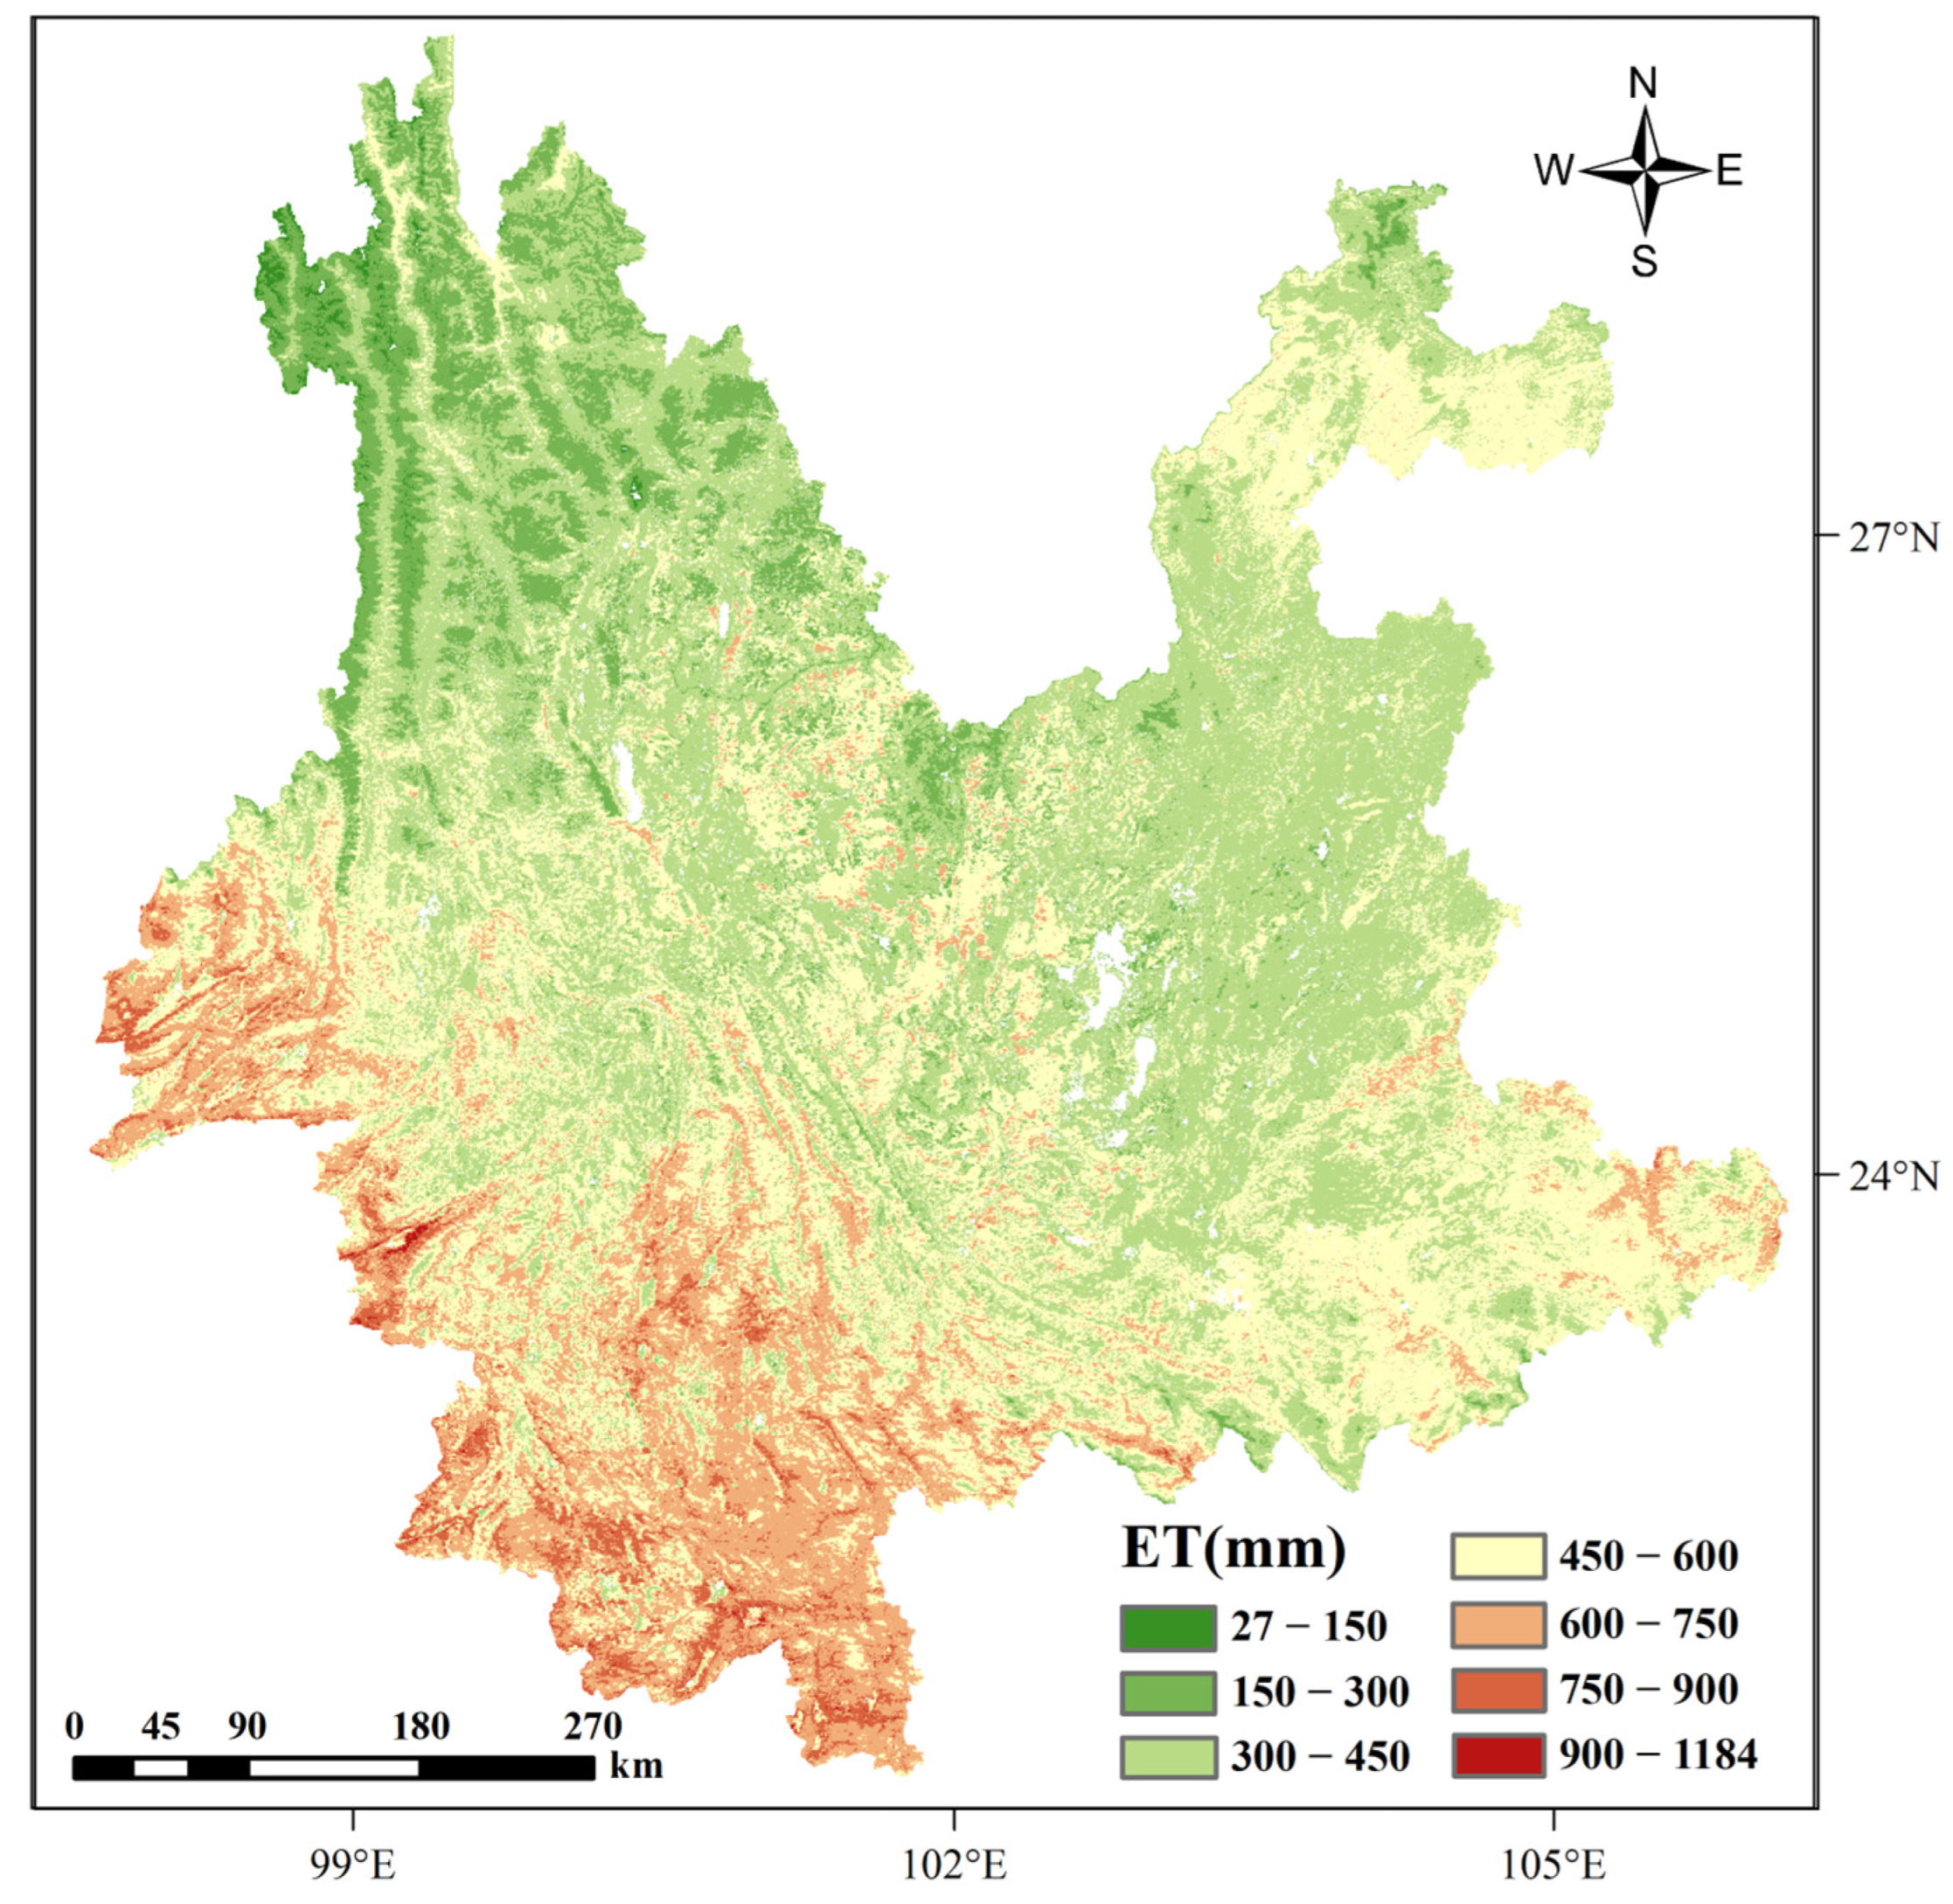
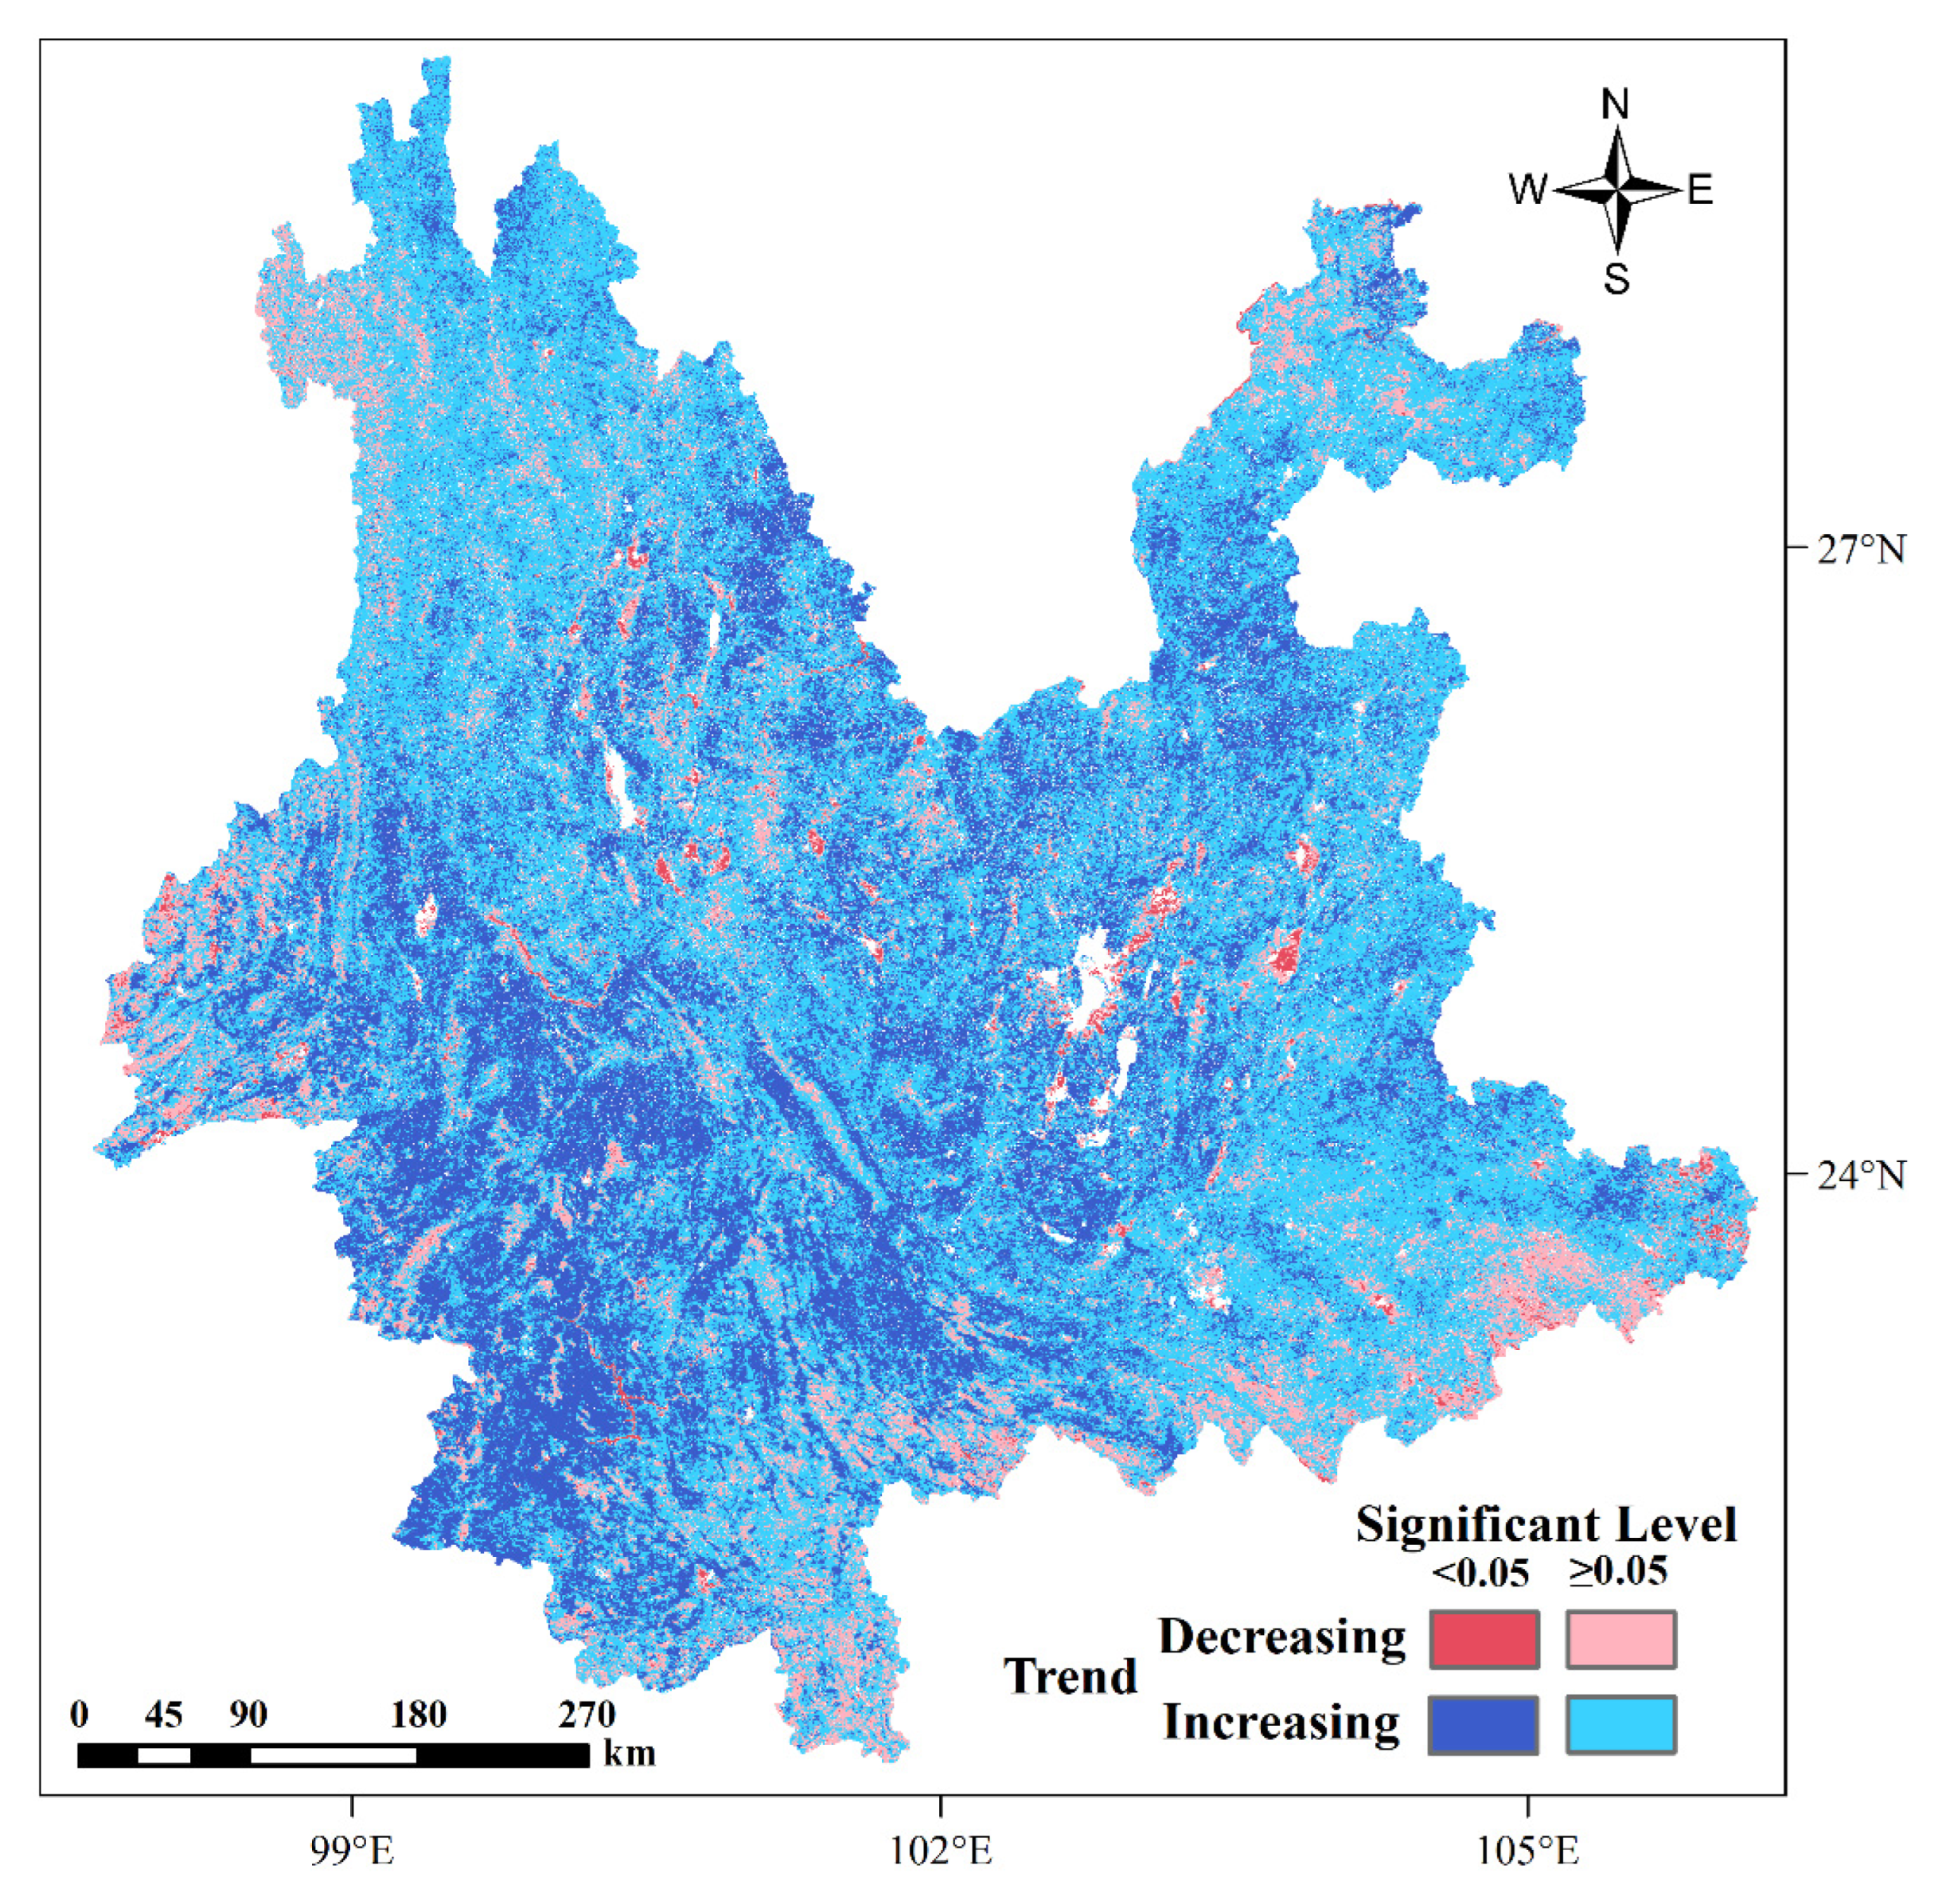
3.1. Temporal and Spatial Change of ET in Yunnan Province

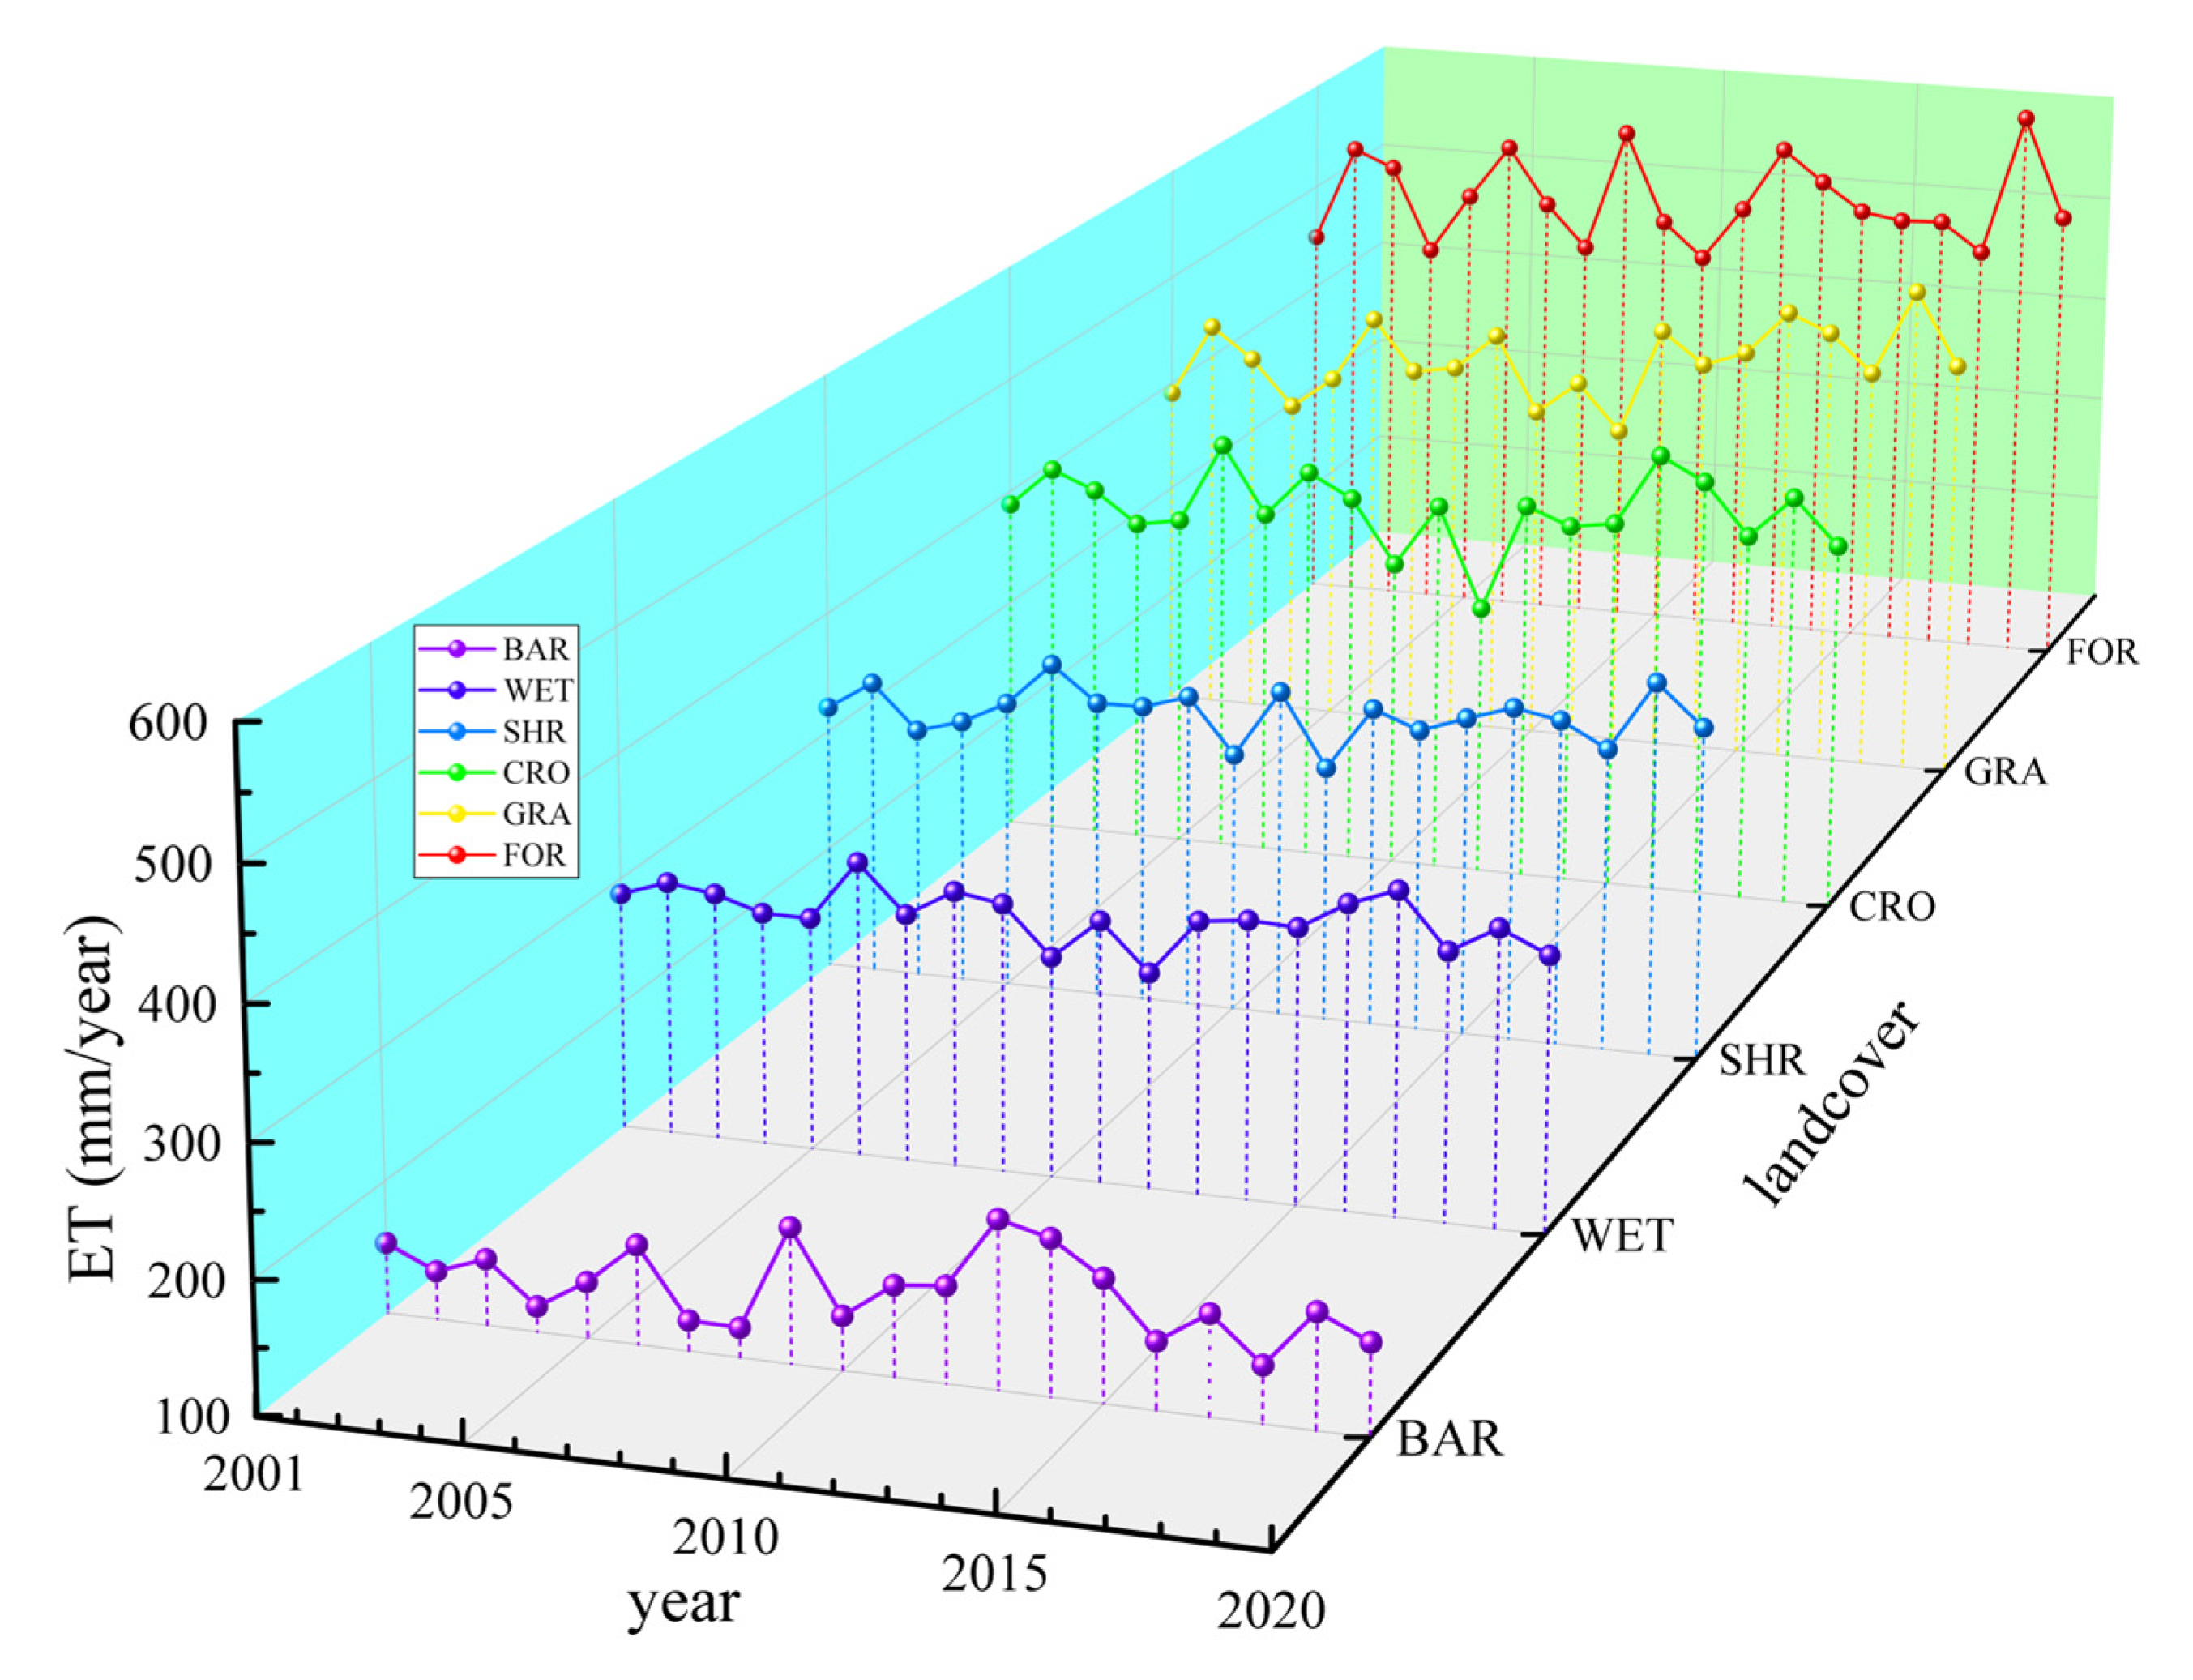
3.1.1. Interannual Change Feature

Figure 2 shows the spatial distribution characteristics of the average ET in the Yunnan Province for the 20 years from 2001 to 2020. From the figure, it can be seen that the ET distribution in the Yunnan Province is low in the northwest and high in the southwest, and overall, high in the south and low in the north. The maximum value of ET is 1184 mm, which occurs in the southwest of the Yunnan Province, and the minimum value is 27 mm, which occurs in the northwest of the Yunnan Province, and the average value is 463 mm, which is mainly distributed in the northeast, southeast, and central parts of the Yunnan Province. The ET values in the range of 300–450 mm account for the largest proportion of 39.78%, in which it was distributed in all areas except the southwestern part.
In order to study the temporal change characteristics of ET under different land cover types, we used the annual average ET data and land cover type data in the Yunnan Province from 2001 to 2020 to obtain the annual average ET trends of six land cover types, namely the barren (BAR), wetland (WET), shrub (SHR), cropland (CRO), grassland (GRA), and forest (FOR) (Figure 3). As shown in the figure, forest had the highest annual mean ET of 513.96 mm over the 20 years, followed by the grassland (451.05 mm), cropland (415.76 mm), shrub (350.64 mm), wetland (309.19 mm), and barren (163.69 mm). The trend of the annual mean ET for different land cover types showed increasing trends to varying degrees, with a small peak in 2006 and a short surge in 2019. Of the six land cover types, agricultural land had the smallest increasing trend of 2.1 mm/year and grassland had the largest increasing trend of 4.7 mm/year.
The trend of sen slope and mk significance test for the Yunnan Province from 2001 to 2020 are shown in Figure 4. Among them, the areas with a growth trend accounted for 85.15% of the total area of the Yunnan Province, and after the mk significance test, it was found that 35.12% of the areas with a growth trend passed the significance test (p < 0.05). The areas with decreasing trends accounted for 14.85% of the total area of the Yunnan Province, of which only 6.9% passed the significance test (p < 0.05). As a whole, 30.04% of the districts showed a significant increase, which was concentrated in the south–west and central regions. Only 1% of the districts showed a significant decrease, with the significant decreases concentrated in the central region and the peripheral regions for which no data are available. This may be mainly due to the expansion of urbanization.

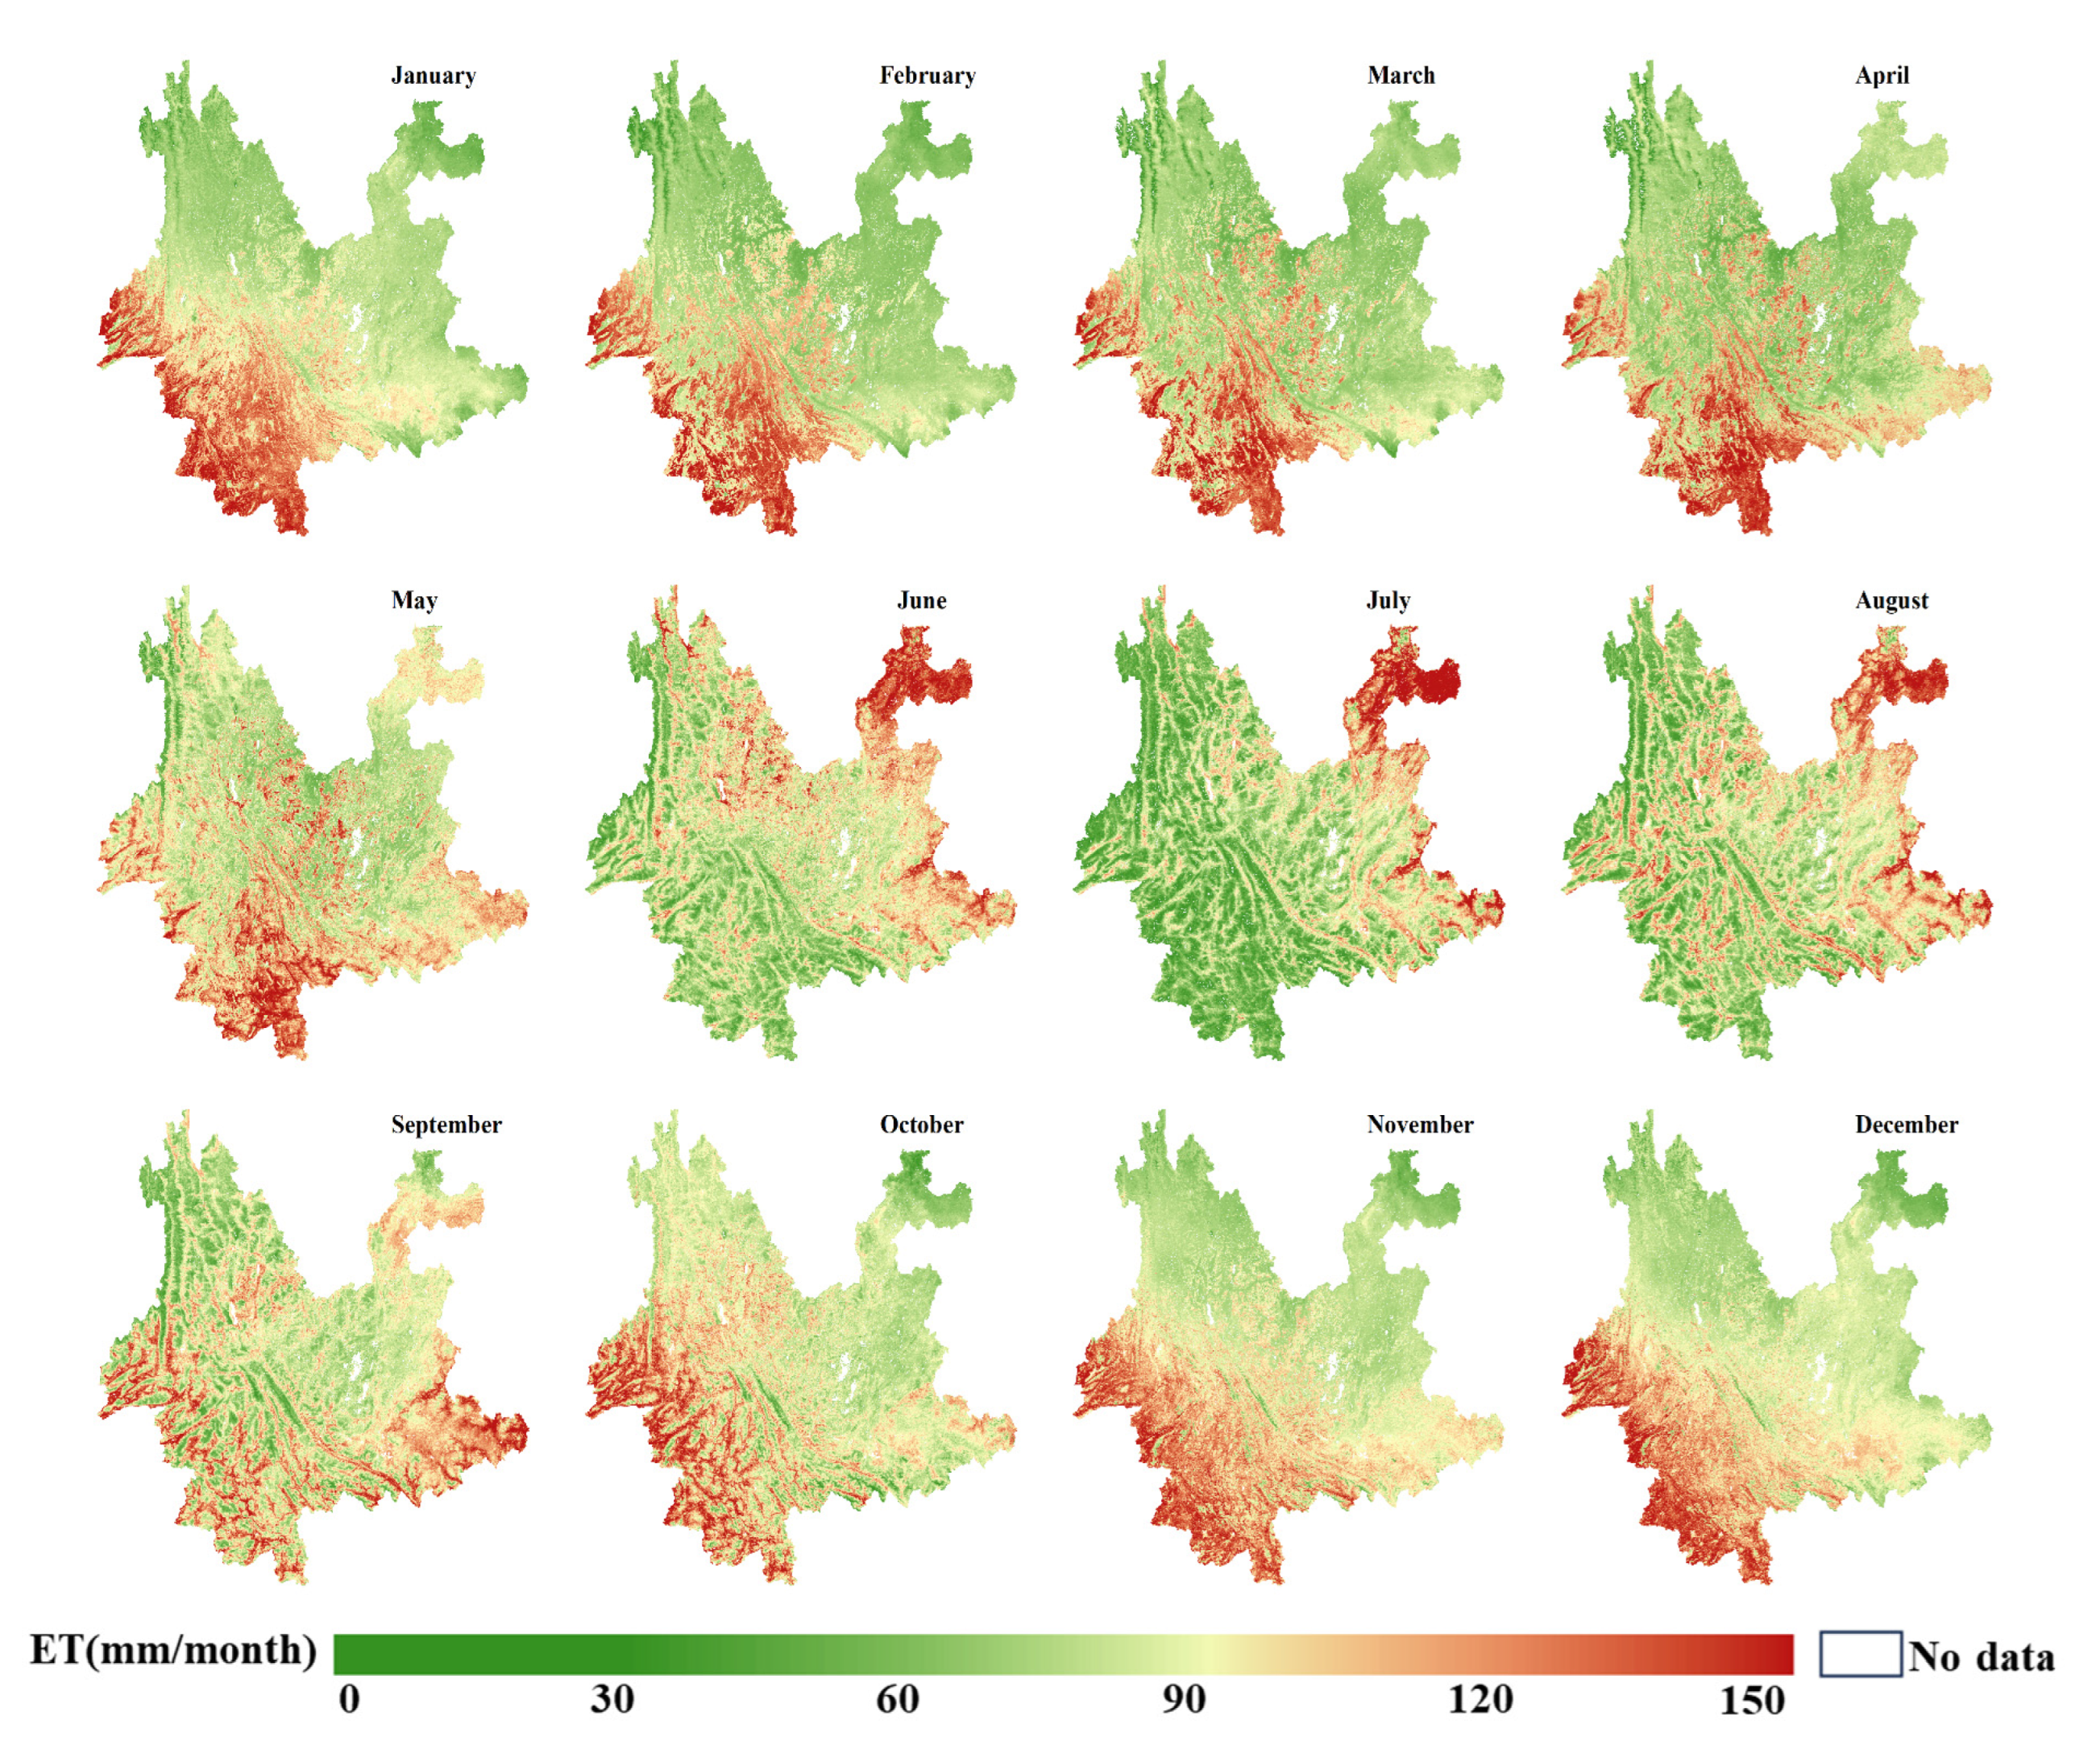
3.1.2. Monthly Change Characteristics

In order to make the change law of the monthly average ET in the Yunnan Province more intuitive, the monthly ET distribution in the Yunnan Province was characterized as shown in Figure 5. From the spatial distribution of ET in January–May and September–December, ET gradually decreases from southwest to northeast, while in the three months of June–August, it shows a significantly opposite spatial distribution, which is also contrary to the spatial distribution of the yearly average ET, which is most likely related to the rainy season in the Yunnan Province during the months of May–September, where appropriate precipitation promotes an increase in ET, and excessive precipitation inhibits ET instead. The spatial distribution of the Yunnan Province was highly variable from January to December, and the spatial variation of ET reached a maximum of 152.01 mm in March, while the spatial variation of ET was the smallest in June, but still reached 103.79 mm. All twelve-monthly mean ET maxima remained above 100 mm, with significant surface heterogeneity.

3.2. Correlation Analysis of ET Impact Factors

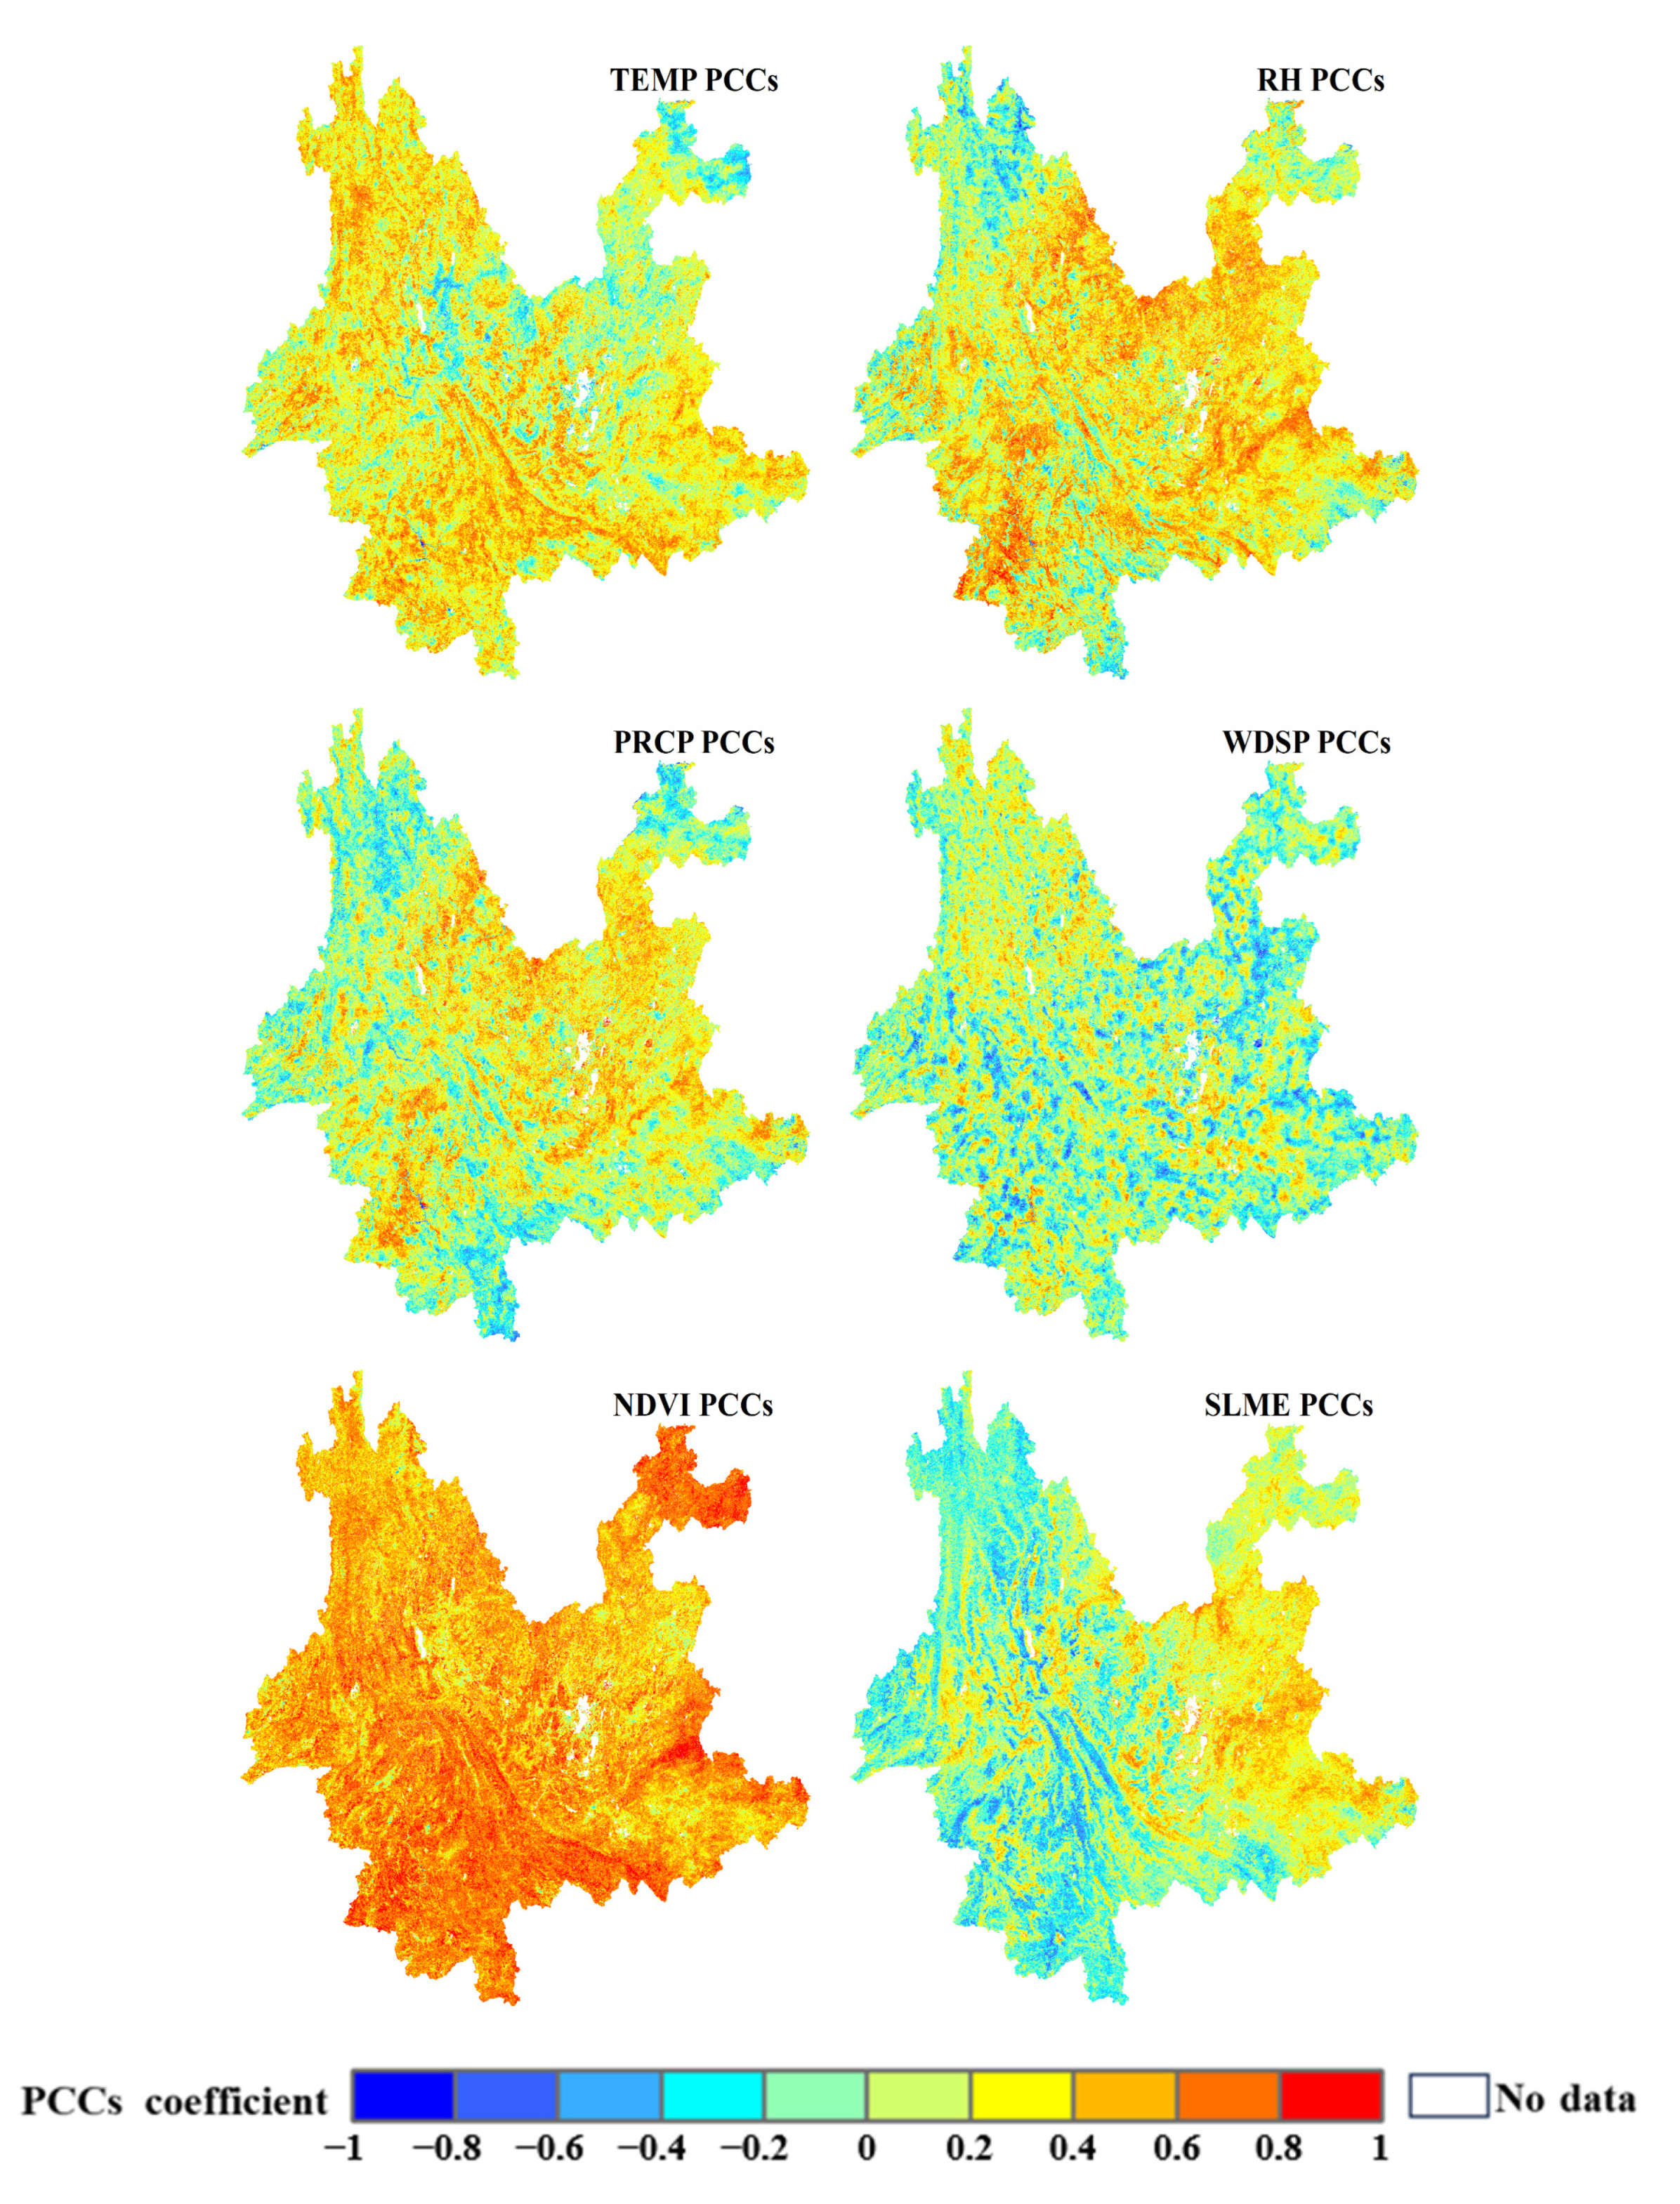
3.2.1. Influence of Climate and Vegetation Factors on ET

Meteorological factors influence ecosystem cycles and flows, and even more so, the three conditions of ET: water conditions, energy conditions, and dynamic conditions. In order to investigate the effects of four meteorological factors: precipitation, wind speed, air temperature, and relative humidity, on ET, correlation analyses were carried out to control for the joint effects of the factors. Seasonal changes in the vegetation canopy alter surface albedo and aerodynamic roughness. Transpiration from plant leaf stomata and evaporation from precipitation trapped by vegetation over large areas play a particularly important role in the water and energy cycle [43,44]. Suzuki & Masuda found and investigated the interannual covariance between continental-scale land surface NDVI and ET from 1982 to 2000. The results indicate that vegetation is the main factor controlling the inter-annual variability of evapotranspiration [45]. Thus, inter-annual or “long-term” changes in vegetation may bring about changes in cycling processes in the atmosphere and hydrosphere through a number of processes. ET can be divided into soil moisture evaporation and groundwater evaporation from evaporating water sources. A portion of the water in the soil evaporates directly in the soil, and the other portion is transpired by the vegetation into the surface and atmosphere. This means that the water content of the soil from 0 to 2 m depth directly affects the evaporation of the soil moisture.
As shown in Figure 6, in general, the correlation between air temperature and ET showed a positive correlation (79.74%) in the vast majority of image elements, and a significant positive correlation (PCCs > 0.6) was observed in some low-lying areas in the southern part of the Yunnan Province and higher areas in the northwestern part of the Yunnan Province, and the percentage of significant positive correlation areas was 6.00%, which indicated that the air temperature had a significant effect on the spatial distribution of ET. The correlation between RH and ET showed a positive correlation (76.60%) in most image elements, with a significant positive correlation in the southwestern and southeastern Yunnan Province (PCCs > 0.6). The correlation between precipitation and ET showed a positive correlation (65.51%) in most of the image elements, and the negative correlation was mainly concentrated in the northeastern, northwestern, and southern parts of the Yunnan Province. Wind speed decreased ET in most of the areas (50.86%), and the negative correlation areas were irregularly distributed in a point-like pattern, and the sum of the percentage of the significant negative correlation (PCCs < −0.6) and significant positive correlation (PCCs > 0.6) was 2.5%, which indicated that the correlation between wind speed and ET was not significant. During the period 2001–2020, the correlation between ET and NDVI was positive in the vast majority of the study area, with only 2.43% of image elements showing a negative correlation, and 37.16% of image elements showing a significant positive correlation (PCCs > 0.6). The correlation between soil moisture and ET was predominantly positive (54.73%), with severe regional differentiation, with a positive correlation in the east and a negative correlation in most of the west.

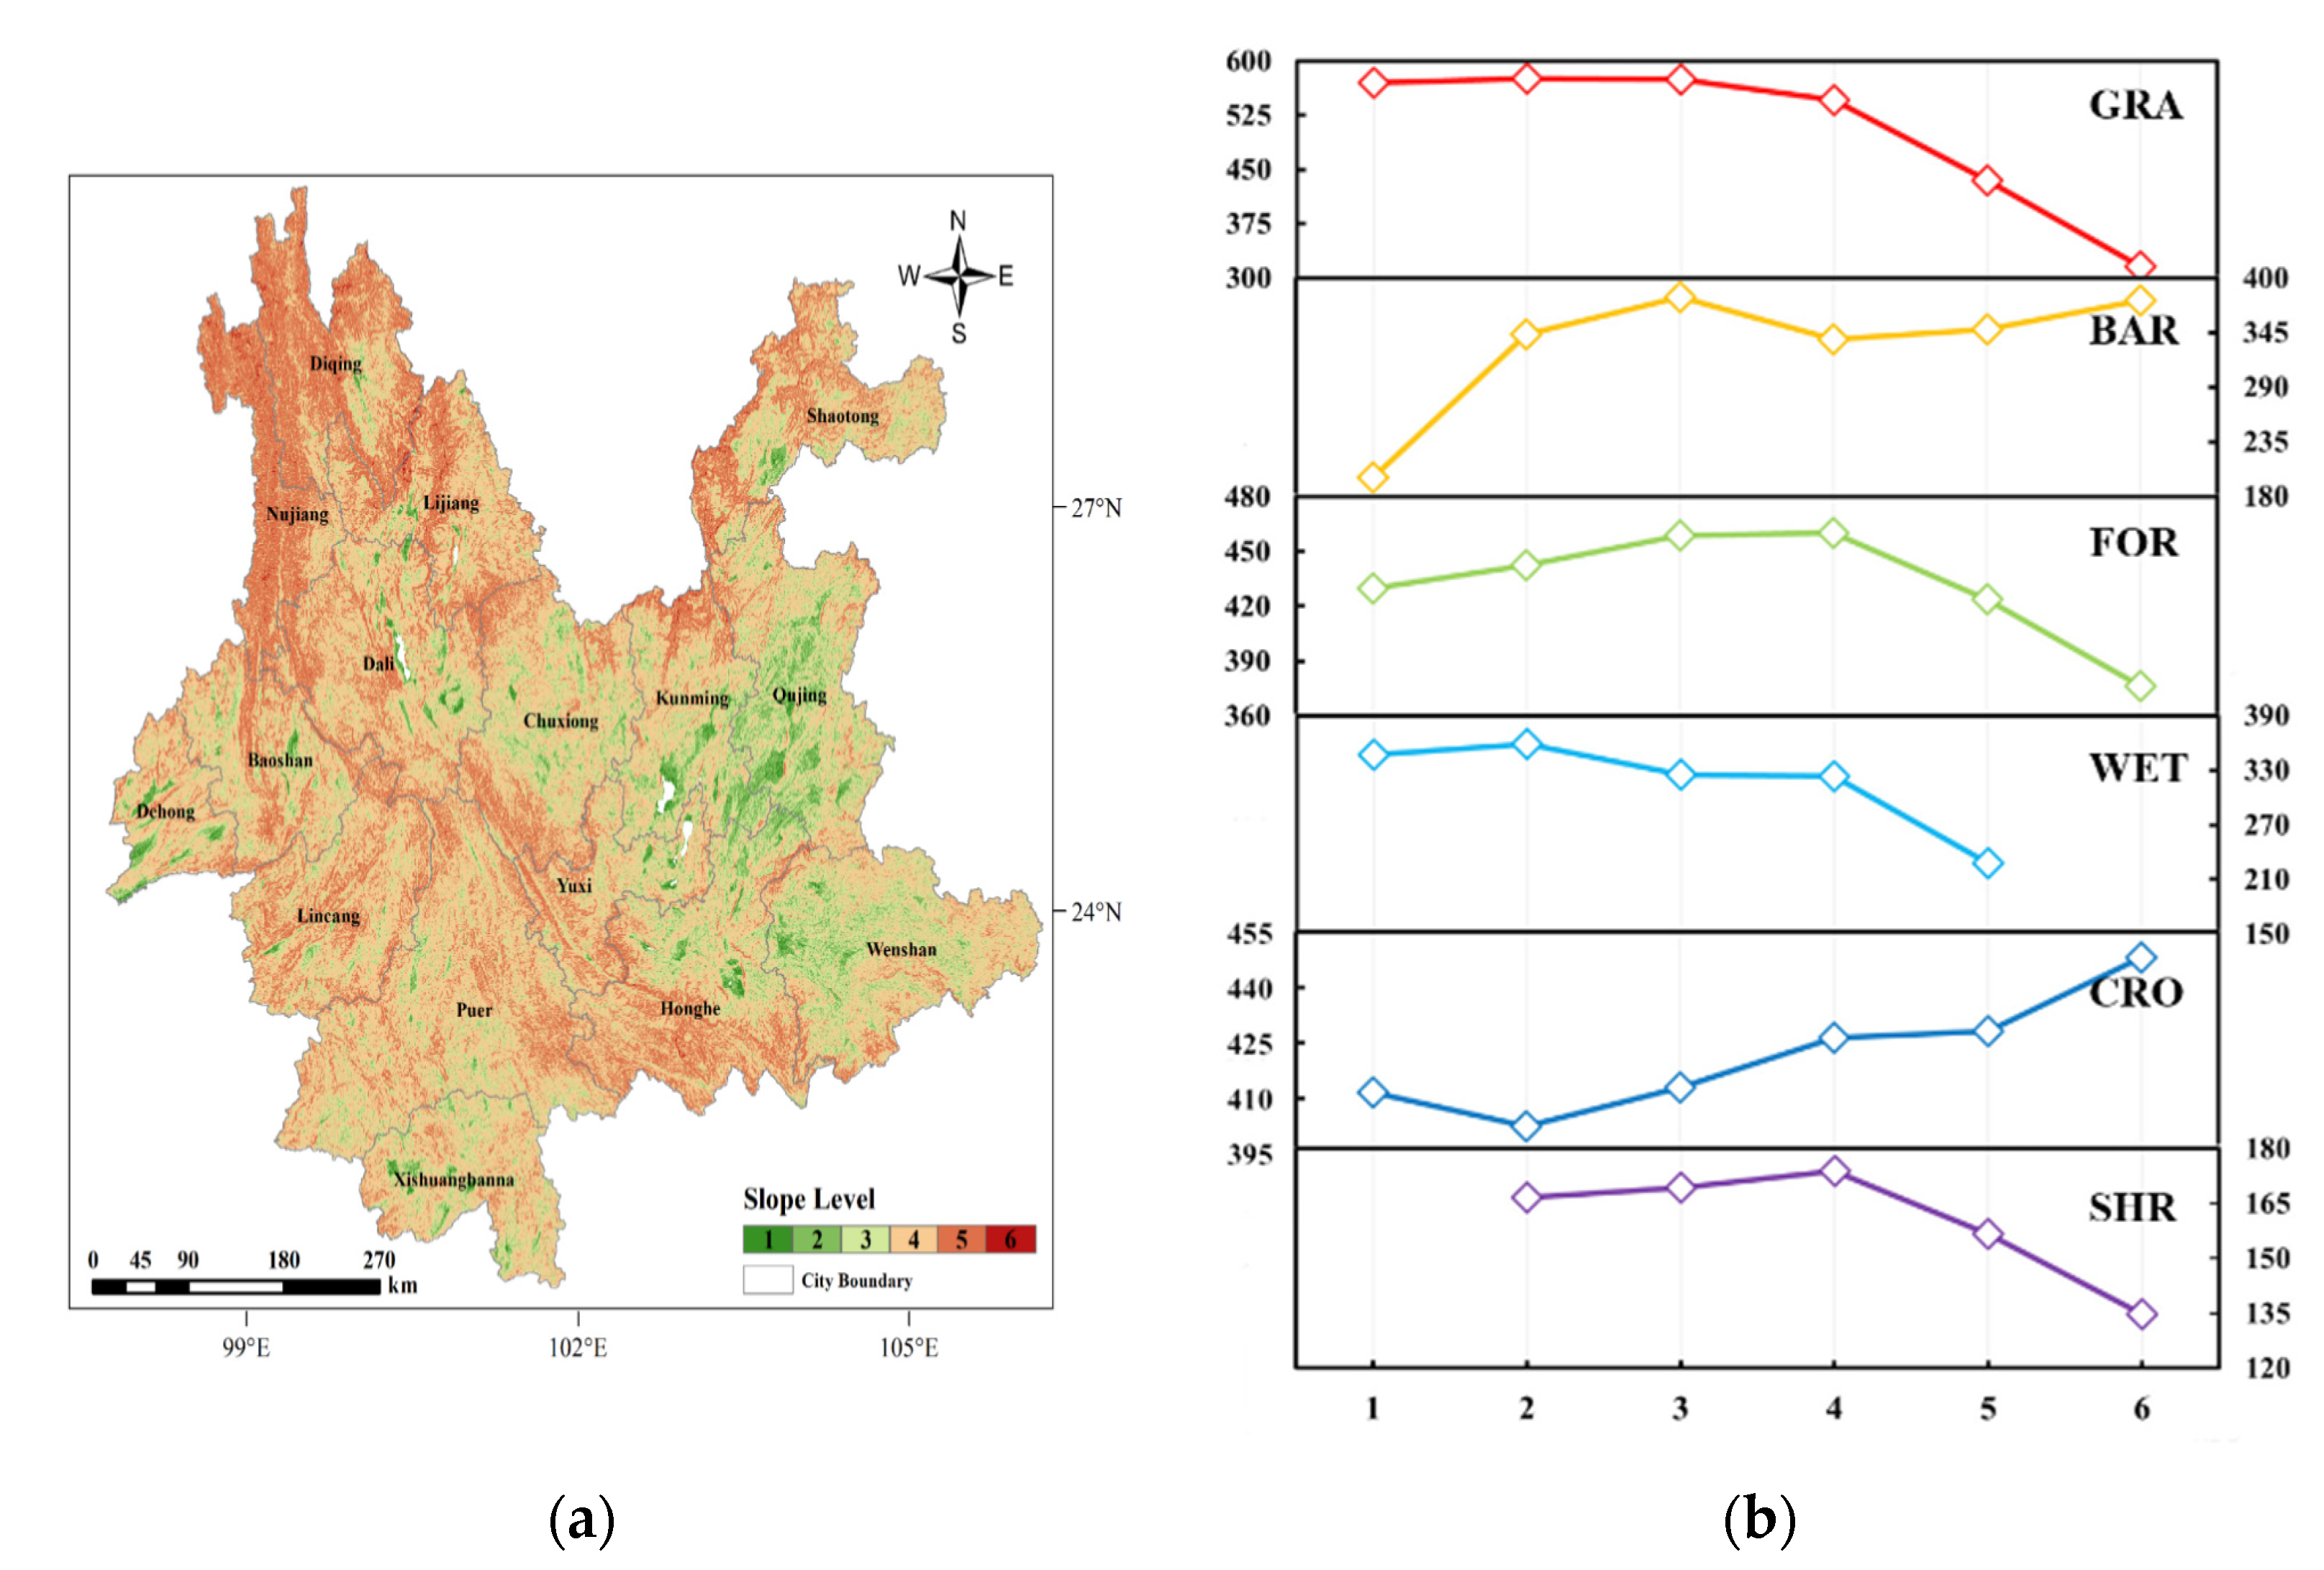
3.2.2. Correlation with Topography Factors

Elevation and slope are basic topographic features, and complex topography has important impacts on climate change, vegetation cover, soil moisture, and surface runoff, and their changes alter regional atmospheric circulation patterns, which in turn alter the distribution of ET and its dynamical mechanisms [46]. Overall, topography influences the spatiotemporal distribution of evapotranspiration in watersheds, regions, and countries [47,48]. The ASTER DEM data of the Yunnan Province are shown in Figure 7a, which is categorized into nine classes based on its spatial distribution characteristics at 700 m intervals (56–700 m, 700–1400 m, 1400–2100 m, 2100–2800 m, 2800–3500 m, 3500–4200 m, 4200–4900 m, 4900–6477 m). Elevation in the Yunnan Province is generally high in the northwest and low in the southeast, and the overall distribution characteristics are similar to those of ET spatial distribution. Among them, the area with an elevation of 1400–2100 m accounts for the largest proportion of 43.6%, and there is a certain distribution in all cities in the Yunnan Province, with a wide geographical distribution. This is followed by elevation in the area of 700–1400 m with 23.47% ranking second. The average ET of each land cover type under different elevation classes was obtained by analyzing the spatial overlay of ET, land cover type, and elevation data. As shown in Figure 7b, in the forest, grassland, and bare ground areas, the values of ET decreased continuously with increasing elevation, and the decreasing trend was essentially linear. In the wetland and farmland areas, ET increases to a certain extent in the range of 700 m to 2800 m, and then begins to decrease linearly, which may be related to the higher temperatures in the lower regions of the terrain. Wetlands and agricultural fields contain more standing water, have higher soil moisture content, and warm conditions favor the evaporation of soil moisture. The ET of shrubs showed a decreasing and then steady trend with increasing elevation, which indicated that the ET of shrubs was not sensitive to high elevation.
Based on the ASTER DEM data, the slope distribution of the Yunnan Province was mapped (Figure 8). According to the International Geographical Union (IGU) terrain slope classification standard, the slopes of the Yunnan Province were categorized into six categories (0–0.5°, 0.5–2°, 2–5°, 5–15°, 15–35°, and 35–55°). The average ET of each land cover type at different elevation classes was obtained by analyzing the spatial superposition of ET, land cover type, and slope data. The ET of agricultural land and bare land increased with slope. Grassland and wetland ET decreased with an increasing slope, differing in that wetland ET tended to decrease slowly while grassland ET decreased rapidly at higher slopes. Forest and shrub ET showed an increasing and then decreasing trend with an increasing slope, which may be related to the reduced ability of vegetation in areas of high root growth to absorb soil moisture from surrounding areas on steep slopes. In general, with the exception of bare land where surface runoff is sparse and agricultural land where terracing is the dominant cropping method, steep slopes tend to cause a decline in soil evaporation and vegetation transpiration by altering surface runoff, which in turn leads to a decline in ET.

3.3. The Relative Contribution Rate of Influencing Factors to ET

Because there are serious cases of multicollinearity among the eight influencing factors, namely, TEMP, PRCP, SLME, RH, NDVI, WDSP, elevation, and slope, the ridge regression model (RRM) is used to cut down the multicollinearity among the influencing factors, and to obtain more realistic and reliable regression coefficients, at the cost of losing part of the information and lowering the accuracy to a certain extent [49]. The dataset for the ridge regression was obtained from the eight influence factors (xi) of TEMP (°C), PRCP (mm), SLME (mm), RH (%), NDVI, WDSP (m/s), elevation, and slope and the corresponding ET values (yi), and the spatially-balanced sampling was used to obtain the sample points to construct the training sample set (xi, yi), and to use ridge regression modeling to quantitatively analyze the relative contribution of the influence factors to ET.

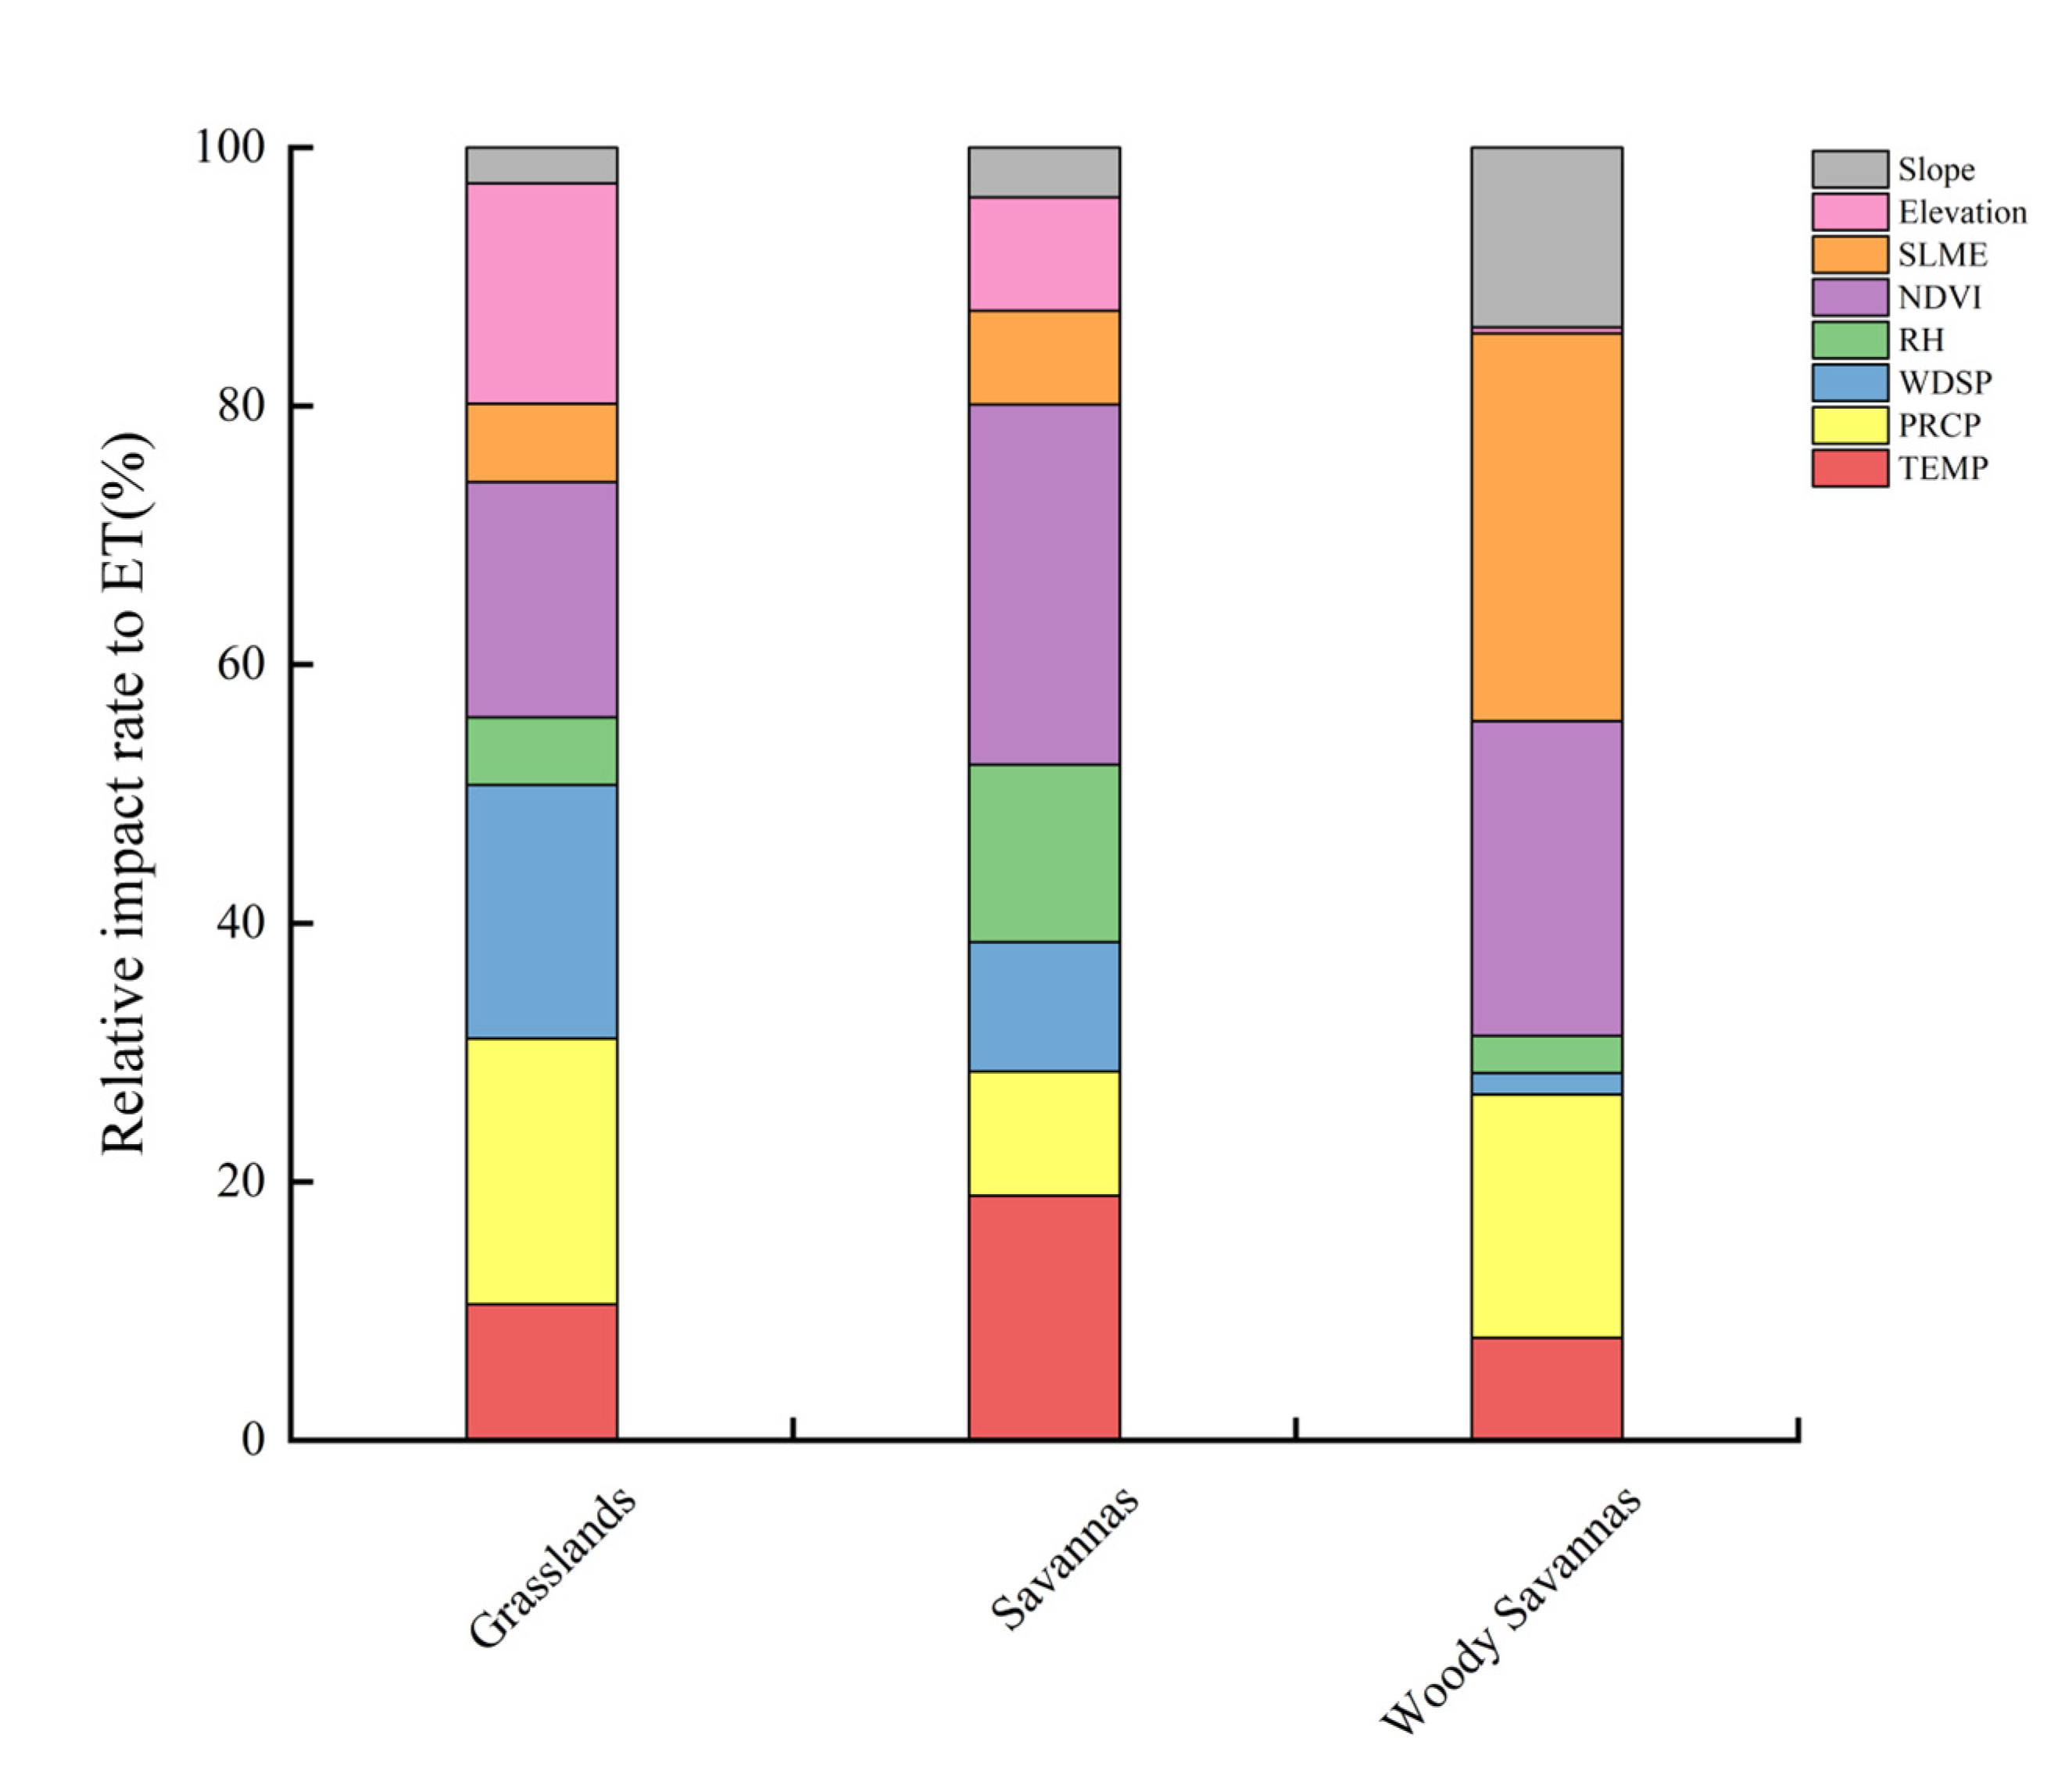
3.3.1. Histogram of Ridge Regression Coefficients and Contributions of Each Factor on Different Grassland Types

The grassland can be categorized by canopy height and tree cover into grasslands (predominantly annual herbs, canopy < 2 m), savannas (tree cover 10–30%, canopy > 2 m), and woody savannas (tree cover 30–60%, canopy > 2 m). The results of the ridge regression for different grassland types are shown in Table 1 below, where the coefficients of fit (R2) for both grasslands and woody savannas were above 0.6. NDVI; TEMP positively affected ET values for all three vegetation cover types, RH, SLME; DEM negatively affected ET for all three vegetation cover types; slope and WDSP were the factors that increased ET for woody savannas and decreased ET for grasslands. PRCP only had a positive effect on ET in savannas.
The statistics of the relative contribution of different factors to the ET trend in different grassland types are shown in Figure 9. SLME was the dominant factor influencing the ET trend in woody savannas, and unlike woody savannas, the dominant factor influencing the ET trend in savannas was NDVI, with a contribution rate of 27.831%, which may be related to the mixed vegetation cover. The relative contribution of NDVI to ET trend was ranked as savanna > woody savanna > grassland. It is worth noting that elevation, PRCP, NDVI, and WDSP all exceeded 15% of the influences affecting grassland’s ET trends, with no obvious dominant factor.

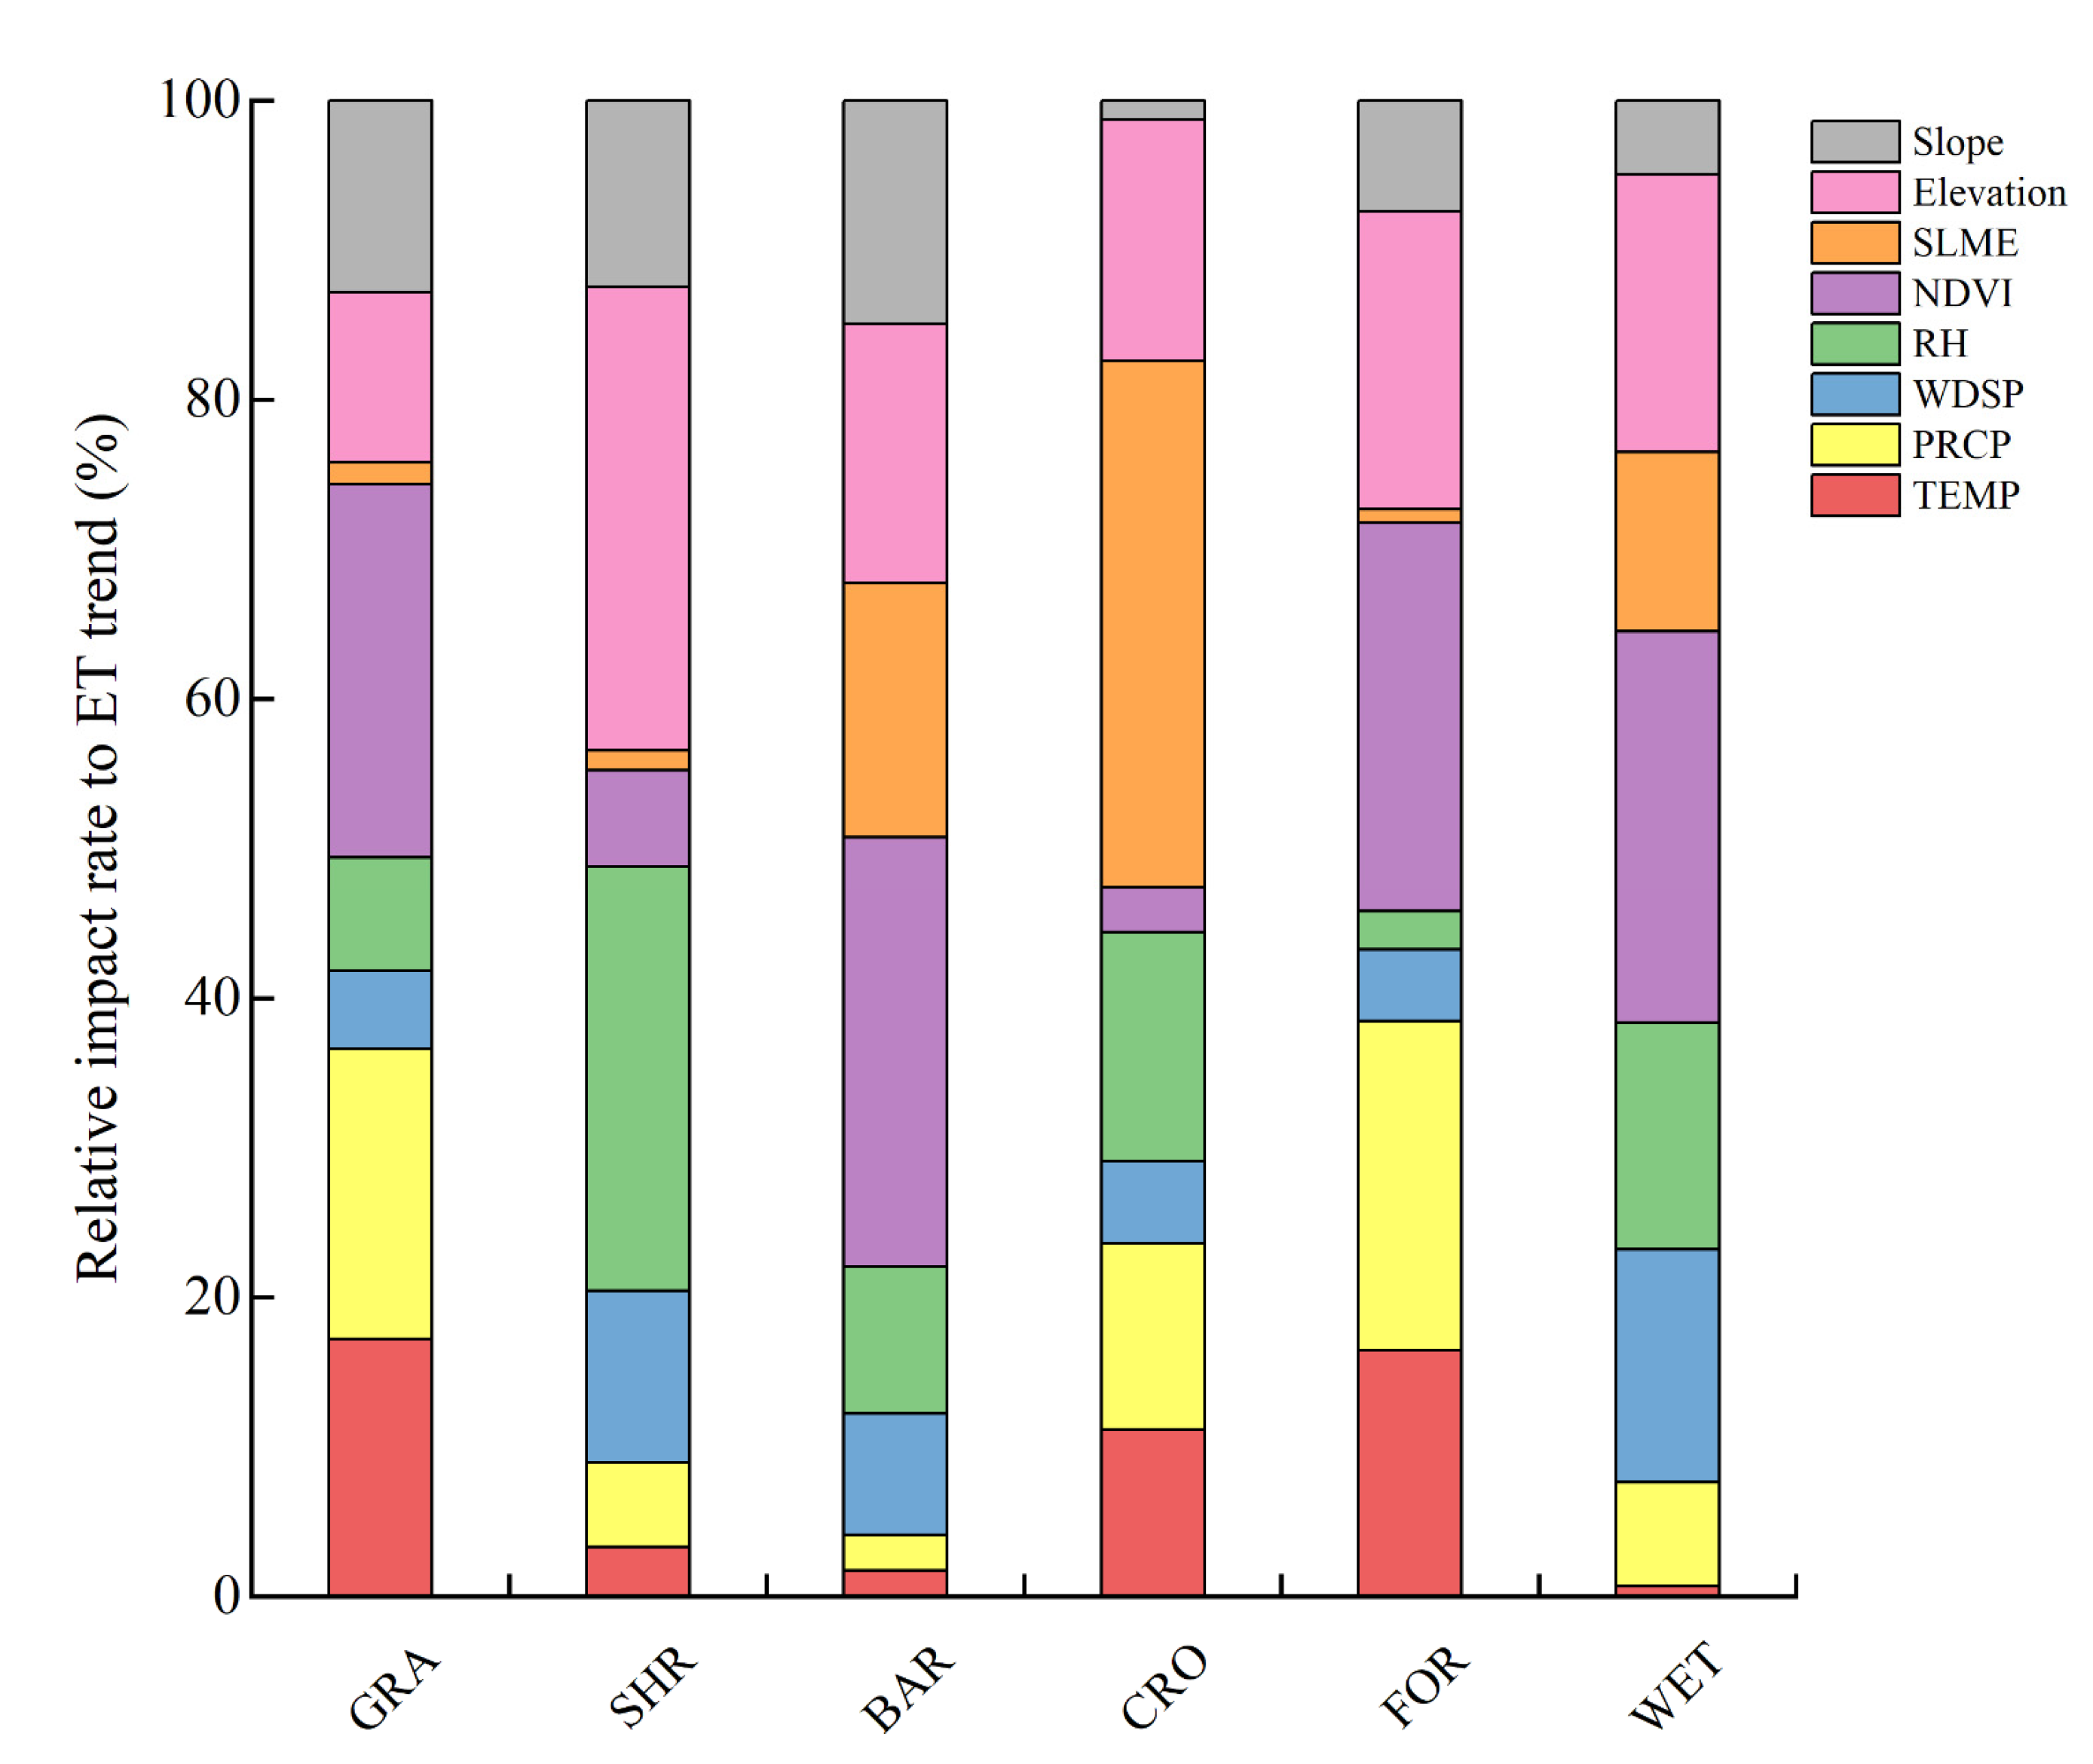
3.3.2. Histograms of Ridge Regression Coefficients and Contributions of Each Factor on Different Land Cover Classifications

The results of the ridge regression for different land cover types are shown in Table 2 below, where the coefficients of fit (R2) were higher for grassland, cropland, and forest, all exceeding 0.6. The standardized regression coefficients from the ridge regression showed that only NDVI was positively correlated with ET for all land cover types, and only SLME had a negative effect on ET in grassland, while the other influencing factors had a positive effect, and the factor that had the greatest effect on ET was NDVI with a standardized regression coefficient of 0.261; only TEMP, NDVI, and WDSP had a positive effect on ET in shrub, while the others had a negative effect, and elevation had the largest negative effect on ET, with a standardized regression coefficient of −0.259; elevation in barren has a significant negative effect on ET, and NDVI and SLME have a significant positive effect on ET; TEMP, RH, and SLME had a negative effect on ET and SLME with a standardized regression coefficient of −0.391 causing a significant negative effect in cropland. The effects of TEMP and NDVI on ET in the forest were positive, with NDVI with a standardized regression coefficient of 0.283 being the main factor influencing the increase in ET in forest, and PRCP with a standardized regression coefficient of -0.24 being the main factor influencing the decrease in ET in forest. The factors that significantly affect the change in ET of wetland is NDVI and elevation, both of which have a positive effect on ET.
The relative rates of influence of different factors on ET trends in areas with different vegetation cover types were calculated and are shown in Figure 10. Except for the cropland area, the sum of the relative contributions of the three influence factors, PRCP, NDVI, and elevation, in all land cover types exceeded 40%, which became the most dominant factor influencing the change of ET in the Yunnan Province, while WDSP and slope had no significant influence in all six land cover types, and had the least significant effect on the ET in the Yunnan Province. In terms of each land cover type, NDVI became the dominant factor influencing the ET change in grassland with a relative contribution of 24.952%; elevation was the dominant factor affecting the change in ET of shrub with a relative contribution of 30.981% and RH was the second dominant factor with a relative contribution of 28.349%; NDVI, elevation, and SLME in barren all contributed to ET, with NDVI being the dominant factor; SLME contributed the most to the ET change in cropland among the six land cover types with a relative contribution of 35.225%, making it the dominant factor influencing the ET change in cropland; in forest, NDVI was obviously the dominant factor influencing ET, PRCP, elevation, and TEMP also contributed significantly to the change in ET, with relative contributions of 25.94%, 21.998%, 19.89%, and 16.499%, respectively. WDSP, RH, elevation, and NDVI all had some contribution, among which the influence factor with the largest relative contribution was NDVI.

4. Discussion

4.1. Impact of Climate and Vegetation Greening on Ecohydrological Processes

ET is controlled by three main drivers: available radiant energy, available water, and water vapor transport mechanisms between the surface and the atmosphere [50]. Similarly, the results of this study reveal that changes in precipitation and NDVI significantly influenced the changes in ET from 2001 to 2020, implying that climate change and vegetation greening play a crucial role in controlling the changes in ET. Similar conclusions were also found in the Karst region of Southwest China, where Liu et al. [51] concluded that NDVI was the dominant factor controlling the increase of ET in large forested areas in the northwestern and central parts of the region. Niu et al. [52] also observed that in the precipitation-rich southern humid zone, ET increased when precipitation increased. In addition, based on the land type and ET data in the Yunnan Province, it was possible to determine the annual ET of various vegetation covers. The results showed that the ET from the forest were 6.37%, 16.5%, and 37.51% higher than the ET from the xerophytic savanna, savanna, and grassland, respectively. As the proportion of forested land and tree height increases, ET also increases. Also, a significant increase in vegetation cover leads to an increase in ET [53]; it suggests that changes in vegetation cover type have an effect on changes in actual ET. Cropland has large leaf areas, dense vegetation plantings, and high SLME, so cropland also tends to have larger ET than other common substrates. Forests have higher canopy structures, larger leaf areas, and deeper root distributions, suggesting that afforestation and deforestation are the LUCC processes with the greatest impact on ET [54]. At the same time, there are some checks and balances between vegetation growth and water resources. Changes in the functional type of vegetation affect the effectiveness of soil moisture and alter evaporation, transpiration, and water yields [55,56]. The structure and abundance of terrestrial vegetation greatly influences water cycle patterns and the overall ecosystem water balance [57]. Recent research suggests that changes in the subsurface, dominated by vegetation cover, may have a greater impact on the water cycle than climate change in the 21st century [58,59]. Vegetation growth in the humid and semi-humid zones is not yet approaching the limits of sustainable water resource development, and moderate vegetation growth not only contributes to the ecohydrological restoration of the watershed, but also provides a moderate increase in ET, so that the region presents a soil–ecosystem balance.

4.2. Analysis of ET Differences under Different Land Cover Types

NDVI stands as a preeminent metric for assessing the state of vegetation growth and its spatial distribution density. This metric exhibits a linear correlation with the density of vegetation distribution, thereby affording an effective means to portray the current status of growth, as previously noted [60]. Lands characterized by sparse vegetation cover, accompanied by extensive exposed geological strata, exhibit considerable variability and are particularly susceptible to the influences exerted by alterations in both vegetation and climatic conditions. Vegetation status had a significant positive correlation with ET, with evapotranspiration in barren areas being most affected by NDVI, and sparsely vegetated areas tending to be more susceptible to NDVI. This suggests that the function and type of vegetation cover is important for ecohydrological restoration of wetter bare ground areas [61]. TEMP, as the main energy condition, showed different correlations with ET under different land covers. Increases in TEMP not only accelerate soil moisture evaporation, but also control the stomatal opening of plants, which in turn affects photosynthesis and plant growth, leading to changes in vegetation evapotranspiration. Variations in ET within regions characterized by humidity are primarily governed by NR or TEMP. In this context, NR signifies the amount of energy available for allocation to surface heat flux, and it assumes particular significance as a driving force behind the process of ET occurring at the subsurface level [35,62,63]. ET is more influenced by the available energy in forest, cropland, and grassland areas, which are relatively lush and have high vegetation cover, and cropland, which, unlike forests and grasslands, is negatively affected by the fact that the surface of the cropland area is covered by large amounts of artificially irrigated water, which inhibits ET from the soil and the plant root system. Our findings are consistent with previous studies that have shown that ET in highly vegetated areas is primarily related to available energy [25]. PRCP and SLME are the main sources of available water. Different vegetation types and densities are key factors influencing the uptake and maintenance of surface soil water content [64]. In the humid zone savanna, grassland, and forest, excessive PRCP instead had an inhibitory effect on ET, which was consistent with the spatial distribution of ET from June to September in the Yunnan Province (Figure 5). At the same time, SLME has an important role for wetter areas with exposed strata, areas with high SLME can be well watered, and the soil water supply has a clear role in ET. However, SLME was not able to discharge a large amount of irrigation water and PRCP water for wet terraces, which inhibited plant stomatal openings and led to a decrease in ET in the cropland area of the Yunnan Province with the rise of SLME. Slope can affect ET on a spatial scale by influencing the spatial distribution of surface and groundwater, and steep slopes tend to bring about a loss of surface runoff, resulting in a decrease in soil evapotranspiration and vegetation transpiration, which in turn, leads to a decrease in ET [65]. Elevation tends to indirectly affect the ET of an area by affecting the area’s TEMP and NDVI. In cropland and wetland, where the gap in elevation is small, elevation has a positive effect on ET. Therefore, studying the spatiotemporal variability of ET and its influencing factors from the perspective of water cycle characteristics of different land cover types is necessary to understand the variability of the hydrological cycle.

4.3. Uncertainties and Future Improvements

It should be noted that this study is limited by some uncertainties. First, for the soil moisture data, we used the common Global Land Data Assimilation System (GLDAS) 2.1 soil moisture data to estimate the ET in the Yunnan Province; however, although the GLDAS 2.1 soil moisture data has soil moisture data up to a depth of two meters, it has a relatively coarse spatial resolution. Moreover, the selection of different soil moisture data, such as SMAP, may also lead to uncertainty in the estimation of the contribution of impact factors to ET. Secondly, certain land cover types such as barren and wetland have fewer pixel values in the study area compared to other land cover types, which may also lead to reduce the correlation of the impact factors on the contribution of ET under different land cover types. Finally, in quantifying the contribution of the influence factors to evapotranspiration, although the multicollinearity among the influence factors was considered, the multicollinearity differences among the eight influence factors were not quantified using the variance inflation factor (VIF). Future studies should consider further ET estimations of impact factors to obtain more comprehensive conclusions. Moreover, the differences in the contributions of the influencing factors to ET under different land cover types can be integrated into the prediction of the ET land surface model in the future.

5. Conclusions

By using MODIS-Terra ET products and meteorological datasets, this study revealed the ET trends of different land cover types and their correlations with influencing factors on the land scale in the Yunnan Province from 2001 to 2020, and applied a ridge regression model to quantify the contributions of influencing factors to ET under different land cover types. Nearly 85.15% of the area in the Yunnan Province showed an increasing trend in the past 20 years, with the smallest increasing trend of 2.1 mm/year in cropland and the largest increasing trend of 4.7 mm/year in grassland. Except for cropland, the sum of the relative contributions of the three influence factors of PRCP, NDVI, and elevation in all land cover types exceeded 40%, which became the most dominant factor influencing the change of ET in the Yunnan Province, while WDSP and slope had no significant influence in all six land cover types, and had the least significant effect on ET in the Yunnan Province. Among the three grassland types, the relative contribution of NDVI to the ET trend was ranked as: savannas > woody savannas > grasslands. The order of ET water depletion in the Yunnan Province was obtained as (forest > grassland > cropland > shrub > wetland > barren), which provides a reference for the future planning of regional ecosystems. This study provides a good reference. This study supports, to some extent, the variability of hydrological processes in the ecological and climatic environments of different regions by comprehensively evaluating the response of ET to different land cover types on land in the humid zone to hydrological, climatic, topographic, and vegetation factors, reveals the interactions between ecosystem functions and hydrological cycles in the humid zone, and provides a scientific basis for the rational management of water resources in China.

Author Contributions

Conceptualization, W.S. and H.S.; methodology, W.X.; validation, Z.X.; investigation, C.Z.; data curation, H.Y.; writing—original draft preparation and visualization, W.S.; writing—review and editing, H.S. All authors have read and agreed to the published version of the manuscript.

Funding

This research was funded by the National Natural Science Foundation of China (Grant No. 42271405), the Science and Technology Department of Sichuan Province (Grant No. 2022NSFSC0231, 2023NSFSC0248).

Data Availability Statement

The MODIS-Terra ET product (MOD16A2.06) can be obtained from the U.S. Geological Survey (https://earthexplorer.usgs.gov/, accessed on 9 April 2023).

Conflicts of Interest

The authors declare no conflict of interest.

References

  1. Sellers, P.J.; Dickinson, R.E.; Randall, D.A.; Betts, A.K.; Hall, F.G.; Berry, J.A.; Collatz, G.J.; Denning, A.S.; Mooney, H.A.; Nobre, C.A.; et al. Modeling the exchanges of energy, water, and carbon between continents and the atmosphere. Science 1997, 275, 502–509. [Google Scholar] [CrossRef] [PubMed]
  2. Trenberth, K.E.; Smith, L.; Qian, T.; Dai, A.; Fasullo, J. Estimates of the global water budget and its annual cycle using observational and model data. J. Hydrometeorol. 2007, 8, 758–769. [Google Scholar] [CrossRef]
  3. Wang, K.; Dickinson, R.E. A review of global terrestrial evapotranspiration: Observation, modeling, climatology, and climatic variability. Rev. Geophys. 2012, 50. [Google Scholar] [CrossRef]
  4. Kool, D.; Agam, N.; Lazarovitch, N.; Heitman, J.L.; Sauer, T.J.; Ben-Gal, A. A review of approaches for evapotranspiration partitioning. Agric. For. Meteorol. 2014, 184, 56–70. [Google Scholar] [CrossRef]
  5. Wang, Z.; Zhan, C.; Ning, L.; Guo, H. Evaluation of global terrestrial evapotranspiration in CMIP6 models. Theor. Appl. Climatol. 2021, 143, 521–531. [Google Scholar] [CrossRef]
  6. Zhang, L.; Dawes, W.R.; Walker, G.R. Response of mean annual evapotranspiration to vegetation changes at catchment scale. Water Resour. Res. 2001, 37, 701–708. [Google Scholar] [CrossRef]
  7. Montaldo, N.; Oren, R. Changing Seasonal Rainfall Distribution With Climate Directs Contrasting Impacts at Evapotranspiration and Water Yield in the Western Mediterranean Region. Earths Future 2018, 6, 841–856. [Google Scholar] [CrossRef]
  8. Zhang, D.; Liu, X.; Zhang, L.; Zhang, Q.; Gan, R.; Li, X. Attribution of Evapotranspiration Changes in Humid Regions of China from 1982 to 2016. J. Geophys. Res.-Atmos. 2020, 125, e2020JD032404. [Google Scholar] [CrossRef]
  9. Hansen, J.; Ruedy, R.; Sato, M.; Lo, K. Global surface temperature change. Rev. Geophys. 2010, 48, RG4004. [Google Scholar] [CrossRef]
  10. Li, X.; He, Y.; Zeng, Z.; Lian, X.; Wang, X.; Du, M.; Jia, G.; Li, Y.; Ma, Y.; Tang, Y.; et al. Spatiotemporal pattern of terrestrial evapotranspiration in China during the past thirty years. Agric. For. Meteorol. 2018, 259, 131–140. [Google Scholar] [CrossRef]
  11. Chen, C.; Park, T.; Wang, X.; Piao, S.; Xu, B.; Chaturvedi, R.K.; Fuchs, R.; Brovkin, V.; Ciais, P.; Fensholt, R.; et al. China and India lead in greening of the world through land-use management. Nat. Sustain. 2019, 2, 122–129. [Google Scholar] [CrossRef] [PubMed]
  12. Zhao, F.; Wu, Y.; Yao, Y.; Sun, K.; Zhang, X.; Winowiecki, L.; Vagen, T.-G.; Xue, J.; Qiu, L.; Sun, P.; et al. Predicting the climate change impacts on water-carbon coupling cycles for a loess hilly-gully watershed. J. Hydrol. 2020, 581, 124388. [Google Scholar] [CrossRef]
  13. Friedl, M.A. Relationships among remotely sensed data, surface energy balance, and area-averaged fluxes over partially vegetated land surfaces. J. Appl. Meteorol. 1996, 35, 2091–2103. [Google Scholar] [CrossRef]
  14. Lettenmaier, D.P.; Famiglietti, J.S. Hydrology—Water from on high. Nature 2006, 444, 562–563. [Google Scholar] [CrossRef]
  15. Lei, H.; Yang, D. Interannual and seasonal variability in evapotranspiration and energy partitioning over an irrigated cropland in the North China Plain. Agric. For. Meteorol. 2010, 150, 581–589. [Google Scholar] [CrossRef]
  16. Leuning, R.; Zhang, Y.Q.; Rajaud, A.; Cleugh, H.; Tu, K. A simple surface conductance model to estimate regional evaporation using MODIS leaf area index and the Penman-Monteith equation. Water Resour. Res. 2008, 44, 581–589. [Google Scholar] [CrossRef]
  17. Zhao, F.; Wu, Y.; Qiu, L.; Sivakumar, B.; Zhang, F.; Sun, Y.; Sun, L.; Li, Q.; Voinov, A. Spatiotemporal features of the hydro-biogeochemical cycles in a typical loess gully watershed. Ecol. Indic. 2018, 91, 542–554. [Google Scholar] [CrossRef]
  18. Weizhou, W.; Zhonghui, Z.; Wenxing, K.; Dalun, T.; Wenhua, X.; Wende, Y.A.N. Characteristics of latent heat flux over Cunninghamia lanceolata plantations in Huitong county. J. Cent. South Univ. For. Technol. 2011, 31, 192–197. [Google Scholar]
  19. Wang, W.; Liao, Y.; Wen, X.; Guo, Q. Dynamics of CO2 fluxes and environmental responses in the rain-fed winter wheat ecosystem of the Loess Plateau, China. Sci. Total Environ. 2013, 461, 10–18. [Google Scholar] [CrossRef]
  20. Liang, W.; Zhang, W.; Jin, Z.; Yan, J.; Lu, Y.; Li, S.; Yu, Q. Rapid Urbanization and Agricultural Intensification Increase Regional Evaporative Water Consumption of the Loess Plateau. J. Geophys. Res.-Atmos. 2020, 125, e2020JD033380. [Google Scholar] [CrossRef]
  21. Su, Z. The Surface Energy Balance System (SEBS) for estimation of turbulent heat fluxes. Hydrol. Earth Syst. Sci. 2002, 6, 85–99. [Google Scholar] [CrossRef]
  22. Bastiaanssen, W.G.M.; Menenti, M.; Feddes, R.A.; Holtslag, A.A.M. A remote sensing surface energy balance algorithm for land (SEBAL)—1. Formulation. J. Hydrol. 1998, 212, 198–212. [Google Scholar] [CrossRef]
  23. Mu, Q.; Heinsch, F.A.; Zhao, M.; Running, S.W. Development of a global evapotranspiration algorithm based on MODIS and global meteorology data. Remote Sens. Environ. 2007, 111, 519–536. [Google Scholar] [CrossRef]
  24. Mu, Q.; Zhao, M.; Running, S.W. Improvements to a MODIS global terrestrial evapotranspiration algorithm. Remote Sens. Environ. 2011, 115, 1781–1800. [Google Scholar] [CrossRef]
  25. Priestley, C.H.B.; Taylor, R.J. On the assessment of surface heat flux and evaporation using large-scale parameters. Mon. Weather Rev. 1972, 100, 81–92. [Google Scholar] [CrossRef]
  26. Fisher, J.B.; Tu, K.P.; Baldocchi, D.D. Global estimates of the land-atmosphere water flux based on monthly AVHRR and ISLSCP-II data, validated at 16 FLUXNET sites. Remote Sens. Environ. 2008, 112, 901–919. [Google Scholar] [CrossRef]
  27. Cheng, M.; Jiao, X.; Jin, X.; Li, B.; Liu, K.; Shi, L. Satellite time series data reveal interannual and seasonal spatiotemporal evapotranspiration patterns in China in response to effect factors. Agric. Water Manag. 2021, 255, 107046. [Google Scholar] [CrossRef]
  28. Groisman, P.Y.; Karl, T.R.; Easterling, D.R.; Knight, R.W.; Jamason, P.F.; Hennessy, K.J.; Suppiah, R.; Page, C.M.; Wibig, J.; Fortuniak, K.; et al. Changes in the probability of heavy precipitation: Important indicators of climatic change. Clim. Chang. 1999, 42, 243–283. [Google Scholar] [CrossRef]
  29. Huntington, T.G. Evidence for intensification of the global water cycle: Review and synthesis. J. Hydrol. 2006, 319, 83–95. [Google Scholar] [CrossRef]
  30. Acharjee, T.K.; van Halsema, G.; Ludwig, F.; Hellegers, P. Declining trends of water requirements of dry season Boro rice in the north-west Bangladesh. Agric. Water Manag. 2017, 180, 148–159. [Google Scholar] [CrossRef]
  31. Fu, J.; Gong, Y.; Zheng, W.; Zou, J.; Zhang, M.; Zhang, Z.; Qin, J.; Liu, J.; Quan, B. Spatial-temporal variations of terrestrial evapotranspiration across China from 2000 to 2019. Sci. Total Environ. 2022, 825, 153951. [Google Scholar] [CrossRef]
  32. Yang, L.; Feng, Q.; Adamowski, J.F.; Alizadeh, M.R.; Yin, Z.; Wen, X.; Zhu, M. The role of climate change and vegetation greening on the variation of terrestrial evapotranspiration in northwest China’s Qilian Mountains. Sci. Total Environ. 2021, 759, 143532. [Google Scholar] [CrossRef] [PubMed]
  33. Shao, R.; Zhang, B.; Su, T.; Biao, L.; Cheng, L.; Xue, Y.; Yang, W. Estimating the Increase in Regional Evaporative Water Consumption as a Result of Vegetation Restoration Over the Loess Plateau, China. J. Geophys. Res.-Atmos. 2019, 124, 11783–11802. [Google Scholar] [CrossRef]
  34. Bai, M.; Mo, X.; Liu, S.; Hu, S. Contributions of climate change and vegetation greening to evapotranspiration trend in a typical hilly-gully basin on the Loess Plateau, China. Sci. Total Environ. 2019, 657, 325–339. [Google Scholar] [CrossRef]
  35. Lin, S.; Wang, G.; Hu, Z.; Huang, K.; Sun, X.; Sun, J.; Luo, M.; Xiao, X. Dynamics of Evapotranspiration and Variations in Different Land-Cover Regions over the Tibetan Plateau during 1961–2014. J. Hydrometeorol. 2021, 22, 955–969. [Google Scholar] [CrossRef]
  36. Theil, H. A rank-invariant method of linear and polynomial regression analysis. Indag. Math. 1950, 12, 173. [Google Scholar]
  37. Sen, P.K. Estimates of the regression coefficient based on Kendall’s tau. J. Am. Stat. Assoc. 1968, 63, 1379–1389. [Google Scholar] [CrossRef]
  38. Mann, H.B. Nonparametric tests against trend. Econom. J. Econom. Soc. 1945, 13, 245–259. [Google Scholar] [CrossRef]
  39. Kendall, M.G. Rank Correlation Methods; Griffin: London, UK, 1948. [Google Scholar]
  40. Partal, T.; Kahya, E. Trend analysis in Turkish precipitation data. Hydrol. Process. Int. J. 2006, 20, 2011–2026. [Google Scholar] [CrossRef]
  41. Feng, Y.; Cui, N.; Zhao, L.; Gong, D.; Zhang, K. Spatiotemporal variation of reference evapotranspiration during 1954–2013 in Southwest China. Quat. Int. 2017, 441, 129–139. [Google Scholar] [CrossRef]
  42. Hoerl, A.E.; Kennard, R.W. Ridge regression: Biased estimation for nonorthogonal problems. Technometrics 1970, 12, 55–67. [Google Scholar] [CrossRef]
  43. Suzuki, R.; Masuda, K.; Dye, D.G. Interannual covariability between actual evapotranspiration and PAL and GIMMS NDVIs of northern Asia. Remote Sens. Environ. 2007, 106, 387–398. [Google Scholar] [CrossRef]
  44. Mao, D.; Wang, Z.; Luo, L.; Ren, C. Integrating AVHRR and MODIS data to monitor NDVI changes and their relationships with climatic parameters in Northeast China. Int. J. Appl. Earth Obs. Geoinf. 2012, 18, 528–536. [Google Scholar] [CrossRef]
  45. Suzuki, R.; Masuda, K. Interannual covariability found in evapotranspiration and satellite-derived vegetation indices over northern Asia. J. Meteorol. Soc. Jpn. 2004, 82, 1233–1241. [Google Scholar] [CrossRef]
  46. Chen, J.; Zhang, J.; Peng, J.; Zou, L.; Fan, Y.; Yang, F.; Hu, Z. Alp-valley and elevation effects on the reference evapotranspiration and the dominant climate controls in Red River Basin, China: Insights from geographical differentiation. J. Hydrol. 2023, 620, 129397. [Google Scholar] [CrossRef]
  47. Ma, Y.-J.; Li, X.-Y.; Liu, L.; Yang, X.-F.; Wu, X.-C.; Wang, P.; Lin, H.; Zhang, G.-H.; Miao, C.-Y. Evapotranspiration and its dominant controls along an elevation gradient in the Qinghai Lake watershed, northeast Qinghai-Tibet Plateau. J. Hydrol. 2019, 575, 257–268. [Google Scholar] [CrossRef]
  48. Xiang, K.; Li, Y.; Horton, R.; Feng, H. Similarity and difference of potential evapotranspiration and reference crop evapotranspiration—A review. Agric. Water Manag. 2020, 232, 106043. [Google Scholar] [CrossRef]
  49. Lu, J.; Wang, G.; Li, S.; Feng, A.; Zhan, M.; Jiang, T.; Su, B.; Wang, Y. Projected Land Evaporation and Its Response to Vegetation Greening Over China Under Multiple Scenarios in the CMIP6 Models. J. Geophys. Res.-Biogeosci. 2021, 126, e2021JG006327. [Google Scholar] [CrossRef]
  50. Batra, N.; Islam, S.; Venturini, V.; Bisht, G.; Jiang, L. Estimation and comparison of evapotranspiration from MODIS and AVHRR sensors for clear sky days over the Southern Great Plains. Remote Sens. Environ. 2006, 103, 1–15. [Google Scholar] [CrossRef]
  51. Liu, Y.; Lian, J.; Luo, Z.; Chen, H. Spatiotemporal variations in evapotranspiration and transpiration fraction following changes in climate and vegetation in a karst basin of southwest China. J. Hydrol. 2022, 612, 128216. [Google Scholar] [CrossRef]
  52. Niu, Z.; He, H.; Zhu, G.; Ren, X.; Zhang, L.; Zhang, K.; Yu, G.; Ge, R.; Li, P.; Zeng, N. An increasing trend in the ratio of transpiration to total terrestrial evapotranspiration in China from 1982 to 2015 caused by greening and warming. Agric. For. Meteorol. 2019, 279, 107701. [Google Scholar] [CrossRef]
  53. Goulden, M.L.; Bales, R.C. Mountain runoff vulnerability to increased evapotranspiration with vegetation expansion. Proc. Natl. Acad. Sci. USA 2014, 111, 14071–14075. [Google Scholar] [CrossRef] [PubMed]
  54. Ye, L.; Cheng, L.; Liu, P.; Liu, D.; Zhang, L.; Qin, S.; Xia, J. Management of vegetative land for more water yield under future climate conditions in the over-utilized water resources regions: A case study in the Xiong’an New area. J. Hydrol. 2021, 600, 126563. [Google Scholar] [CrossRef]
  55. Sala, O.; Lauenroth, W.; Golluscio, R. 11 Plant functional types in temperate semi-arid regions. Plant Funct. Types Their Relev. Ecosyst. Prop. Glob. Chang. 1997, 1, 217. [Google Scholar]
  56. Prevey, J.S.; Germino, M.J.; Huntly, N.J.; Inouye, R.S. Exotic plants increase and native plants decrease with loss of foundation species in sagebrush steppe. Plant Ecol. 2010, 207, 39–51. [Google Scholar] [CrossRef]
  57. Rodriguez-Iturbe, I.; Porporato, A.; Ridolfi, L.; Isham, V.; Cox, D.R. Probabilistic modelling of water balance at a point: The role of climate, soil and vegetation. Proc. R. Soc. A Math. Phys. Eng. Sci. 1999, 455, 3789–3805. [Google Scholar] [CrossRef]
  58. Breshears, D.D.; Cobb, N.S.; Rich, P.M.; Price, K.P.; Allen, C.D.; Balice, R.G.; Romme, W.H.; Kastens, J.H.; Floyd, M.L.; Belnap, J.; et al. Regional vegetation die-off in response to global-change-type drought. Proc. Natl. Acad. Sci. USA 2005, 102, 15144–15148. [Google Scholar] [CrossRef]
  59. Zemp, D.C.; Schleussner, C.F.; Barbosa, H.M.J.; Rammig, A. Deforestation effects on Amazon forest resilience. Geophys. Res. Lett. 2017, 44, 6182–6190. [Google Scholar] [CrossRef]
  60. Jia, G.; Epstein, H.; Walker, D. Controls over intra-seasonal dynamics of AVHRR NDVI for the Arctic tundra in northern Alaska. Int. J. Remote Sens. 2004, 25, 1547–1564. [Google Scholar] [CrossRef]
  61. Xue, B.; Wang, G.; Xiao, J.; Helman, D.; Sun, W.; Wang, J.; Liu, T. Global convergence but regional disparity in the hydrological resilience of ecosystems and watersheds to drought. J. Hydrol. 2020, 591, 125589. [Google Scholar] [CrossRef]
  62. Li, X.; Liang, S.; Yuan, W.; Yu, G.; Cheng, X.; Chen, Y.; Zhao, T.; Feng, J.; Ma, Z.; Ma, M. Estimation of evapotranspiration over the terrestrial ecosystems in China. Ecohydrology 2014, 7, 139–149. [Google Scholar] [CrossRef]
  63. Liu, J.; Jia, B.; Xie, Z.; Shi, C. Ensemble simulation of land evapotranspiration in China based on a multi-forcing and multi-model approach. Adv. Atmos. Sci. 2016, 33, 673–684. [Google Scholar] [CrossRef]
  64. Ji, Y.; Tang, Q.; Yan, L.; Wu, S.; Yan, L.; Tan, D.; Chen, J.; Chen, Q. Spatiotemporal Variations and Influencing Factors of Terrestrial Evapotranspiration and Its Components during Different Impoundment Periods in the Three Gorges Reservoir Area. Water 2021, 13, 2111. [Google Scholar] [CrossRef]
  65. Luo, Y.; Gao, P.; Mu, X. Influence of Meteorological Factors on the Potential Evapotranspiration in Yanhe River Basin, China. Water 2021, 13, 1222. [Google Scholar] [CrossRef]
Figure 1. Geographic location of the Yunnan Province in China: (a) map of the Yunnan Province; (b) spatial distribution of land cover types in the Yunnan Province.
Water 15 03309 g001
Figure 2. Spatial distribution of ET in the Yunnan Province.
Water 15 03309 g002
Figure 3. ET interannual variation of different land cover from 2000 to 2019.
Water 15 03309 g003
Figure 4. Spatial distribution of ET trends in the Yunnan Province.
Water 15 03309 g004
Figure 5. Spatial distribution of monthly ET in the Yunnan Province.
Water 15 03309 g005
Figure 6. The correlation distribution of ET and meteorological factors.
Water 15 03309 g006
Figure 7. (a) Spatial distribution of elevation in the Yunnan Province. (b) Mean evapotranspiration from different elevations under different surface cover types.
Water 15 03309 g007
Figure 8. (a) Spatial distribution of slopes in the Yunnan Province; (b) Mean evapotranspiration at different slopes under different surface cover types.
Water 15 03309 g008
Figure 9. Relative contribution of each impact factor under different grassland types.
Water 15 03309 g009
Figure 10. Relative contribution of each impact factor under different land cover types.
Water 15 03309 g010
Table 1. Results of the ridge regression analysis for different grassland types.
Factors
R2TEMPPRCPWDSPRHNDVISLMEElevationSlope
Landcover
Grasslands0.620.113−0.221 *−0.211 *−0.0560.196−0.065−0.183−0.03
Savannas0.490.274 *0.139−0.145−0.1990.403−0.105−0.127−0.056
Woody savannas0.770.119−0.283 *0.025−0.0430.366 *−0.451 *−0.0070.209
Note: * Indicates passing a significance test of p < 0.05.
Table 2. Results of the ridge regression analysis for different land cover types.
FactorsR2TEMPPRCPWDSPRHNDVISLMEElevationSlope
Landcover
grassland0.610.18 *0.203 *0.0550.0790.261 *−0.0150.1190.134
shrub0.480.028−0.047−0.096−0.237 *0.054−0.011−0.259 *0.104
barren0.38−0.022−0.030.102−0.1240.362 *0.214 *−0.218 *−0.188
cropland0.77−0.124 *0.138 *0.061−0.17 *0.033−0.391 *0.179 *0.014
forest0.740.18 *−0.24 *−0.052−0.0280.283 *−0.01−0.217 *−0.081
wetland0.410.0080.0820.1830.1780.307 *−0.1410.218 *−0.058
Note: * Indicates passing a significance test of p < 0.05.
Disclaimer/Publisher’s Note: The statements, opinions and data contained in all publications are solely those of the individual author(s) and contributor(s) and not of MDPI and/or the editor(s). MDPI and/or the editor(s) disclaim responsibility for any injury to people or property resulting from any ideas, methods, instructions or products referred to in the content.

