
Spatial–Temporal Influence of Sand Dams on Chemical and Microbial Properties of Water from Scooping Holes in Degraded Semi-Arid Regions

 and
and 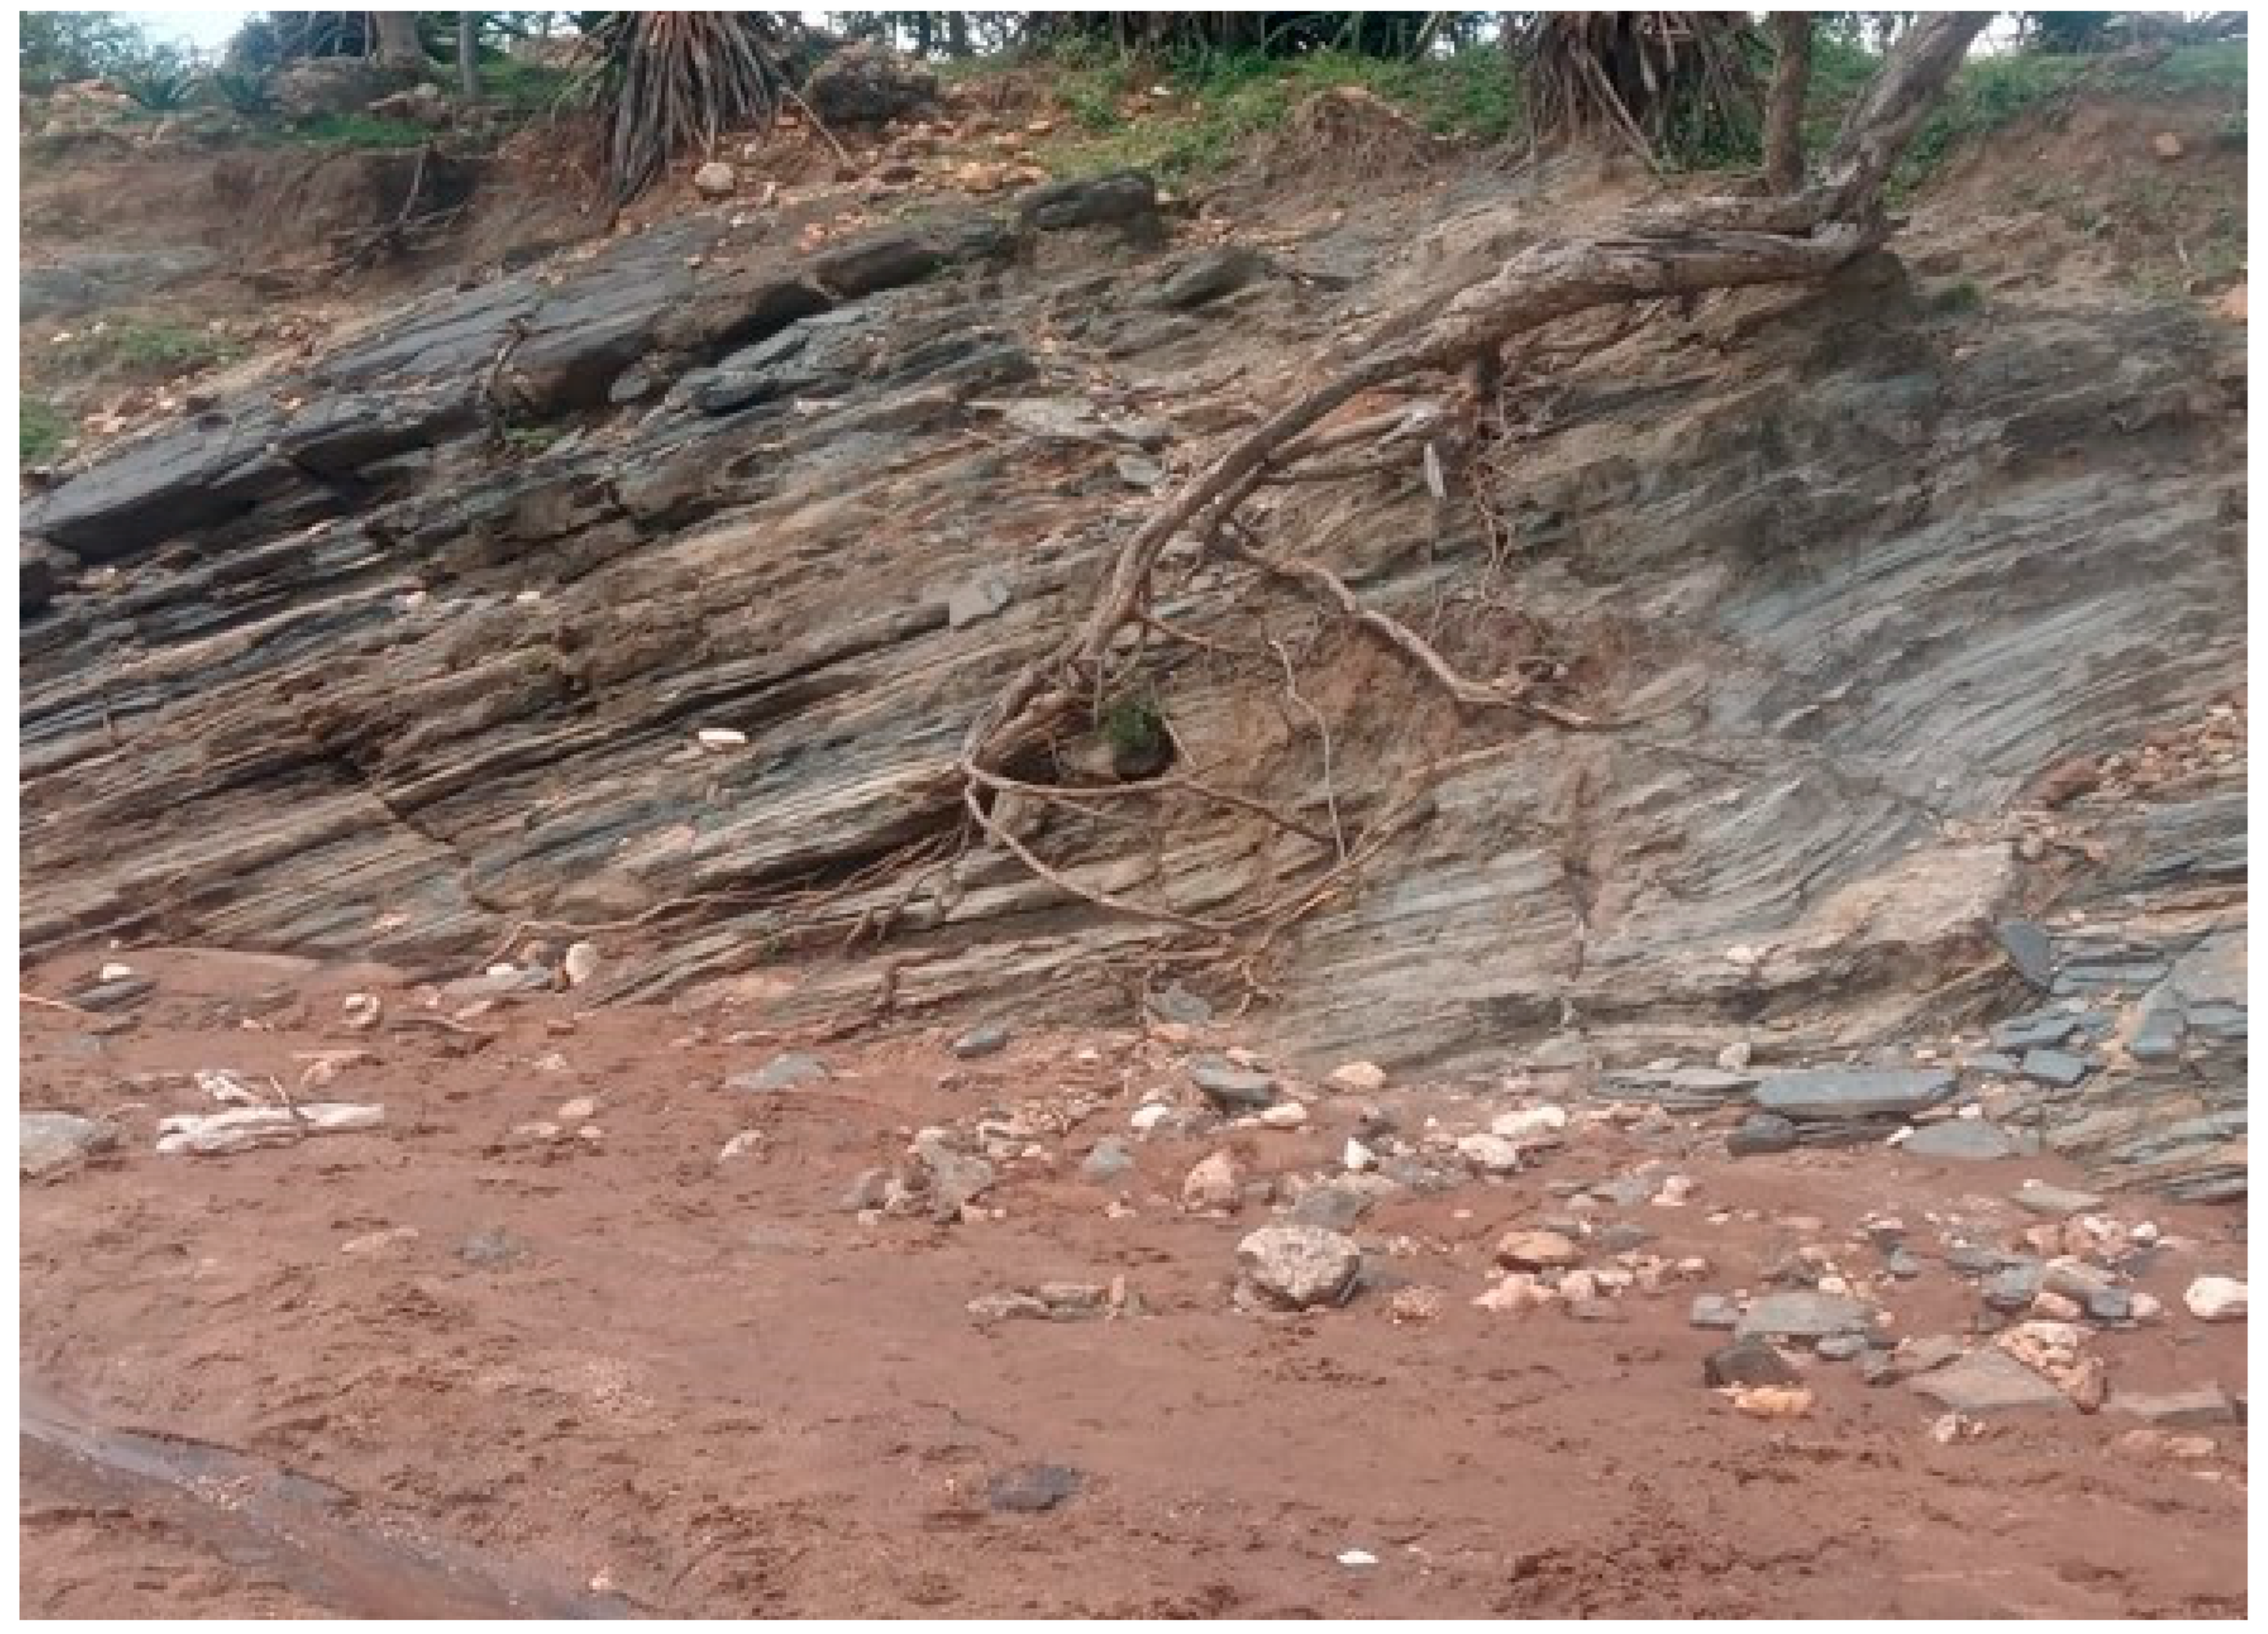
Abstract
:1. Introduction
2. Materials and Methods
2.1. Study Site Description
2.2. Selection of Sand Dams to Be Used in the Study
2.3. Assessing Quality of Water Abstracted from the Scooping Holes
2.4. Data Analysis
3. Results
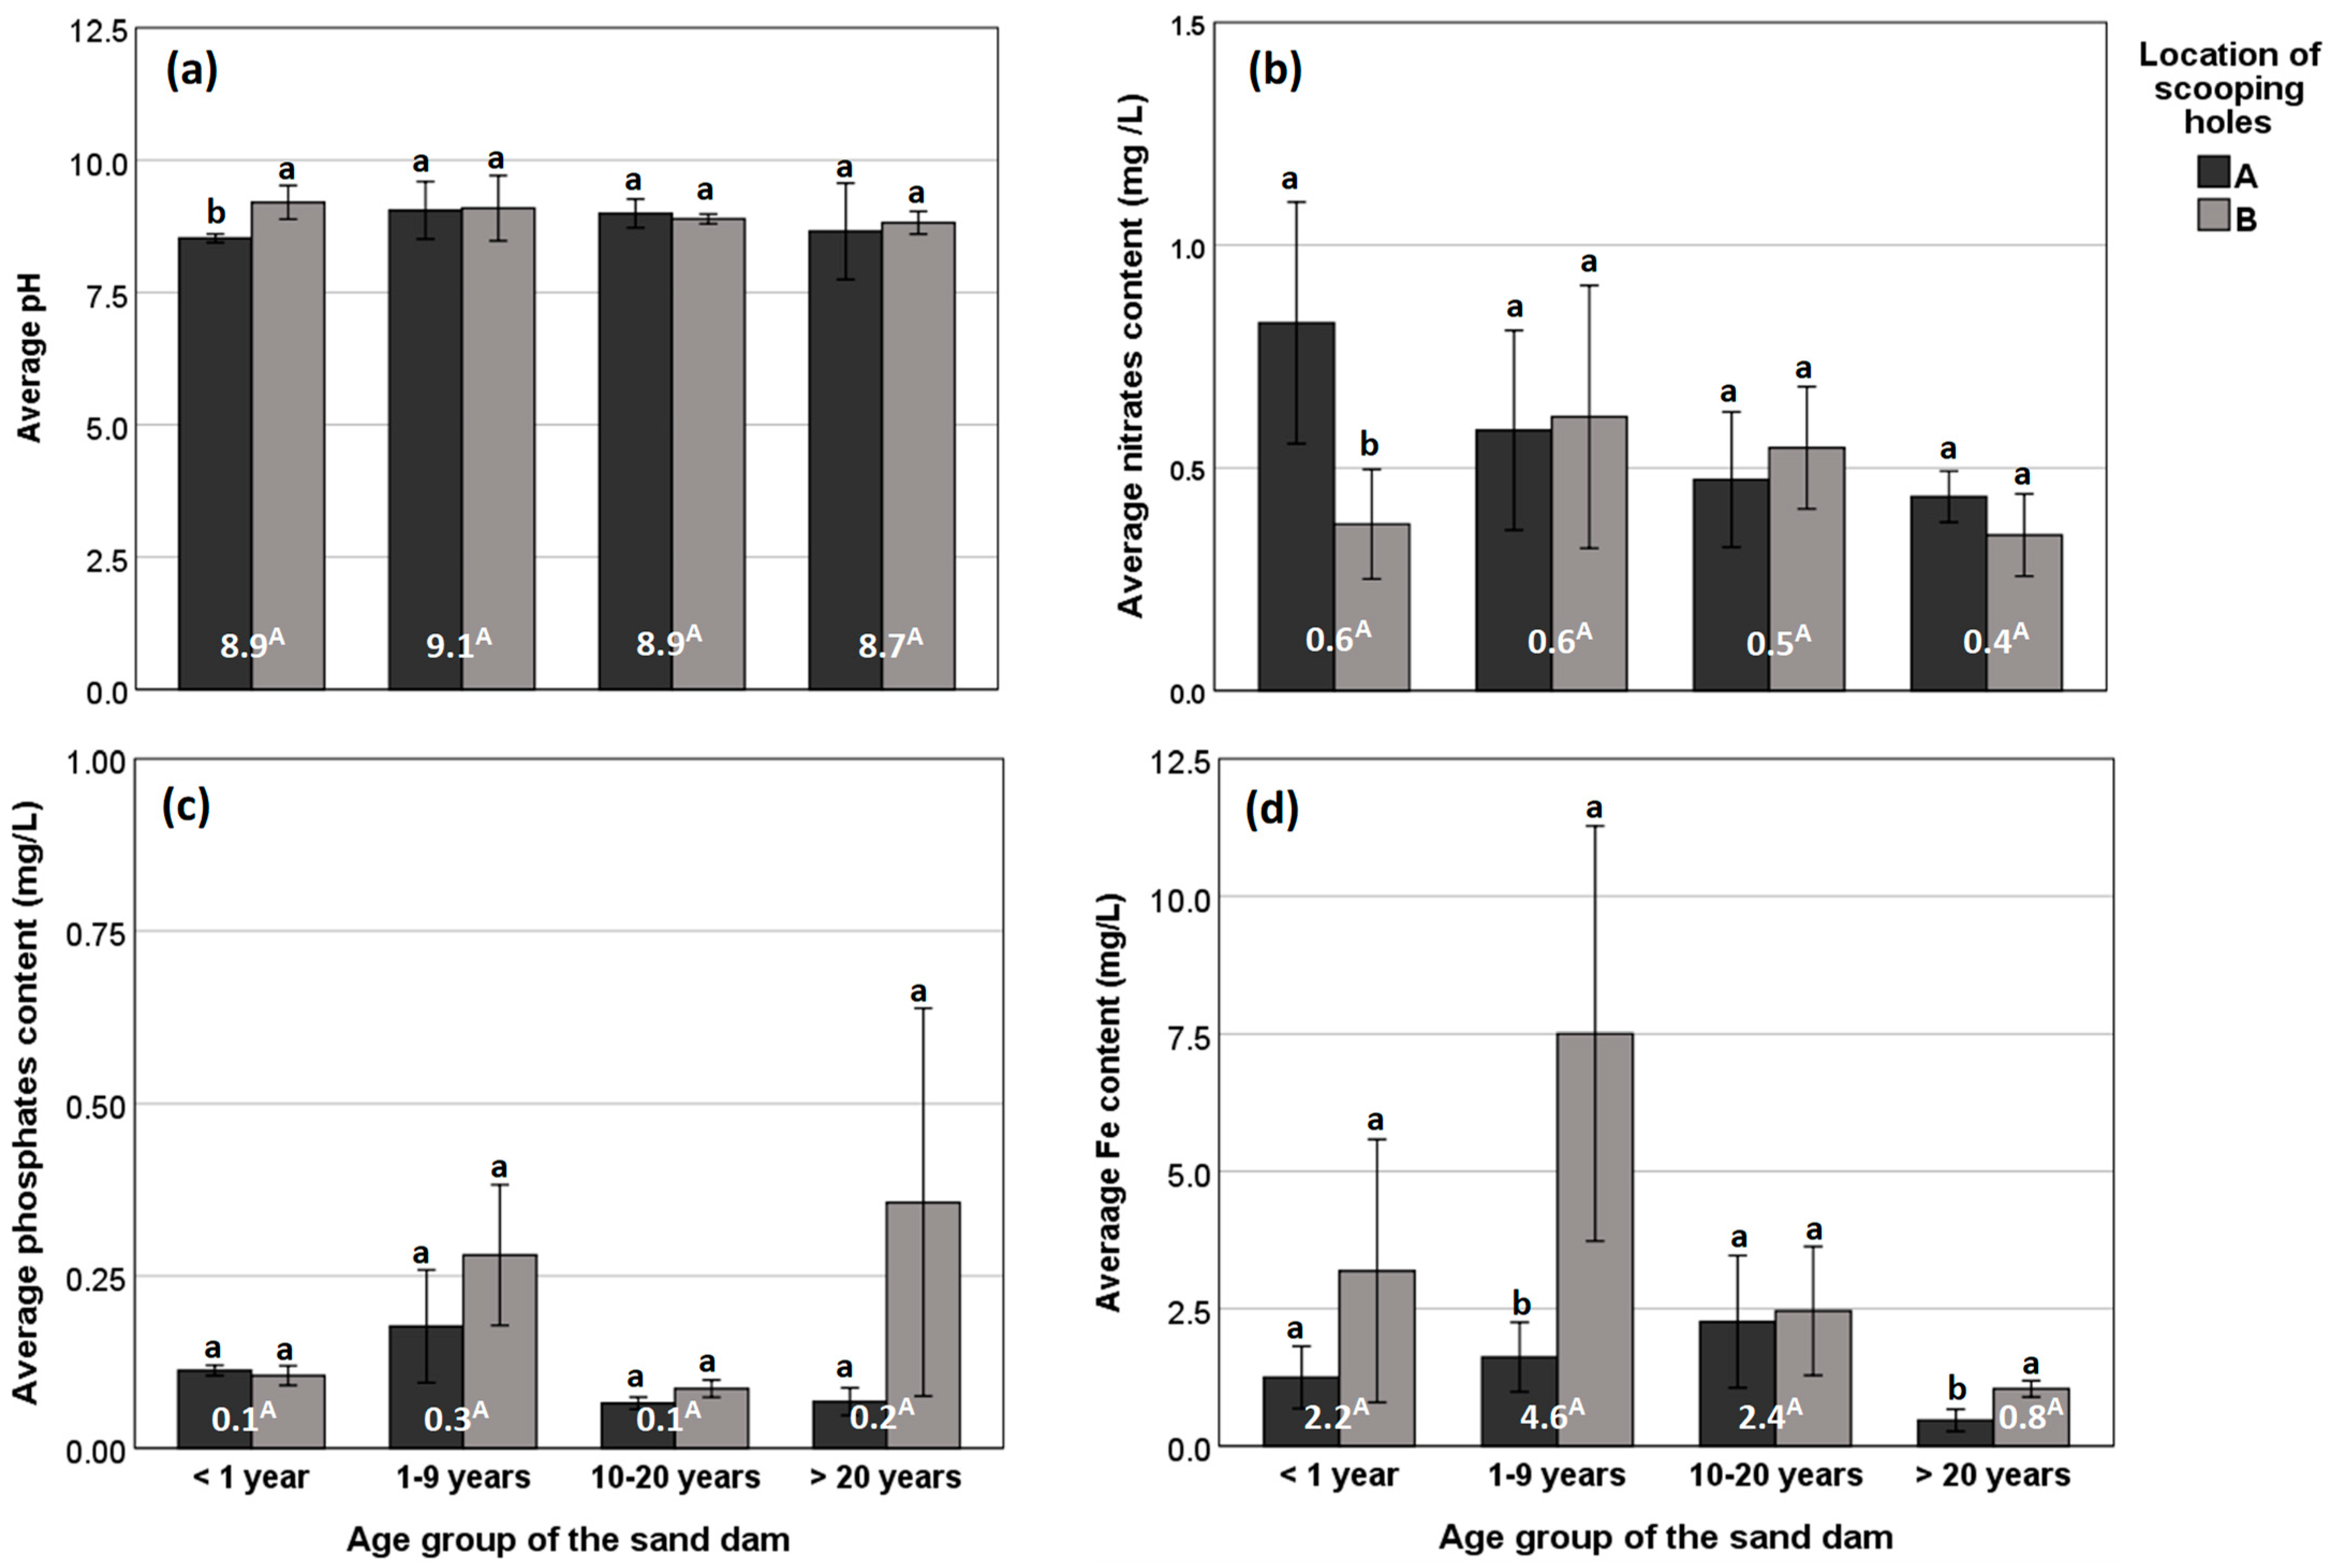
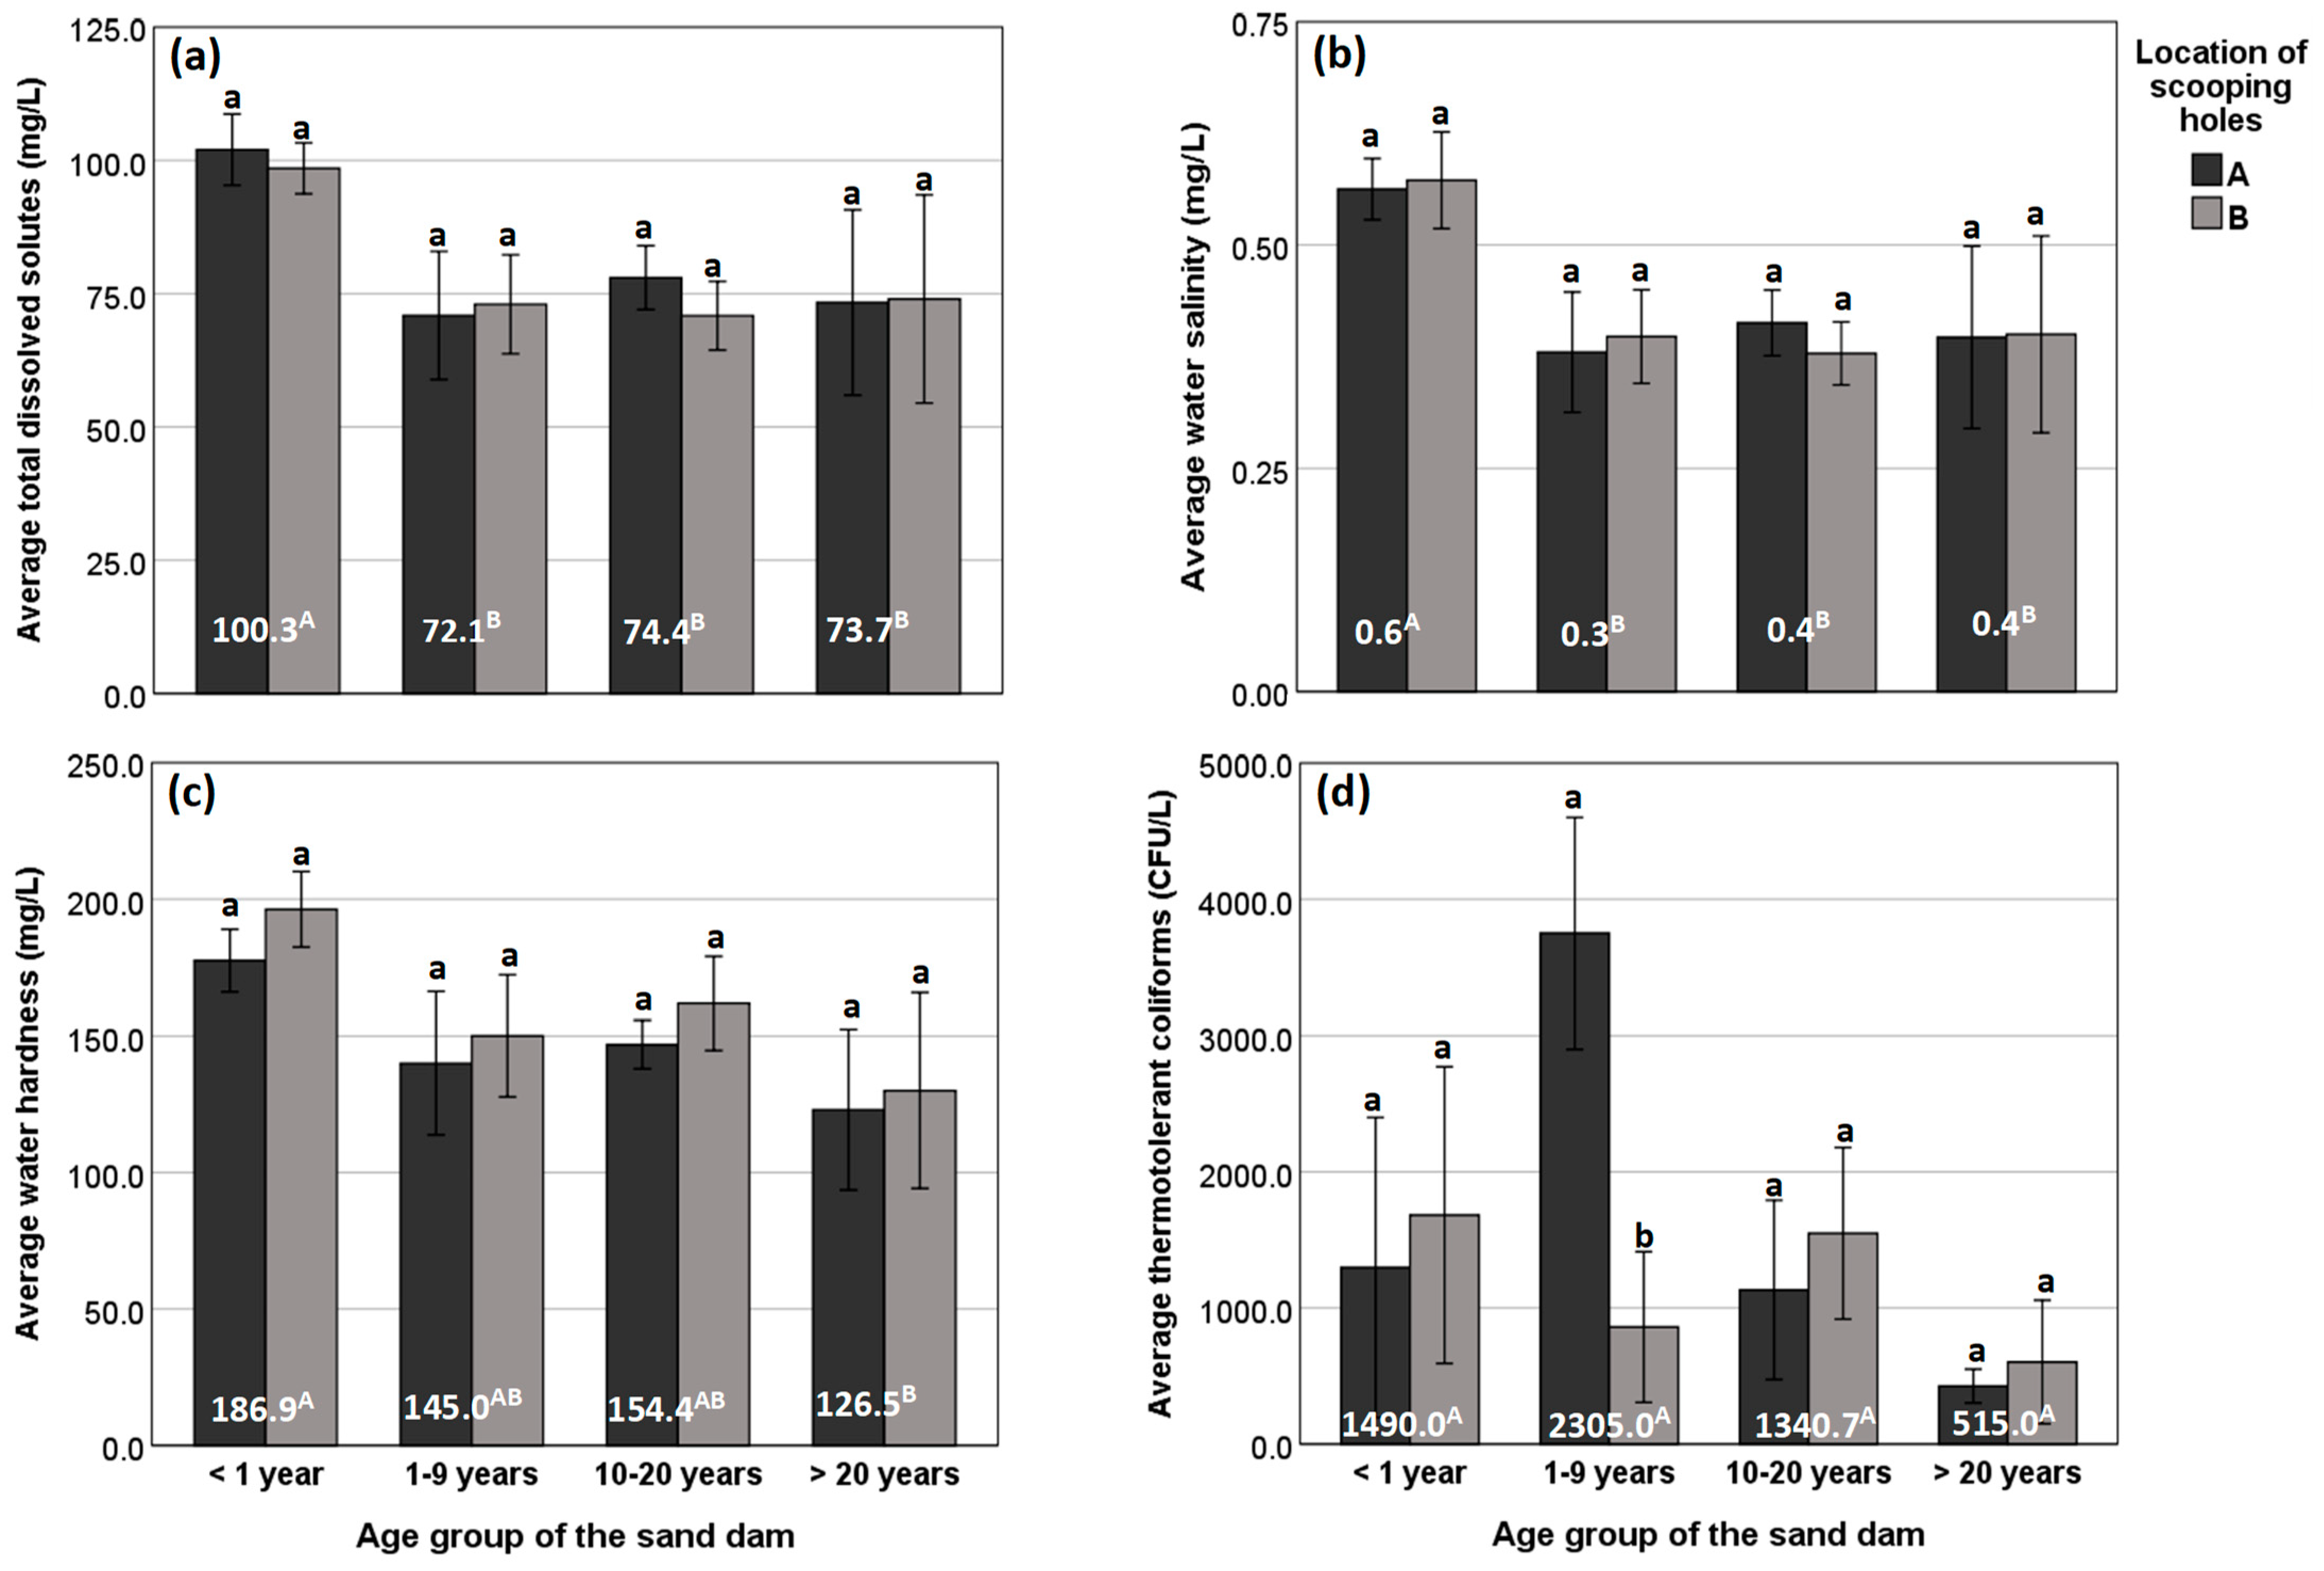
Chemical and Microbial Properties of Water as Influenced by Sand Dam Age and Location of Scooping Holes
4. Discussion
Chemical and Microbial Properties of Water as Influenced by Sand Dam Age and Location of Scooping Holes
5. Conclusions
Author Contributions
Funding
Data Availability Statement
Acknowledgments
Conflicts of Interest
References
- Kumar, S.; Kumar, N.; Vivekadhish, S. Millennium development goals (MDGS) to sustainable development goals (SDGS): Addressing unfinished agenda and strengthening sustainable development and partnership. Indian J. Community Med. 2016, 41, 1–4. [Google Scholar] [CrossRef] [PubMed]
- Nyagwencha, J.M.; Kaluli, J.W.; Home, P.G.; Hunja, M. Water and water-borne diseases in North Masaba District, Kenya. J. Agric. Sci. Technol. 2015, 14, 114–127. [Google Scholar]
- Cissé, G. Food-borne and water-borne diseases under climate change in low- and middle-income countries: Further efforts needed for reducing environmental health exposure risks. Acta Trop. 2019, 194, 181–188. [Google Scholar] [CrossRef]
- Chakraborty, R.; Khan, K.M.; Dibaba, D.T.; Khan, M.A.; Ahmed, A.; Islam, M.Z. Health implications of drinking water salinity in coastal areas of Bangladesh. Int. J. Environ. Res. Public Health 2019, 16, 3746. [Google Scholar] [CrossRef] [PubMed]
- WHO. Guidelines For Drinking-Water Quality, 4th ed.; World Health Organization: Geneva, Switzerland, 2017.
- Emadodin, I.; Reinsch, T.; Taube, F. Drought and desertification in Iran. Hydrology 2019, 6, 66. [Google Scholar] [CrossRef]
- Kalele, D.N.; Ogara, W.O.; Oludhe, C.; Onono, J.O. Climate change impacts and relevance of smallholder farmers’ response in arid and semi-arid lands in Kenya. Sci. Afr. 2021, 12, e00814. [Google Scholar] [CrossRef]
- Rentier, E.S.; Cammeraat, L.H. The environmental impacts of river sand mining. Sci. Total Environ. 2022, 838, 155877. [Google Scholar] [CrossRef]
- Karienye, D.; Macharia, J. Adaptive Capacity to mitigate climate variability and food insecurity of rural communities along Rover Tana Basin, Kenya. In African Handbook of Climate Change Adaptation; Oguge, N., Ayal, D., Adeleke, L., da Silva, I., Eds.; Springer Nature: Cham, Switzerland, 2021; pp. 49–60. [Google Scholar] [CrossRef]
- UNICEF. Water Scarcity. 2022. Available online: https://www.unicef.org/wash/water-scarcity/ (accessed on 9 April 2022).
- Neufeld, D.G.; Muli, J.; Muendo, B.; Kanyari, J. Assessment of water presence and use at sand dams in Kenya. J. Arid Environ. 2021, 188, 104472. [Google Scholar] [CrossRef]
- Ritchie, H.; Eisma, J.A.; Parker, A. Sand Dams as a Potential Solution to Rural Water Security in Drylands: Existing Research and Future Opportunities. Front. Water 2021, 3, 651954. [Google Scholar] [CrossRef]
- Ryan, C.; Elsner, P. The potential for sand dams to increase the adaptive capacity of East African drylands to climate change. Reg. Environ. Chang. 2016, 16, 2087–2096. [Google Scholar] [CrossRef]
- Maddrell, S.R. Sand Dams: A Practical & Technical Manual; Excellent Development Limited: London, UK, 2018; pp. 1–158. [Google Scholar]
- Stringer, L.C.; Mirzabaev, A.; Benjaminsen, T.A.; Harris, R.M.; Jafari, M.; Lissner, T.K.; Stevens, N.; Tirado-von Der Pahlen, C. Climate change impacts on water security in global drylands. One Earth 2021, 4, 851–864. [Google Scholar] [CrossRef]
- Quinn, R.; Avis, O.; Decker, M.; Parker, A.; Cairncross, S. An assessment of the microbiological water quality of sand dams in southeastern Kenya. Water 2018, 10, 708. [Google Scholar] [CrossRef]
- Neufeld, D.G.; Muendo, B.; Muli, J.; Kanyari, J. Coliform bacteria and salt content as drinking water challenges at sand dams in Kenya. J. Water Health 2020, 18, 602–612. [Google Scholar] [CrossRef]
- Kitheka, J.U. Seasonal river channel water exchange and implications on salinity levels in sand dams: Case of semi-arid Kitui Region, Kenya. J. Environ. Earth Sci. 2016, 6, 66–85. [Google Scholar]
- Ndekezi, M.; James, W.K.; Patrick, G.H. Evaluation of sand-dam water quality and its suitability for domestic use in arid and semi-arid environments: A case study of Kitui-West Sub-County, Kenya. Int. J. Water. Resour. Environ. Eng. 2019, 11, 91–111. [Google Scholar] [CrossRef]
- Ndunge, D.; Mbuge, D.O.; Omuto, C.T. Protocol for Evaluating Sand Dam Water Quality in Semi-Arid Areas: A Case Study of Makueni County International organization of Scientific Research. IOSR J. Eng. 2019, 9, 1–14. [Google Scholar]
- Yifru, B.A.; Kim, M.G.; Lee, J.W.; Kim, I.H.; Chang, S.W.; Chung, I.M. Water storage in dry riverbeds of arid and semi-arid regions: Overview, challenges, and prospects of sand dam technology. Sustainability 2021, 13, 5905. [Google Scholar] [CrossRef]
- Fadiran, A.O.; Dlamini, S.C.; Mavuso, A. A comparative study of the phosphate levels in some surface and ground water bodies of Swaziland. Bull. Chem. Soc. Ethiop. 2008, 22, 197–206. [Google Scholar] [CrossRef]
- Ward, M.H.; Jones, R.R.; Brender, J.D.; De Kok, T.M.; Weyer, P.J.; Nolan, B.T.; Villanueva, C.M.; Van Breda, S.G. Drinking water nitrate and human health: An updated review. Int. J. Environ. Res. Public Health 2018, 15, 1557. [Google Scholar] [CrossRef] [PubMed]
- Seo, M.; Lee, H.; Kim, Y. Relationship between Coliform bacteria and water quality factors at weir stations in the Nakdong River, South Korea. Water 2019, 11, 1171. [Google Scholar] [CrossRef]
- Bailly, J.S.; Vinatier, F.; Belaud, G.; Combemale, D. Vegetation patch effects on flow resistance at channel scale. In Proceedings of the 36th IAHR World Congress, Hague, The Netherlands, 28 June–3 July 2015; Available online: https://core.ac.uk/reader/52624000 (accessed on 24 January 2022).
- Méndez-Barroso, L.A.; Rivas-Márquez, J.A.; Sosa-Tinoco, I.; Robles-Morúa, A. Design and implementation of a low-cost multiparameter probe to evaluate the temporal variations of water quality conditions on an estuarine lagoon system. Environ. Monit. Assess. 2020, 192, 710. [Google Scholar] [CrossRef] [PubMed]
- WHO. Guidelines for Drinking Quality Water, 3rd ed.; WHO: Geneva, Switzerland, 1997.
- APHA. Standard Methods for the Examination of Water and Wastewater, 20th ed.; American Water Works Association and Water Environmental Federation: Washington, DC, USA, 1998. [Google Scholar]
- Royston, P. Remark AS R94: A remark on algorithm AS 181: The W-test for normality. J. R. Stat. Soc. 1995, 44, 547–551. [Google Scholar] [CrossRef]
- R Core Team. A: A Language and Environment for Statistical Computing (Version 4.2. 0). Available online: https://www.r-project.org (accessed on 24 March 2022).
- Bates, D.; Mächler, M.; Bolker, B.M.; Walker, S.C. Fitting linear mixed-effects models using lme4. J. Stat. Softw. 2015, 67, 1–48. [Google Scholar] [CrossRef]
- WHO. Water Quality for Drinking: WHO Guidelines; World Health Organization: Geneva, Switzerland, 2011. Available online: https://apps.who.int/iris/bitstream/handle/10665/44584/9789241548151_eng.pdf (accessed on 24 January 2022).
- Wurts, W.A.; Durborow, R.M. Interactions of pH, Carbon Dioxide, Alkalinity and Hardness in Fish Ponds; Publication ID SRAC 464; KSU State Extension Specialist for Aquaculture: Paducah, Kentucky, 1992; pp. 1–4. [Google Scholar]
- Okeke, O.; Okogbue, C. Shales: A review of their classifications, properties and importance to the petroleum industry. Glob. J. Geol. Sci. 2012, 9, 75–83. [Google Scholar]
- Wynn, E.; Krieg, M.A.; Aeschlimann, J.M.; Burckhardt, P. Alkaline mineral water lowers bone resorption even in calcium sufficiency: Alkaline mineral water and bone metabolism. Bone 2009, 44, 120–124. [Google Scholar] [CrossRef]
- Lytle, D.A.; Schock, M.R. Pitting corrosion of copper in waters with high pH and low alkalinity. J. Am. Water Work Assoc. 2008, 100, 115–129. [Google Scholar] [CrossRef]
- DeZuane, J. Handbook of Drinking Water Quality, 2nd ed.; John Willey & Sons: New York, NY, USA, 1997. [Google Scholar]
- KEBS. Portable Water—Specifications. Nairobi; 2015. Available online: http://www.puntofocal.gov.ar/notific_otros_miembros/ken470_t.pdf (accessed on 22 February 2023).
- Addisu, S.; Mekonnen, M. Check dams and storages beyond trapping sediment, carbon sequestration for climate change mitigation, Northwest Ethiopia. Geoenviron. Disasters 2019, 6, 2–9. [Google Scholar] [CrossRef]
- Bacon, B.; Britton, R.S. The Pathology of Hepatic Iron Overload: A Free Radical-Mediated Process? Hepatology 1990, 11, 12–15. [Google Scholar] [CrossRef]
- Abbaspour, N.; Hurrell, R.; Kelishadi, R. Review on iron and its importance for human health. J. Res. Med. Sci. 2014, 19, 164–174. [Google Scholar]
- Ngabirano, H.; Byamugisha, D.; Ntambi, E. Effects of Seasonal Variations in Physical Parameters on Quality of Gravity Flow Water in Kyanamira Sub-County, Kabale District, Uganda. J. Water Resour. Prot. 2016, 8, 1297–1309. [Google Scholar] [CrossRef]
- Iqbal, F.; Ali, M.; Salam, A.; Khan, B.A.; Ahmad, S.; Qamar, M.; Umer, K. Seasonal Variations of Physico-Chemical Characteristics of River Soan Water at Dhoak Pathan Bridge (Chakwal), Pakistan. Int. J. Agric. Biol. 2004, 6, 89–102. [Google Scholar]
- McCambridge, J.; McMeekin, T.A. Relative effects of bacterial and protozoan predators on survival of Escherichia coli in estuarine water samples. Appl. Environ. Microbiol. 1980, 40, 907–911. [Google Scholar] [CrossRef]
- Hobley, L.; Summers, J.K.; Till, R.; Milner, D.S.; Atterbury, R.J.; Stroud, A.; Capeness, M.J.; Gray, S.; Leidenroth, A.; Lambert, C.; et al. Dual predation by bacteriophage and bdellovibrio bacteriovorus can eradicate Escherichia coli prey in situations where single predation cannot. J. Bacteriol. 2020, 202. [Google Scholar] [CrossRef]


Disclaimer/Publisher’s Note: The statements, opinions and data contained in all publications are solely those of the individual author(s) and contributor(s) and not of MDPI and/or the editor(s). MDPI and/or the editor(s) disclaim responsibility for any injury to people or property resulting from any ideas, methods, instructions or products referred to in the content. |
© 2023 by the authors. Licensee MDPI, Basel, Switzerland. This article is an open access article distributed under the terms and conditions of the Creative Commons Attribution (CC BY) license (https://creativecommons.org/licenses/by/4.0/).
Share and Cite
Churu, H.; Kamau, S.; Ngetich, W.; Magiroi, K.; Alkamoi, B.; Kebeney, S.; Wamalwa, F.; Mumo, J. Spatial–Temporal Influence of Sand Dams on Chemical and Microbial Properties of Water from Scooping Holes in Degraded Semi-Arid Regions. Water 2023, 15, 3207. https://doi.org/10.3390/w15183207
Churu H, Kamau S, Ngetich W, Magiroi K, Alkamoi B, Kebeney S, Wamalwa F, Mumo J. Spatial–Temporal Influence of Sand Dams on Chemical and Microbial Properties of Water from Scooping Holes in Degraded Semi-Arid Regions. Water. 2023; 15(18):3207. https://doi.org/10.3390/w15183207
Chicago/Turabian StyleChuru, Harrison, Solomon Kamau, Wilson Ngetich, Keziah Magiroi, Bonface Alkamoi, Syphyline Kebeney, Fred Wamalwa, and James Mumo. 2023. "Spatial–Temporal Influence of Sand Dams on Chemical and Microbial Properties of Water from Scooping Holes in Degraded Semi-Arid Regions" Water 15, no. 18: 3207. https://doi.org/10.3390/w15183207