Article

Protecting Built Heritage against Flood: Mapping Value Density on Flood Hazard Maps

by
Agnes W. Brokerhof
1,
Renate van Leijen
2 and
Berry Gersonius
3,*
1
Cultural Heritage Laboratory, Cultural Heritage Agency of the Netherlands, Hobbemastraat 22, 1017 ZC Amsterdam, The Netherlands
2
Safe Heritage Programme, Cultural Heritage Agency of the Netherlands, Smallepad 5, 3811 MG Amersfoort, The Netherlands
3
Municipality of Dordrecht, Spuiboulevard 300, 3311 GR Dordrecht, The Netherlands
*
Author to whom correspondence should be addressed.
Water 2023, 15(16), 2950; https://doi.org/10.3390/w15162950
Submission received: 8 July 2023 / Revised: 5 August 2023 / Accepted: 11 August 2023 / Published: 16 August 2023
(This article belongs to the Topic Natural Hazards and Disaster Risks Reduction)

Abstract

:
This paper describes the development and trial of a method (Quick Flood Risk Scan method) to determine the vulnerable value of monuments for flood risk assessment. It was developed in the context of the European Flood Directive for the Dutch Flood Risk Management Plan. The assessment method enables differentiation of cultural heritage by cultural value and vulnerability to water from rainfall or flooding. With this method, hazard or exposure maps can be turned into risk maps showing the potential loss of cultural value in case of flooding with a particular probability. The Quick Flood Risk Scan method has been tested and validated in the City of Dordrecht, the Netherlands. This application was facilitated by an Open Lab of the SHELTER project. The trial in Dordrecht showed the potential of a simple method to prioritize monuments without calculations. The Quick Flood Risk Scan method enables even the non-expert assessor to make a preliminary qualitative assessment that can be followed by further analysis of a relevant selection of assets. It is useful as a low tier that feeds into higher tiers of a multi-level framework. The non-expert assessor may be a policy maker, an owner of a heritage asset, or an inhabitant. Nonetheless, the trial also raised several questions, ranging from where in a building valuable heritage is located and what the role of the building owner is to how policy makers implement the method and its outcomes. These questions provide relevant input for fine-tuning the method.

1. Introduction

Over the last decades, climate-related hazards have led to increasing impacts on cultural heritage assets. Cultural heritage is particularly vulnerable to the actions of such hazards [1]. Tangible losses to cultural heritage assets can be irreversible or very slow to repair, whilst intangible losses (e.g., historical or spiritual values) can lead to indirect economic losses that may include loss of livelihoods [2]. With the aim of reducing this vulnerability, global heritage organisations (UNESCO, European Union (EU), ICOMOS) have championed the integration of cultural heritage into disaster risk management [3]. UNESCO, for example, has updated the World Heritage Convention [4] to ensure its relevance in the international climate change regime. This has resulted in a Strategy for Action on Climate Change [5]. This strategy has increased alignment of the convention with the Paris Agreement, Agenda 2023, and the Sendai Framework for Disaster Risk Reduction [6]. The EU has also taken commitment to safeguard and enhance cultural heritage through its policies and programmes. The European Framework for Action on Cultural Heritage [7] sets out four principles and five main areas of action, including a set of actions to protect cultural heritage against natural disasters and climate change. The framework also proposes that cultural heritage should be addressed through many other EU policies beyond culture, including disaster risk management. A key policy in this regard is the EU Floods Directive [8].
The EU Floods Directive aims to reduce and manage the risks that floods pose to human health, the environment, cultural heritage, and economic activity. Among other actions, it obliges EU Member States to establish flood maps that display important objects endangered by flood, which includes cultural heritage. A couple of EU Member States have developed detailed maps on which inventoried cultural heritage assets are displayed. These include France (Plan de Prévention des Risques) [9], Switzerland (Swiss protection programme) [10], Italy [10], and the Netherlands [11]. Most of the Member States have mostly recorded asset information without data on its condition and/or value [12]. As such, there is a need to develop robust methods for risk assessment in cultural heritage [13]. This includes the need for improved survey and documentation practices to collect and organize data inventories relevant to risk reduction. A particular need, even more so outside Europe, is to also include data on its value and significance from a non-expert perspective [14].
Several authors have described methods to assess flood risk of cultural heritage at larger areas (e.g., sites, cities, and countries). Arrighi et al. [15], for example, have assessed the risk to heritage buildings in the City of Florence by assigning vulnerability classes to each cultural building category. Besides that, they have assessed the risk to art works as the annual expected number of lost artworks due to flooding. Figueiredo et al. [16] propose a framework for semi-quantitative flood risk assessment of immovable cultural heritage assets at country scale and Arrighi [1] examines the river flood risk of UNESCO tangible World Heritage sites. They follow the definition of risk being a combination of hazard, exposure, and vulnerability; however, they define these parameters slightly differently and combine the various indicators in a different manner. Hazard contains the probability of occurrence of a flood which Arrighi [1] combines with indicators for the severity of that flood in terms of flood depth and area flooded. These lead to the well-known flood hazard maps. Exposure looks at what is exposed, the assets, and their cultural value, for which they use the national listing scheme or a set of criteria used in the description of the asset. Vulnerability considers material and construction of the asset, age, condition or simply type of building, sometimes including resilience factors. Figueiredo et al. [16] include flood intensity in vulnerability to arrive at a potential impact. Exposure, including value, and vulnerability combined provide insight into potential loss or damage. Arrighi [1] classifies potential damage in a matrix with five classes. Figueiredo et al. [16] express loss in a Heritage Flood Impact index. Ultimately, flood hazard maps can be turned into risk maps indicating expected impact at a given probability of a particular severity of flood. There are also some other methods taking a different approach to assess flood vulnerability of cultural heritage [17,18,19,20].
A number of authors have developed models to assess vulnerability of immovable cultural heritage to flood in more detail. Again, the concept of vulnerability differs slightly per author. Stephenson and D’Ayala [21] look at historic buildings in the UK for which they use five vulnerability descriptors with a rating: age, listed status, number of storeys, construction, and condition. The sum of the scores for these ratings gives a vulnerability index which can be used to determine priority for flood protection. Godfrey et al. [22] describe an expert-based approach to assess the physical vulnerability of buildings to hydro-meteorological hazards in Romania. They use 17 vulnerability indicators such as floor height from ground level, foundation type and depth, building location, material, and quality of construction. Experts have weighed these indicators and the sum of the normalized weight of the indicators times their normalized scores leads to a vulnerability index for a specific building. Combining existing vulnerability curves for reinforced concrete, wooden, and brick masonry buildings generates a generic vulnerability curve. This in combination with the vulnerability index is used to generate a specific vulnerability curve representative for a particular area. Although the method was developed to allow assessment of vulnerability for situations where there is little information available, it does require a substantial input of data and opinions. Gandini et al. [23] assess the vulnerability of heritage sites towards flood events in Spain. For sites that are part of a historic city, they consider not only sensitiveness with criteria such as construction, envelope, and structural material but also adaptive capacity with criteria such as interventions made, socio-economic status, and cultural value. Figueiredo et al. [16] present a component-based flood vulnerability model for Portuguese churches. They consider components of the building and the contents in terms of materials, their susceptibility to water, and expected damage when wet. Combined with a value index, they derive at a relative damage score between 0 and 1 for various water depths. Tirzio et al. [24] have developed a method to assess the vulnerability of the earthen architecture in the City of Alzira, Spain, attributing weighted scores to sixteen parameters. This method made it possible to identify the constructive characteristics and material weathering which worsen the behaviour of structures during floods.
All these methods, whether one assesses vulnerability in more detail or not, demand a substantial amount of information about the building and its contents, additional data such as vulnerability curves, and calculations to arrive at a final comparison or ranking of heritage assets in a particular area. Contrary to the drive towards more and better data and models, this research tries to go in the opposite direction. The aim of this research is twofold: (1) refine an expert-based method for flood risk assessment in cultural heritage (termed: Quick Flood Risk Scan), and (2) field-test it in the City of Dordrecht, the Netherlands. The main innovation of the Quick Flood Risk Scan method is to derive a useful classification of potential loss of cultural value with as little information and effort as possible. When this potential loss of value of heritage assets is plotted on flood hazard maps, these maps should show potential loss at a given water depth with corresponding probability as an indication of risk in a meaningful manner. It is then for the owner or keeper of the cultural heritage asset to determine the actual risk. The Quick Flood Risk Scan method can thus be considered a preliminary risk qualification that can be used to select assets that require a more in-depth risk assessment.
The research flow consisted of several steps. The components of the Quick Flood Risk Scan method are refined with heritage experts and translated into criteria for their assessment. The refined method is first applied to existing data sets in order to test its meaningfulness in practice. Next, an actual application is conducted for a trial in Dordrecht, facilitated by the Open Lab of the SHELTER project. The trial consisted of a sample of 19 listed buildings in Dordrecht’s historic port area. Reflections are drawn from this trial on the applicability, reliability, and added value of the method. In a concluding step, the Quick Flood Risk Scan method is confronted with published methods to enrich the state-of-the-art and to identify future research needs.

2. Assessment of Vulnerable Value: Quick Flood Risk Scan

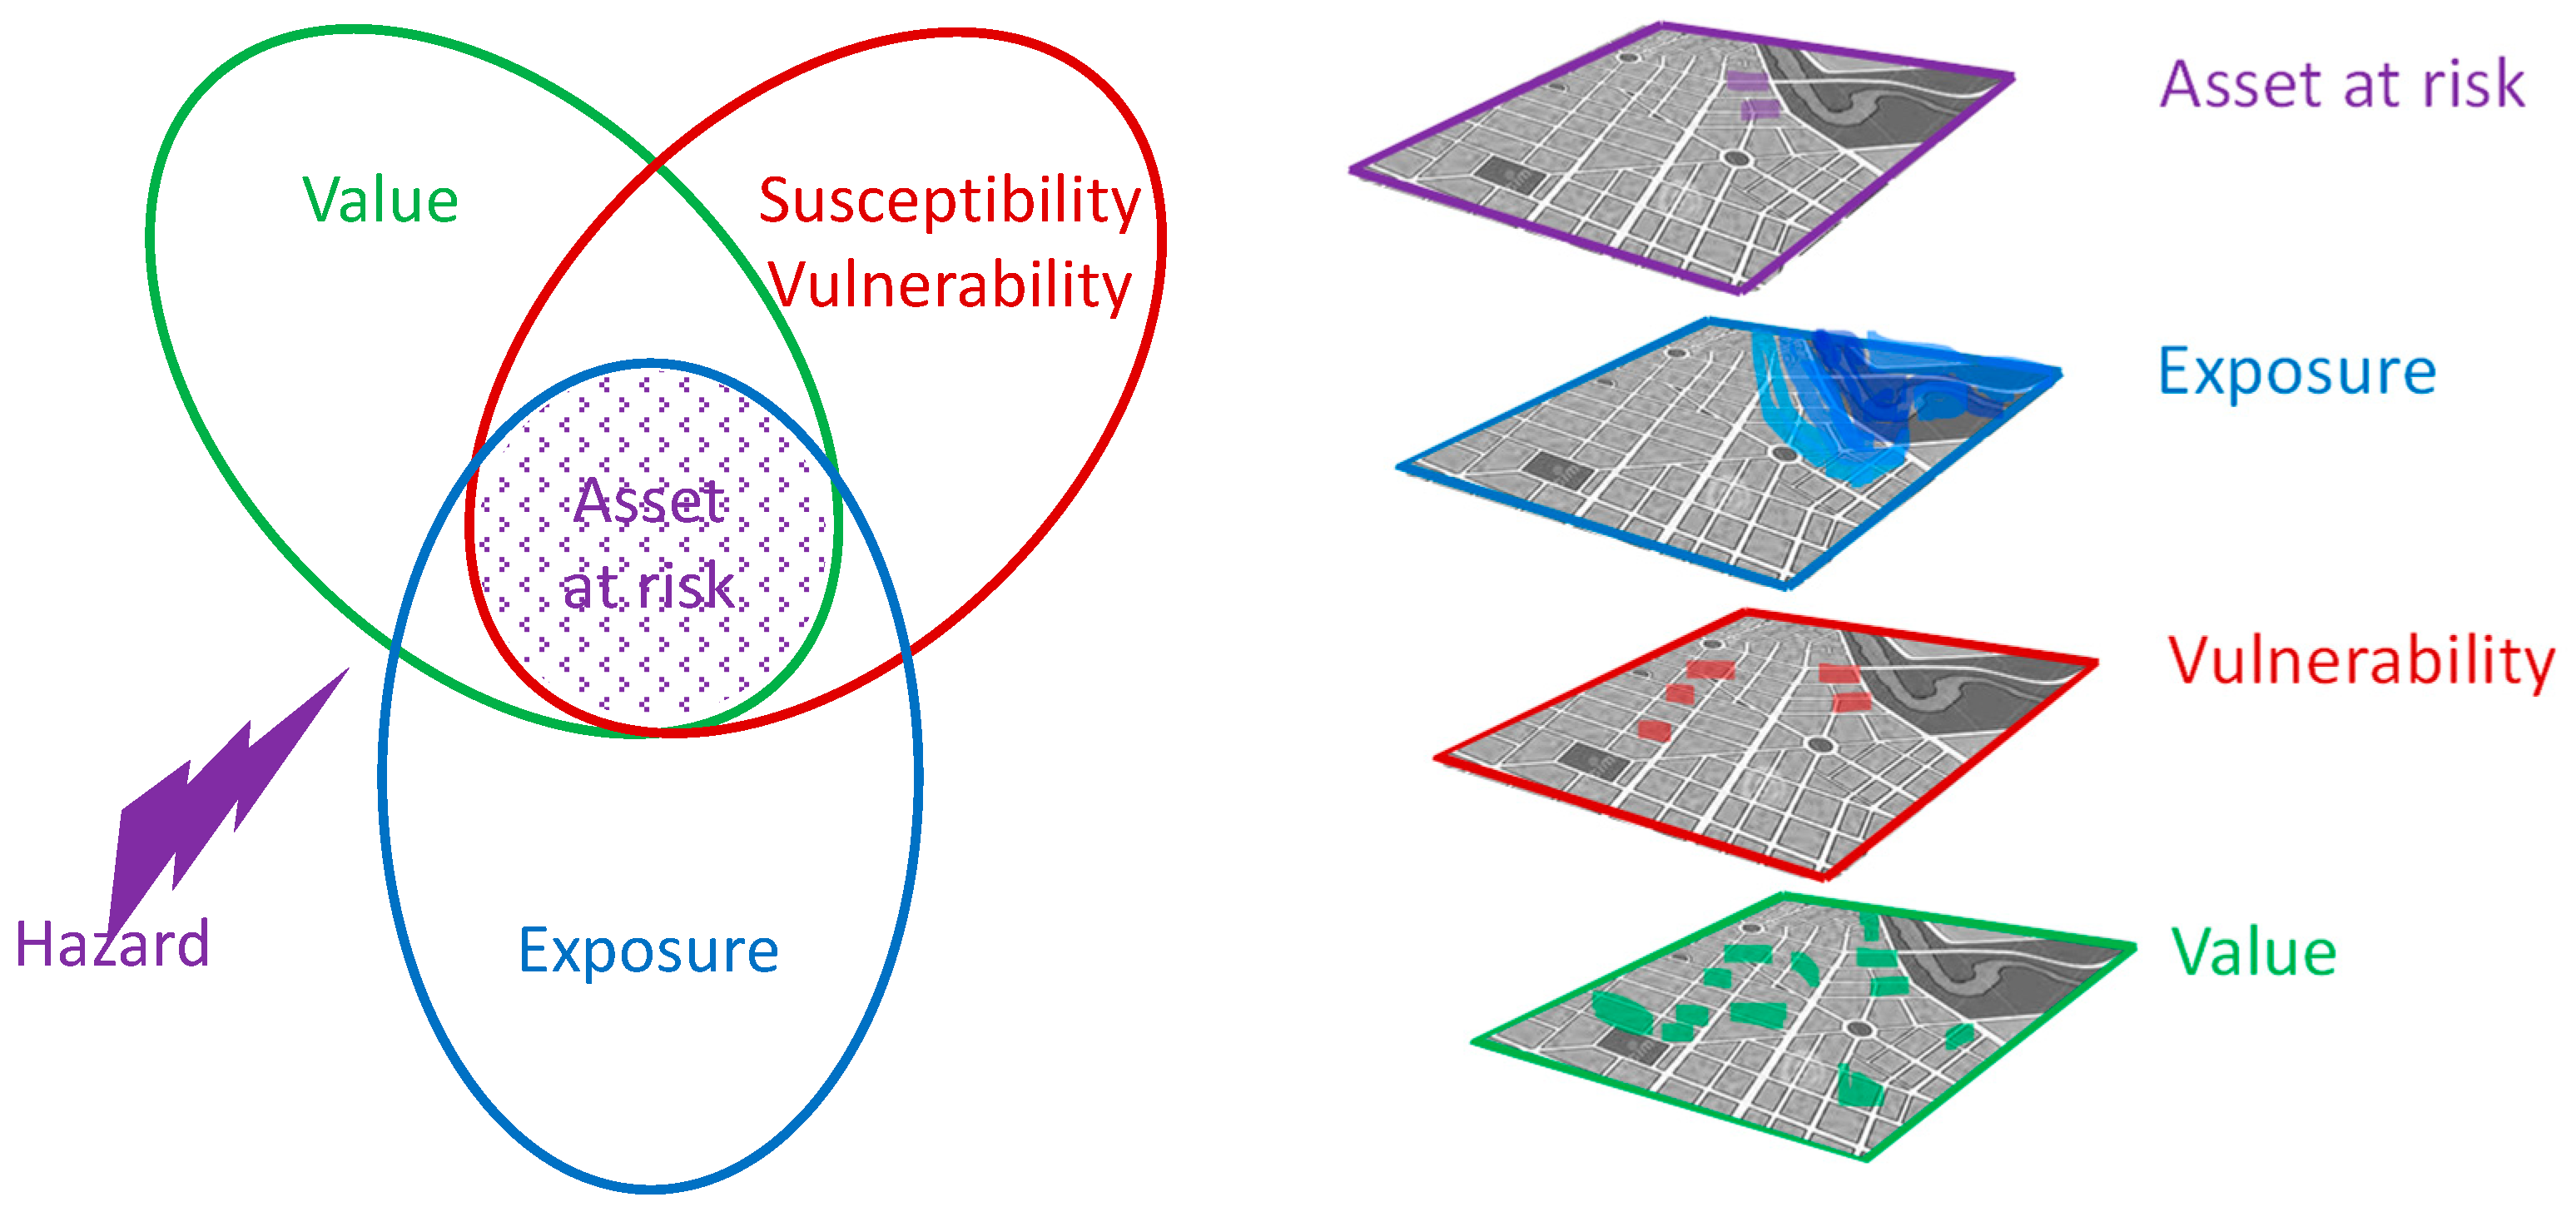
2.1. Principle behind the Method

The Quick Flood Risk Scan builds on an existing method for risk assessment in heritage collections [25] that is used in museums. It considers three components to enable simplification: vulnerability, value, and exposure (Figure 1). However, it defines these components slightly differently than the methods reviewed in the Introduction. Vulnerability is factual input which considers the physical susceptibility to water. It leaves adaptive capacity and socio-economic aspects out of the equation. Value is the subjective input. Since for the Netherlands the listing schemes do not imply a quantitative difference in value, value is quantified by considering cultural value density. This takes the value per area into account by looking at the footprint of the heritage as well as the contents of a building. Exposure looks at how the asset is exposed, the probability of particular water depths, for which hazard maps can be used.
The (existing) Quick Scan method, developed to assess risks to heritage collections [25], is based on the following key principle. A cultural asset can only be at risk (facing the possibility of loss of value) when it has value, is susceptible to a hazard, and is actually exposed to that hazard. In the context of risk management for cultural heritage, the term ‘value’ refers to cultural history values such as historic, artistic, and architectural values as well as social-societal values associated with identity and community and usability. Monetary value is not used in the assessment of loss of value but financial aspects appear in the cost-benefit analysis of risk management options [26]. No value, no loss; no susceptibility or vulnerability, no loss; no exposure, no loss. Only when ‘vulnerable value’ is exposed to the hazard can there be a loss of value. The approach could be seen as a variation to the overlaying maps of an area proposed by FEMA [27] (Figure 1). There is also similarity (methodologically) to geosite selection and geodiversity estimates, for which similar techniques have been proposed. An example is the conceptual framework for estimating geodiversity values, developed by Zakharovskyi and Németh [28,29]. This similarity provides a base for further work to provide various susceptibility maps of how cultural assets are vulnerable for various hazards (including and beyond water).
In the original method for collection care, the value of an object or collection unit is qualified as high, medium, or low within the context of the entire collection, its profile, and the organisation’s mission, vision, and objectives. As with risk matrices, one can define their own ranges for high, medium, and low. Every museum has its treasures, core collection, and support objects. In addition, vulnerability or susceptibility is qualified as high, medium, or low. Collection managers and conservators know this from experience and common sense and can find information in publications such as Brokerhof et al. [30]. A watercolour painting is highly susceptible to water; a golden ball scores low for water but high for theft, whereas the watercolour may be less attractive and therefore score low for theft. To solicit similar qualitative judgements for built heritage, expert knowledge was collected.

2.2. Refinement of the Method—Using Expert Opinion

Ranking monuments by their cultural value is not straightforward. Cultural heritage is listed because it has more than average cultural value and is worth preserving. In the Netherlands, heritage can be listed at a national, provincial, or local level. However, that does not mean that one level is more valuable than another. Even then one cannot say that a prehistoric structure has more or less significance than a medieval castle. Furthermore, not all monuments are equally vulnerable. Some are robust, constructed with concrete or brick; others have delicate plaster finishes or a wood construction. Ultimately, a high-value monument with a low vulnerability to flood may face a smaller risk than a monument with lower value but a high susceptibility to water. It is the combination of value and vulnerability that needs to be determined.
To investigate whether the experts who are responsible for the heritage listing would be able to rank the national monuments, by cultural value and/or vulnerability to flooding, two workshops were organised with the Cultural Heritage Agency’s regional advisors. They provide support to local authorities about listings, possibilities for changes or repurposing, and restoration and subsidy requests and are familiar with most monuments in their region. At the workshop, they were given a set of images of a range of different types of monuments with the task of ranking them according to ‘vulnerable value’ and provide arguments for the ranking. One group, which incidentally contained many architecture historians, ranked mainly according to significance and rarity. The other group, which contained more building engineers, ranked by material, construction, and susceptibility. Without intending to do so, the two groups provided the arguments for both value and vulnerability. The susceptibility was ranked according to building material and strength of the construction. Interestingly, value was attributed not just by historic, artistic, or architectural significance but took type, footprint, size, and content of buildings into account as well. This was in agreement with the seven parameters of Stephenson and D’Ayala [21]. The incorporation of these aspects allowed for a simplification of an otherwise possibly difficult and subjective process of differentiating value. The workshops led to the conclusion that the concentration of value on an area, or the ‘value density’, and the associated loss of value could be used to categorize monuments.

2.3. The Refined Method: Quick Flood Risk Scan

The outcome of the workshops was a matrix describing three classes for value density on the one hand and three classes for vulnerability on the other (Figure 2). The definition of the criteria for value density and vulnerability was further inspired by publications on the vulnerability of historic buildings [21] and earthquake risk in Germany [31].

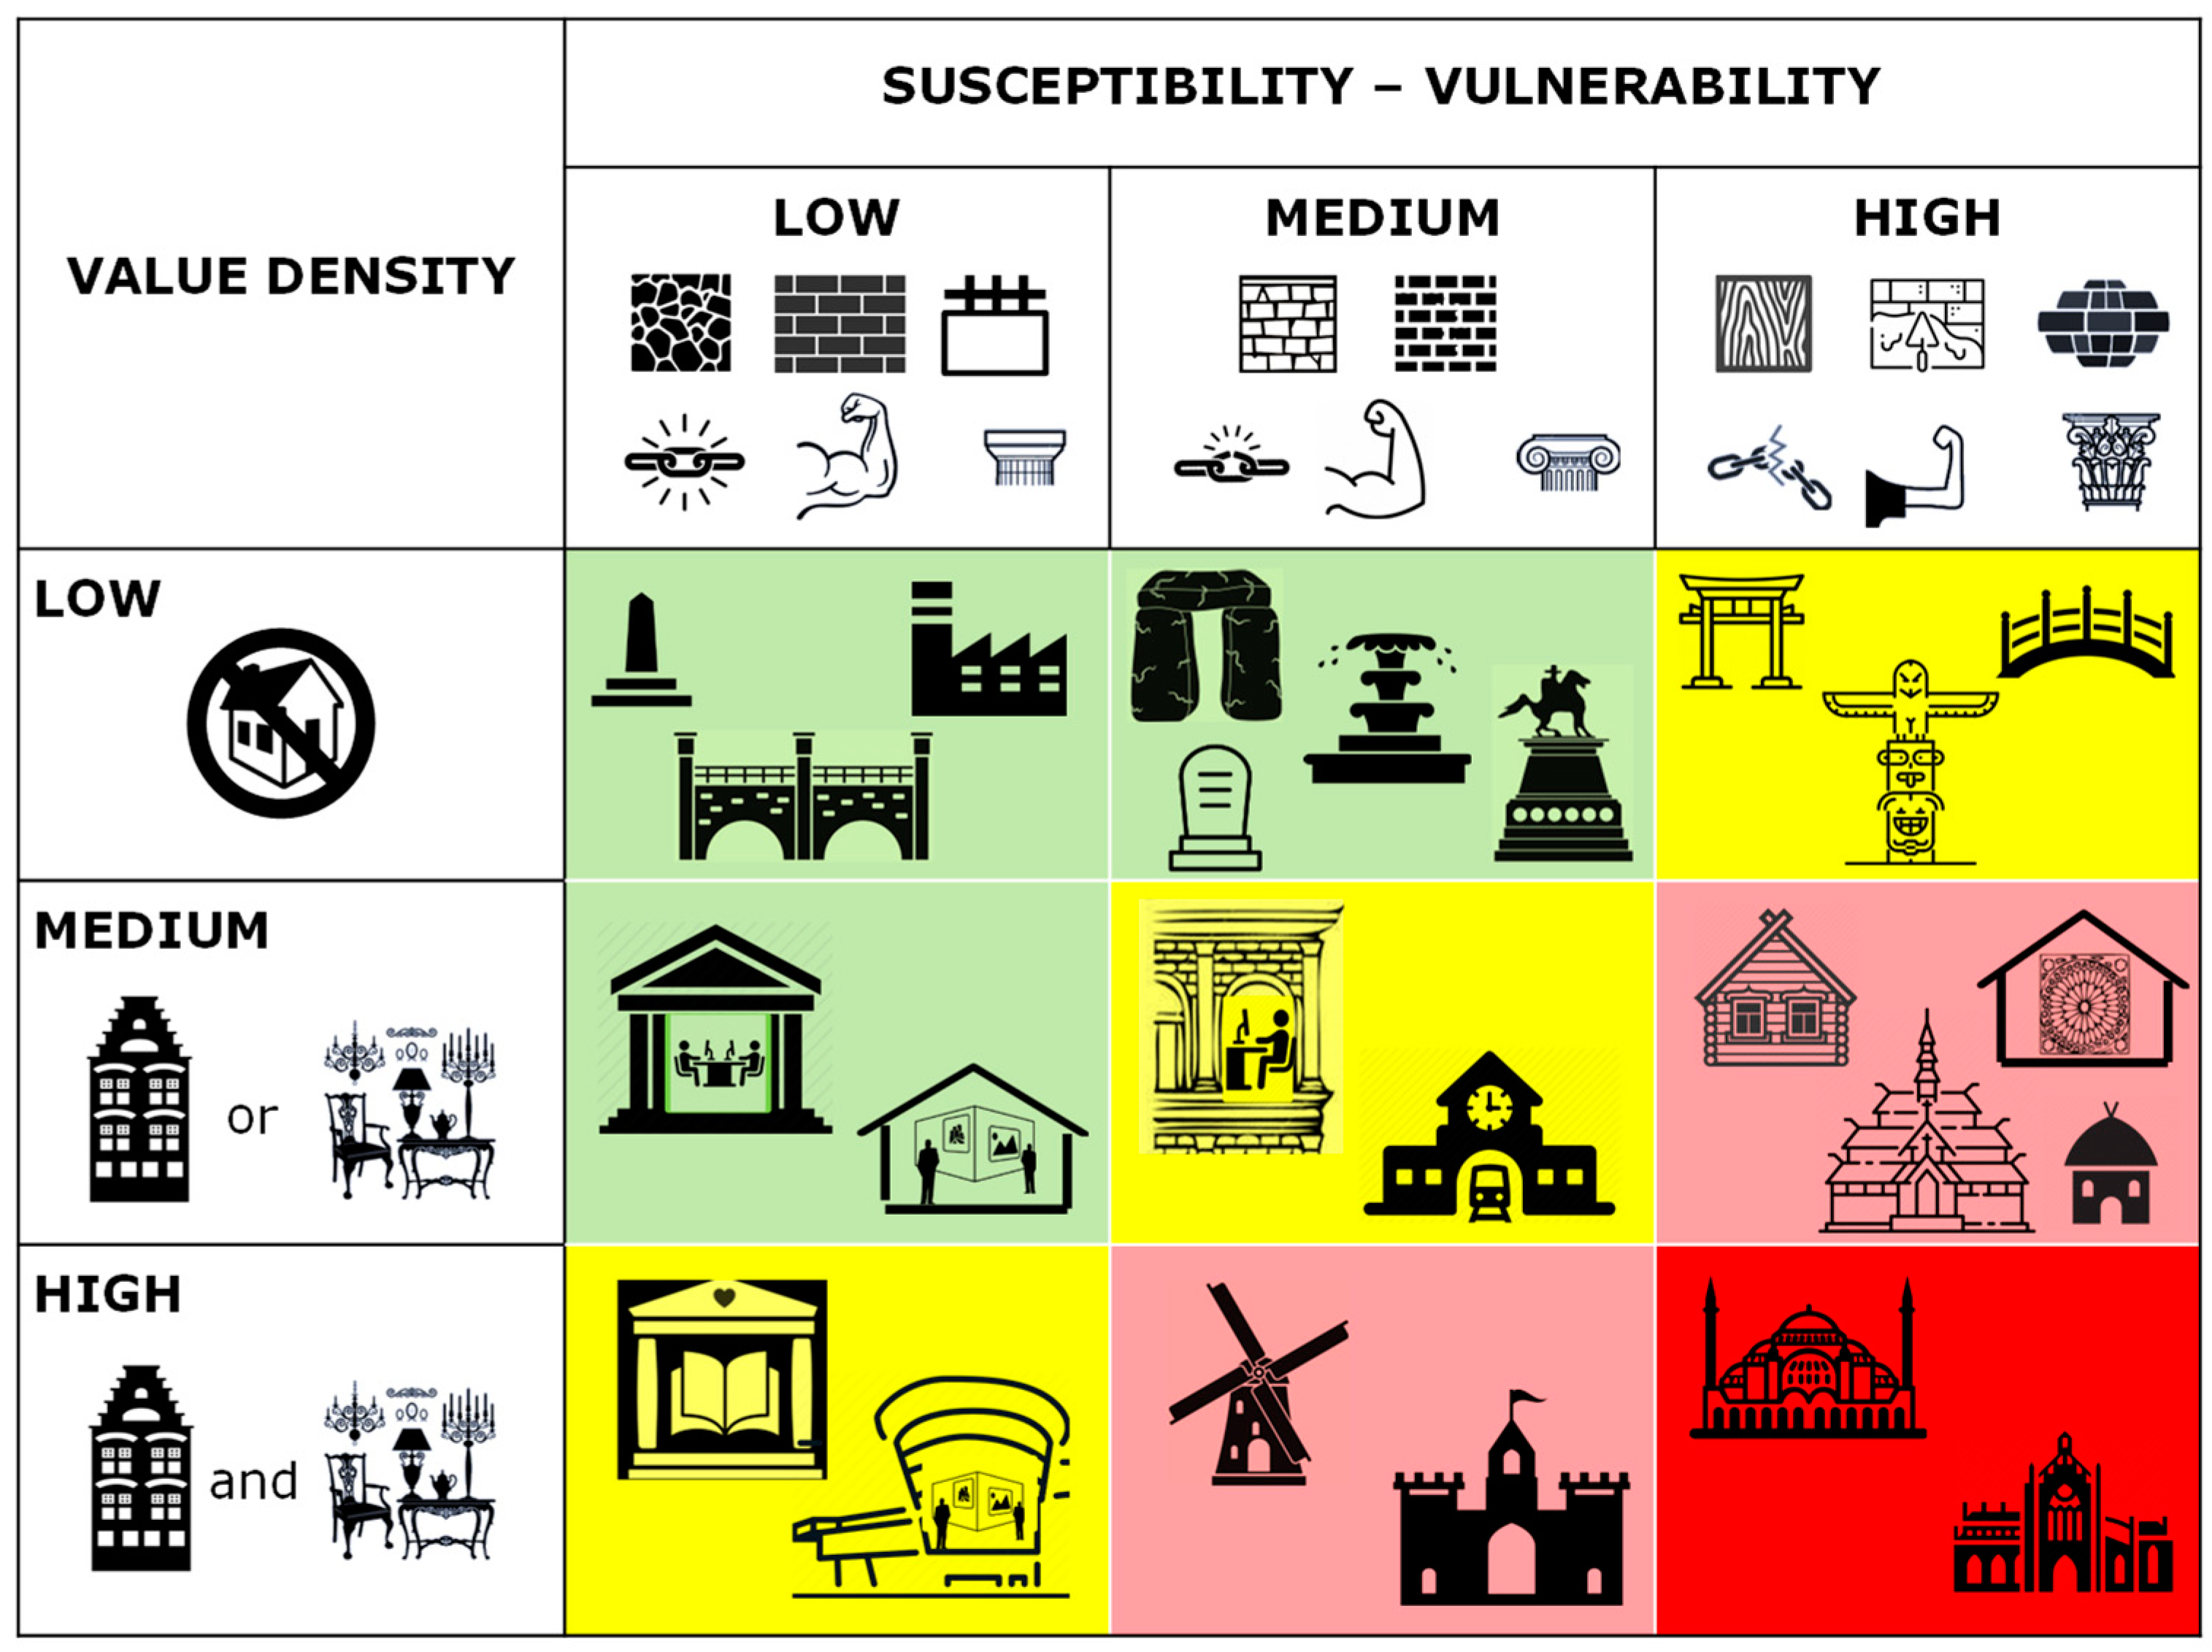
2.3.1. Value Density

The value density incorporates the concepts of footprint, height of the building, function, and significance. There are three classes:
Low:
A monument that is not a building but a man-made structure above ground that cannot be entered such as street furniture, border markers, tombstones, bridges.
 
A building that has lost its original function; it can be an empty building or a building that is listed because of its original function and design but does not function as such any longer, for example, bunkers, fortification towers, brick factory, sheds.
Medium:
A significant building with an insignificant interior or content; the building is listed because of its architectural-historic value while the interior is no longer original or has been adapted to a new function, for example, a historic house that is adapted to modern living comfort, a modernised farmhouse, a repurposed windmill.
 
A significant interior or content in an insignificant building; the building is listed because of the cultural value of its interior design or the moveable heritage inside, such as a museum in a modern building.
High:
A significant building with a significant interior or content; both the building and the interior or moveable heritage inside have cultural value, for example, historic house museums, castles, country estates, and in the Netherlands, certainly the Rijksmuseum.
Although rarity alone does not make something valuable, it is a value-magnifying factor. A building with a relatively low value density can be upgraded if it is one of a kind as long as convincing arguments are provided.

2.3.2. Vulnerability

In the context of the Quick Flood Risk Scan method, vulnerability is defined as sensitivity or susceptibility, leaving adaptive capacity out of the equation. Vulnerability is determined by construction and material. The weakest link determines the overall vulnerability. The three classes are:
Low:
Concrete, hard stone, robust material and construction, in reasonable to good condition, probably relatively young (for example >1900);
Medium:
Softer, more porous stone, older monuments in a suboptimal condition, low-quality masonry;
High:
Plaster, adobe and wood, either used inside or outside, with finer details then the other vulnerability classes.
Age and condition or state are magnifying factors for vulnerability. Age and proven robustness of old buildings can be an indication of their low vulnerability. Younger buildings can be built with low-sensitivity materials but a highly sensitive construction. A bad condition generally increases vulnerability. Alternatively, a recent restoration or reinforcement may reduce vulnerability. Additionally, protective measures that are not described in the original listing document can reduce vulnerability.
The combination of both dimensions results in three or four ‘vulnerable value’ groups, indicating possible loss of value with traffic light colours ranging from small loss (green), to medium loss (yellow), to large loss (red), leaving the possibility for a very large loss (dark red) to prioritise further in case of many red assets (Figure 2). With this system, dots on a hazard map can be coloured to make a first step towards a risk map which provides an overview of the magnitude of potential losses without putting numbers or monetary costs to it.

3. Application of the Quick Flood Risk Scan Method

3.1. Application to Existing Data Sets

In order to test the meaningfulness of the Quick Flood Risk Scan method in practice, it was applied to existing datasets and the outcomes were compared. In their paper on a framework for flood risk assessment in Portugal, Figueiredo et al. [16] provide a list of 50 heritage buildings and sites with information on type of heritage, value index, and vulnerability class. In the supplementary material to their paper, the data of 995 assets can be found. Using depth-damage functions to estimate the potential impact of flood on cultural assets, they attribute a ‘heritage flood impact index’ (HFI) as a metric for their vulnerability model. It indicates the impact per value index of an asset at a particular return period. They present HFIs for a return period of 20, 100, and 1000 years. They state that multiplying an asset’s HFI by its value index yields an absolute index of flood impact for that asset. For 26 of the assets in their paper, the vulnerable value was assessed with the matrix of Figure 2. This assessment was based on images found on the internet from the heritage asset to estimate value density, materials, and construction. Rock art and archaeological sites were not assessed as the Quick Flood Risk Scan is not designed for these types of heritage. The outcome of the Quick Flood Risk Scan was then compared to the absolute Flood Impact Index for a return period of 1000 years, calculated by multiplying the value index with the HFI for a return period of 1000 years. In other words, the possible loss of value in a worst-case scenario, which should be comparable to the vulnerable value. The results of the comparison are presented in Table 1.
It can be seen that there are some discrepancies. In particular, pillories score low in the Quick Flood Risk Scan because of their small footprint and low density. When having to prioritize between buildings and pillories, that may not be unrealistic. In some instances, houses and churches with relatively lower value but with cultural contents score higher in vulnerable value. Robust towers are assessed as less vulnerable and score lower. Altogether, the results of a 1 h Quick Flood Risk Scan are still meaningful when compared to the more time-consuming method of Figueiredo et al. [16].
Similarly, a comparison was made with the assessment of Stephenson and D’Ayala [21]. Their vulnerability index combines value, based on listing and age, and vulnerability, considering number of storeys, material, structure, and condition. Adding up scores for five descriptive parameters, they come to a number ranging between 50 and 500. Table 2 compares their Vulnerability Index with the assessment by the Quick Flood Risk Scan for the six buildings in the study. In the Quick Flood Risk Scan, the non-listed buildings drop out as their value density is zero. The difference between the remaining three buildings is in the timber frame. The Quick Flood Risk Scan would score the timber frame higher even though it is stated to be in a better condition than the brick masonry buildings. Generally, in the Quick Flood Risk Scan method, material and construction have more weight than age. However, condition is an issue to be assessed more closely.

3.2. Field Test for the City of Dordrecht

The first opportunity to actually field-test the Quick Flood Risk Scan method arose within the EU-Horizon 2020 project: Sustainable Historic Environments holistic reconstruction through Technological Enhancement and Community-based Resilience (SHELTER) [32]. The SHELTER project is organized to develop and demonstrate a highly adaptable and replicable systemic approach toward resilient transformation and reconstruction of cultural heritage. It uses a case-studies-based approach with three objectives: (i) to generate the required knowledge regarding the impact of different direct and indirect impacts in diverse typologies of heritage assets; (ii) to validate the suitability, adaptability, and replicability of the SHELTER framework, methodologies, and ICT tools to different heritage contexts. The case studies include: Ravenna (Italy), Seferihizar (Turkey), Dordrecht (Netherlands), Natural Park of Baixa Limia-Serra Do Xurés (Spain), and Sava River Basin. In the five case studies, Open Labs have been established. These labs function as participatory arenas and spaces of transformation, validation, collaboration, and cooperation among all relevant decision makers and community-based actors involved in the disaster risk management of cultural heritage.
Dordrecht is located in the Rhine and Maas delta, where several rivers merge. It is surrounded and veined with a dense network of dykes, which is termed a dyke ring in the Netherlands. The Island also features long stretches of land outside the dykes, which includes the historic port area. This area is a part of the historic city centre and includes almost 800 listed buildings, of which 430 are national listed buildings. Given its cultural heritage value, the historic port area requires extra attention for flood risk management. As flood risk increases due to accelerating sea level rise, major adaptation of the cultural heritage is potentially costly or socially unacceptable. This has to do with, among other factors, the low dynamics in the buildings and in the public space. As a result, future optimization of individual, local protection measures of buildings is limited in the historic port area. In the context of the Dutch Delta Programme [33], the municipality, water board, Rijkswaterstaat, Port Authority, and province (and, where necessary, national government) are working on a strategic adaptation agenda for this vulnerable area.
The participation structure for the Dordrecht Open Lab was articulated around seven workshops. This set-up allowed enough flexibility for co-creation and self-organisation, while also ensuring coordination and transnational learning. The Open Lab workshops contributed to: (i) knowledge extraction, (ii) requirements identification, and (iii) validation and fine-tuning of the methodologies. The core group for the Dordrecht Open Lab consisted of IHE Delft Institute for Water Education (Open Lab coordinator), the City of Dordrecht, and the Cultural Heritage Agency of the Netherlands. They validated the Quick Flood Risk Scan method on the historic port area. The validation was directed to the following research questions: (1) whether experts responsible for heritage listing are able to apply the method; (2) whether the results obtained by experts are accurate and reliable; and (3) how these results can inform policymaking for flood risk management. Answering these research questions should inform whether heritage experts can play a role in the full-scale application of the EU Floods Directive.
Two interns, guided by a heritage expert of the City of Dordrecht, applied the ‘vulnerable value’ method to assess a self-selected sample of 19 listed buildings in the historic port area (Figure 3). The selection was made to ensure variety in the sample, for example, with different functions. The selected buildings were subsequently coloured according to their vulnerable value and plotted on the exposure map of Dordrecht. The exposure map was provided by Deltares, which is an independent institute for applied research in the field of water and subsurface in the Netherlands. It gives the expected water depth in case of exceptional flood events with an occurrence of 1:10,000 years. Water depths were calculated with a SOBEK 1d2d model [34]. This model simulates flooding of unprotected areas along the main waterways. The discharge of the Rhine river was set at 16.270 m3/s at Lobith, where the Rhine enters the Netherlands. The effect of waves was not included in the simulation. The flooding results are given in Figure 2.
The assessors considered the height of the entrance and possibility for water to enter the building. That information is relevant to assess if vulnerable value will be exposed to water in case of flood. However, they could not see if there was a basement or what the situation at the back of the building was. In a country with buildings erected on dykes, often the front door is at a higher level than the back door.

4. Discussion

4.1. Reflection on the Applicability by Responsible Experts (RQ1)

The trial showed that the interns (with expert supervision) were able to assess vulnerable value from just outside observations reasonably well. However, to do a proper assessment one needs more information, amongst others about the reasons for listing, original and current function of the building, interior of the building, specific ornamental or monumental features, and maintenance or condition. Without more information, the professional advisors of the city council and of the Cultural Heritage Agency were unable to give a better-argued assessment than the interns.
An important question is who should colour the dots. In a top-down approach, local council takes the initiative and owners can request to adjust their colour based on the information they have on the entry level for water, exposed value, and measures to block water and recover value after the flood. Dordrecht has experience with their monument maps (Figure 3), where owners can add information to the file of their building. The advantage of this approach is that the assessment will be consistent with assessors interpreting criteria similarly. The disadvantage is that the assessors would have to put substantial effort into retrieving lacking information to get a useful overview.
In the bottom-up approach, all dots start green and the owners are asked if this is correct. Those that expect loss of value might be challenged to correct their colour to yellow or red with proper arguments. This could be connected with annual council tax appraisals, joined with a sustainability or energy transition project, or be a project on its own. The advantage is that owners become much more aware of the vulnerable value in their care in relation to the exposure to water. A disadvantage is the reliance on participation which may require an incentive. In addition, the consistency of the assessments could be lower which may require a check at council level.

4.2. Reflection on the Results Obtained (RQ2)

The coloured dots on the risk map indicate where loss of cultural value can occur and how big the loss can potentially be if no protective measures are taken. Showing potential loss of value feels like a more positive approach and easier to convey to the public and private owners of monuments than plotting vulnerable value as such on the map. Vulnerability is factual and can be assessed objectively. Whether an owner has a high- or low-value monument is much more subjective and more difficult to agree upon. Therefore, differentiation is not based on whether a monument ‘has a high or low vulnerable value’ but whether a monument ‘can suffer a bigger or smaller loss of value’. Explaining to an owner that they will not lose much value sounds more positive than saying the monument has a low value, even though the loss of value will be the same in the end.
Thus, a green dot on the map does not mean that the heritage is not worth protecting; instead, it means that the loss of value is expected to be smaller than the other colours and protection could have a lower priority if choices need to be made. That red dots on the map can suffer big losses is clear to everyone and it is easy to understand that their protection gets priority. This is similar to maps visualising economic loss estimates due to natural disaster, e.g., Tyagunov et al. [36] for earthquakes in Germany, Wu et al. [37] for earthquakes in China, and Zuzak et al. [38] for multiple hazards in the United States.
The colour of the dot on the risk map is a first assessment and may need to be corrected after further investigation. It is possible that the element responsible for listing is out of reach of high water, for example, a historic interior on the first floor. This is a mitigating factor due to reduced chance of exposure. This is not visible on the risk map since it only shows water depth, not height of the exposed asset. The opposite can also happen, for instance when the collection or archive is located in the basement and is expected to get flooded when water enters the building even at a low flood height. In that case, the entry point of water into the building needs to be analysed properly.

4.3. Value for Informing (Local) Policy Making (RQ3)

Most of the listed buildings in Dordrecht and the Netherlands are privately owned. Local councils will take general measures to protect communities and property within their responsibility. Monuments outside of the dyke ring and individual protection measures are the responsibility of the owner. ‘The city keeps the streets dry, the owners their houses’. Most of the monuments in the country benefit from the protection of people and economy. This is also the case in Dordrecht, where many monuments are residential buildings that have been strengthened in the past. For the time being, the city will not take additional measures to protect cultural heritage in particular.
Therefore, the question arises how coloured dots on the map of Dordrecht would inform policymaking further. The map will show which cultural heritage objects are located outside the dykes and are not protected. The city council can raise awareness and give advice on protective measures for those monuments. One could also imagine some form of financial assistance at a local, regional, or national level linked to the vulnerable value.

5. Conclusions

Contrary to the academic trend to obtain better, more precise, and more detailed insight into the vulnerability of and risks to heritage assets in flood situations, the method presented in this paper attempts to acquire a meaningful distinction between assets based on their potential to lose value yet with a minimum of information, knowledge, and effort. It should be practical in the sense that it enables even the non-expert assessor to make a preliminary qualitative assessment that can be followed by further analysis of a relevant selection of assets. It is a low tier that feeds into higher tiers of a multi-level framework. The non-expert assessor may be a policy maker, a non-professional owner of a heritage asset, or inhabitants of a certain region.
To achieve this objective, risk is defined as the possibility to lose cultural value which is expressed as the combination of value, vulnerability, and exposure. This means that the definition of the terminology used in this assessment methods differs slightly from the usual approaches. Cultural value is considered separately from exposure, it is the ‘what’ that is expected to be exposed. It is expressed in terms of value density of the asset which allows distinction between buildings with and without contents of cultural value. An additional benefit is that the value density is less subjective than value proper. Value and significance can change over time and perspective whereas value density remains unchanged regardless of a changing context. Exposure is the ‘how’ the asset will be exposed and considers water depths related to probability. Vulnerability considers the physical susceptibility of materials, structure, and decorations. The combination of vulnerability and value yields ‘vulnerable value’. Attributing scores in terms of high, medium, and low provides insight without the need for arithmetic. The advantage of this tripartite approach is that ‘vulnerable value’ maps can also be overlapped with other water hazard maps, such as exposure to ‘water on the street’ in case of heavy rain or water leaks from the main water supply or sewerage systems.
Comparing the Quick Flood Risk Scan with published methods shows that it produces results that are generally in agreement with the high, medium, low pattern of more elaborate assessments. For the speed and ease of application, that is quite good. Furthermore, more detailed methods of assessing whether an asset gets damaged by flood seem more precise, but some only consider whether the asset gets wet and do not look at secondary damage such as salt efflorescence as walls dry and mold growth due to increased relative humidity.
Indicating the possibility of a smaller or larger loss of value is easier to convey to the public and private owners of monuments than plotting vulnerable value as such on the map. The trial in Dordrecht, the Netherlands, shows the potential of a simple method to prioritize monuments without calculations. It has also brought up many questions about its implementation and application by policymakers. It is hoped that additional trials and discussions in different situations and contexts will inform further development of the method into a useful instrument for flood risk management.

Author Contributions

Conceptualization. A.W.B. and R.v.L.; methodology. A.W.B. and R.v.L.; formal analysis. A.W.B. and R.v.L.; investigation. A.W.B., R.v.L. and B.G.; data curation. A.W.B., R.v.L. and B.G.; writing—original draft preparation. A.W.B. and R.v.L.; writing—review and editing. B.G.; visualization. A.W.B. and R.v.L.; funding acquisition. B.G. All authors have read and agreed to the published version of the manuscript.

Funding

This research was partly funded by the European Union’s Horizon 2020 project SHELTER. grant agreement number 821282.

Institutional Review Board Statement

Not applicable.

Informed Consent Statement

Not applicable.

Data Availability Statement

The data presented in this study are available in this article.

Acknowledgments

The authors express their gratitude to the water and cultural heritage experts that participated in this research, who belong to the following entities: Cultural Heritage Agency of the Netherlands, Deltares, IHE-Delft, Municipality of Dordrecht and Rijkswaterstaat.

Conflicts of Interest

The authors declare no conflict of interest.

References

  1. Arrighi, C. A Global Scale Analysis of River Flood Risk of UNESCO World Heritage Sites. Front. Water 2021, 3, 764459. [Google Scholar] [CrossRef]
  2. Appiotti, F.; Assumma, V.; Bottero, M.; Campostrini, P.; Datola, G.; Lombardi, P.; Rinaldi, E. Definition of a Risk Assessment Model within a European Interoperable Database Platform (EID) for Cultural Heritage. J. Cult. Herit. 2020, 46, 268–277. [Google Scholar] [CrossRef]
  3. Durrant, L.J.; Vadher, A.N.; Teller, J. Disaster Risk Management and Cultural Heritage: The Perceptions of European World Heritage Site Managers on Disaster Risk Management. Int. J. Disaster Risk Reduct. 2023, 89, 103625. [Google Scholar] [CrossRef]
  4. UNESCO. Convention Concerning the Protection of the World Cultural and Natural Heritage. In Proceedings of the 17th Session General Conference, Paris, France, 17 October–21 November 1972; Volume 16. [Google Scholar]
  5. UNESCO. UNESCO Strategy for Action on Climate Change. In Proceedings of the General Conference 39th Session, (doc 39 C/46), Paris, France, 30 October–14 November 2017. [Google Scholar]
  6. Center, A.D.R. Sendai Framework for Disaster Risk Reduction 2015–2030; United Nations Office for Disaster Risk Reduction: Geneva, Switzerland, 2015. [Google Scholar]
  7. European Commission. European Framework for Action on Cultural Heritage; European Commission: Brussels, Belgium, 2019. [Google Scholar]
  8. European Commission. Directive 2007/60/EC of the European Parliament and of the Council of 23 October 2007 on the Assessment and Management of Flood Risks. Off. J. Eur. Union L. 2007, 288, 27–34. [Google Scholar]
  9. Garry, G.; Graszk, E.; Hubert, T.; Guyot, T. Plans de Prévention Des Risques Naturels (PPR): Risques d’inondation: Guide Méthodologique; Ministere de l’Aménagement du Territoire et de l’Environnement, Ministere de l’Équipement, Documentation Française: Paris, France, 1999.
  10. Santato, S.; Bender, S.; Schaller, M. The European Floods Directive and Opportunities Offered by Land Use Planning: CSC Report 12; Climate Service Center: Hamburg, Germany, 2013. [Google Scholar]
  11. Teruel Cano, D.; Fatorić, S.; Manders, M. The Impacts of Climate Change on Cultural Heritage in the Netherlands: A Preliminary Assessment of Exposure; Delft University of Technology: Delft, The Netherlands, 2020. [Google Scholar]
  12. Bonazza, A.; Maxwell, I.; Drdácký, M.; Vintzileou, E.; Hanus, C. Safeguarding Cultural Heritage from Natural and Man-Made Disasters: A Comparative Analysis of Risk Management in the EU; Publications Office of the European Union: Luxembourg, 2018. [Google Scholar]
  13. Romão, X.; Bertolin, C. Risk Protection for Cultural Heritage and Historic Centres: Current Knowledge and Further Research Needs. Int. J. Disaster Risk Reduct. 2022, 67, 102652. [Google Scholar] [CrossRef]
  14. Crowley, K.; Jackson, R.; O’connell, S.; Karunarthna, D.; Anantasari, E.; Retnowati, A.; Niemand, D. Cultural Heritage and Risk Assessments: Gaps, Challenges, and Future Research Directions for the Inclusion of Heritage within Climate Change Adaptation and Disaster Management. Clim. Resil. Sustain. 2022, 1, e45. [Google Scholar] [CrossRef]
  15. Arrighi, C.; Brugioni, M.; Castelli, F.; Franceschini, S.; Mazzanti, B. Flood Risk Assessment in Art Cities: The Exemplary Case of Florence (Italy). J. Flood Risk Manag. 2018, 11, S616–S631. [Google Scholar] [CrossRef]
  16. Figueiredo, R.; Romao, X.; Paupério, E. Flood Risk Assessment of Cultural Heritage at Large Spatial Scales: Framework and Application to Mainland Portugal. J. Cult. Herit. 2020, 43, 163–174. [Google Scholar] [CrossRef]
  17. Vojinovic, Z.; Hammond, M.; Golub, D.; Hirunsalee, S.; Weesakul, S.; Meesuk, V.; Medina, N.; Sanchez, A.; Kumara, S.; Abbott, M. Holistic Approach to Flood Risk Assessment in Areas with Cultural Heritage: A Practical Application in Ayutthaya, Thailand. Nat. Hazards 2016, 81, 589–616. [Google Scholar] [CrossRef]
  18. Marzeion, B.; Levermann, A. Loss of Cultural World Heritage and Currently Inhabited Places to Sea-Level Rise. Environ. Res. Lett. 2014, 9, 034001. [Google Scholar] [CrossRef]
  19. Daungthima, W.; Hokao, K. Analysing the Possible Physical Impact of Flood Disasters on Cultural Heritage in Ayutthaya, Thailand. Int. J. Sustain. Future Hum. Secur. J-SustaiNVol 2013, 1, 35–39. [Google Scholar] [CrossRef]
  20. Reimann, L.; Vafeidis, A.T.; Brown, S.; Hinkel, J.; Tol, R.S.J. Mediterranean UNESCO World Heritage at Risk from Coastal Flooding and Erosion Due to Sea-Level Rise. Nat. Commun. 2018, 9, 4161. [Google Scholar] [CrossRef]
  21. Stephenson, V.; D’ayala, D. A New Approach to Flood Vulnerability Assessment for Historic Buildings in England. Nat. Hazards Earth Syst. Sci. 2014, 14, 1035–1048. [Google Scholar] [CrossRef]
  22. Godfrey, A.; Ciurean, R.L.; Van Westen, C.J.; Kingma, N.C.; Glade, T. Assessing Vulnerability of Buildings to Hydro-Meteorological Hazards Using an Expert Based Approach–An Application in Nehoiu Valley, Romania. Int. J. Disaster Risk Reduct. 2015, 13, 229–241. [Google Scholar] [CrossRef]
  23. Gandini, A.; Egusquiza, A.; Garmendia, L.; San-José, J.-T. Vulnerability Assessment of Cultural Heritage Sites towards Flooding Events. In Proceedings of the IOP Conference Series: Materials Science and Engineering; IOP Publishing: Bristol, UK, 2018; Volume 364, p. 012028. [Google Scholar]
  24. Trizio, F.; Torrijo, F.J.; Mileto, C.; Vegas, F. Flood Risk in a Heritage City: Alzira as a Case Study. Water 2021, 13, 1138. [Google Scholar] [CrossRef]
  25. Brokerhof, A.W.; Bülow, A.E. The QuiskScan—A Quick Risk Scan to Identify Value and Hazards in a Collection. J. Inst. Conserv. 2016, 39, 18–28. [Google Scholar] [CrossRef]
  26. Luger, T.; Brokerhof, A.; Hartog, S.; Huisman, G. Assessing Museum Collections: Collection Valuation in Six Steps; Cultural Heritage Agency of the Netherlands: Amersfoort, The Netherlands, 2014; Available online: http://cultureelerfgoed.nl/publicaties/assessing-museum-collections (accessed on 28 March 2017).
  27. FEMA Understanding Your Risks–Identifying Hazards and Estimating Loss Potential. Available online: https://mitigation.eeri.org/wp-content/uploads/FEMA_386_2.pdf (accessed on 8 July 2023).
  28. Zakharovskyi, V.; Németh, K. Quantitative-Qualitative Method for Quick Assessment of Geodiversity. Land 2021, 10, 946. [Google Scholar] [CrossRef]
  29. Zakharovskyi, V.; Németh, K. Qualitative-Quantitative Assessment of Geodiversity of Western Samoa (SW Pacific) to Identify Places of Interest for Further Geoconservation, Geoeducation, and Geotourism Development. Geographies 2021, 1, 362–380. [Google Scholar] [CrossRef]
  30. Brokerhof, A.W.; Ankersmit, H.A.; Ligterink, F.J. Risk Management for Collections; Cultural Heritage Agency of the Netherlands: Amersfoort, The Netherlands, 2017; ISBN 9057992833. [Google Scholar]
  31. Center for Disaster Management and Risk Reduction Technology (CEDIM). Risk Map Germany>Earthquake Risk. Website, Karlsruhe Institute of Technology. Available online: https://www.cedim.kit.edu/english/1017.php (accessed on 10 August 2023).
  32. Technalia Shelter Website. Available online: https://shelter-project.com/ (accessed on 8 July 2023).
  33. Bloemen, P.J.T.M.; Hammer, F.; van der Vlist, M.J.; Grinwis, P.; van Alphen, J. DMDU into Practice: Adaptive Delta Management in the Netherlands. In Decision Making under Deep Uncertainty: From Theory to Practice; Springer: Cham, Switzerland, 2019; pp. 321–351. [Google Scholar] [CrossRef]
  34. Slager, K. Handboek Overstromingsrisico’s Op de Kaart: Over de Methode van Kaartproductie, Project Number 11203685-006; Deltares: Delft, The Netherlands, 2019. [Google Scholar]
  35. City of Dordrecht Monumentenkaart. Available online: https://www.monumentenzorgdordrecht.nl/monumenten/monumentenkaart (accessed on 8 July 2023).
  36. Tyagunov, S.; Grünthal, G.; Wahlström, R.; Stempniewski, L.; Zschau, J. Seismic Risk Mapping for Germany. Nat. Hazards Earth Syst. Sci. 2006, 6, 573–586. [Google Scholar] [CrossRef]
  37. Wu, J.; He, X.; Ye, M.; Wang, C. Energy and Asset Value Elasticity of Earthquake-Induced Direct Economic Losses. Int. J. Disaster Risk Reduct. 2019, 33, 229–234. [Google Scholar] [CrossRef]
  38. Zuzak, C.; Mowrer, M.; Goodenough, E.; Burns, J.; Ranalli, N.; Rozelle, J. The National Risk Index: Establishing a Nationwide Baseline for Natural Hazard Risk in the US. Nat. Hazards 2022, 114, 2331–2355. [Google Scholar] [CrossRef]
Disclaimer/Publisher’s Note: The statements. opinions and data contained in all publications are solely those of the individual author(s) and contributor(s) and not of MDPI and/or the editor(s). MDPI and/or the editor(s) disclaim responsibility for any injury to people or property resulting from any ideas. methods. instructions or products referred to in the content.
Figure 1. Principles of the (original) Quick Risk Scan method as developed for heritage collections: an asset is at risk when it has cultural value, is susceptible to a particular hazard, and is exposed to that hazard (left) and the equivalent in overlaying maps (right).
Water 15 02950 g001
Figure 2. Matrix to assess potential loss or impact (here: vulnerable value) for monuments in the Netherlands.
Water 15 02950 g002
Figure 3. Top: map of the historic port area of Dordrecht with buildings listed at national (red) and local (green) level [35]. Bottom: exposure map of the same area with the 19 buildings of the self-selected sample (dots) coloured according to their vulnerable value (given in Figure 2).
Water 15 02950 g003aWater 15 02950 g003b
Table 1. Comparison of the assessment of vulnerable value by the Quick Flood Risk Scan to the Framework presented by Figueiredo et al. [16]. Colour coding for Quick Flood Risk Scan as in Figure 2, for Figueiredo et al. classes defined: 0–15 = dark green, 16–30 = light green, 31–45 = yellow, 46–60 = light red, 61–75 = dark red.
IDDesignationTypeFigueiredo et al.Quick Flood Risk Scan
Value IndexVul ClassHFI (RP = 1000 y)Flood ImpactVal DenVulVul Val
1Mosteiro de ErmeloMonastery15A5.0075.00HMHM
2Termas Medicinais Romanas de ChavesBath house15B4.0060.00MMMM
3Capela do Anjo da GuardaChapel15B4.0060.00MMMM
4Convento de São Gonçalo de AmaranteConvent15A5.0075.00HHHH
5Igreja de Santa Maria sobre o TâmegaChurch10A5.0050.00HHHH
6Igreja Paroquial de S. NicolauChurch10A5.0050.00HHHH
7Capela de São LázaroChapel10A5.0050.00MHMH
8Igreja da Misericórdia de ConstânciaChurch10A5.0050.00HHHH
11Pelourinho de São Nicolau de CanavesesPillory15D3.0045.00LMLM
12Castelo de AlmourolCastle15C3.0045.00MMMM
14Casa Júlio ResendeHouse10B4.0040.00HMHM
15Casa dos Arcos/Casa de CamõesHouse (ruin)10B4.0040.00LHLH
16Edifício da Capitania do Porto de AveiroBuilding10B4.0040.00HMHM
17Ermida de Nossa Senhora do AmealChapel15A4.6970.35M-HHMH-HH
18Igreja da Misericórdia de Ponte de LimaChurch10A5.0050.00HHHH
19Torres de São Paulo e da CadeiaTower10B4.0040.00MLM
20Piscina de D. Afonso HenriquesBath house (ruin)15E3.0045.00LHLH
21Igreja Paroquial da Póvoa de S. AdriãoChurch15A1.4321.45HHHH
22Convento e Igreja de Santa IriaConvent15A3.6955.35HHHH
23Torre de LapelaTower15B4.0060.00ML-MML-MM
24Capela de N. S. da Penha de FrançaChapel10A5.0050.00HHHH
25Central de Captação de Água da Foz do SousaPumping station10E3.0030.00L-ML-MLL-MM
27Cruzeiro do Senhor da Boa PassagemCalvary10D3.0030.00LMM
29Cais em AbrantesPier10E3.0030.00LLLL
35Pelourinho de ConstânciaPillory10D3.0030.00LMLM
47Padrão de D. SebastiãoStone pillar10D3.0030.00LMLM
Note: Vul Class = vulnerability class; Val Den = value density; Vul = vulnerability; Vul Val = vulnerable value.
Table 2. Comparison of the assessment of vulnerable value by the Quick Flood Risk Scan to the flood vulnerability assessment by Stephenson and D’Ayala [21]. Colour coding for Quick Flood Risk Scan as in Figure 2, for Stephenson and D’Ayala classes: 50–150 = dark green, 150–250 = light green, 250–350 = yellow, 350–450 = light red, 450–500 = dark red.
IDDesignationType of BuildingVulnerability IndexQuick Flood
Risk Scan
Value DensityVulnerabilityVulnerable Value
1Barton Street. TewkesburyTimber frame residential. NL 1215/5000H0H
2Mill Bank. TewkesburyTimber frame residential. GII 2290/500MHMH
3Water Lane. WinchesterBrick masonry residential. NL177.5/5000M0H
4Kingsgate Street. WinchesterBrick masonry residential. GII327.5/500MMMM
5Riverfront. YorkBrick masonry commercial. NL185/5000M0M
6Fishergate. YorkBrick masonry commercial. GII305/500MMMM
Note: 1 NL = not listed. 2 GII = Grade II listed.
Disclaimer/Publisher’s Note: The statements, opinions and data contained in all publications are solely those of the individual author(s) and contributor(s) and not of MDPI and/or the editor(s). MDPI and/or the editor(s) disclaim responsibility for any injury to people or property resulting from any ideas, methods, instructions or products referred to in the content.

