Article

The Hydraulic and Boundary Characteristics of a Dike Breach Based on Cluster Analysis

1
Port Channel and Ocean Development Research Center, North China University of Water Resources and Electric Power, Zhengzhou 450046, China
2
Water Development Planning and Design Co., Ltd., Heze 274000, China
*
Authors to whom correspondence should be addressed.
Water 2023, 15(16), 2908; https://doi.org/10.3390/w15162908
Submission received: 24 June 2023 / Revised: 27 July 2023 / Accepted: 2 August 2023 / Published: 11 August 2023
(This article belongs to the Topic Natural Hazards and Disaster Risks Reduction)

Abstract

:
It is important to determine the hydraulic boundary eigenvalues of typical embankment breaches before carrying out research on their occurrence mechanisms and assessing their repair technology. However, it is difficult to obtain the hydraulic boundary conditions of the typical levee breaches accurately with minor or incomplete measured data due to the complexity and instability of the levee breach. Based on more than 100 groups of domestic and foreign test data of embankment/earth dam failures, the correlation between the hydraulic boundary eigenvalues of a breach was established based on the cluster analysis approach. Additionally, the missing values were imputed after correlating and fitting. Meanwhile, the hydraulic boundary parameters and the related equations of a generalized typical breach were obtained through the statistical analysis of the probability density of the dimensionless eigenvalues of the breach. The analysis showed that the width of the breach mainly ranges in 20~100 m, while the water head of the breach is 4~12 m, and the velocity of the breach is 2~8 m/s. The distribution probabilities of all them are about 64~71%. The probability density of the width-to-depth ratio and the Froude number of the breach are both subject to normal distribution characteristics. The distribution frequency of the width-to-depth ratio of 3~8 is approximately 55%, and the Froude number of 0.4~0.8 is approximately 60%. These methods and findings might provide valuable support for the statistical research of the boundary and hydraulic characteristics of the breach, and the closure technology of breach.

1. Introduction

Embankments of alluvial rivers in plain areas are mostly built by raising soil and strengthening on the original natural bank, such as on the Yellow River in China and the Jamuna River in Bangladesh, and most of them are based on natural sedimentary soil. The variability of soil distribution and geotechnical parameters of embankments is relatively large [1], which makes embankments often face risk of collapse under special hydraulic conditions during flood season. A flood disaster caused by a dike breach not only threatens the lives and property of residents along the river, but also seriously affects the stability of the surrounding society and regional economic development [2]. River dikes are limited by design conditions and are also affected by external environmental conditions that can shorten their service life, and they can be broken by various trigger factors, especially under extreme storm and flood conditions [3,4]. To avoid the destruction caused by accidental levee damage to a floodplain, understanding the mechanism of a breach and seeking to reduce the flood hazard are issues of great concern to water conservancy workers.
The occurrence of a dike collapse is a random process that is affected by river flow, embankment soil and various sporadic factors. Different dam breaks have different hydraulic boundary characteristics, and these characteristics are also related to the occurrence and duration of a dam break; therefore, determining the shape and size of the fracture is a very complicated river observation and research problem. In the design of scientific research and blocking technology related to embankment collapses, it is usually necessary to work on a specific or representative typical fracture; therefore, an analysis of the typical hydraulic boundary feature values for a relatively common dam breach is necessary to study a model test of a breach or to assess the risk of a breach flood.
Embankment collapse remains one of the focus topics concerned by academics and technology engineers in worldwide. The purpose of the collapse simulation is to establish a physical or mathematical model and to simulate the state and the movement property of the breach so as to carry out risk assessment and to publish an early warning of flood disaster. There are mainly two types of simulation methods on the breach:
Firstly, according to the actual hydraulic boundary conditions of an existing levee, a dynamic or fixed bed model is established to study the hydraulic characteristics of the development of a crater or a clogging period. For example, The US Army Engineers Research and Development Center [5] established a 1:50 SacramentoRiver Delta embankment model in 2011 to simulate the development of a breach and proposed a new rapid plugging technology (RRLB). RRLB technology was used to simulate the process of fracture sealing in the model test of a collapse. Tian et al. [6] carried out a hydraulic test of a moving bed using the established Yellow River embankment collapse model and carried out research on the shape change law of the mouth of the breach. Li and others [7] established a three-dimensional numerical model of a river embankment breach in Jiangxi Province based on FLOW-3D software. A numerical simulation of the blocking process of the vertical plugging method and the flat plugging method was carried out, and the water level change and velocity field distribution near the breach during the plugging process were obtained.
Secondly, based on experience, the typical hydraulic boundary conditions of a breach are used to establish a generalized fracture model to carry out research. To verify the feasibility of the new clogging technology, the US Army Engineers Research and Development Center [5] established a 1:16 (partial and overall) generalization model (prototype embankment with a width of 80 ft, water depth of 20 ft, and mouth water head maximum of 18.5 ft). Xia et al. [8] established a generalized fracture model with a given fracture width and water depth under the condition of neglecting some boundary factors (dike soil quality, crater foot, door-to-door ratio, etc.), and carried out a simulation study on the characteristics of the collapsed water flow, including inside and outside the dike. The hydraulic model experiments carried out by Soares [9] and Bellos [10] revealed the characteristics of flood waves under different conditions. The above two methods were used in the study of collapse or plugging tests, and certain specific test results were obtained. However, because the fracture model is designed according to an actual fracture design or by empirical generalization, the representativeness and persuasiveness of the research object are insufficient. It is necessary to obtain a representative characteristic value of the hydraulic boundary of the breach based on a large amount of existing fracture data and use it as a scientific basis for the study of the fracture.
Although there are many data on crater records, there are few valuable hydraulic boundary data, and there are many missing, and these missing values are exactly what are needed in this research. Hence, there is a need for statistical analysis principles to fill in missing values fit through the establishment of a number of algorithms. At present, research on breach-parametric statistical analysis is also limited, but in other areas, there are similar studies on a random amount of missing data. For example, Mohammad et al. [11] used the game theory rough set (GTRS) model to improve the original three-way clustering method to address missing values in clusters. Although improved methods may yield fairly good estimates, they usually require a longer estimation time than statistical methods. Tsai et al. [12] used numerical, classification and mixed data types for experimental analysis. By comparison with other missing value estimation statistical methods, a class-centre method based on missing value estimation (CCMVI) was proposed, but this method lacks validation of the actual dataset. Yaser et al. [13] proposed and assessed an effective multiple linear regression analysis algorithm for missing datasets and applied it to chemometric analysis. Günther [14] used other non-numeric-based data analyses and proposed an algorithm for estimating missing values, which complements missing values by statistical methods that maximize the consistency of the dataset. This non-invasive selection technique for missing value estimates is likely to change the original nature of the dataset during the statistical process. The above methods have different characteristics for missing data estimation. For different random data, we can refer to these methods when conducting statistical analyses of the collapse parameters and missing values.
To achieve breach hydraulic boundary eigenvalue analysis and to determine the typical breach hydraulic boundary conditions, breach basic physics research and closure work are needed to affect these complex technical studies. Reasonable arguments in favour of hydraulic boundary breach experimental study conclusions are necessary for a convincing and representative model to expand the use of research results. It is beneficial to provide relatively reliable basic parameters for the design of fracture blocking technology and improve the scientific design of blocking technology. This paper aims to propose a method to scientifically determine a levee breach typical characteristic value based on the results and draw a statistical study of cluster analysis to provide the necessary technical support for research trials and closure work for technical breaches.

2. Research Object and Analysis Methods

2.1. Research Object

(1)
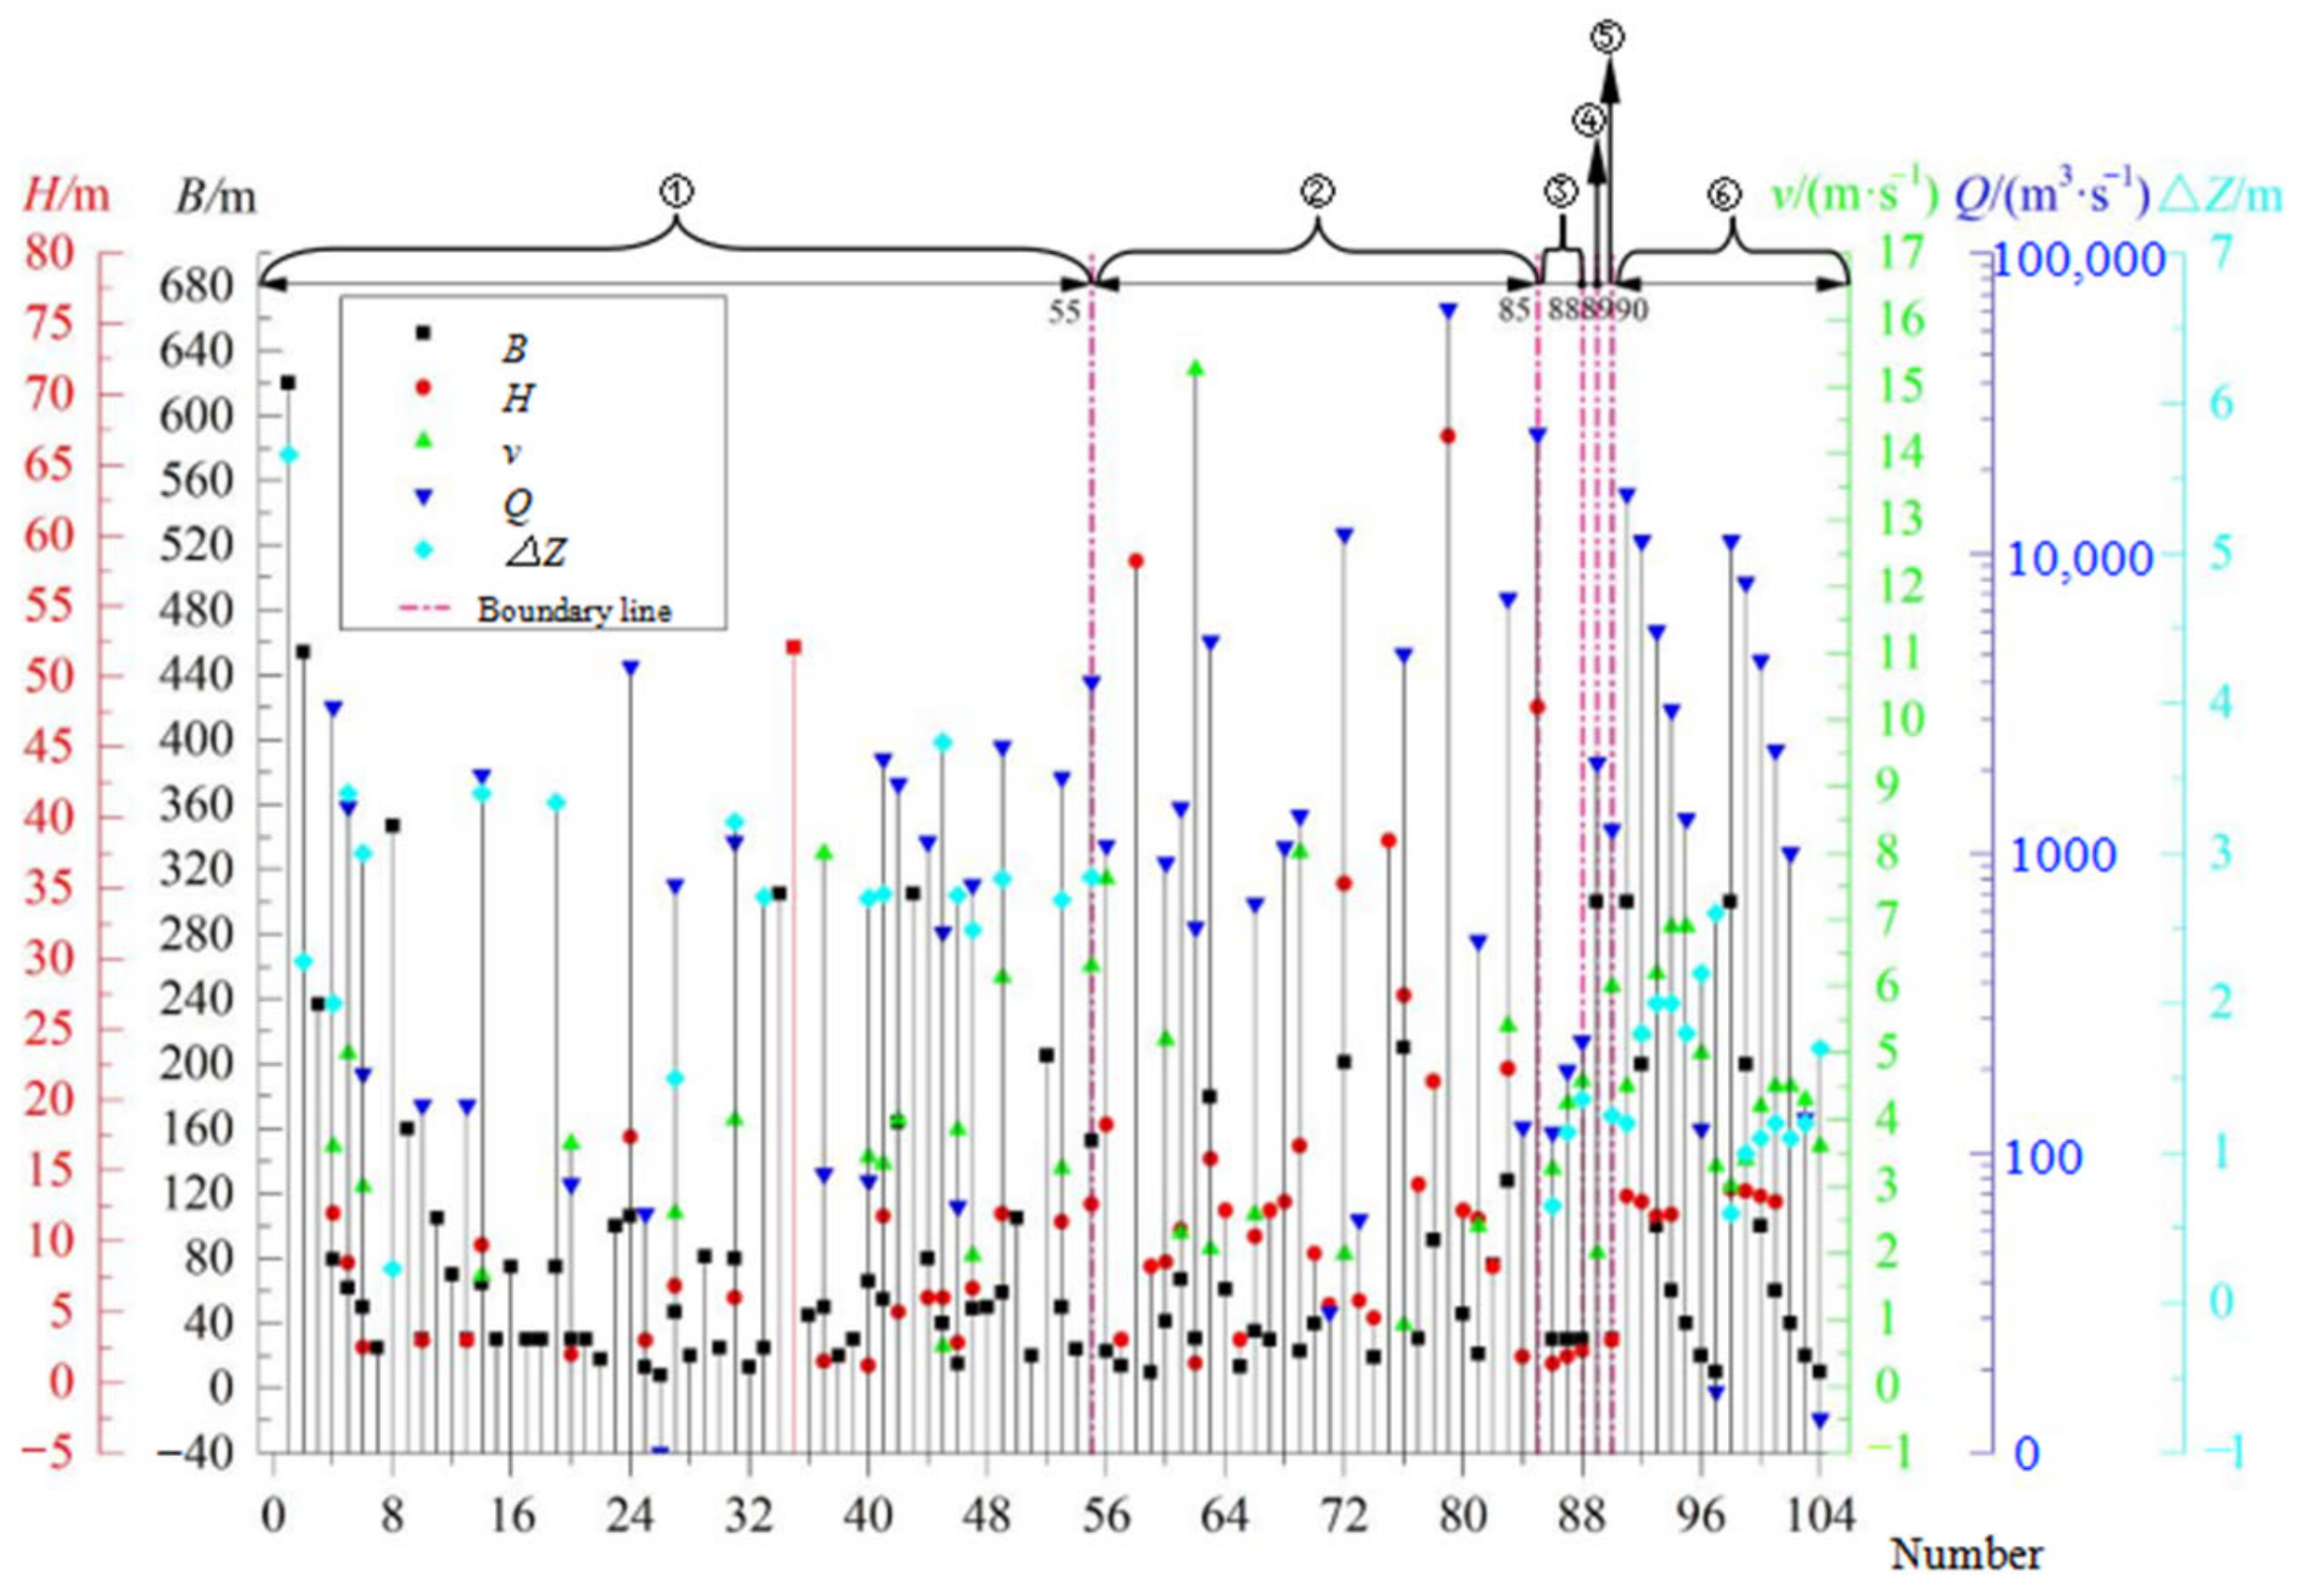
Embankment breach and developing characteristics
When a flood impacts a river embankment, the soil embankment is sometimes damaged by a flow-washing brush, forming a collapse gap (breach), and the flood rushes out from the breach of the embankment to cause a flood disaster. Generally, breach development goes through three stages: pre-, mid- and post-break, as shown in Figure 1.
Just when the breach occurs, a narrow entrance velocity gradually increases rapidly, opening the door to gradually increasing traffic. The initial collapse port is small, the water level difference between the inside and outside of the breach is large, the flow velocity increases rapidly, and the breach continues to expand laterally; when the width and depth of the breach extend to near equilibrium, the flow rate of the fracture tends to peak and enters the second stage. The water level of the crater gate will remain stable for a certain period of time, and the flow into the breach will also stabilize for a period of time. At this stage, the collapse width will reach or approach the maximum. As the water level in the beach area increases, the water level difference between the inner and outer sides of the dike will decrease, causing the fracture flow to begin to decrease and enter the third stage. The water level of the river gradually decreases and falls, and the flow rate and velocity of the fracture gradually decrease until the attenuation is near zero. Under normal conditions, the width of the fracture remains basically unchanged. The river water level decreases, the breach flow velocity gradually decreases until near zero attenuation, and the width of the breach is substantially unchanged under natural conditions. To study the hydraulic boundary characteristics of the breach, this paper mainly selects the characteristic parameters of the middle and late stages of the fracture for analysis and study.
(2)
Dike collapse characteristic value
According to the statistics of a large number of river dikes and the analysis of fracture test results, although the forms and development of a breach are different, their hydraulic boundary characteristics still have some commonalities. The generalization of the vertical and horizontal sections of a general river embankment collapse is shown in Figure 2a,b. Its main features are the hydraulic boundary breach width B, entrance head H, side slope coefficient of collapse m, the drop between the upstream and downstream of breach ΔZ, entrance velocity v, and breach flow rate Q. Its changing characteristics are shown in Figure 1. Among them, the entrance head H and the drop ΔZ have a greater influence on the fracture depth h. This paper intends to select the five characteristic values of the fracture width B, the mouth head H, velocity v, discharge Q and the drop ΔZ as the main characteristics of the fracture hydraulic boundary. The three direct variables of the width B of the mouth, the head H of the mouth and the velocity v of the mouth are combined into two dimensionless parameters: the ratio width to depth B/H and the Froude number Fr, where B/H reflects the geometry of the fracture section. Fr is used to characterize the flow state and flow intensity at the breach.

2.2. Analytical Research Methods

2.2.1. Research Ideas

Because breach data are obtained in very urgent cases, the value of each characteristic parameter is mostly incomplete, and simple mathematical statistics cannot obtain reliable statistical characteristic values for the flow and border of the breach. Therefore, this paper intends to collect domestic and international actual breach data as the basic data sources, use some model test data as the assist data to enhance the integrity of the data, and analyse the random distribution law of the hydraulic and boundary parameters of the breach by statistical principles such as cluster analysis. Through fitting analysis and correlation interpolation, the hydraulic and boundary eigenvalues of the generalized fracture and its correlation equation are determined based on the probability density statistics. The test data set that was used in fracture model was abundant and reliable. Of course, it must be noted that the scale effect of the breach model is too small to neglect because the patterns of flood evolution in a breach are the same with different model scales by estimating the scale effect of the breach model test [15,16]. Therefore, the test results data can be combined with a statistical analysis of prototype observations.

2.2.2. Specific Analysis Methods

The cluster analysis method is used to systematically cluster the scoping hydraulic boundary values of the breach, and the correlation between each eigenvalue variable is sought. The research process is shown in Figure 3. Linear or non-linear fitting analyses are performed for two sets of variables with good correlation to interpolate the missing parameters of the actual breach. The fitted eigenvalue parameter is compared with the original data for relative error analysis. If the proportion of the error is large, the fitting parameter is readjusted until the control error is within the allowable range.
Cluster analysis is a better way to find the correlation between random quantities. From the view of structural characteristics, the methods of cluster analysis are divided into partitioning methods and hierarchical methods [17]. Partitioning is the assignment of samples to a fixed number of groups whose characteristics are not known clearly but are based on a set of specified variables, which are primarily suitable for classifying large (thousands) samples. The hierarchical approach aims to reveal natural groupings in datasets, which are primarily suitable for classifying less data (fewer than a few hundred). Among them, the hierarchical clustering method is mainly divided into two categories: classification for variables (R-type clustering) and classification for individuals (Q-type clustering) [18,19].
To avoid the influence of eigenvalues on cluster analysis and correlation research due to dimensional characteristics, it is necessary to standardize the raw sample data of the breach [20]. The Z score standardization method is adopted for data standardization processing, which can make the standard deviation 1 and eliminate the influence of dimension and magnitude. Its mathematical model is:
Z i j = X i j X ¯ i j S j
where Z i j is the standardized breach variable, i = 1, 2, 3, …, m (m is the number of samples); j = 1, 2, 3, …, n (n is the number of variables); X i j is the observed data of the breach; X ¯ i j is the average value for variable j in the breach sample; and S j is the standard deviation for variable samples of the breach.
To analyse the correlation between the distance-variable variables, the Pearson correlation is taken as the metric standard to calculate the correlation coefficient between each eigenvalue. The calculation method is:
r = i = 1 m ( x i x ¯ ) ( y i y ¯ ) i = 1 m ( x i x ¯ ) 2 i = 1 m ( y i y ¯ ) 2
where m is the sample quantity. xi and yi are the values of the two variables, which were standardized with Equation (1).
After determining the correlation between the eigenvalue variables, to obtain unknown (missing) data from limited known data, it is necessary to select a variable with an intimated correlation to perform fitting regression according to the correlation coefficient. Data fitting is used to discover the correlated relationship between the amount that is found, and the most common method of least squares fitting approximation is the so-called least squares method. The principle is that given a set of observation or experimental data {(xi, yi), i = 0, 1, 2, …, m}, the best curve y = S*(x) can be found from a specific curve to ensure that the curve can fit those data most reasonably.
According to the data {(xi, yi), i = 0, 1, 2, …, m}, let yi = f(xi) (i = 0, 1, 2, …, m). Let y = S*(x) be the fitting function of the given data, and record the error δi = S*(xi) − yi(i = 0, 1, 2, …, m), δ = (δ0, δ1, …, δm)T. Let φ0(x), φ1(x), …, φn(x) be a family of linear independent functions on the continuous function space C[a,b]. Find a function S*(x) from φ = span{φ0(x), φ1(x), …, φn(x)} to minimize the sum of squared errors:
δ 2 2 = i = 0 m δ i 2 = i = 0 m [ S * ( x i ) y i ] 2 = min S ( x ) φ i = 0 m [ S ( x i ) y i ] 2
Here:
S ( x ) = a 0 φ 0 ( x ) + a 1 φ 1 ( x ) + + a n φ n ( x )
Generally, φ = span{1, x, …, xn}.
When obtaining the fitting curve by the least squares method, the form of S(x) should be determined first. This usually starts by analysing the basic characteristics of the research problem, then graphing based on existing data collected, and finally determining the form of S(xi) [21,22,23]. To find the fitted curve by the least squares method, we find a function y = S*(x) in S(x) shown as (4), which minimizes the sum of squared errors of the samples. This is needed to determine the minimum point of the multifunction (a0*,a1*,…,an*). Let the multivariate function I be:
I ( a 0 , a 1 , , a n ) = i = 0 m [ j = 0 n a j φ j ( x i ) f ( x i ) ] 2
The necessary conditions for the extremum of the multivariate function are:
I a k = 2 i = 0 m [ j = 0 n a j φ j ( x i ) f ( x i ) ] φ k ( x i ) = 0 ,   k = 0 ,   1 ,   ,   n .
By derivation, the least squares solution of function f(x) is obtained as:
S * ( x ) = a 0 * φ 0 ( x ) + a 1 * φ 1 ( x ) + + a n * φ n ( x )
After obtaining the fitting equation, a significance test for regression equations must be performed to verify the existence of an objective relationship between two variables to ensure fitting reliability. In general, the one-dimensional linear regression model uses the t test for significance testing. For the regression line y ^ = a ^ 0 + a ^ 1 x , we should test the hypothesis:
H 0 : a 1 = 0 H 1 : a 1 0
If
T = a ^ 1 σ ^ / S x x t n 2 α 2 ,
then reject the null hypothesis and accept a1 ≠ 0; otherwise, accept the null hypothesis. Here, σ ^ = S S e n 2 , S x x = ( x i x ¯ ) 2 , where SSe is called the sum of squared residuals,  S S e = i = 1 m ( y i y ^ i ) 2 .
The degree of correlation between the dependent variable y and the independent variable x can also be expressed by the determination coefficient R2 [24]:
R 2 = i = 1 m ( y ^ i y ¯ ) 2 i = 1 m ( y i y ¯ ) 2
The larger R2 means how much stronger the linear correlation between y and x is characterized by the regression curve.
Using a relative error to quantify the fitting degree, the standard of fitting values can be analysed more intuitively. The data value distributions are more random in each data group of breach collected. In this paper, the absolute value of relative errors is <0.5, which is acceptable, i.e., the relative error e calculated by Equation (9).
e = fitted   value Original   value Original   value
After the above steps, the existing sample data can be fully utilized to integrate the complete hydraulic boundary feature value of the breach. However, to improve the universality of the breach boundary value, the general rule occurring in the breach must be reflected correctly. Therefore, the fitting data interpolated above will be further treated as dimensionless, and such analyses are no longer affected by the unit of every physical quantity selected.
Since the breach eigenvalues have strong randomness and a wide distribution, the breach dimensionless parameter also has a random distribution. This conforms to the distribution characteristics of continuous random variables, that is, there must be a corresponding distribution probability in any range l within the conditional interval [a,b] where the breach may occur. To more intuitively understand the distribution characteristics of breach sample data with general features, here, the probability density function should be used to indicate the probability distribution of the dimensionless characteristic values in the breach. Assuming that the probability density function of the dimensionless eigenvalue X is a nonnegative function f(x), its probability in the interval (a,b] is provided as follows in Equation (10):
P { a < X b } = a b f ( x ) d x
Based on the formula above, the probability density distribution function f(x) of breach variable X can be obtained by mathematical statistical analysis based on the processed dimensionless data sample set.

3. Results and Discussion (Analysis of Eigenvalues of Generalized Hydraulic Boundary)

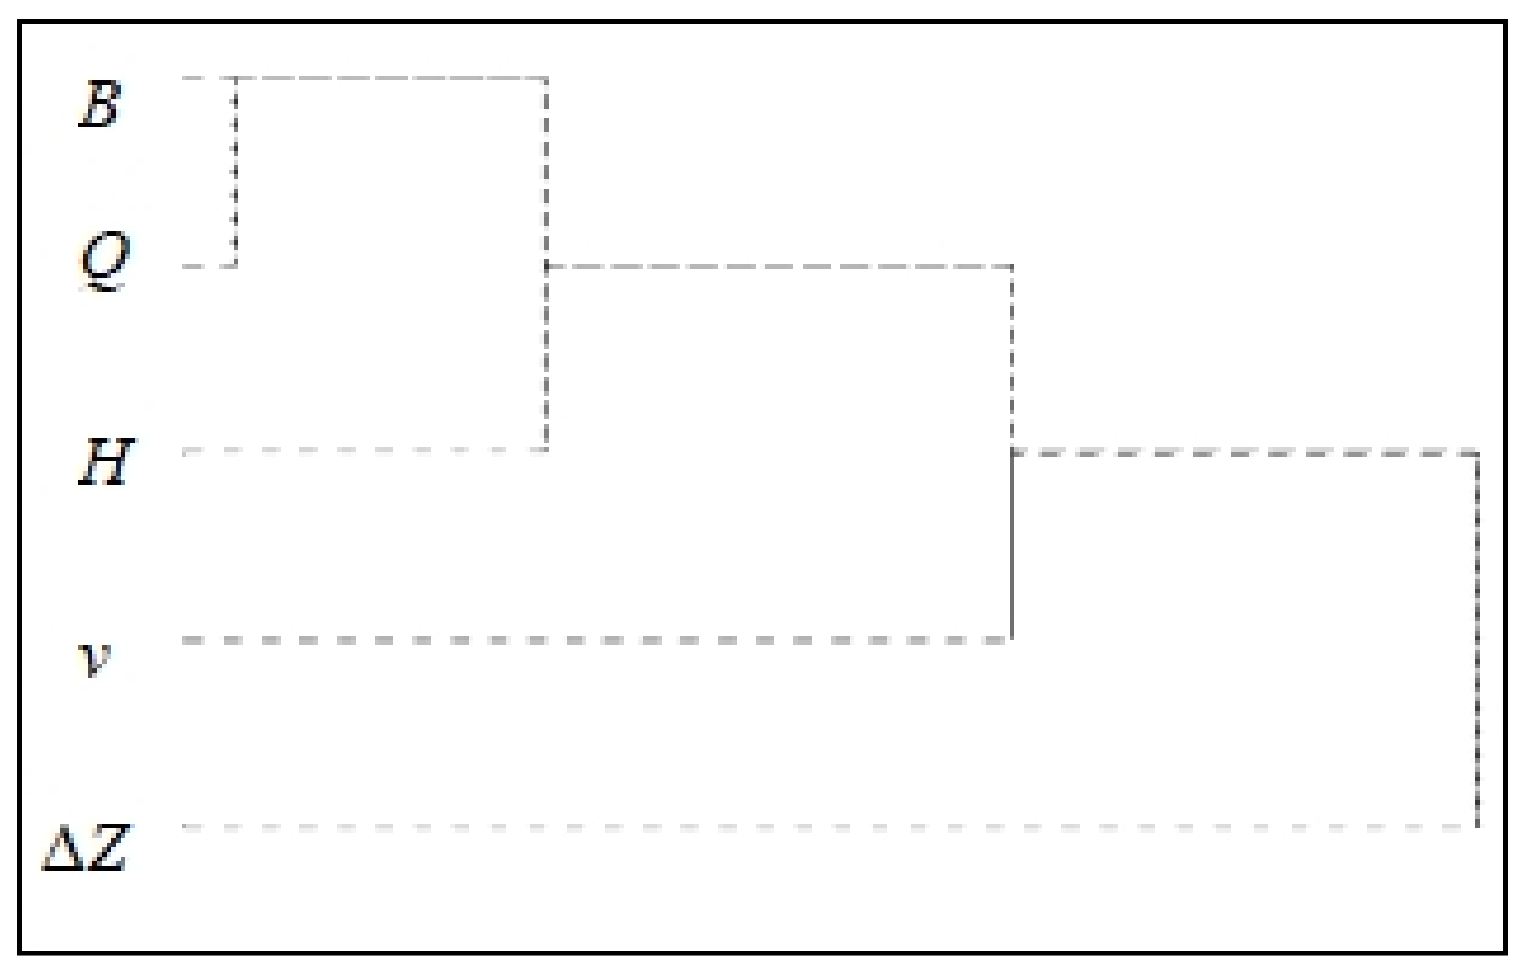
3.1. Cluster Analysis Results for the Eigenvalues of the Breaches

In this paper, 104 sets of breach data are collected and used for fitting analysis. These 104 sets of breach data are shown in Figure 4. Among them, the 85 sets of earth embankment breach examples are taken as the main fitting complement value objects. The collected data consists of 55 groups of dike break cases in China, 30 examples of earth-rock dam breaks in the USA [25] and 19 sets of dike break model test data from related scholars [6,21,24,26], which are plotted in Figure 4. In Figure 4, type ① consists of 55 sets of China dike break examples, type ② consists 30 sets of American earth dam break examples, and types ③~⑥ consist of embankment model tests and numerical simulation data, including type ③, which is three groups of test data from Sun [27]. Type ④ is one group of test data from Tian, type ⑤ is one group of test data from Li, and type ⑥ consists of 14 groups of numerical simulation data from Wang [28]. Figure 4 shows that all sample data vary over a relatively large range due to the complexity and multivariate (changeable) nature of the real breaches. Generally, the width of the breach is distributed in the range of 10~240 m, in which the minimum width is 8 m and the maximum is 620 m from investigation data. However, the width of the breach is more centred in the range of 20~100 m with an occurrence frequency of 0.64. The water head at the entrance of the breaches is mainly in the range of 1.5~17.4 m (dike breach), centred between 4~12 m with an occurrence frequency of 0.68. The flow velocity at the entrance is mainly 2~8 m/s with a distribution frequency of 0.71. The drop upstream–downstream of the breach is generally 0.3~5.66 m, and the three kinds of data have basically the same amplitude. The discharge through the breach is related to the time factor depending on the process of breaking up levees, and its variation range is larger, generally ranging from 10 to 50,000 m3/s, even if the maximum value of the dike breaking sample reaches 4200 m3/s.
The data of the burst sample comprise 104 groups, and the five types of characteristic values are mainly calculated, including the width B of the breach, the water head H and velocity v at the entrance of the breaches, the flow discharge Q and the drop ΔZ through the breach. According to the random characteristics of the sample, the correlation analysis between the respective eigenvalues is suitable for the hierarchical clustering method. To analyse the correlations among the breach factors, to estimate missing values, the variable taxonomy method was chosen. With the above statistical methods, the data for all samples were analysed, and the results are shown in Table 1.
Table 1 shows the correlations among breach factors based on the data analysis from 104 group samples. Taking B and H for example, the correlation of H vs. H and the correlation of B vs. B both equal to 1, while the correlation value of B and H is 0.535. Due to the difficulty of collection, some eigenvalues of the breach are still missing. As shown in Table 1, at the α = 0.01 level, there are more significant correlations between discharge Q and width B or head H, and their correlation coefficients are 0.811 and 0.865, respectively. The correlation between the head H and breach width B is short of above with a correlation coefficient of 0.535. The relationships between velocity v and drop △Z or other breach factors are relatively weak, with correlation coefficients not greater than 0.3.
Using the clustering method coupled between the two groups, taking the square of the Euclidean distance as a calculation standard, R-type clustering analysis of inter group connections is performed on the independent variables. A tree diagram is drawn by the analysis result above, as shown in Figure 5.
An analysis of Figure 5 shows that the discharge Q is close to the width B and the water head H in the association distance, and the association distance between head H and the width B is slightly too far, but the velocity v and the drop ΔZ are far from other variables, which is the same as the above correlation analysis.
According to the above analysis, the function of the eigenvalue variable in agreement with regression fitting analysis is as follows:
Q = f ( B ) H = f ( Q )
For velocity v, its complement value can be calculated according to the flow continuity equation. If the cross section of the breach is assumed to be a trapezoidal section [29], the flow velocity can be obtained by the following formula:
v = Q A = Q ( k B m H ) H
where A is the water area of the cross section of the breach. k is the revised coefficient of width B, and m is the side slope coefficient (see Figure 1). According to the study of Wu [30,31], this can be approximated for the sand dam: k = 0.8, and m = 1.
According to the cluster analysis result, the fitting function expression between B and Q can be obtained according to their correlation. Furthermore, according to the correlation between Q and H, a functional expression for Q~H is fitted. Finally, the fitting function relationships, such as v with B, v with Q and v with H, are obtained according to Equation (12). Therefore, the missing value estimation of each eigenvalue can be sequentially performed, and the fitting analysis process is shown in Figure 6.

3.2. Results of Fitting Regression Analysis

Combining the existing data in Table 1 with the above functional relationships, regression analysis was performed on Q~B and H~Q. The fitting results are shown in Figure 7 and Figure 8.
(1)
Fitting relationship between Q and B
According to the relevant characteristics of Q and B, the t test method is used to test the significance of the slope of the fitting line, which is 37.7; the standard error is 3.733, and the t value is 10.098. The t test value is much larger than the t value corresponding to the significance level α, so the regression equation passes the significance test. Then, the fitting equation is followed, as shown in Figure 7.
Q = 37.7 B 459.88     10   m     B     300   m
The corresponding coefficient R2 is 0.664, which is in accordance with the goodness of fit test requirement.
(2)
Fitting relationship between H and Q
According to the nonlinear relevant characteristics between H and Q, a regression equation can be obtained by means of quadratic fitting: H = B 1 Q B 2 Q 2 + C . Figure 8 shows that intercept C is 5.486 with a standard error of 0.974, B1 is 0.00165, and B2 is −1.069 × 10⁻⁸. Therefore, the fitting equation is
H = 0.00165 Q 1.069 × 10 8 Q 2 + 5.486     15   m 3 / s     Q     15 , 000   m 3 / s  
The corresponding coefficient R2 is 0.783, which is also in accordance with the goodness of fit test requirement.

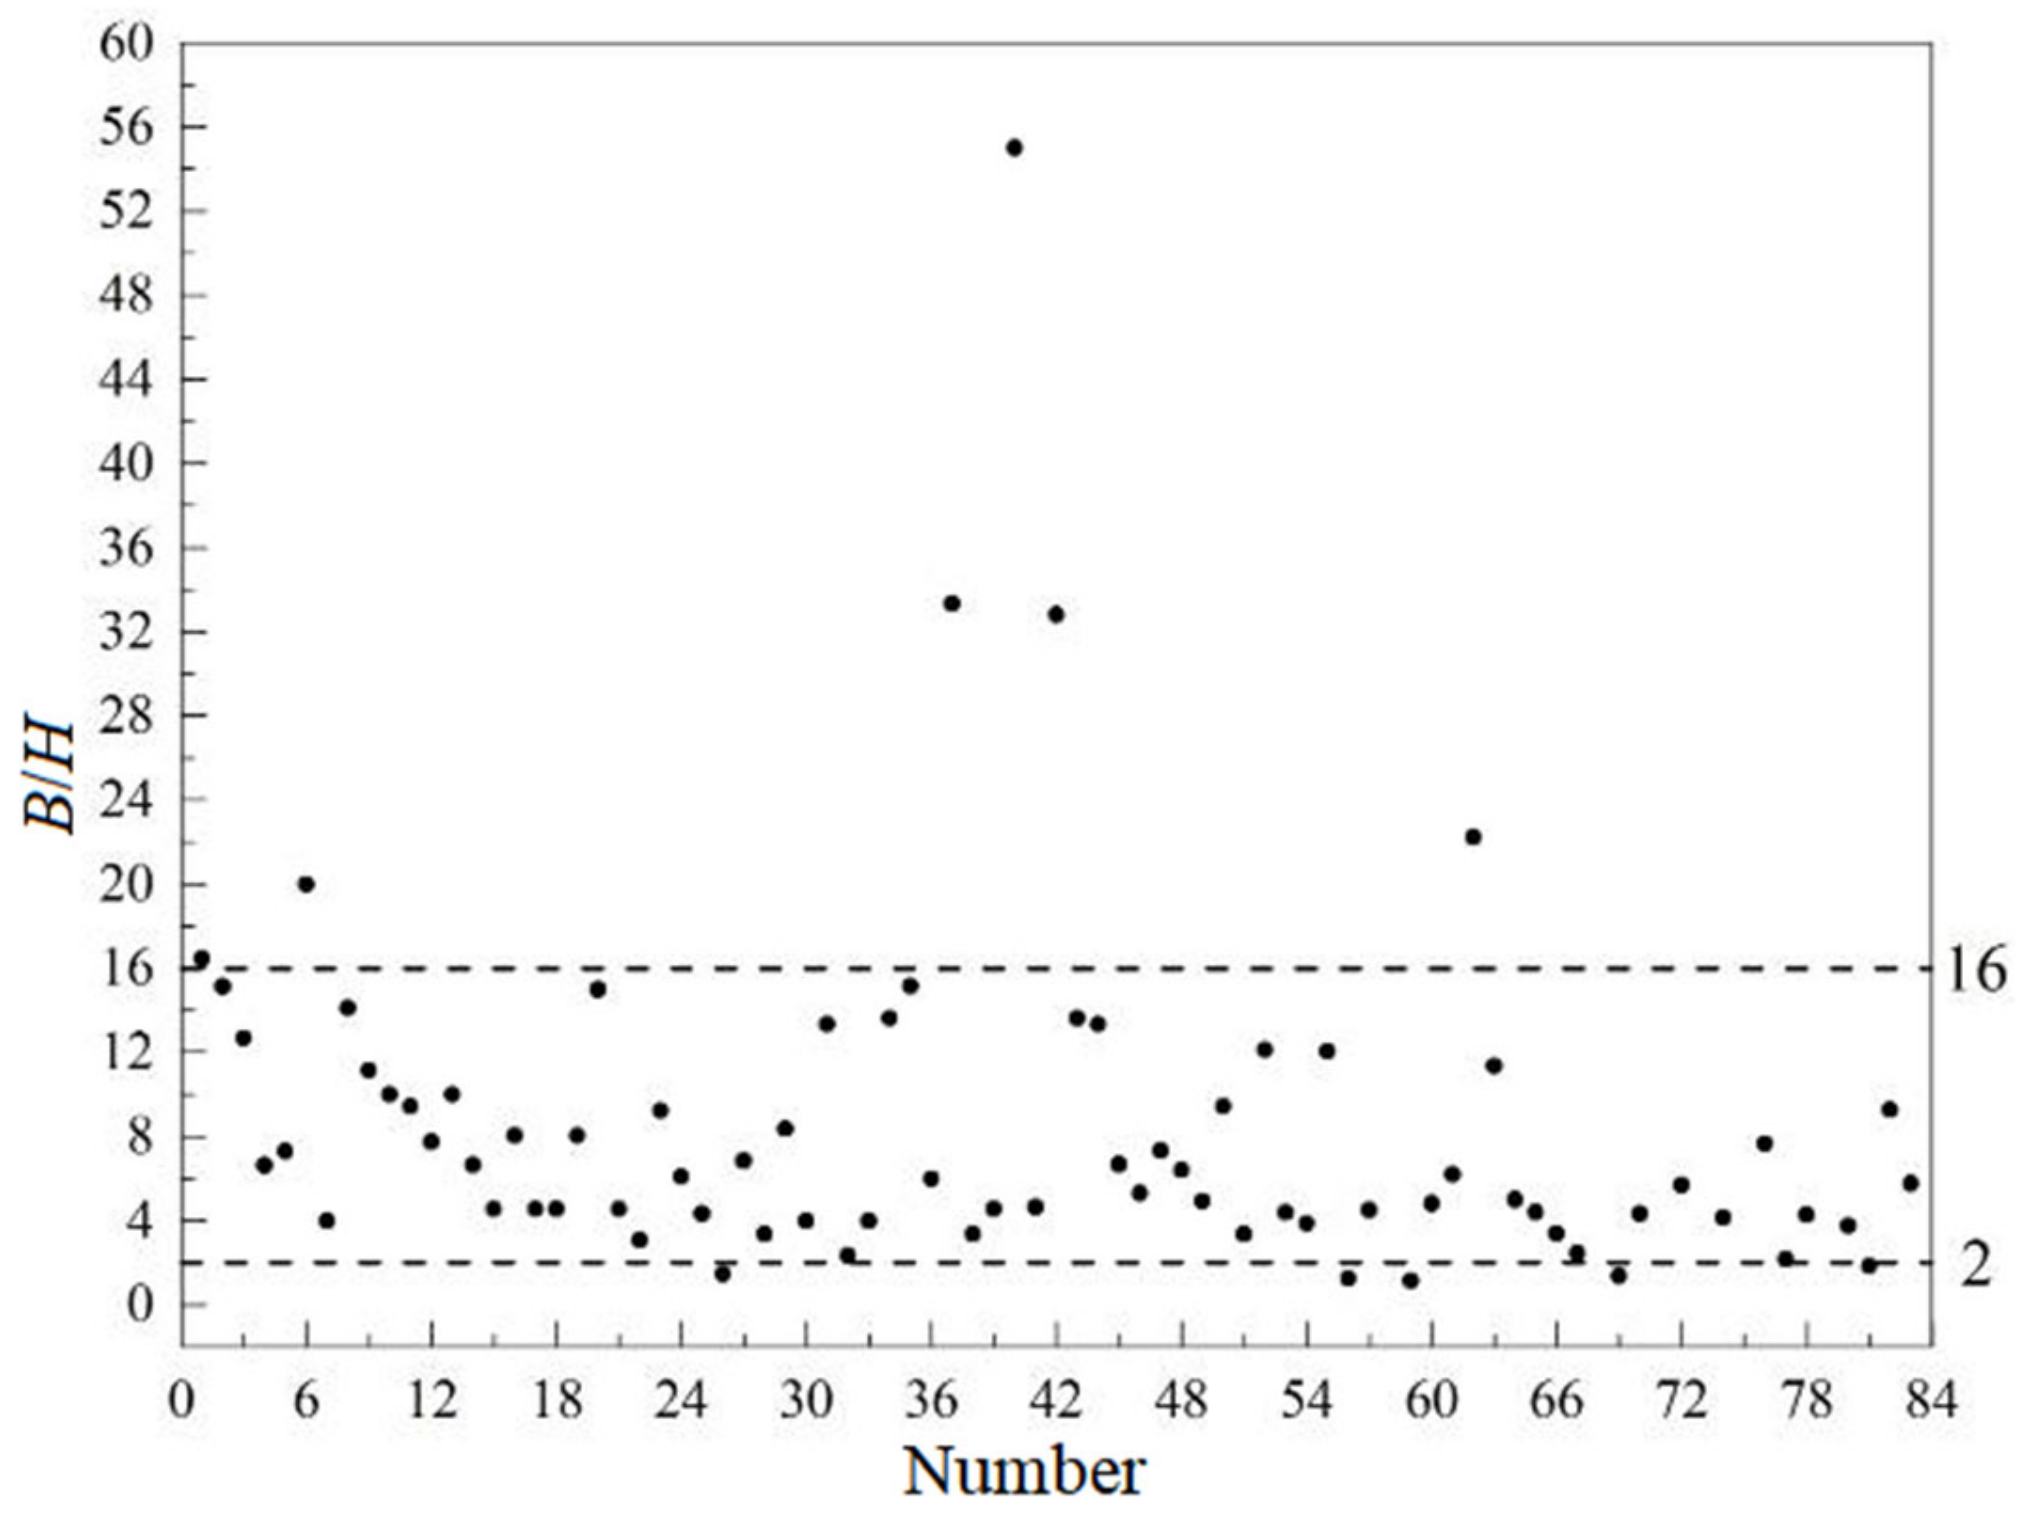
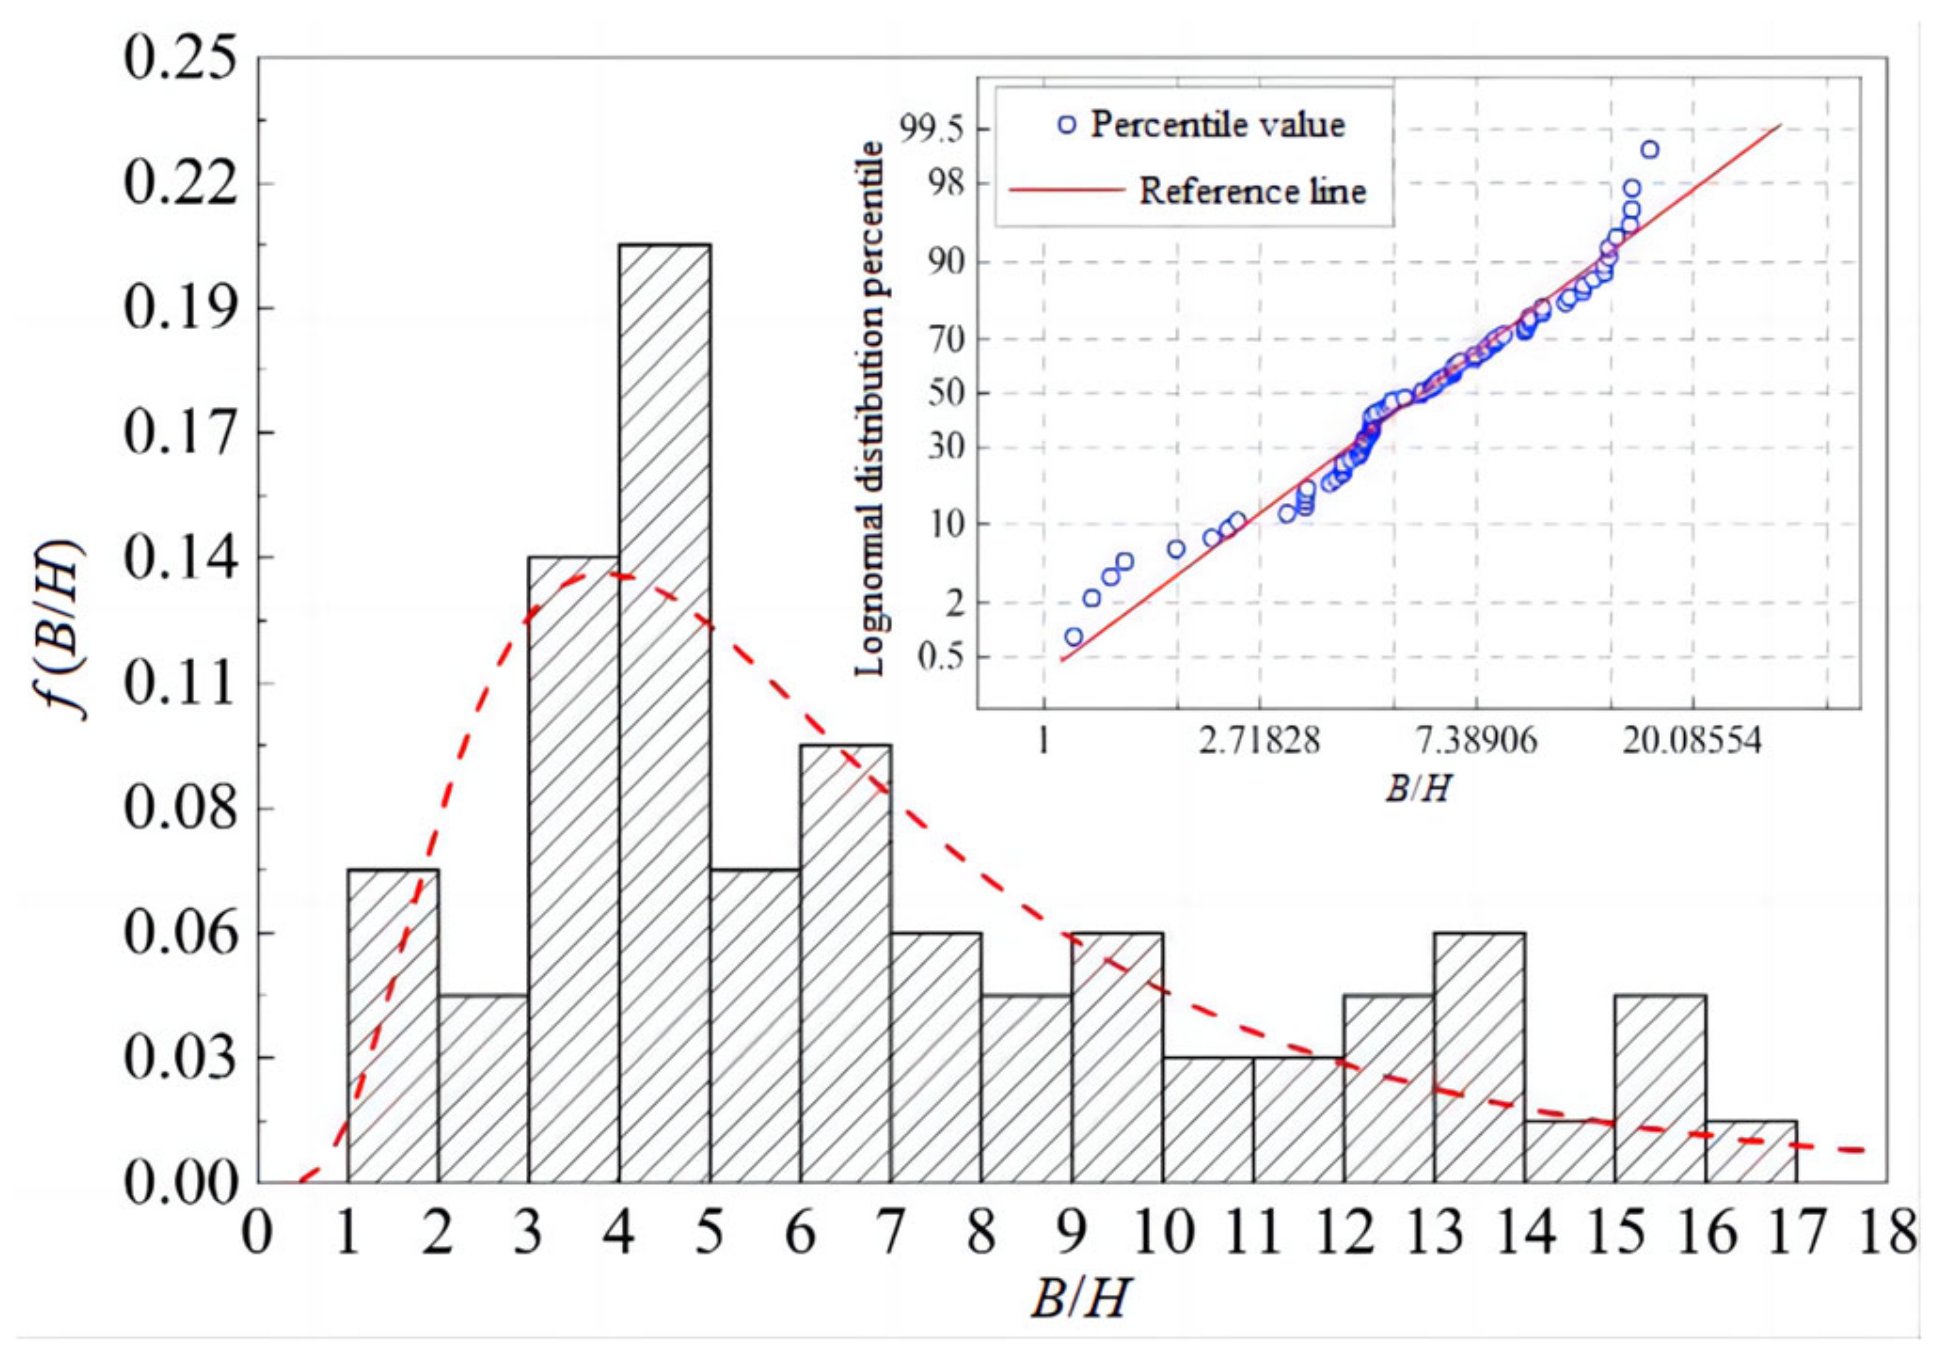
3.3. Fitting Complement and Dimensionless Parameter Analysis

By correlation analysis, the head H, velocity v and discharge Q all conform to the fitting complement value condition of the breach. The 76 groups conform to the fitting complement value condition from 85 groups of embankment breach examples. According to Equations (12)–(14), the data of the three corresponding eigenvalues from 76 groups are fitted and complemented. All of the data from the fitting complement and the data from the original breach sample are classified and analysed (Figure 9 and Figure 10).
Those figures show the classification analysis diagrams after fitting the complement for water depth and velocity of the breach. As shown in Figure 9, the water depth H is distributed mainly over 13.5~1.5 m and is more concentrated near 6 m. The velocity in the breach is distributed mainly in the range of 1~7 m/s (Figure 10). The distribution characteristics and scope are all substantially similar between the original value and fitting values (Figure 9 and Figure 10).
A fitting error analysis was carried out for two characteristic parameters (depth H and velocity v). The fitting error distribution is shown in Figure 11. The relative error of depth H is approximately 68.18% within the ±0.5 error line, and the relative error of velocity v is approximately 70.37% within the ±0.5 error line, so all fitted values meet the predetermined fitting standard. This indicates that the fitting result is better, and the interpolation values are consistent with the basic characteristics of the hydraulic boundary of the breach.
To better express the general hydraulic boundary characteristics of the breach, the width B, depth H and velocity v are dimensionless. A width-to-depth ratio B/H is obtained, which can represent the basic form of the breach, and the Froude number Fr is also obtained, which can indicate the flow state and flow intensity. The formula is as follows:
F r = v g H
where v is the average velocity, and H is the water depth. The units of all parameters are the same as the above quantities.

4. Discussion

In order to analyse the morphological and hydraulic characteristics of the breach, two dimensionless key parameters were adopted, and the reliability of the key parameters was estimated by fitting interpolation. The probability distribution characteristics of the two random quantities are further explored. The statistical results (interpolated B/H and Fr) are listed in Table 2, and the scatter distributions are shown in Figure 12 for the samples obtained.
By analysing the statistics table and scatter in Figure 12, it can be seen that all widths are greater than the depth of the breach. The minimum width-to-depth ratio is 1.25, corresponding to No. 56 in Table 2, which is an earth dam breach with a width of 9.45 m and a depth of 8.23 m. Generally, the width-to-depth ratio of the breach is relatively large, and the maximum ratio is 55.0, corresponding to sample number 40 in Table 2. This is the river embankment section at the junction of Haifeng and Huidong in Guangdong, China. The depth of the river dike breach is only 1.2 m, but the width of the gate is 66 m, and the Froude number is approximately 1.0 near the critical flow state.
From the F From analysis of scatter characteristics in Figure 12, it is seen that the width–depth ratio is mainly distributed between 2 and 16. To study the characteristics of the width-depth ratio carefully, the probability density distribution and percentile distribution of the B/H scatter were statistically analysed and are shown in Figure 13.
It can be seen in Figure 13 that the probability density distribution of the width–depth ratio basically conforms to the lognormal distribution, i.e., ln(B/H)~N(μ,σ2). The probability density function f(B/H) of width-to-depth can be obtained by lognormal distribution fitting and is shown as follows with μ = 1.742 and σ = 0.633.
f ( B / H ) = 1 1.587 ( B / H ) e ln ( B / H ) 1.742 2 0.801   1.15     B / H   55  
From Equation (16), the maximum probability density is 0.137 when the ratio (B/H) is 3.89. As shown in Figure 13, the ratio (B/H) is mainly distributed in the range of 3 to 8, with a corresponding probability density greater than 0.068 and a corresponding percentile between 15 and 70. That is, the cumulative frequency of the ratio (B/H) in this interval is approximately 55%. This indicates that most of the breaches have wide and shallow cross sections, in which the ratio (B/H) is mainly related to the stability of dike soil, the water drops through the breach, the inflow angle-velocity and rescue measures taken during breach occurrence. The regression model can be used to predict the depth or width of the breach and provide basic scientific parameters for the hydraulic model test of the breach.
In Table 2 and Figure 14, it is shown that the Froude number is mainly distributed between 0.1 and 0.8, the flow in the breach is mostly subcritical flow, and the water depth is generally greater than the critical depth. The minimum Fr is only 0.07, which may be the data from the end of the breach process. The probability density distribution f(Fr) of the Froude number is statistically calculated from 76 groups of breach samples, and the relationship between Fr~f(Fr) is shown in Figure 15.
By means of fitting analysis, the probability density function (PDF or f(Fr)) is obtained with μ = 0.476 and σ = 0.204:
f ( F r ) = 1.956 e 12.015 ( F r 0.476 ) 2 ,   0.07   <   Fr     1.20  
From Equation (17), the maximum probability density is 1.956 when the Froude number is 0.467. It is shown in the figures of probability density and percentile distribution (Figure 15) that during the middle and late stages of the breach process, the flow field belongs to subcritical flow, and the Froude numbers are mainly concentrated in the range of 0.4 to 0.8. The corresponding probability density is above 0.554, and the corresponding percentile is between 35–95, indicating that the cumulative frequency distributed in this interval is approximately 60% for Fr.
In order to analyse the breach hydraulic boundary eigenvalue and to define the typical hydraulic boundary conditions of breach, mechanism research on basic physics process of breach was conducted. Meanwhile, closure analysis was adopted to find out the correlation among breach factors. Experimental research conclusions of breach hydraulic boundary of various conditions involving 104 groups data were collected and used to build a convincing and representative model, which benefits to expand the use of research findings. The findings of the paper provide the relatively reliable basic parameters for the design of fracture blocking technology and critical parameters support to improve the scientific design of blocking technology. By means of cluster analysis and statistics research, the paper also proposed a reliable method to define the typical characteristic value of levee breach and provide the necessary technical support for research trials and technical closure work of breaches.
In the current research, due to the fact that the breach model is designed based on a specific actual breach or based on empirical generalization, the hydraulic and boundary characteristics of the breach in the papers are shortage of representativeness and persuasiveness. It is necessary to use statistical analysis to obtain representative hydraulic boundary eigenvalues of breaches based on abundant reliable breach data, which supplies the basic necessary support for breach research. There is rare research on the statistical analysis of parametric statistics of the breach, and the estimation of missing data, which follows some rules especially for different random data. There would be an amount of missing data in the measurements of breaches, and this would affect figuring out the characteristics of the breach promptly and then the closure technology of the breach. Therefore, utilizing the estimation method for the missing data in a reliable and accurate way is important. The methods proposed in this paper can supply reference to the statistical research of breach parameters.

5. Conclusions

In this paper, the prototype observation data and model test data of 104 groups of earth-rock embankments or earth dams at rivers are collected. Statistical analysis methods, such as cluster analysis, are used to analyse the characteristic values of the hydraulic boundary of the breach, and the following conclusions are obtained.
Herein, five characteristic breach parameters are selected for the study, and the analysis results are applicable to hydraulic rock and soil embankment dams or boundary features later in predicting breach occurrence, hydraulic closure work simulation tests and research technique breaches. Further exploration of the internal relationship of statistical data, increasing the study of parameters such as dam height and soil quality, is conducive to a more accurate understanding of the occurrence and development mechanism of dike breaches.
Based on the fact that the actual hydraulic parameters of a breach are fleeting, the data obtained in an emergency situation are difficult to complete, and there are many missing situations. Statistical tools can be used when studying the characterization of the hydraulic boundary of a breach. Through the cluster analysis of the measured data of the breach, the correlation between the key variables is evaluated, and the regression analysis model of the missing parameter estimation is established to interpolate the missing value of the hydraulic boundary parameter. Typically, the fitting error complement value can be controlled within 40%.
Based on the measured data of 85 groups of fractures, statistical analysis shows that the width of an earth–rock dam is generally distributed in the range of 10~240 m, the concentration is mostly between 20~100 m, and the frequency is 0.64. The mouth is generally between 1.5 and 30 m, although 4 to 12 m is more common, and the frequency of occurrence is 0.68. The flow rate of the mouth is generally 2~8 m/s, and the distribution frequency is 0.71; the flow rate of the dike breach is large with a minimum of 10 m3/s and a maximum of 4198 m3/s; the drop is generally not more than 5.66 m. These analytical values make up for the shortcomings of the characteristic parameters of the hydraulic boundary of the breach and can provide basic data for scientific research, such as dam break model tests and plugging technology design.
Based on a cluster analysis, this paper establishes a correlation regression model of the characteristic parameters of the hydraulic boundary of a breach. Equation (13) can be used to estimate the flow of the fracture according to the width of the fracture. It is suitable for the width of the fracture 10 m < B < 300 m. Equation (14) can be used to predict the water depth of the breach according to the flow rate of the fracture and is suitable for flow rates of 15 to 15,000 m3/s. Correlation analysis between variables shows that these models meet the goodness of fit test requirements.
To test the reliability of the imputed value interpolation of the hydraulic boundary parameters, probability density analysis of the parameters of the dimensionless depth-to-depth ratio B/H and Froude number Fr of the fracture is carried out. The ratio of the width to the depth of the fracture is in accordance with the lognormal distribution: ln(B/H)~N(μ, σ2), μ = 1.64, σ = 0.434. The maximum probability density is 0.137; the value of B/H is mainly in the range of 3~8, and the cumulative frequency of the interval is approximately 55%, which has characteristics proving that the mouth width is larger than the mouth water depth. The Froude number in the fracture zone also conforms to the normal distribution: Fr~N(μ, σ2) μ = 0.476, σ = 0.204, the maximum probability density is 1.956; Fr is mainly in the range of 0.4~0.8, and the corresponding cumulative frequency is approximately 60%. The upstream and downstream water head difference decreases in the middle and late stages of the collapse, the water flow energy in the fracture zone is smaller than the potential energy, and the flow state is mostly slow flow. Based on the above two dimensionless parameters, B/H and Fr are selected to further determine the hydraulic boundary conditions of the generalized breach, and a simulation test of the dike collapse is carried out to study the hydraulic characteristics of the breach and the plugging technique.

Author Contributions

Methodology, M.L.; Validation, C.Q.; Data curation, Y.L. and Z.W.; Writing—original draft, M.L. and H.M.; Writing—review & editing, Y.L.; Supervision, D.S.; Project administration, D.S.; Funding acquisition, D.S. All authors have read and agreed to the published version of the manuscript.

Funding

The financial supports of the National Natural Science Foundation of China (No. 52079032) and of the Major Science and Technology Projects of the Ministry of Water Resources (No. SKS-2022030) are gratefully acknowledged.

Data Availability Statement

Please contact the corresponding author for data.

Conflicts of Interest

The authors declare no conflict of interest.

References

  1. Fu, Z.Q.; Su, H.Z.; Han, Z.; Wen, Z.P. Multiple failure modes-based practical calculation model on comprehensive risk for levee structure. Stoch. Environ. Res. Risk Assess. 2018, 32, 1051–1064. [Google Scholar] [CrossRef]
  2. Li, Z.; Zhang, Y.; Wang, J.; Ge, W.; Li, W.; Song, H.; Guo, X.; Wang, T.; Jiao, Y. Impact evaluation of geomorphic changes caused by extreme floods on inundation area considering geomorphic variations and land use types. Sci. Total Environ. 2021, 754, 142424. [Google Scholar] [CrossRef]
  3. Costa, J.E. Floods from dam failures. US Geol. Surv. 1985, 85, 560. [Google Scholar]
  4. Foster, M.; Fell, R.; Spannagle, M. The statistics of embankment dam failures and accidents. Can. Geotech. J. 2000, 37, 1000–1024. [Google Scholar] [CrossRef]
  5. Resio, D.T.; Boc, S.J.; Ward, D.; Kleinman, A.; Fowler, J.; Welsh, B.; Matalik, M.; Phil, G. US Army Engineer Research and Development Center: Rapid Repair of Levee Breaches; Oak Ridge National Laboratory: Oak Ridge, TN, USA, 2011. [Google Scholar]
  6. Tian, Z.Z.; Liang, Y.P.; Xie, J.X.; Zhao, J.L. Model test studies on hydraulic and eroding and depositing characteristics in the gate areas of embankment breach. Yellow River 2003, 25, 32–33. [Google Scholar]
  7. Li, H.K.; Zeng, Z.C.; Deng, B.M. Hydraulic characteristics of levee breach closure. Hydro Sci. Eng. 2017, 3, 8–15. [Google Scholar]
  8. Xia, J.; Cheng, Y.; Zhou, M.; Deng, S.; Zhang, X. Experimental and numerical model studies of dike-break induced flood processes over a typical floodplain domain. Nat. Hazards 2023, 116, 1843–1861. [Google Scholar] [CrossRef]
  9. Soares-Frazão, S.; Le Grelle, N.; Spinewine, B.; Zech, Y. Dam-break Dam-break induced morphological changes in a channel with uniform sedi-ments: Measurements by a laser-sheet imaging technique. J. Hydraul. Res. 2007, 45, 87–95. [Google Scholar] [CrossRef]
  10. Bellos, C.V.; Soulis, V.; Sakkas, J.G. Experimental investigation of two-dimensional dam-break induced flows. J. Hydraul. Res. 1992, 30, 47–63. [Google Scholar] [CrossRef]
  11. Mohammad, K.A.; Nouman, A.; Yao, J.T.; Alanazi, E. A three-way clustering approach for handling missing data using GTRS. Int. J. Approx. Reason. 2018, 98, 11–24. [Google Scholar]
  12. Tsai, C.F.; Li, M.L.; Lin, W.C. A class center based approach for missing value imputation. Knowl. Based Syst. 2018, 151, 124–135. [Google Scholar] [CrossRef]
  13. Yaser, B.; Marce, M. Multivariate linear regression with missing values. Anal. Chem. Acta 2013, 796, 38–41. [Google Scholar]
  14. Günther, G.; Ivo, D. Maximum Consistency of Incomplete Data via Non-Invasive Imputation. Artif. Intell. Rev. 2003, 19, 93–107. [Google Scholar]
  15. Mohamed, M.A.M.; Entesar, A.S.E.-G. Investigating scale effects on breach evolution of overtopped sand embankments. Water Sci. 2016, 30, 84–95. [Google Scholar] [CrossRef] [Green Version]
  16. Yohannis, B.T.; Peter, F. An Integrated Approach to Simulate Flooding due to River Dike Breach; CUNY Academic Works: New York City, NY, USA, 2014. [Google Scholar]
  17. Li, S.S.; Cui, T.J.; Liu, J. Research on the clustering analysis and similarity in factor space. Comput. Syst. Sci. Eng. 2018, 33, 397–404. [Google Scholar] [CrossRef]
  18. Zhao, Q.; Zhu, Y.; Wan, D.; Yu, Y.; Lu, Y. Similarity Analysis of Small- and Medium-Sized Watersheds Based on Clustering Ensemble Model. Water 2020, 12, 69. [Google Scholar] [CrossRef] [Green Version]
  19. Guan, M.F.; Wright, N.G.; Sleigh, A. 2D Process-Based Morphodynamic Model for Flooding by Noncohesive Dyke Breach. J. Hydraul. Eng. 2014, 140, 44–51. [Google Scholar] [CrossRef]
  20. Zhu, X.; Tang, S. Clustering analysis for elastodynamic homogenization. Comput. Mech. 2023. [Google Scholar] [CrossRef]
  21. Griffiths, D.F.; Watson, G.A. Numerical Analysis 1993; CRC Press: Boca Raton, FL, USA, 2020; Volume 9. [Google Scholar]
  22. Sutarto, E.T. Application of large scale particle image velocimetry (L SPIV) to identify flow pattern in a channel. Procedia Eng. 2015, 125, 213–219. [Google Scholar] [CrossRef] [Green Version]
  23. Zhao, G.; Visser, P.J.; Ren, Y.; Uijttewaal, W.S.J. Flow hydrodynamics in embankment breach. J. Hydrodyn. 2015, 27, 835–844. [Google Scholar] [CrossRef]
  24. Gatti, P.L. Probability Theory and Mathematical Statistics for Engineers; Pergamon Press: Oxford, UK, 1984. [Google Scholar]
  25. Chinnarasri, C.Y.; Jirakitlerd, S.B.; Wongwises, S.C. Embankment dam breach and its outflow characteristics. Civ. Eng. Environ. Syst. 2004, 21, 247–264. [Google Scholar] [CrossRef]
  26. Allsop, W.; Kortenhaus, A.; Morris, M.; Buijs, F.A.; Visser, P.J.; ter Horst, W.L.A.; Hassan, R.; Young, M.; van Gelder, P.H.A.J.M.; Doorn, N.; et al. Failure Mechanisms for Flood Defense Structures; Hydraulic Structures and Flood Risk; CRC Press: Boca Raton, FL, USA, 2008; p. 203. [Google Scholar]
  27. Sun, L.Z.; Zhao, J.J.; Yan, J.G.; Chen, P. Hydraulic test studies of dike breach. Yangtze River 2003, 34, 41–42. [Google Scholar]
  28. Wang, B.; Zhang, F.D.; He, C.H. Numerical Simulation of Hydraulic Conditions of Dike Closure Based on Flow-3D. China Rural. Water Hydropower 2017, 5, 77–80+86. [Google Scholar]
  29. Xu, Y.; Zhang, L.M. Breaching Parameters for Earth and Rockfill Dams. J. Geotech. Geoenviron. Eng. 2009, 135, 1957–1970. [Google Scholar] [CrossRef]
  30. WU, W. Simplified physically based model of earthen embankment breaching. J. Hydraul. Eng. 2013, 139, 837–851. [Google Scholar] [CrossRef]
  31. Wu, W.M.; Mustafa, A.; Mahmoud, A.-R.; Nathanie, B.; Scott, B.; Cao, Z.X.; Chen, Q.; George, C.; Jennifer, D.; Gee, D.; et al. Earthen Embankment Breaching. J. Hydraul. Eng. 2011, 137, 1549–1564. [Google Scholar]
Figure 1. Schematic diagram of occurrence characteristics of embankment breach. Bi, Hi and vi denotes the width, water level and velocity of the breach at moment I, respectively, while B, H, and v denotes the maximum value of the width, water level and velocity of the breach, respectively.
Water 15 02908 g001
Figure 2. The transverse and longitudinal section of the generalizes breach. The left figure (a) shows that the cross section of the breach is generalized as a trapezoid shape with side slope m = 1.0 and height of the dyke as h. The right figure (b) shows that there is a water head drop Δz between two sides of the breach along the flood direction. The meaning of other symbols in the figure are same as above of the respective characteristic value, and the abscissa is time breach developing.
Water 15 02908 g002
Figure 3. Research logic chart by means of cluster analysis method. During the process, the feature values are considered dimensionless, and the probability density distribution characteristics of each dimensionless parameter are analysed. On this basis, the hydraulic-boundary feature value of the generalized breach are determined.
Water 15 02908 g003
Figure 4. Hydraulic boundary eigenvalues of embankment breach. Considering the similarities and differences in hydraulic boundary conditions, these three kinds of data were classified into 6 types.
Water 15 02908 g004
Figure 5. Cluster analysis tree.
Water 15 02908 g005
Figure 6. Schematic diagram of calculation process of fitted and imputed value. The missing value estimation of each eigenvalue can be sequentially performed.
Water 15 02908 g006
Figure 7. Fitting regression curve of Q~B. According to the t test method, the standard error of the fitting line is 3.733, and the t value is 10.098.
Water 15 02908 g007
Figure 8. Fitting regression curve of H-Q. The intercept C of the fitting line is 5.486, and the standard error is 0.974.
Water 15 02908 g008
Figure 9. Comparison of breach water head before and after fitting. The fitted data of water depth is more uniform, and is centred in about 6 m.
Water 15 02908 g009
Figure 10. Comparison of gate flow rate before and after fitting. The fitted data of velocity ranges mainly in 2 m/s and 7 m/s.
Water 15 02908 g010
Figure 11. Fitting error distribution of breach rate and water head. The relative deviation e of the data is decreased largely after fitting.
Water 15 02908 g011
Figure 12. Discrete distribution of wide-to-depth ratio (B/H).
Water 15 02908 g012
Figure 13. Probability density of width-to-depth ratio (B/H) and its percentile distribution. The probability density distribution of the width–depth ratio basically conforms to the lognormal distribution.
Water 15 02908 g013
Figure 14. Discrete distribution of Froude number (Fr). Froude number mainly ranges in 0.1 and 0.8.
Water 15 02908 g014
Figure 15. Probability density and percentile distribution of Froude number (Fr). The probability density distribution of the Fr approximates the general normal distribution, i.e., Fr~N(μ, σ2).
Water 15 02908 g015
Table 1. Correlation coefficient matrix of each eigenvalue of the breach.
EigenvaluesB
/m
H
/m
v
/(m·s−1)
ΔZ
/m
Q
/(m3·s−1)
B/m1.0000.535−0.2320.2750.811
H/m 1.000−0.191−0.0930.865
v/(m·s−1) 1.000−0.226−0.068
ΔZ/m 1.000−0.307
Q/(m3·s−1) 1.000
Table 2. Statistics of dimensionless eigenvalues of breach after fitting and complementing.
NumberB/HFrNumberB/HFrNumberB/HFrNumberB/HFr
116.450.072015.000.82394.550.73604.820.57
215.130.10214.550.734055.001.00616.200.22
312.670.20223.080.58414.650.316222.224.16
46.630.33239.230.434232.800.576311.350.17
57.290.55246.090.474313.620.15645.000.49
620.000.61254.330.524413.330.41654.400.52
73.980.71261.450.27456.670.08663.380.26
814.100.13276.840.32465.300.73672.450.76
911.150.29283.350.64477.340.24691.360.62
1010.000.42298.360.50486.400.65704.330.52
119.440.41303.980.71494.930.57725.690.11
127.750.553113.330.52509.440.41744.130.53
1310.000.42322.350.15513.350.64767.670.06
146.650.17333.980.715212.120.23772.170.87
154.550.733413.620.15534.390.31784.290.52
168.040.523515.160.10543.860.71803.750.56
174.550.73365.990.675512.060.57811.840.23
184.550.733733.332.09561.250.57829.260.43
198.040.52383.350.64574.500.51835.750.37
Disclaimer/Publisher’s Note: The statements, opinions and data contained in all publications are solely those of the individual author(s) and contributor(s) and not of MDPI and/or the editor(s). MDPI and/or the editor(s) disclaim responsibility for any injury to people or property resulting from any ideas, methods, instructions or products referred to in the content.

