Article

A Cost-Effective and Straightforward Approach for Conducting Short- and Long-Term Biomonitoring of Gold Mine Waters

1
Romanian Academy Cluj-Napoca Branch, “Emil Racoviță” Institute of Speleology, 5-7 Clinicilor Street, 400006 Cluj-Napoca, Romania
2
Geological Institute of Romania, 1 Caransebeș Street, 012271 Bucharest, Romania
3
“Emil Racoviță” Institute of Speleology, Romanian Academy, 13 Calea 13 Septembrie Street, 050711 Bucharest, Romania
4
Emil G. Racoviță Institute, Babeș-Bolyai University, 5-7 Clinicilor Street, 400006 Cluj-Napoca, Romania
*
Authors to whom correspondence should be addressed.
Water 2023, 15(16), 2883; https://doi.org/10.3390/w15162883
Submission received: 8 June 2023 / Revised: 25 July 2023 / Accepted: 4 August 2023 / Published: 9 August 2023

Abstract

:
Gold mining pollution has long-lasting effects on the environment, particularly through acid mine drainage (AMD) and heavy metal contamination. Monitoring and assessing the impact of this pollution is crucial, as well as evaluating the effectiveness of remediation efforts. In our study, conducted in the gold mining area of Zlatna (GMAZ), western Romania, we utilised on-site measurements of water temperature, pH, electrical conductivity, and dissolved oxygen, along with the quantification of culturable aerobic bacteria and microfungi using ready-to-use media plates. We also examined the taxonomic richness of water invertebrates (TRWI) and the environmental features of the sites. Our study found significant negative impacts on the water biota in mining areas, with microbial abundance proving to be a reliable indicator of AMD pollution. While water invertebrates can also serve as indicators of mining effects, their abundance alone may not always accurately reflect pollution levels at every site. This multiple-factor analysis highlights the influences of water type, geological characteristics, air temperature, and precipitation on the structure of the aquatic biota. We observed a natural attenuation of mining pollution in the GMAZ in the last seven years. This study demonstrates that the quantification of microbiota, along with TRWI and basic physicochemical parameters, can offer a cost-effective alternative to expensive monitoring methods for assessing mining pollution.

1. Introduction

Gold mining has been a key driver of socio-economic growth for many countries throughout history [1]. However, it also has significant environmental impacts, including soil [2], water [3], and air contamination by toxic compounds [4,5], deforestation, negative impacts on animals and human health [6,7], the alteration of landscapes, the reduction of biodiversity, and the destruction of pristine environments [7,8]. The mining of gold and silver has been carried out for millennia and has resulted in significant environmental pollution that has persisted over time [9,10,11,12,13]. In various European countries, the adverse effects of Roman mining are well documented, including in Sweden [4,5], Switzerland [9], the United Kingdom [14], and Spain [13]. Stable isotope approaches [4,5,9], stratigraphy from lake sediments [11], geochemistry [13], and peat bog and pollen records [12,14] have all been used to investigate these effects.
Water is a globally valuable resource [15] that is significantly impacted by mining activities in various ways. These impacts include the utilisation of large volumes of water from natural sources, which disrupts water flow and underground water sources, and the toxic waste generated by mining activities, such as heavy metals (HM), trace elements, and other pollutants resulting from ore and sediments [16]. Assey [17] classified gold mining pollution into three main types: (1) mercury pollution from artisanal small-scale gold mining, (2) cyanide pollution from large-scale gold mining, and (3) pollution from acid mine drainage (AMD) that occurs in both open-pit and underground mines that contain the mineral sulphide. The impact of these types of pollution can lead to changes in the physical and chemical characteristics of surface waters [18,19], which can have negative consequences for aquatic habitats, water biodiversity, and drinking water quality. Even after mining operations have ceased, infiltrating water can come into contact with sulphide-bearing materials and, in the presence of oxygen, form AMD, which continues to pollute freshwater basins [2,20,21]. The consequences of AMD pollution include low pH, increased concentrations of dissolved heavy metals, and high amounts of metal precipitate.
The Water Framework Directive (WFD) addresses the presence of hazardous substances in Europe’s water bodies by setting environmental quality standards, requiring monitoring, and implementing measures to reduce their input and protect the aquatic environment and human health [22]. In line with these objectives, biomonitoring provides a comprehensive approach for evaluating mining pollution in aquatic ecosystems, incorporating various methods such as community assemblages, bioindicators, behavioural assessments, morphological evaluations, biochemical analyses, bioaccumulation, toxicity testing, and others [23]. Research has demonstrated that microbial organisms are typically the first biota impacted by HM pollution resulting from gold mining [24,25], although some bacteria species have developed resistance mechanisms to tolerate HM [25]. The toxic effects of HM on the microbial community have been widely documented in previous studies and can result in various effects on bacterial and fungal activities, including an increase in the fungal/bacterial ratio with increasing concentrations of Cu or Zn [25,26,27]. Meiofauna assemblages are also sensitive to pollution and are used as indicators of HM or organic carbon contaminants [28]. One of the advantages of using sensitive organisms, such as nematodes and copepods, for the biomonitoring of mining pollution is that their response to pollutants can be observed without the need for specific identifications [29]. For example, high concentrations of HM can impact the density, diversity, and community structure of nematodes [28] or copepods, which are both known to be highly sensitive to pollutants [29]. However, it is important to note that factors other than HM can also impact the structure and diversity of invertebrate communities in aquatic ecosystems. For example, acid mine pollution can alter the structure of macroinvertebrate communities, leading to a decrease in the abundance and diversity of benthic macroinvertebrates [30]. The severity of this impact is quantitatively related to the degree of AMD pollution [31], with pH being considered as the best predictor of macroinvertebrate richness. Van Damme [32] has demonstrated that as the acidity of water increases, the number of invertebrate families decreases gradually. However, it has also been shown that neutral mine drainage can have an impact on invertebrate communities, indicating that the chemical composition of water plays an important role in shaping aquatic communities [33]. Therefore, when studying the effects of mining pollution on aquatic ecosystems, it is important to take multiple factors into account.
Romania has a long history of gold mining, dating back to the pre-Roman period. The first documented evidence of gold mining in Romania dates back to the Bronze Age, around 3000 years before the Roman conquest of Dacia [34]. However, large-scale gold mining in Romania began during the Roman period, with the exploitation of the gold mines in the Apuseni Mountains. The “Golden Quadrilateral” (GQ) mining district is one of the oldest gold deposits in Europe, mainly known for its rich deposits, with a gold endowment of 0.69 t/km2 [35,36]. Studies conducted in the Zlatna mining area of the GQ have revealed AMD pollution with high levels of sulphates, Zn, and Fe in mine waters, while the surface waters were mainly contaminated during the summer months when the flow of water decreased [21]. Other studies conducted in the GQ have shown a minor impact of mining activities, with hotspots of AMD pollution and heavy metals accumulated in the river sediments of the Crișul Alb basin [37]. There was also AMD pollution containing high amounts of Al, Fe, Cu, Zn, Pb, As, Cd, and Sr found in the Roșia Poieni ore deposits [38].
Under the WFD, EU member states are mandated to identify and assess the levels of priority substances, such as heavy metals, in their water bodies. This includes monitoring water quality and pollutants in mining areas, which is crucial for long-term remediation and environmental restoration efforts. However, conducting such monitoring can be costly due to the need for advanced methods, specialised equipment, and trained personnel to develop complex chemical analyses, including different ions and heavy metal measurements or oxygen isotopes. Several projects and ecological programs have been developed in the region to promote environmentally sustainable gold mining in accordance with the requirements of the WFD. For instance, ERA-MIN 2 SUSMIN/2013, a transnational cooperation project developed in the Gold Mining Area of Zlatna (GMAZ) between 2014 and 2016 [39], provided the chemical and isotopic characteristics of the waters analysed in this paper [21].
The present paper aims to: (1) assess the pollution impact of closed gold mines on water bodies by quantifying the culturable microbiota and water invertebrates; (2) investigate the relationship between biota, the waters physicochemical parameters, environmental factors, and the geochemical characteristics of different water body sites (mine waters, downstream surface waters, and groundwaters versus the surface waters upstream of mine effluents); and (3) assess pollution trends in the GMAZ over a specific time period. Our approach offers a cost-effective and efficient method for the short-to-long-term monitoring of gold mine pollution by quantifying the culturable microbiota using ready-to-use plates and the composition and richness of water invertebrates as a comprehensive indicator for water pollution, instead of the more complex and expensive traditional chemical analyses used to determine pollutant concentrations in water samples. This cost-effective approach is valuable, as it simplifies the monitoring process while still providing comprehensive indicators of water pollution, allowing for more accessible and frequent monitoring, and contributing to a better understanding of the pollution dynamics in gold mine waters over both short and long periods.

2. Materials and Methods
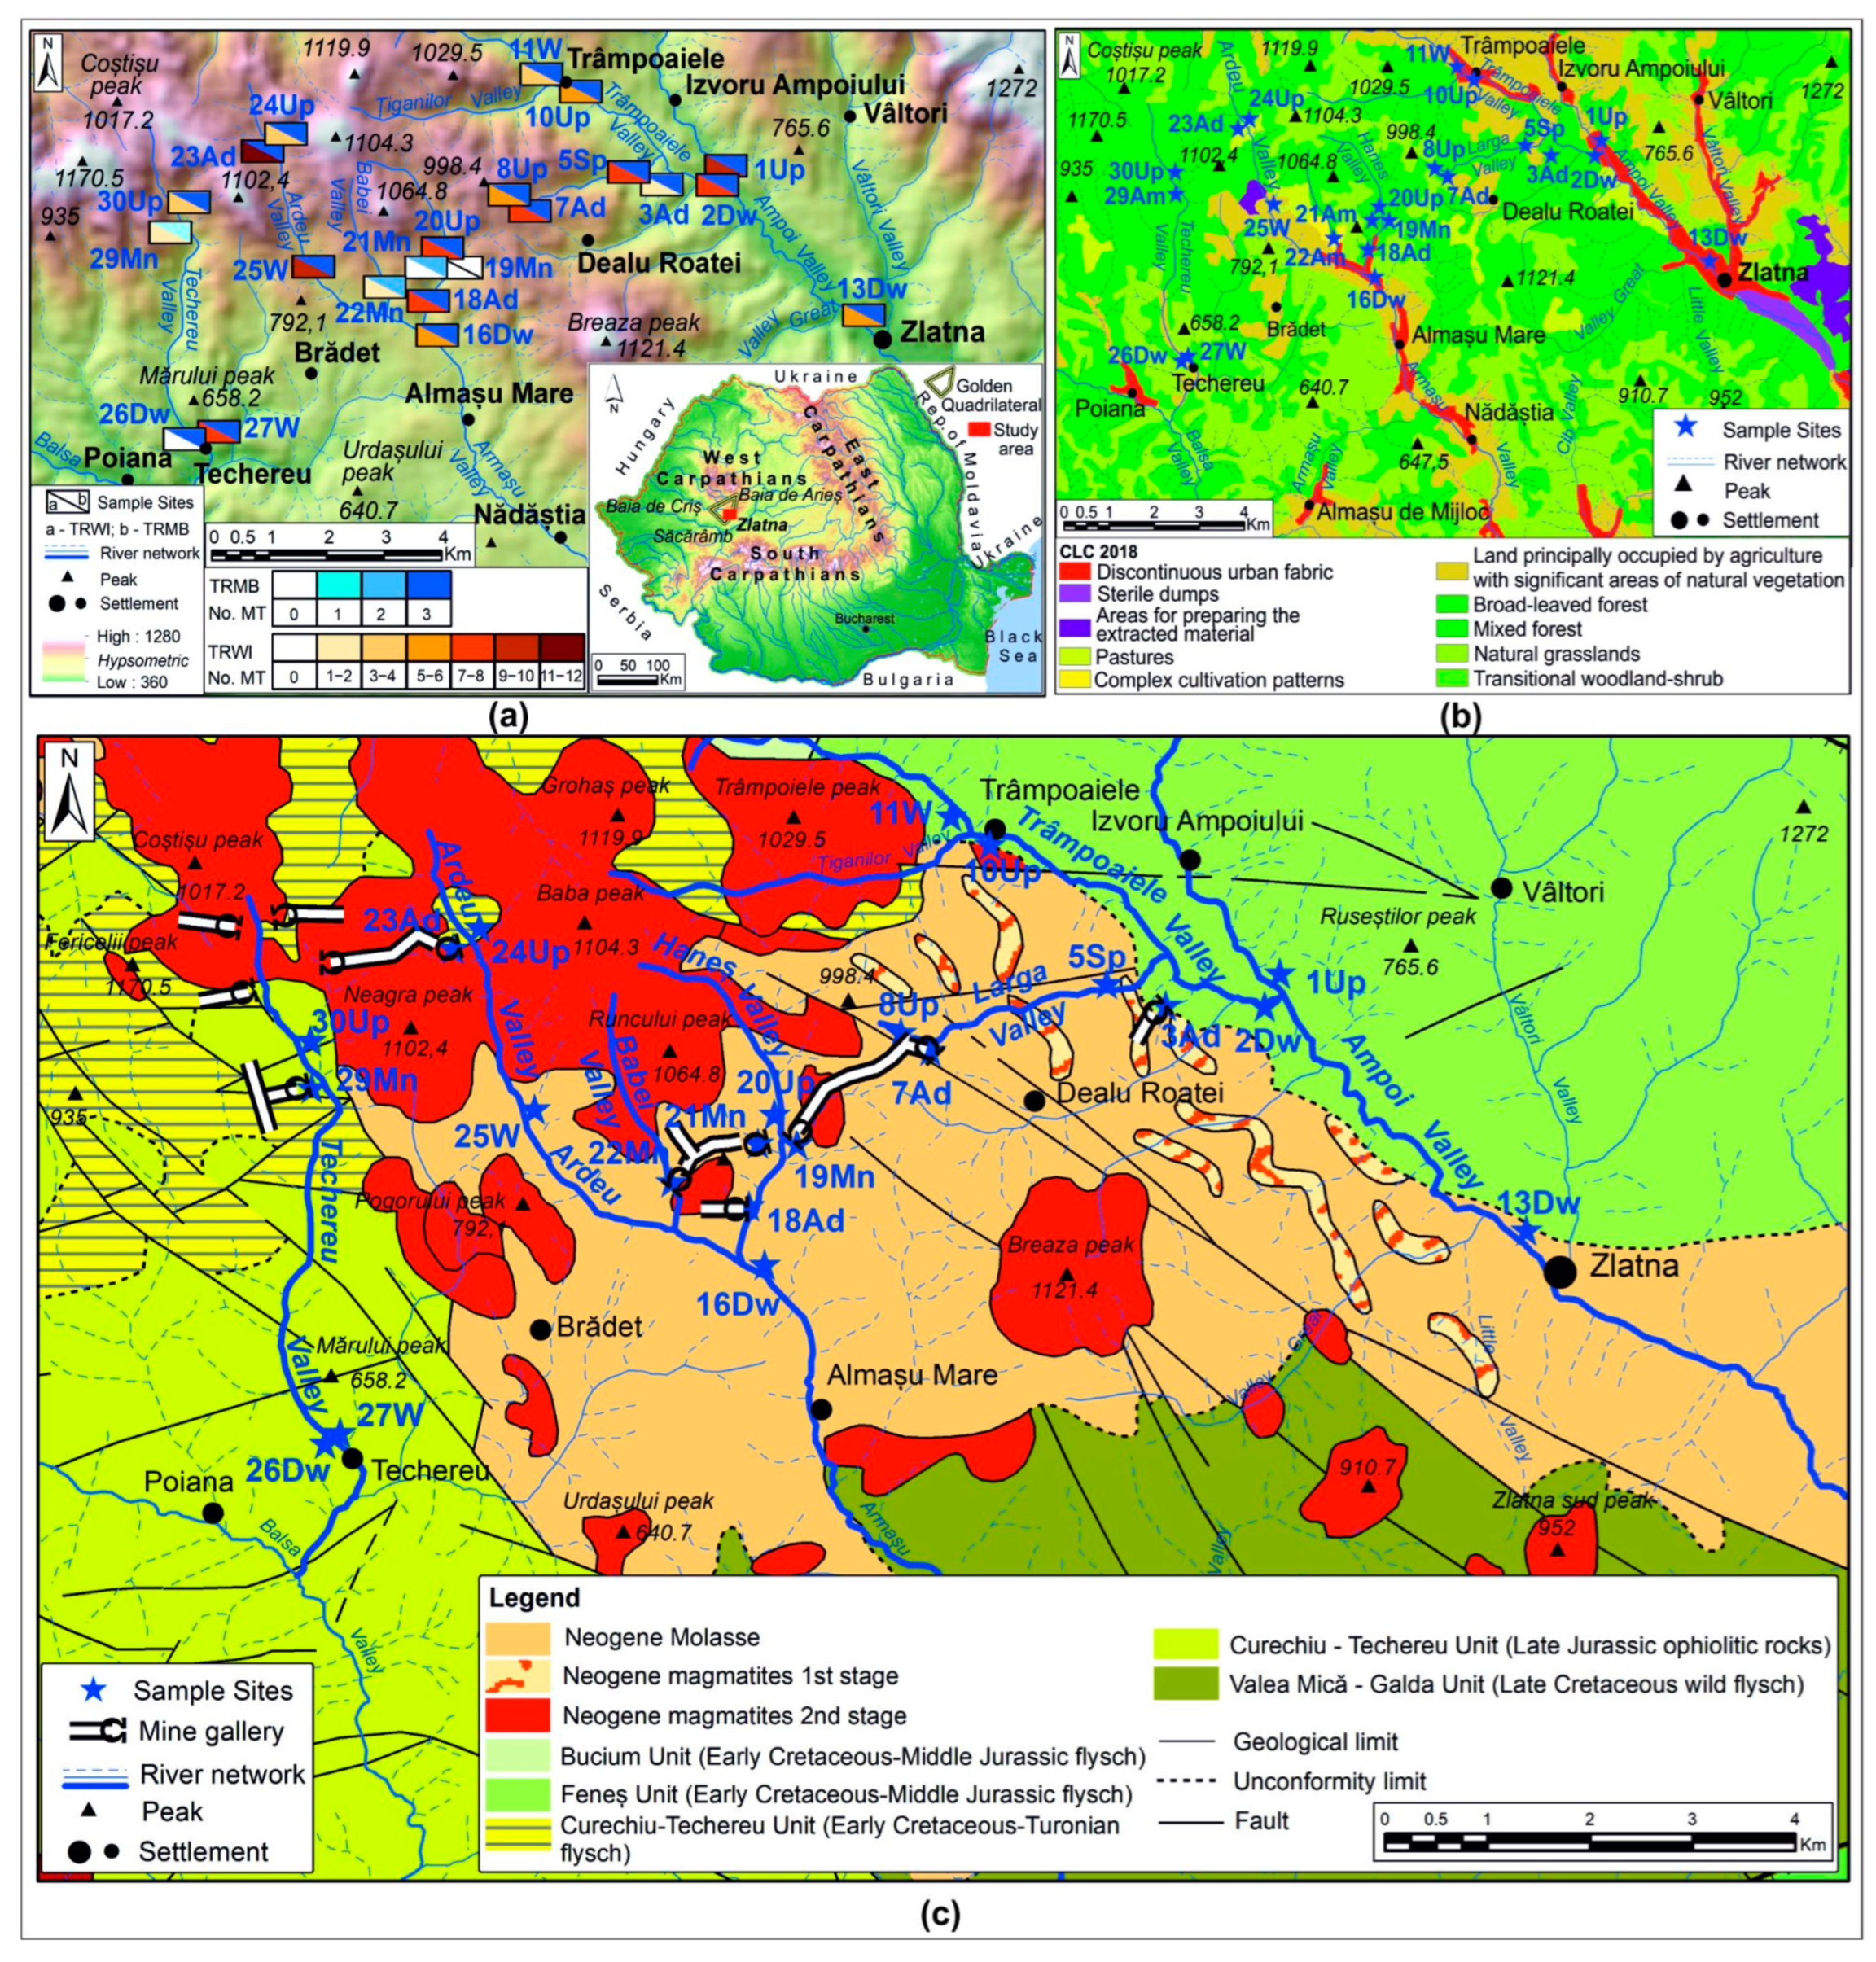
2.1. Study Area

The study area, known as the Gold Mining Area of Zlatna (GMAZ), is situated in the Metaliferi Mountains of the South Apuseni Mountains (western Romania), and spans an area of 40 km2. It is a part of the renowned GQ, estimated to contain 1732 t of gold and 1670 t of silver that can be extracted from this area alone [34]. The region also holds substantial deposits of other metals, including copper, lead, zinc, and mercury [40], and spans an area of about 900 km2 [21,41,42], delimited by the Baia de Criș, Zlatna, Săcărâmb, and Căraci localities. The GMAZ study area, located at elevations between 420 and 1100 m.a.s.l, has an average annual temperature of 10.5 °C and a moderate rainfall range of 480–700 m/year. Its hydrographic network density of approximately 1 km/km2 [21] is higher than the national average of 0.33 km/km2 [43]. Large-scale gold mining in the GMAZ area was historically carried out through underground mines. Intensive mining activities have ceased since the 1990s, with the last mine being closed in the summer of 2006 [42,44]. However, despite the closure of the mines, pollution from AMD continues to be a major concern in the region, due to the contamination of surface streams and underground water. Our sampling sites include the three main rivers, Ampoi, Ardeu, and Techereu, as well as their tributaries, which collect water from several closed mines and adits (Figure 1a,b). Each of the sampled sites has unique water characteristics, biota richness, geological features, and land use patterns (Figure 1; Table 1 and Table S1).
The interdisciplinary aspects, including a comprehensive understanding of the geological structure in the study area, are essential for gaining valuable insights into the influences of the ore deposits and surrounding rocks on the chemistry of water bodies and, consequently, on the biota patterns. In this context, it is crucial to emphasise that the current geological structure of the South Apuseni Mountains is the result of Laramian tectogenesis, and the study area comprises several tectonic units that are in an overthrust assemblage [45]: (1) the Bucium Unit, which occurs in small areas in the north-eastern part of the study area and consists of poorly calcareous layers of Pârâul Izvor and a detritic Maastrichtian series; (2) the Feneș Unit, which is of Neocomian–Aptian age and consists of calcarenites, calcareous sandstones, clays, and conglomerates; (3) the Curechiu–Techereu Unit, which supports an Early Cretaceous–Turonian flysch-type succession with calcareous marls, sandstones, and conglomerates placed above the Late Jurassic ophiolitic rocks (basalts, gabbro, andesite with hornblende, and pyroclastites); (4) the Valea Mică-Galda Unit, which encompasses detritic black argils and marls formations which also may include limestone blocks and ophiolitic rocks; (5) the Middle and Upper Miocene-aged Neogene molasse, containing the Faţa Băii conglomerates, the Almașul Mare gravels with intercalations of sandy-marls (limestones that contain Lithothamnium), a formation with gypsum lenses, and the acidic volcano-sedimentary formation (the Neogene magmatic rocks—1st stage); and (6) the youngest rocks from the study area, the Neogene magmatic rocks—2nd stage. These rocks, formed between 14.8 and 7.4 million years ago [46], intrude into or overlay the older rocks. They are associated with gold-bearing polymetallic deposits which have been the primary target of mining operations in the Zlatna area (Figure 1c and Table 1). In the study area, there are three types of mineral ore deposits: (1) porphyry, which may or may not have associated veins in their upper part, (2) independent veins, and (3) breccia pipe. All three of these deposit types are responsible for the formation of gold ore deposits, which may contain additional minerals such as silver (Ag), copper (Cu), lead (Pb), and zinc (Zn) in varying quantities.
The most recent mining activities in the region were carried out in two mine groups until 2006: (1) the Haneș group of mines (HGM) comprises 19 Mn, 21 Mn, 22 Mn, and 3 Ad, which is a low-mineral prospecting adit, and 7 Ad that is an older section with a depleted vein of ore; and (2) the Stănija group of mines (SGM), which includes the mine 29 Mn. Other adits, such as 18 Ad in the HGM and 23 Ad in the SGM, were closed earlier in the 1990s.
According to the study conducted by Papp et al. [21], an isotopic analysis of hydrogen and oxygen indicated that all the water sources in the GMAZ, including surface running water, domestic wells, springs, and mine water, are part of the meteoric cycle. Another study by Papp [47] analysed the 14C content of dissolved inorganic carbon in these water sources, and found that they are mainly a mixture of pre-modern groundwater and modern water from precipitation.

2.2. Sampling Strategy

The 22 water sites in the study area (Figure 1) were sampled seasonally for physicochemical (ph-ch) measurements and culturable microbiota (MB) quantification in the spring (Sp-15), summer (Su-15), autumn (Au-15), and winter (Wi-15) of 2015. The water invertebrates (WI) were collected in Su-15, Au-15, and Wi-15. The 11 W site was completely dry in Su-15 and had a minimum level of water that did not allow for the filtering of the 10 L waters from the WI collection in Sp-15 and Au-15.
The sampling sites included five types of water sources (Table 1): (1) mine waters (Mn) with four sites from the most recently closed exploitation mines; (2) adit waters (Ad) with four sites from earlier closed, depleted, or low-minerals adits; (3) surface running waters with four sites downstream (Dw) of mine drainage points; (4) surface running waters with six sites upstream (Up); and (5) groundwaters (Gw) with three wells (W) and one spring (S). As all mines in the GMAZ are now closed, the water samples were collected at the entrances of the mines, where the drainage waters are either free-flowing or quasi-stagnant, forming small pools that contain a mixture of contaminated water and rainwater (Table 1).
To assess the impact of mining pollution on water biota over time, further samples were collected at the same sites in the autumn of 2022 (Au-22) and winter of 2023 (Wi-23). For comparisons between 2015 and 2022/2023, we only used samples collected during the same seasons (Au and Wi) to ensure that the samples were collected in similar environmental conditions. At each site, we first sampled the culturable microbiota, then measured on-site the physicochemical parameters of the water, and finally filtered the water for meiofauna and macroinvertebrates.

2.3. Physicochemical and Environmental Parameters

Water temperature (WT, °C), pH, conductivity (EC, ɥS/cm), and dissolved oxygen (DO, mg/L) were measured on-site using a multiparameter device (Hanna Instruments, Woonsocket, RI, USA, HI 9828 series). For further details on the accuracy of the measurement method, please refer to Borda et al. [48]. Other physicochemical parameters were reported by Papp et al. [21].
The air temperature at 2 m above ground level (T2M) and precipitation (PP) data for the study area were obtained from the POWER Data Services databases [49,50]. MERRA-2 (Modern-Era Retrospective Analysis for Research and Applications, version 2) was used to obtain the precipitation data [51]. T2M and PP data were obtained for the surface of the GMAZ during the sampling periods, and we included the seasonal averages in our analyses. These averages were calculated from the daily values recorded during the respective months of sampling (Supplementary Table S2). To investigate the possible influence of environmental variables on biota patterns, land use and climate (PP and T2M) were taken into consideration. Land use was determined using the Corine Land Cover spatial database from 2018, in a grid format with a resolution of 100 × 100, represented on a Stereo 70 system [52].

2.4. Culturable Microbiota and Water Invertebrates Assessment

To assess the content of culturable microbiota in the water samples, we used two types of ready-to-use dry medium plates (R-Biopharm AG, Darmstadt, Germany) suitable for the microbial monitoring of water. We used Compact Dry TC for the quantification and detection of the total count of culturable heterotrophic aerobic bacteria (TC), and Compact Dry YM for the quantification and detection of viable yeasts and moulds (YM). The 50 mm diameter Petri dishes contained pads with culture medium with standard nutrients. We applied 1 mL of the sampled water directly onto the plates. The plates were then incubated at 36 °C for 48 ± 3 h for the TC plates, and at 25 °C for 5 days for the YM plates. After incubation, the number of colonies were counted and the results were expressed as colony-forming units per millilitre (CFU/mL).
To sample the water invertebrates (WI), we filtered 10 L of water from the sampling sites through a 50 μm mesh-sized hand net. The animals were then fixed in 70% ethanol, counted, and sorted at different taxonomic levels for meiofauna (<500 μm size) and macroinvertebrates (≥500 μm size) under a stereoscope (SZR-10, Optika Microscope, Ponteranica, Italy). The term water invertebrates (WI) in this paper refers to both meiofauna and macroinvertebrates.

2.5. Data Analyses

In order to assess the biodiversity in the water sites in this study, we calculated the taxonomic richness (TR) for the major taxa of culturable microbes (TRMB) and water invertebrates (TRWI) (Figure 1a) at each of the 22 water sites, based on all the samples collected in 2015 and 2022/2023. The major taxa (MT) were defined as representatives of a particular higher taxon (genera, families, orders, phylum) based on meiofauna morphological divergence (Acariformes, Amphipoda, Cladocera, Coleoptera, Cyclopoida, Collembola, Diptera, Ephemeroptera, Gastropoda, Harpacticoida, insect fragments, Isopoda, Lepidoptera, Megaloptera, Odonata, Ostracoda, Plecoptera, and nauplii of Copepoda) or microbial culture media nutrient requirements (culturable aerobic bacteria, yeast, and moulds). TR was calculated by summing up the total number of major taxa found in all the samples collected from a water site. The taxonomic richness of biota (TRB) was calculated as the sum of TRWI and TRMB, in Au and Wi for each site, in order to compare the TRB between 2015 and 2022/2023.
The total abundance (TA) was calculated for each of the 22 water sources as the total number of individuals of a taxon or total CFU/mL, collected from all the samples of each water site. The relative abundances (RA%) of water invertebrates and microbes were calculated as the ratio between the number of individuals or total CFU/mL of a taxon found in all the samples from one water site and the total number of individuals or total CFU/mL summed up from all the water sites. The frequency (F%) of WI and MB was calculated as the ratio between the number of samples in which a taxon was present and the total number of samples, expressed as a percentage.
R version 4.2.2 [53] was used to perform the statistical analyses. The Pheatmap Package, version 1.0.12 [54], was used to explore patterns of relative abundances of microbiota and meiofauna. The ggplot2 package [55] was used to graph individual value plots to examine and compare patterns of physicochemical parameters among the mine-affected waters. The normality of the data was tested using the Shapiro–Wilk test, and the strength of the relationship between HM and biotic features was assessed using the nonparametric Spearman rank correlation coefficient (rS). The unpaired two-samples Wilcoxon rank sum test with continuity correction was used to test for significant differences in the biota and physicochemical parameters between the 2015 and 2022–2023 water samples. Differences were considered statistically significant at p < 0.01 for the Spearman rank correlation analysis and p < 0.05 for the Wilcoxon rank sum test. The correlation analysis was performed using PerformanceAnalytics version 2.0.4 [56]. The values of Cu, Cr, Fe, Ni, Pb, and Zn used in our analyses were previously published [21], and correspond to the same time and sites as the biotic measurements conducted in 2015 (Sp-15, Su-15, Au-15, Wi-15) reported in this paper. To summarise the relationship between env, ph-ch, and MB or WI, we used the FactoMineR package, version 1.41 [57] to compute the multiple factor analysis (MFA) on the dataset. The quantitative continuous variables for the ph-ch parameters were standardised during the analysis, and the MFA results were visualised using the factoextra package, version 1.0.7 [58].

3. Results and Discussion

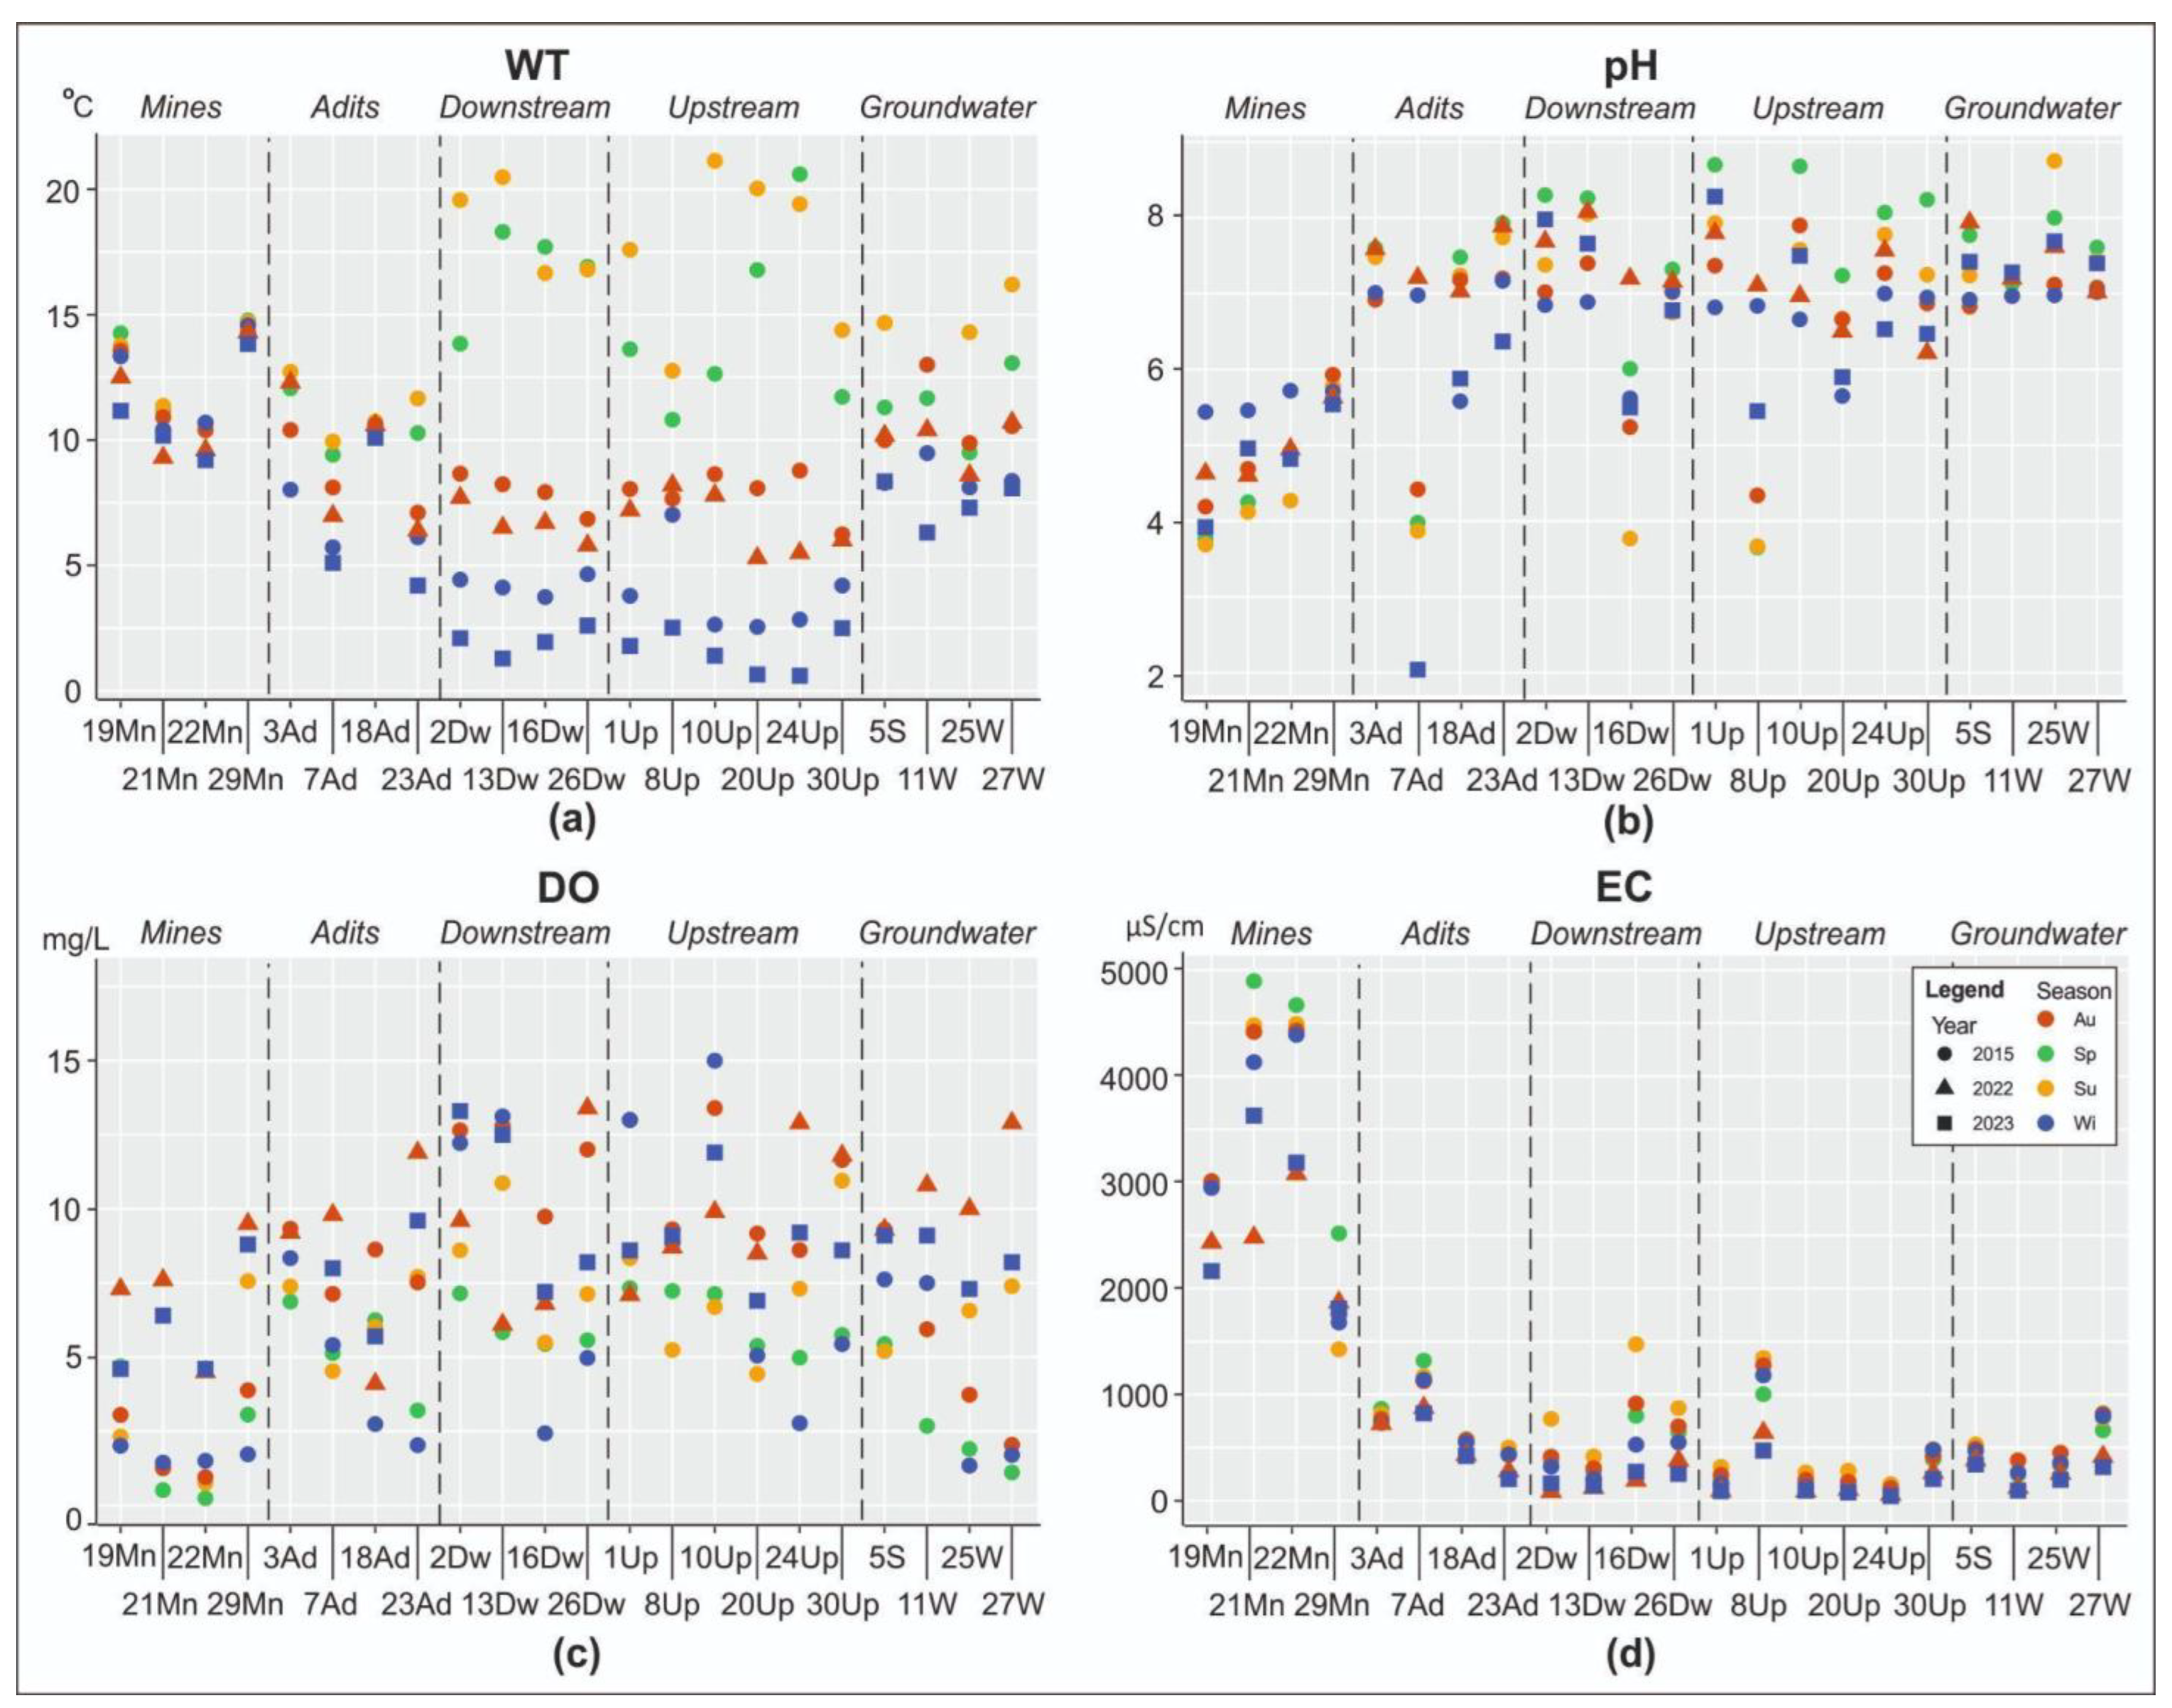
3.1. Sites’ Geology and Physicochemical Features of Waters

To provide an overview of the physicochemical features of the water samples collected from the GMAZ, Figure 2 displays the individual values of WT, pH, DO, and EC.
WT varied greatly across the water samples, with notable seasonal differences observed in all the running surface waters. The groundwaters and adits, less exposed to ambient conditions, had less-scattered WT values, while the mine waters showed the most constant temperatures. Mines, like caves, are underground structures with constant environmental conditions which maintain a multiannual average temperature (MAT) of the local external atmosphere [59]. The drip water temperature is controlled by the underground climate and water flow-induced convection derived from the subsurface water percolation [60]. Additionally, in mines with large amounts of metallic minerals, exothermic oxidation reactions can occur [61], leading to an increase in WT. These conditions are more pronounced in 29 Mn, where the WT is higher than the MAT and remains relatively constant compared to open waters or other underground waters. The mines in the GMAZ exhibit a development pattern similar to natural karst systems, with overlapping vertical horizons characterised by lower flood horizons and higher free-flow horizons. Typically, the drainage of mine water is situated at an intermediate level and, due to the large volume of water stored at lower levels, the seasonal variations in WT are minimised. In the case of 18 Ad, which has extensive underground development but fewer exothermic reactions, the seasonal fluctuations in WT are reduced and the WT is closer to the MAT.
The pH values of the sampled waters of the GMAZ ranged from 2.04 (7 Ad, winter 2023) to 8.75 (25 W, summer 2015). The mine waters were found to be the most acidic, the groundwaters were more alkaline with a constant pH, while the adit and surface waters had the most variable pH. The geology of the region (Figure 1) plays a crucial role in determining the chemical composition of the water, including pH, with the type of ore deposits and bedrock chemistry influencing pH levels [62] in all types of waters. The sites that collect waters from the alkaline ophiolitic and carbonate sedimentary rocks of the Curechiu–Techereu, Bucium, and Feneș Units showed the most constant (Figure 1: 29 Mn, 27 W, 26 Dw, and 11 W) and alkaline pH values (Figure 1: 1 Up, 10 Up, 2 Dw, and 13 Dw). The DO was lowest in the mine waters and highest in the surface running waters, with values ranging from 0.24 mg/L (22 Mn, summer 2015) to 14.98 mg/L (10 Up, winter 2015). The EC ranged from 43 µS/cm (24 Up, winter 2023) to 4895 µS/cm (21 Mn, spring 2015), with the mine waters having the highest EC and consistently exceeding 1800 µS/cm. Similar results, such as high EC and low DO, were also reported for the mining drainage, surface, and underground water sources affected by pollution from AMD originating from the closed gold mines in Central Bosnia and Herzegovina [63].
The measured physicochemical parameters of water quality show that the mine waters are considerably different from the other monitored waters. The most visible evidence of water pollution is the coloration of the water. At all Mn sites, as well as at 3 Ad and 7 Ad, an ochre precipitate was observed. When the mine waters exit from the underground, the ochre precipitate is formed due to the precipitation of soluble iron as iron hydroxide [7]. This occurs when the acidic mine waters come into contact with neutralising minerals and increase their pH. A previous study by Papp et al. [21] revealed that the chemical composition of water in the GMAZ is influenced by two different mineralogical environments: (1) sulfidic ores, particularly pyrite, which produce acidic mine drainage (AMD) with high concentrations of SO42− and low or no HCO3 content; and (2) carbonate minerals, which produce hard water with a neutral pH, high concentrations of Ca, Mg, and HCO3 (alkalinity), and low concentrations of SO42−. The lowest SO42− and Fe concentrations and neutral pH (7.5) were found in the groundwaters, which can be considered as background water unimpaired by AMD. Regarding mine water, the pH values, SO42− concentration, and total Fe concentration were used to identify three subtypes of AMD: (1a) typical AMD, with a low pH (~4), high EC values, and high concentrations of SO42− and dissolved metals, found at sites 7 Ad, 19 Mn, 21 Mn, and 22 Mn; (1b) partially neutralised AMD, with a higher pH (~6), lower EC values, and slightly lower concentrations of SO42− and dissolved metals due to the carbonate minerals in ophiolites, observed at 29 Mn; and (1c) neutralised AMD, with a neutral pH (~7.5) and much lower concentrations of SO42− and dissolved metals. This neutralised AMD occurs either because of the complete leaching of pyrite and other sulphides in old abandoned mining works (18 Ad and 23 Ad) or because it is discharged from an exploration adit (3 Ad). There are two known types of ochres in the literature [64]: one formed under strongly acidic conditions with high concentrations of Al, like in the case of 7 Ad, 19 Mn, 21 Mn, and 22 Mn; and another ochre formed in slightly acidic or neutral conditions enriched with Cu, Pb, Zn, Mg, and As, as in the case of 29 Mn, 3 Ad, 18 Ad, and 23 Ad.

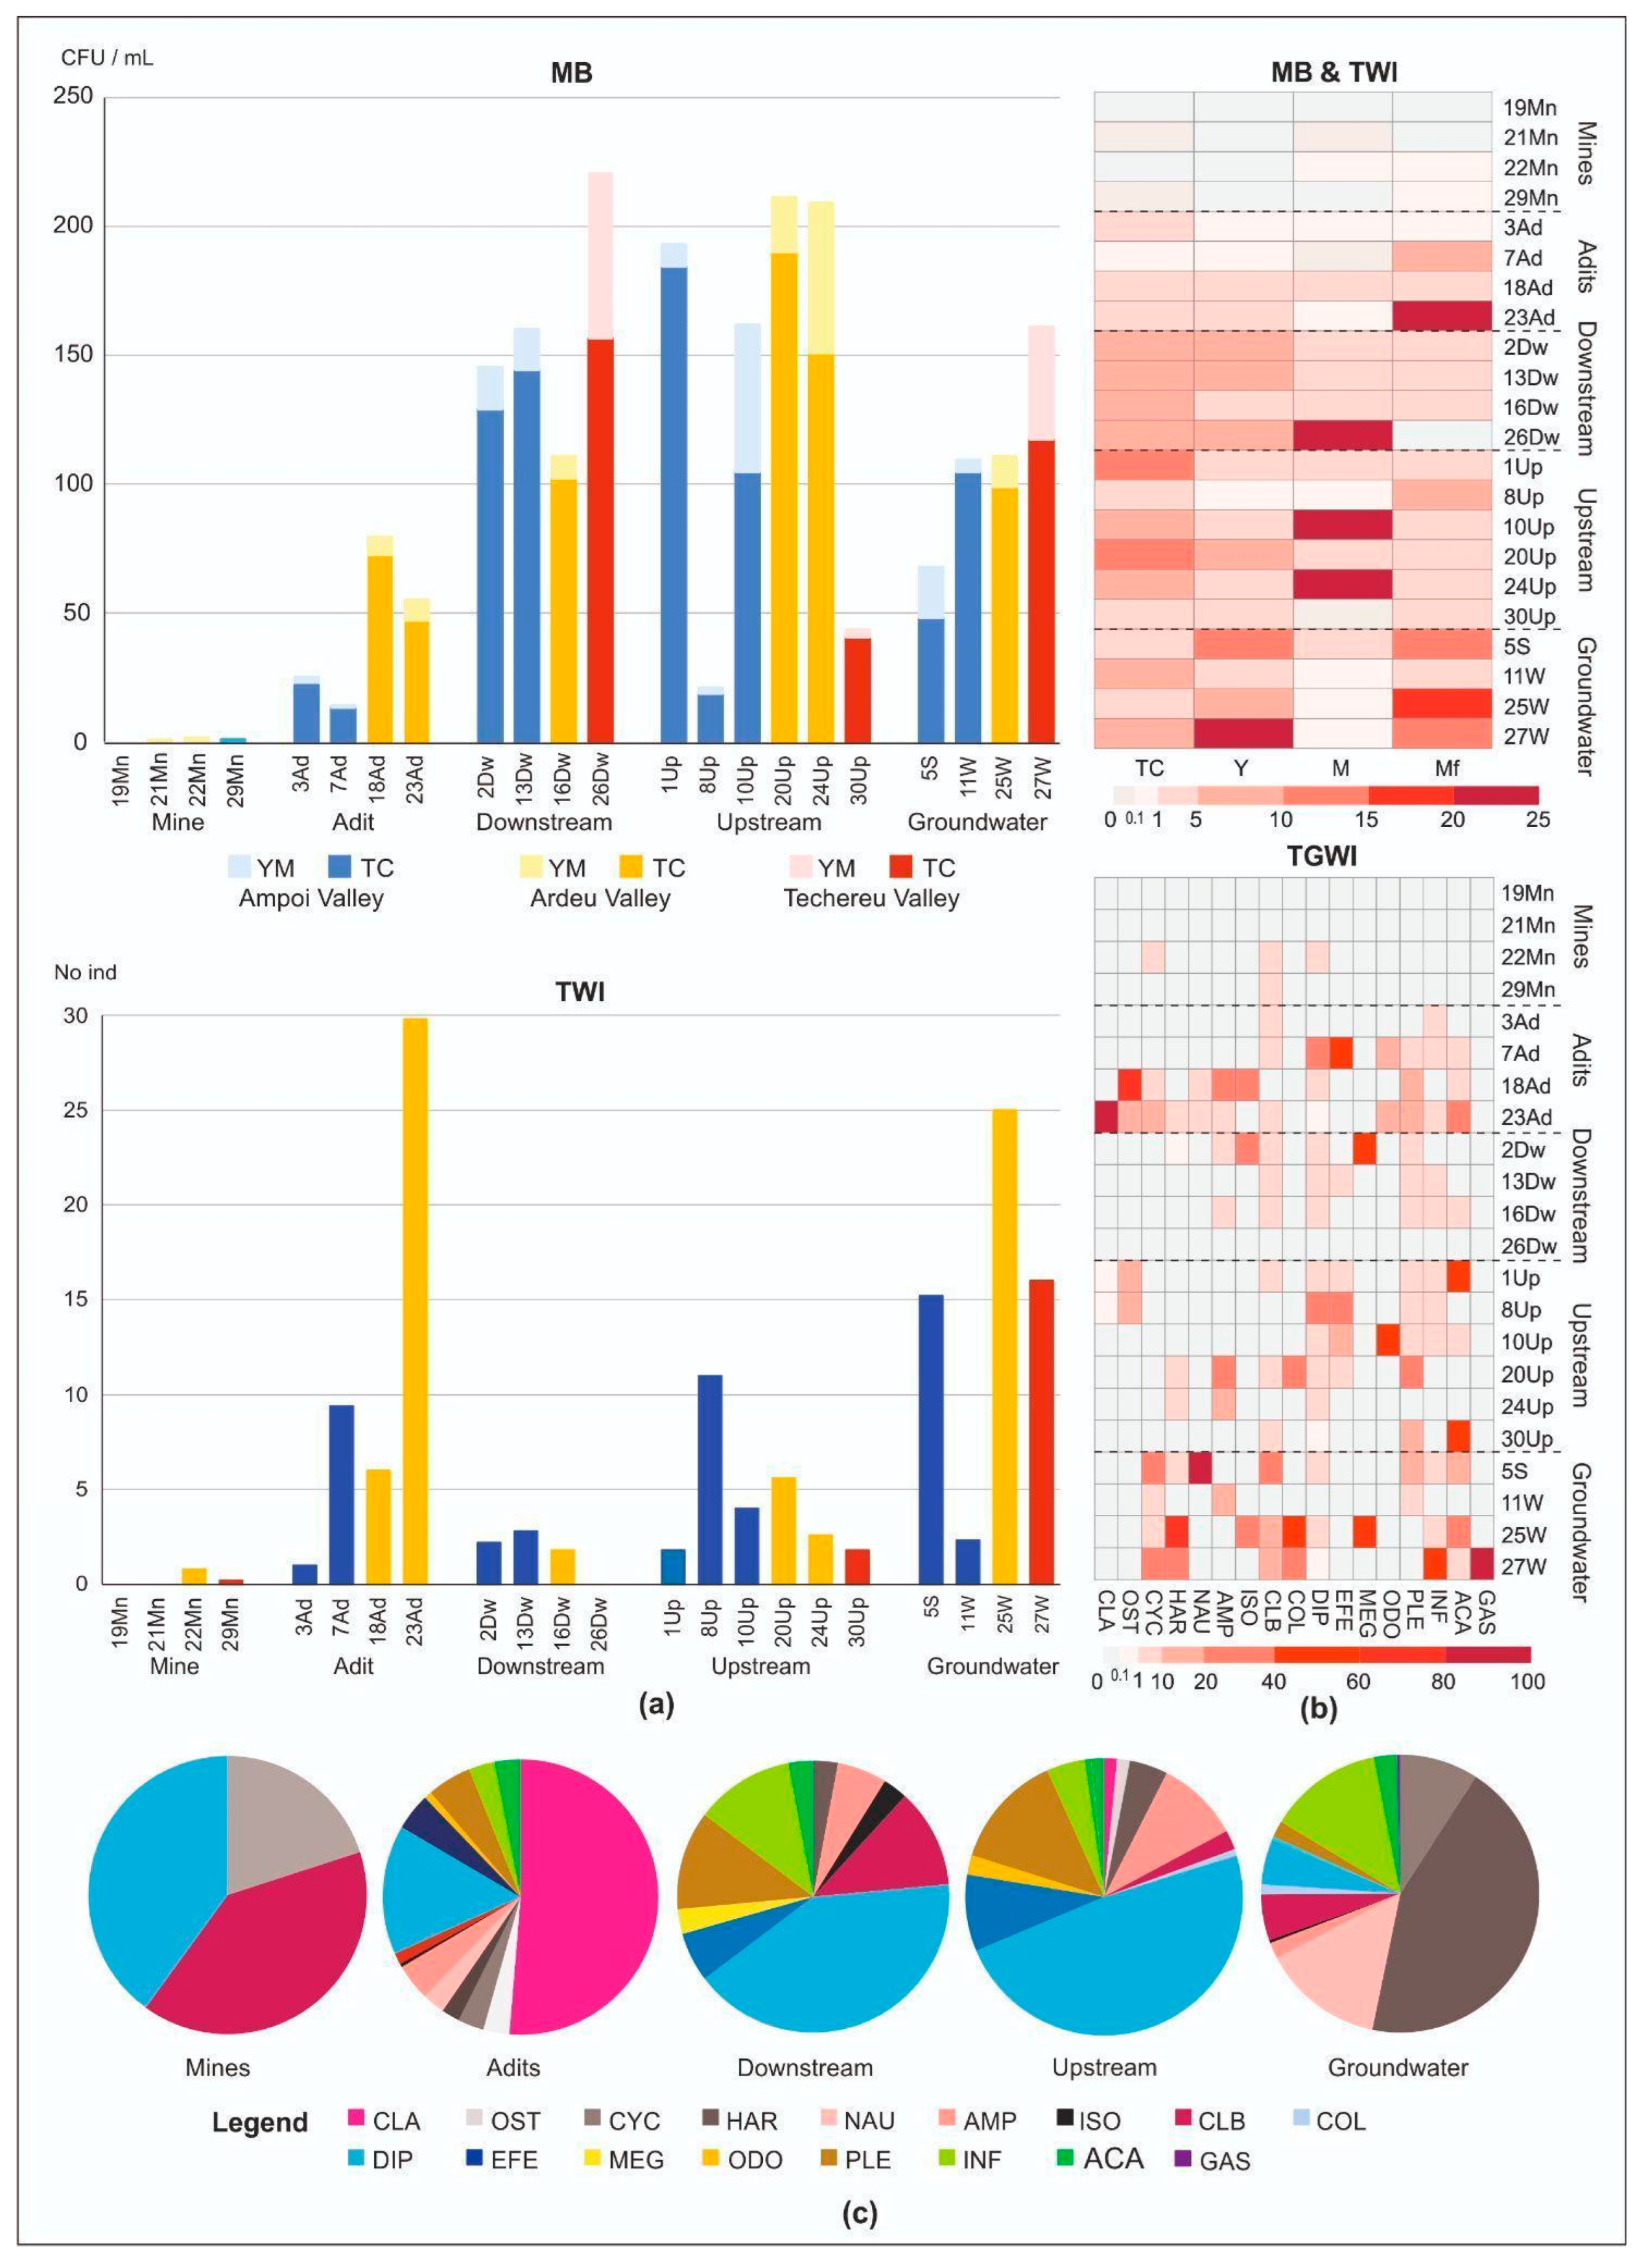
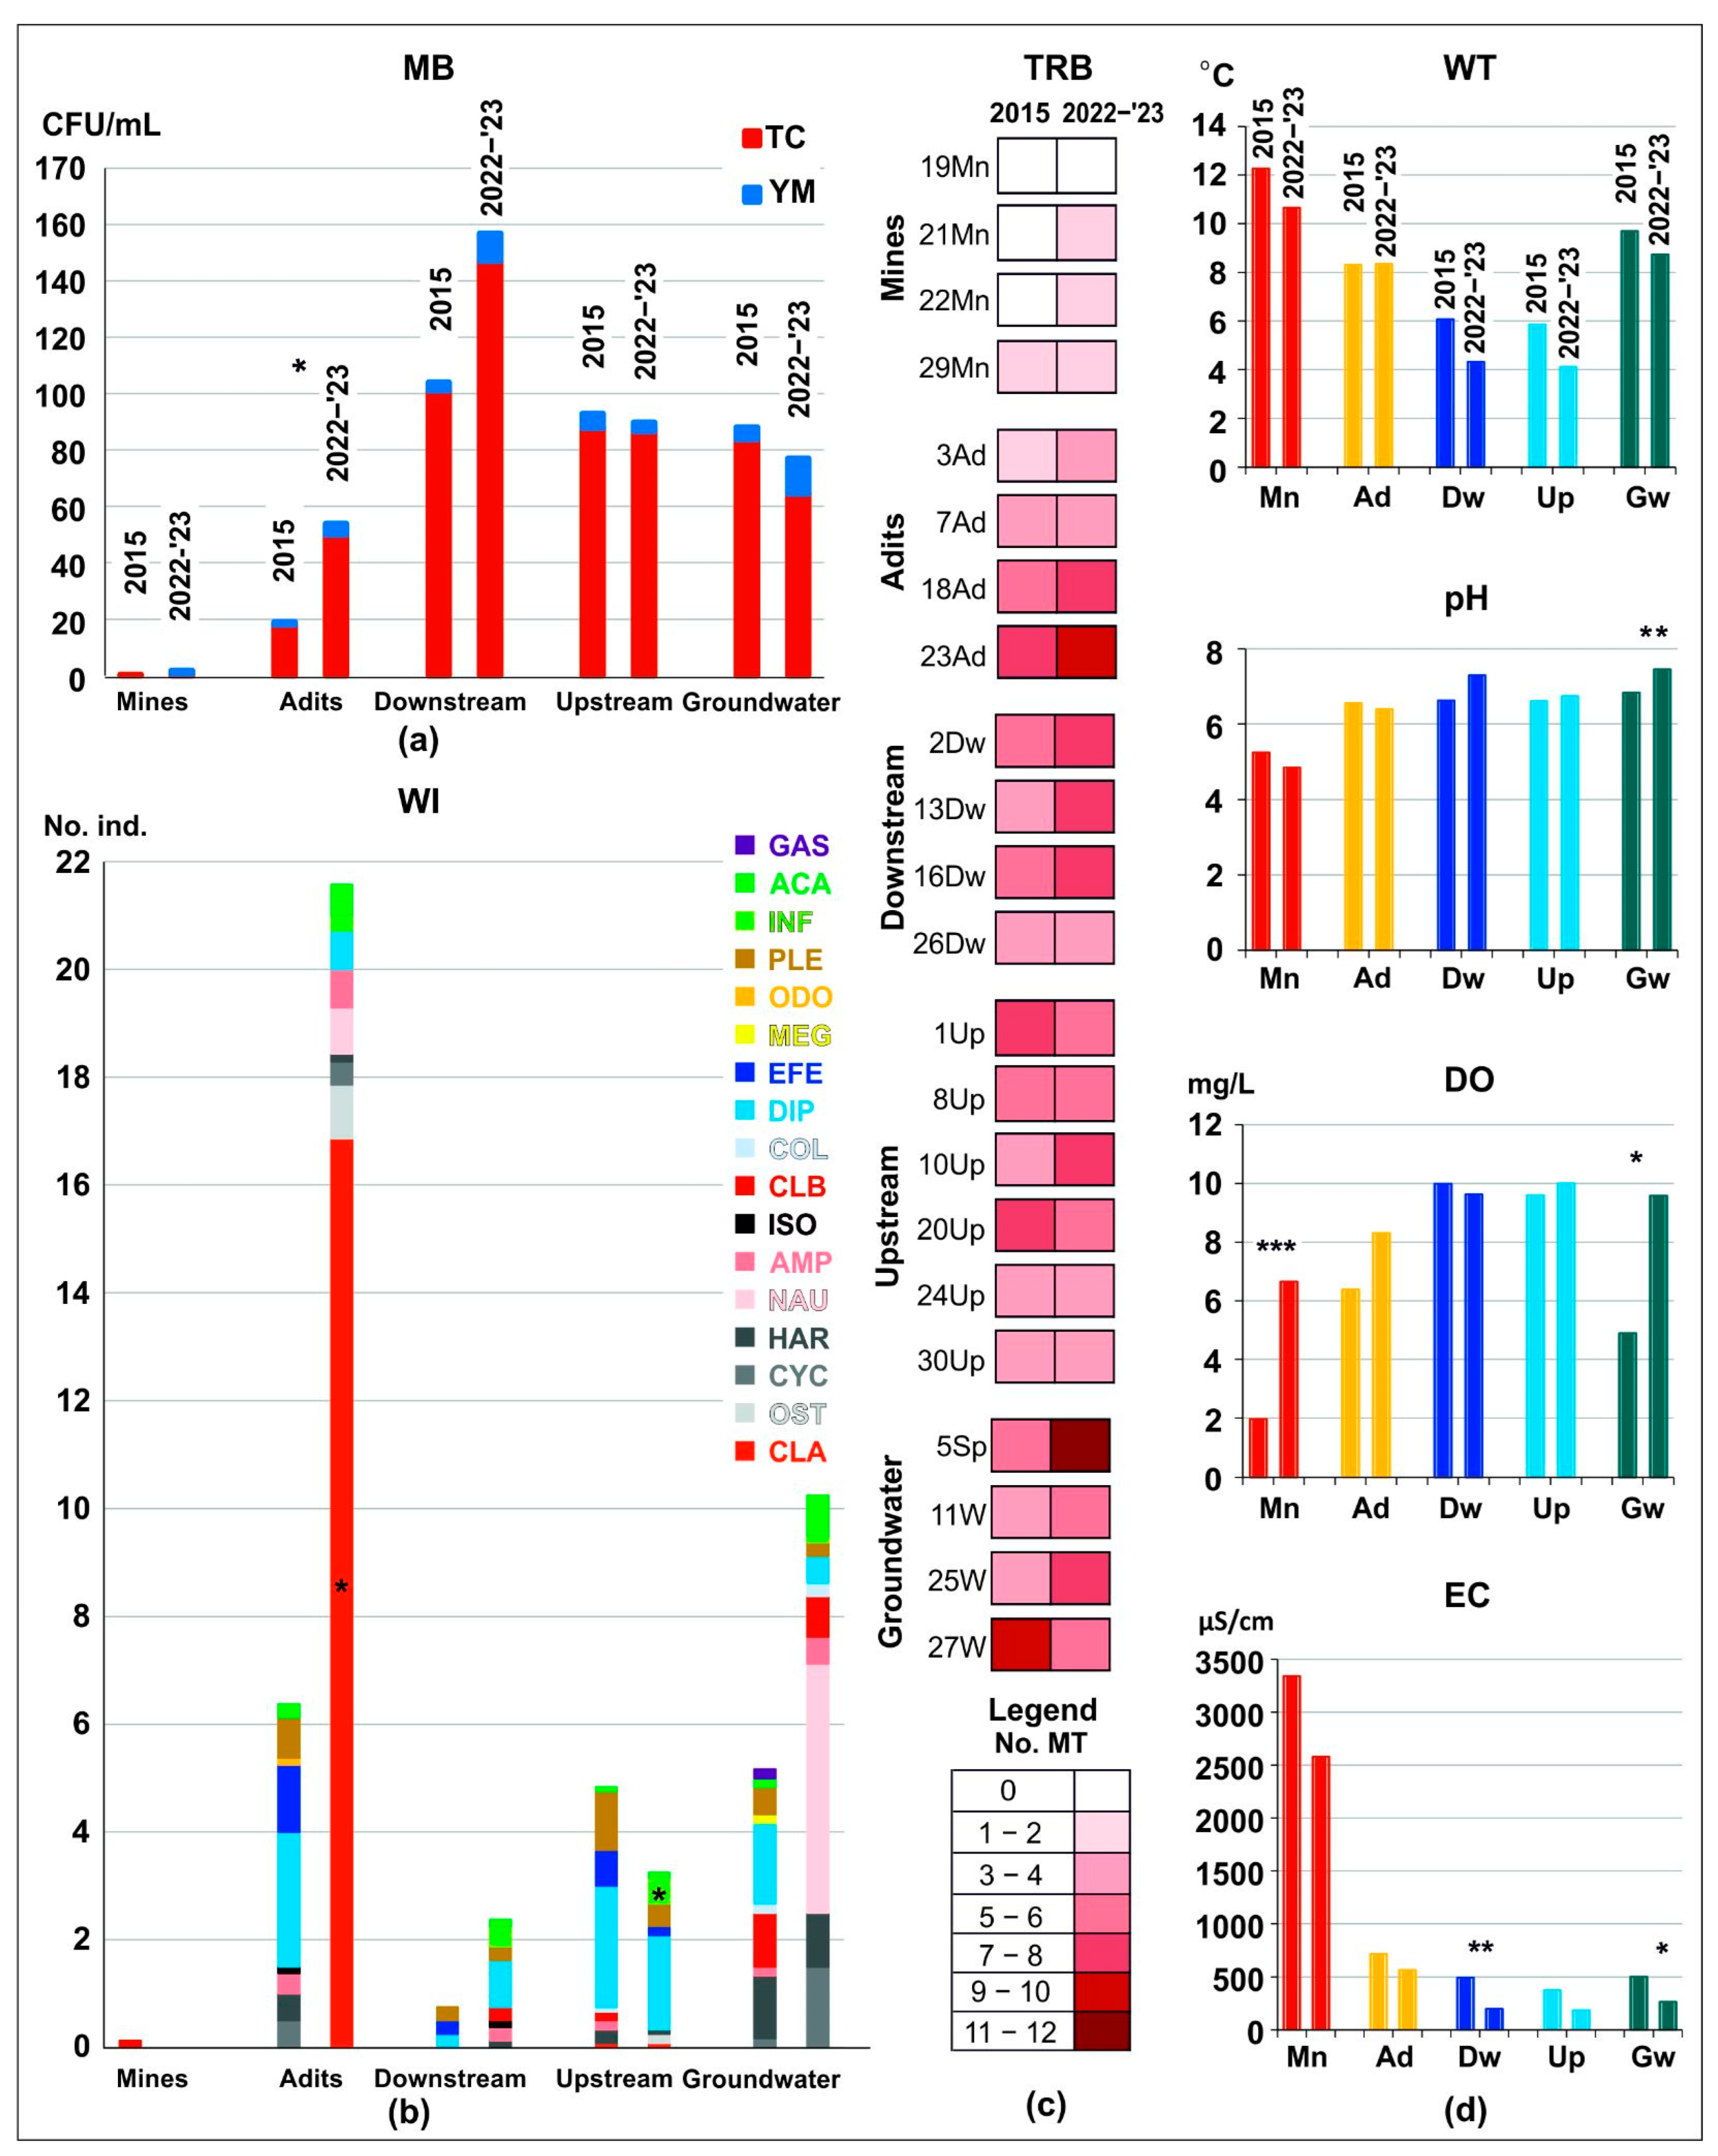
3.2. Culturable Microbiota and Water Invertebrates in the GMAZ

Aquatic MB and WI were visibly impacted in the mine waters (Figure 3, Supplementary Tables S3–S6), with the 19 Mn site being the most polluted and unable to support life.
The presence of viable TC, YM, or WI was undetectable at this site and only a few organisms were found in the rest of the mine waters (21 Mn, 22 Mn, and 29 Mn) and at 7 Ad. MB was less-developed in the adits and was medium in the groundwaters, but well represented in the running waters, with a few exceptions (8 Up, 30 Up) discussed below. The YM and TC average values (Figure 3a, up) showed a similar pattern to the chemical composition (SO42− and heavy metals) and pH of all the water sources in the study area, consistent with previous findings by Papp et al. [21]. Spearman’s correlation indicated moderate-to-strong negative correlations between the culturable microbiota (TC and YM) and the concentration of each heavy metal (Cu, Cr, Fe, Ni, Pb, and Zn) in the sample sites (Figure 4a).
The relationships with the geochemistry of the sample sites, as previously reported by Papp et al. [21], can be highlighted as follows: the lowest YM and TC values were found in typical AMD and partially neutralised AMD water sources (7 Ad, 19 Mn, 21 Mn, 22 Mn, and 29 Mn), while the neutralised AMD water sources (3 Ad, 18 Ad, and 23 Ad) had higher YM and TC values. The highly impacted surface running waters of Larga creek (8 Up impaired by the AMD generated by the stockpiles from the upper part of the Haneș-Larga veins of ore), Ardeu downstream (16 Dw impaired by the AMD from the HGM), and Techereu upstream (30 Up impaired by the AMD from other galleries of the SGM located at upstream 29 Ad) show low YM and TC values. In contrast, the less-impacted surface running waters of the Ampoi upstream (24 Up) and Haneș upstream (20 Up) show higher values of MB. The Larga spring (5 S), the most impaired underground source due to the infiltration of polluted waters from the Larga adit (7 Ad), displays lower MB values than other groundwater sources. Despite being affected by the AMD originating from 29 Ad, the Techereu downstream (26 Dw) and the nearby domestic well (27 W) show high MB values. This could be attributed to their connection with phreatic water as well as the alkaline rocks of the Curechiu–Techereu Unit. All these findings suggest that MB is a reliable environmental indicator.
Many studies have shown that microorganisms can be used as bioindicators for water quality [65,66]. Coliform bacteria, E. coli, and faecal Streptococci are commonly used as indicators for sewage pollution and faecal contamination in drinking water [67,68,69]. Additionally, the total count of heterotrophic mesophilic microorganisms can indicate organic pollution from livestock farming [67], agriculture and domestic sources [70,71], or from other natural environments rich in organic materials, such as caves [72,73]. In underground voids such as mines or caves, dripping water can contain viable microorganisms. For example, in the Škocjanske caves in Slovenia, the bacterial concentration of dripping water varied from 0.5 to 2.2 CFU/mL, with a bacterial discharge rate ranging from 2.6 to 15.4 CFU/min [74]. These values are relatively low compared to the more heavily polluted environments such as the Altamira cave, where bacterial counts were reported to range between 75 CFU/mL and levels too numerous to count [75]. In cases of sewage pollution or organic pollution, a greater presence of CFUs typically indicates higher pollution. However, in the case of mine waters, microorganisms play a dual role. Acidophilic bacteria and archaea are involved in mining operations and accelerate the dissolution of pyrite and other sulphide minerals to form AMD [76,77]. On the other hand, remedial microorganisms, such as algae, bacteria, fungi, or sulphate-reducing microorganisms, can remove HM and other particulate materials and neutralise water acidity [77,78,79]. Our findings, supported by the geochemistry results, suggest that heterotrophic aerobic bacteria and fungi can be used as an effective, low-cost, rapid, and user-friendly method to monitor gold mining pollution in mine, surface, and underground waters. The absence or low presence of microorganisms indicates strong pollution with AMD or HM in mine waters, even after the end of mining operations and mine closure. The same methodology which includes the quantification of TC and YM using the ready-to-use Rida Count test kit has already been successfully applied to monitoring anthropogenic pollution in cave habitats [80,81], water flow or pools in caves [73], and as a culturable microbial indicator in wastewater treatment systems [68]. The collective evidence from these results confirms the efficacy of the ready-to-use nutrient plate system as a robust, versatile, rapid, and safe method for determining and quantifying the various culturable microorganisms in the environment. The added advantage of using a portable mini-incubator is the straightforward acquisition of results directly in the field during a monitoring campaign. The abundance and TRWI also varies across the different water sources in the study area. It appears that the abundance of WI did not match the patterns observed for MB in the study, except in the mines, where WI were absent (19 Mn and 21 Mn) or very low, similar to the patterns for MB (Figure 3a,b). For example, at the downstream sites, WI were present with very few individuals or even absent, such as in 26 Dw, while MB values were higher. On the other hand, the upstream waters showed a moderate-to-high abundance of WI. The highest abundance of WI was observed in the groundwaters and, surprisingly, in 23 Ad. This exception can be attributed to the pool formed in front of the closed entrance, where AMD from inside mixes with meteoric waters. The neutralising effect of the ophiolitic rocks in the area also contributes to this phenomenon. Additionally, the presence of abundant vegetation in this pool may play a role in mitigating the impact of pollution [82,83,84].
The frequency of TGWI varied among the different water sources, as shown in Figure 3c. The mine waters had only three TGWIs: 40% DIP, 40% CLB, and 20%CYC. Downstream had ten groups, and DIP was the most frequent at 41.2%, followed by PLE, INF, and CLB at 11.78%. Upstream had twelve groups, and DIP was again the most frequent at 48.5%, followed by PLE at 13.42%. Groundwaters had thirteen groups, with HAR being the most frequent at 44.11%, followed by NAU at 14.07%, and INF at 13.31%. Adit waters had fourteen TGWIs, with CLA being the most frequent at 51.3% and DIP being the second most frequent at 15.22%. The other TGWIs had a frequency smaller than 10%, as shown in Table S1.
The observed patterns of invertebrate abundance and TRWI do not seem to closely correspond to the chemical composition of the water samples. In contrast to the culturable microbiota, WI showed only a few weak-to-moderate negative correlations with Cu, Fe, Ni, Pb, and Zn (Figure 4b). However, the invertebrate assemblages in the study area consist of taxa with varying sensitivities to contaminants. This characteristic makes them useful indicators for assessing the impact of mining pollution on streams [85]. Some invertebrate taxa, such as Ephemeroptera, Plecoptera, and Trichoptera, are known to be among the most sensitive to mining pollution and HM concentrations, as previously reported in studies conducted in Portugal, Australia, and China [86,87,88]. In our study, based on the correlations between WI and HM, we observed a significant sensitivity of Plecoptera to Ni concentrations, Amphipoda to Zn, and Harpacticoida to Cu. Additionally, when considering the total water invertebrate community, we found sensitivities related to Fe, Pb, and Zn. In contrast, other taxa, such as certain Diptera, Coleoptera, Lepidoptera, and Odonata, are highly tolerant to HM pollution [89]. Research conducted in the Arieș River, which is also located in the Golden Quadrilateral mining area, has shown that the presence of HM has a significant impact on the abundance, frequency, and spatial distribution of meiofauna. Insect larvae were found to be more abundant upstream while microcrustaceans, including an important fraction of groundwater taxa, dominated downstream, where pollutant inputs were present [90]. In comparison with the culturable MB, the majority of the WI main groups did not show significant correlations with HM, indicating their higher tolerance to HM pollution. These findings suggest that WI may be less sensitive to changes in water chemistry than culturable microbial organisms.

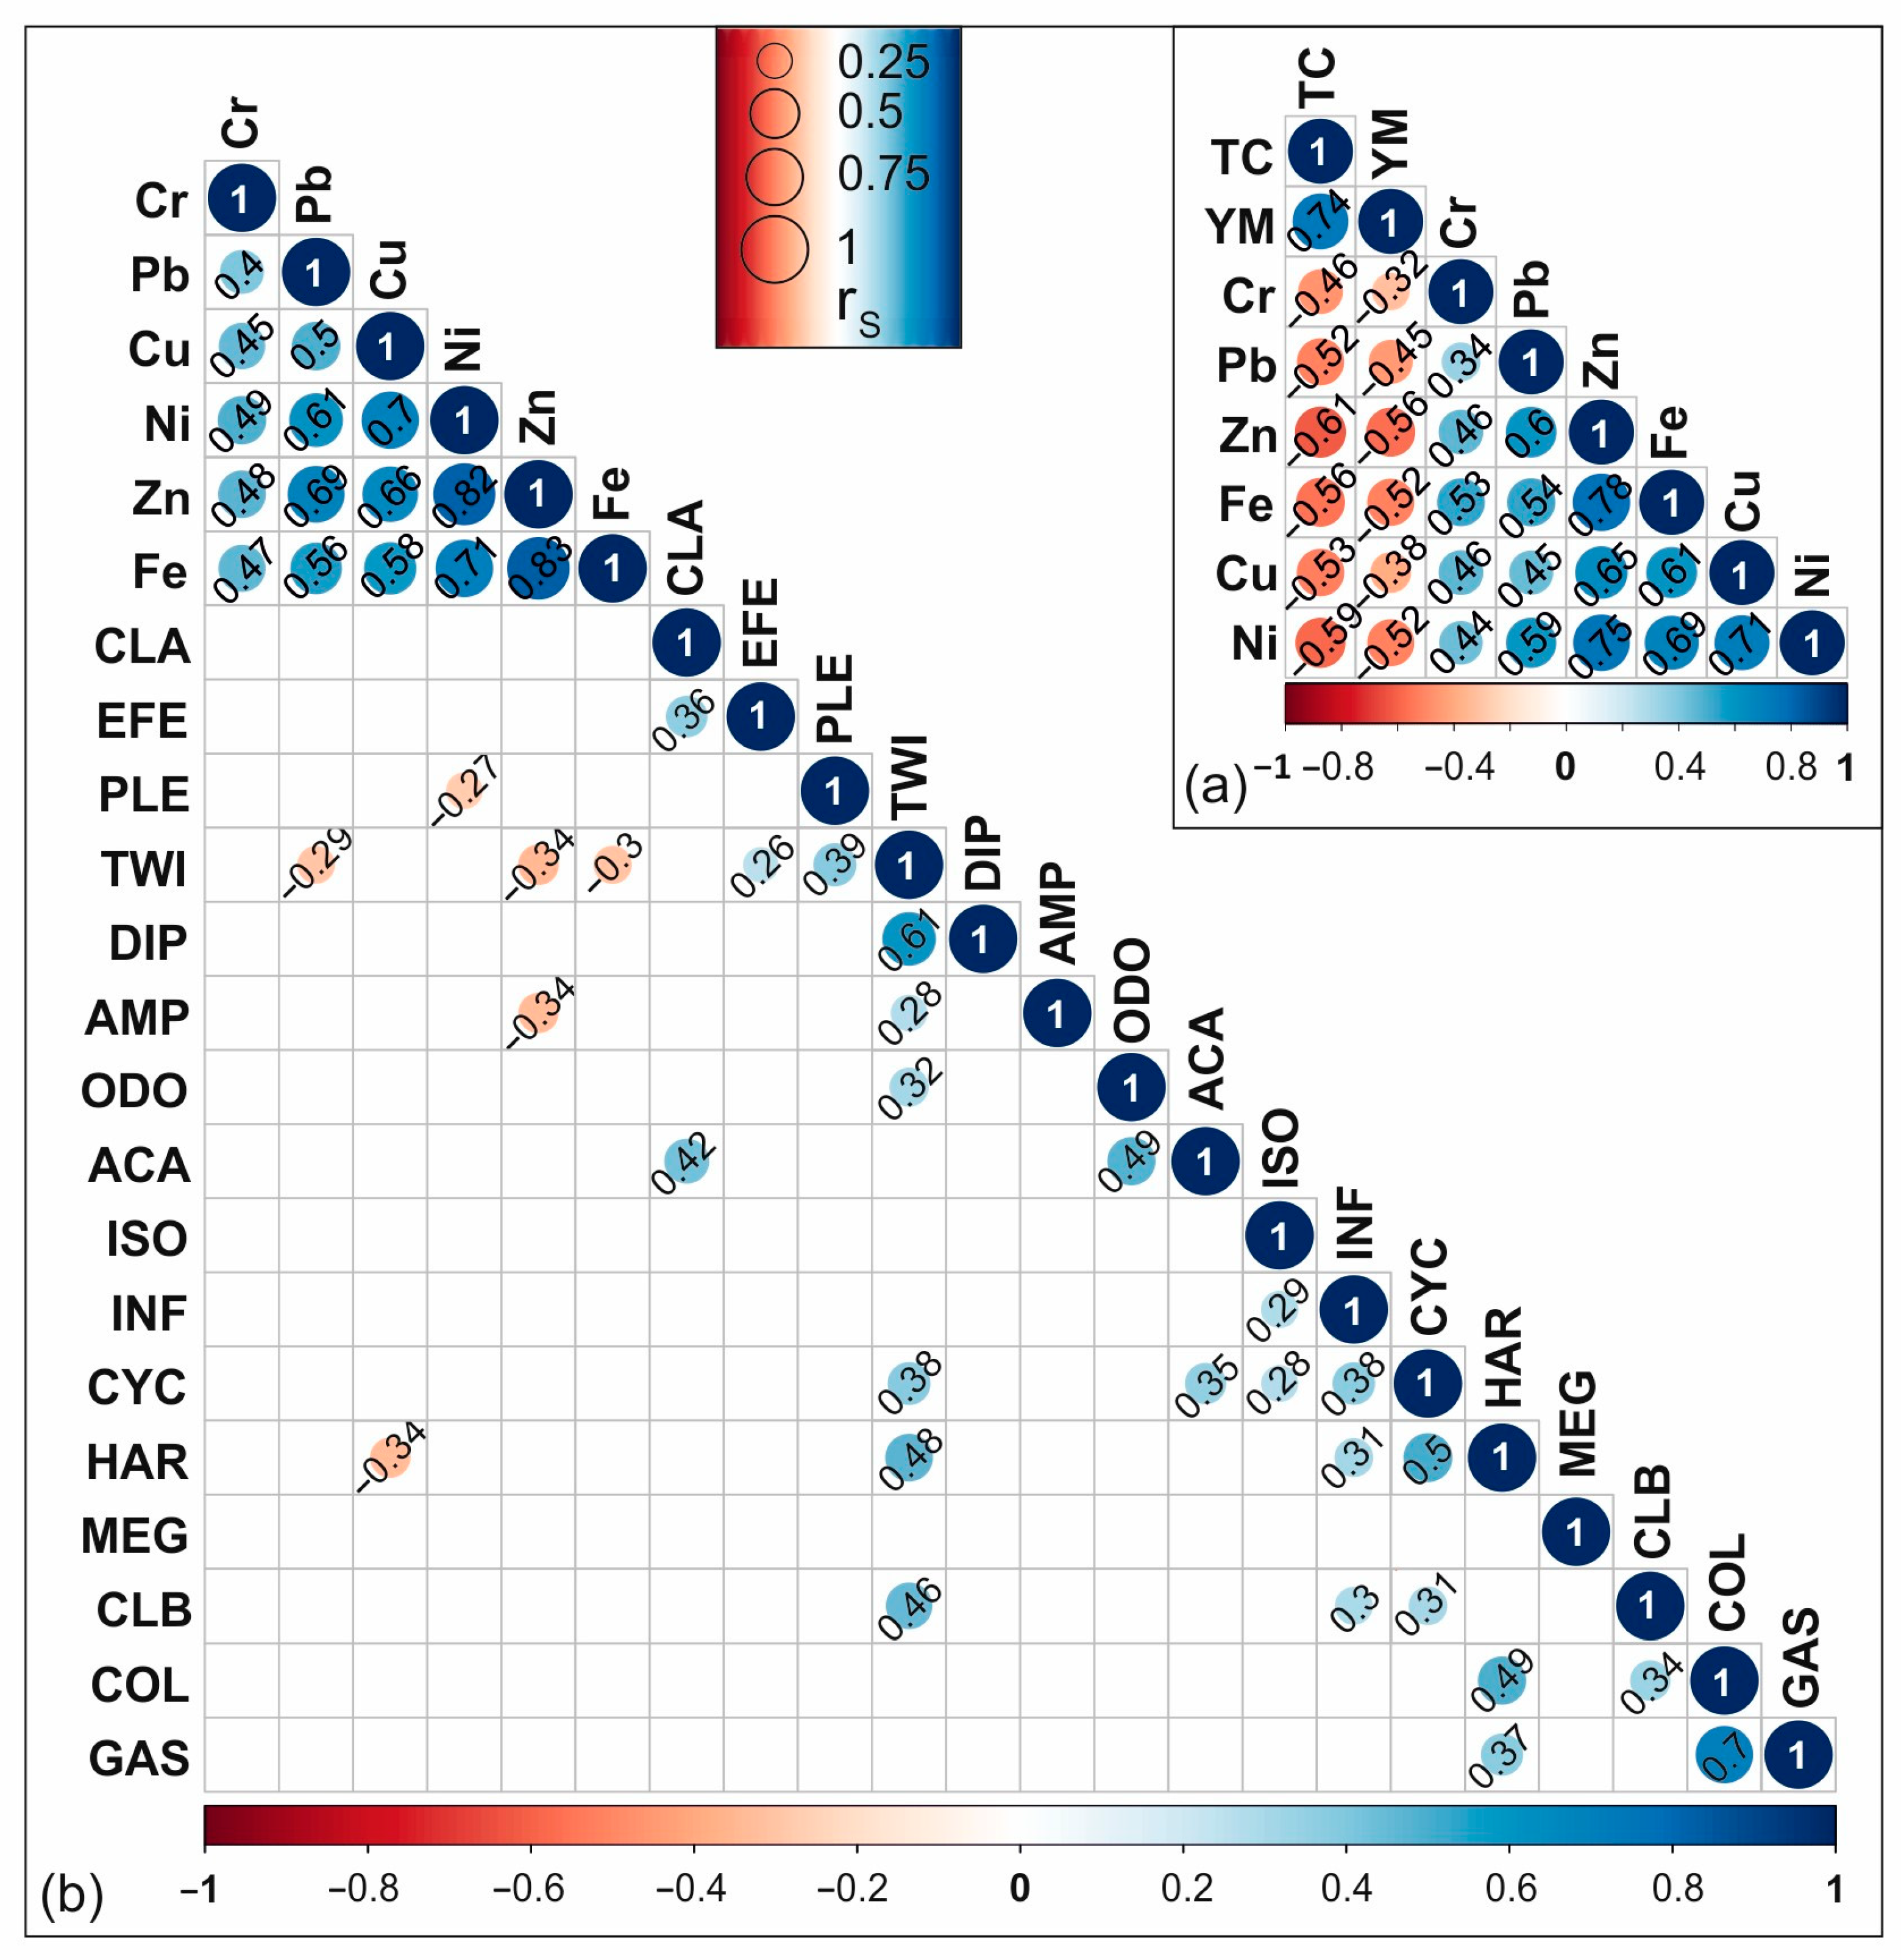
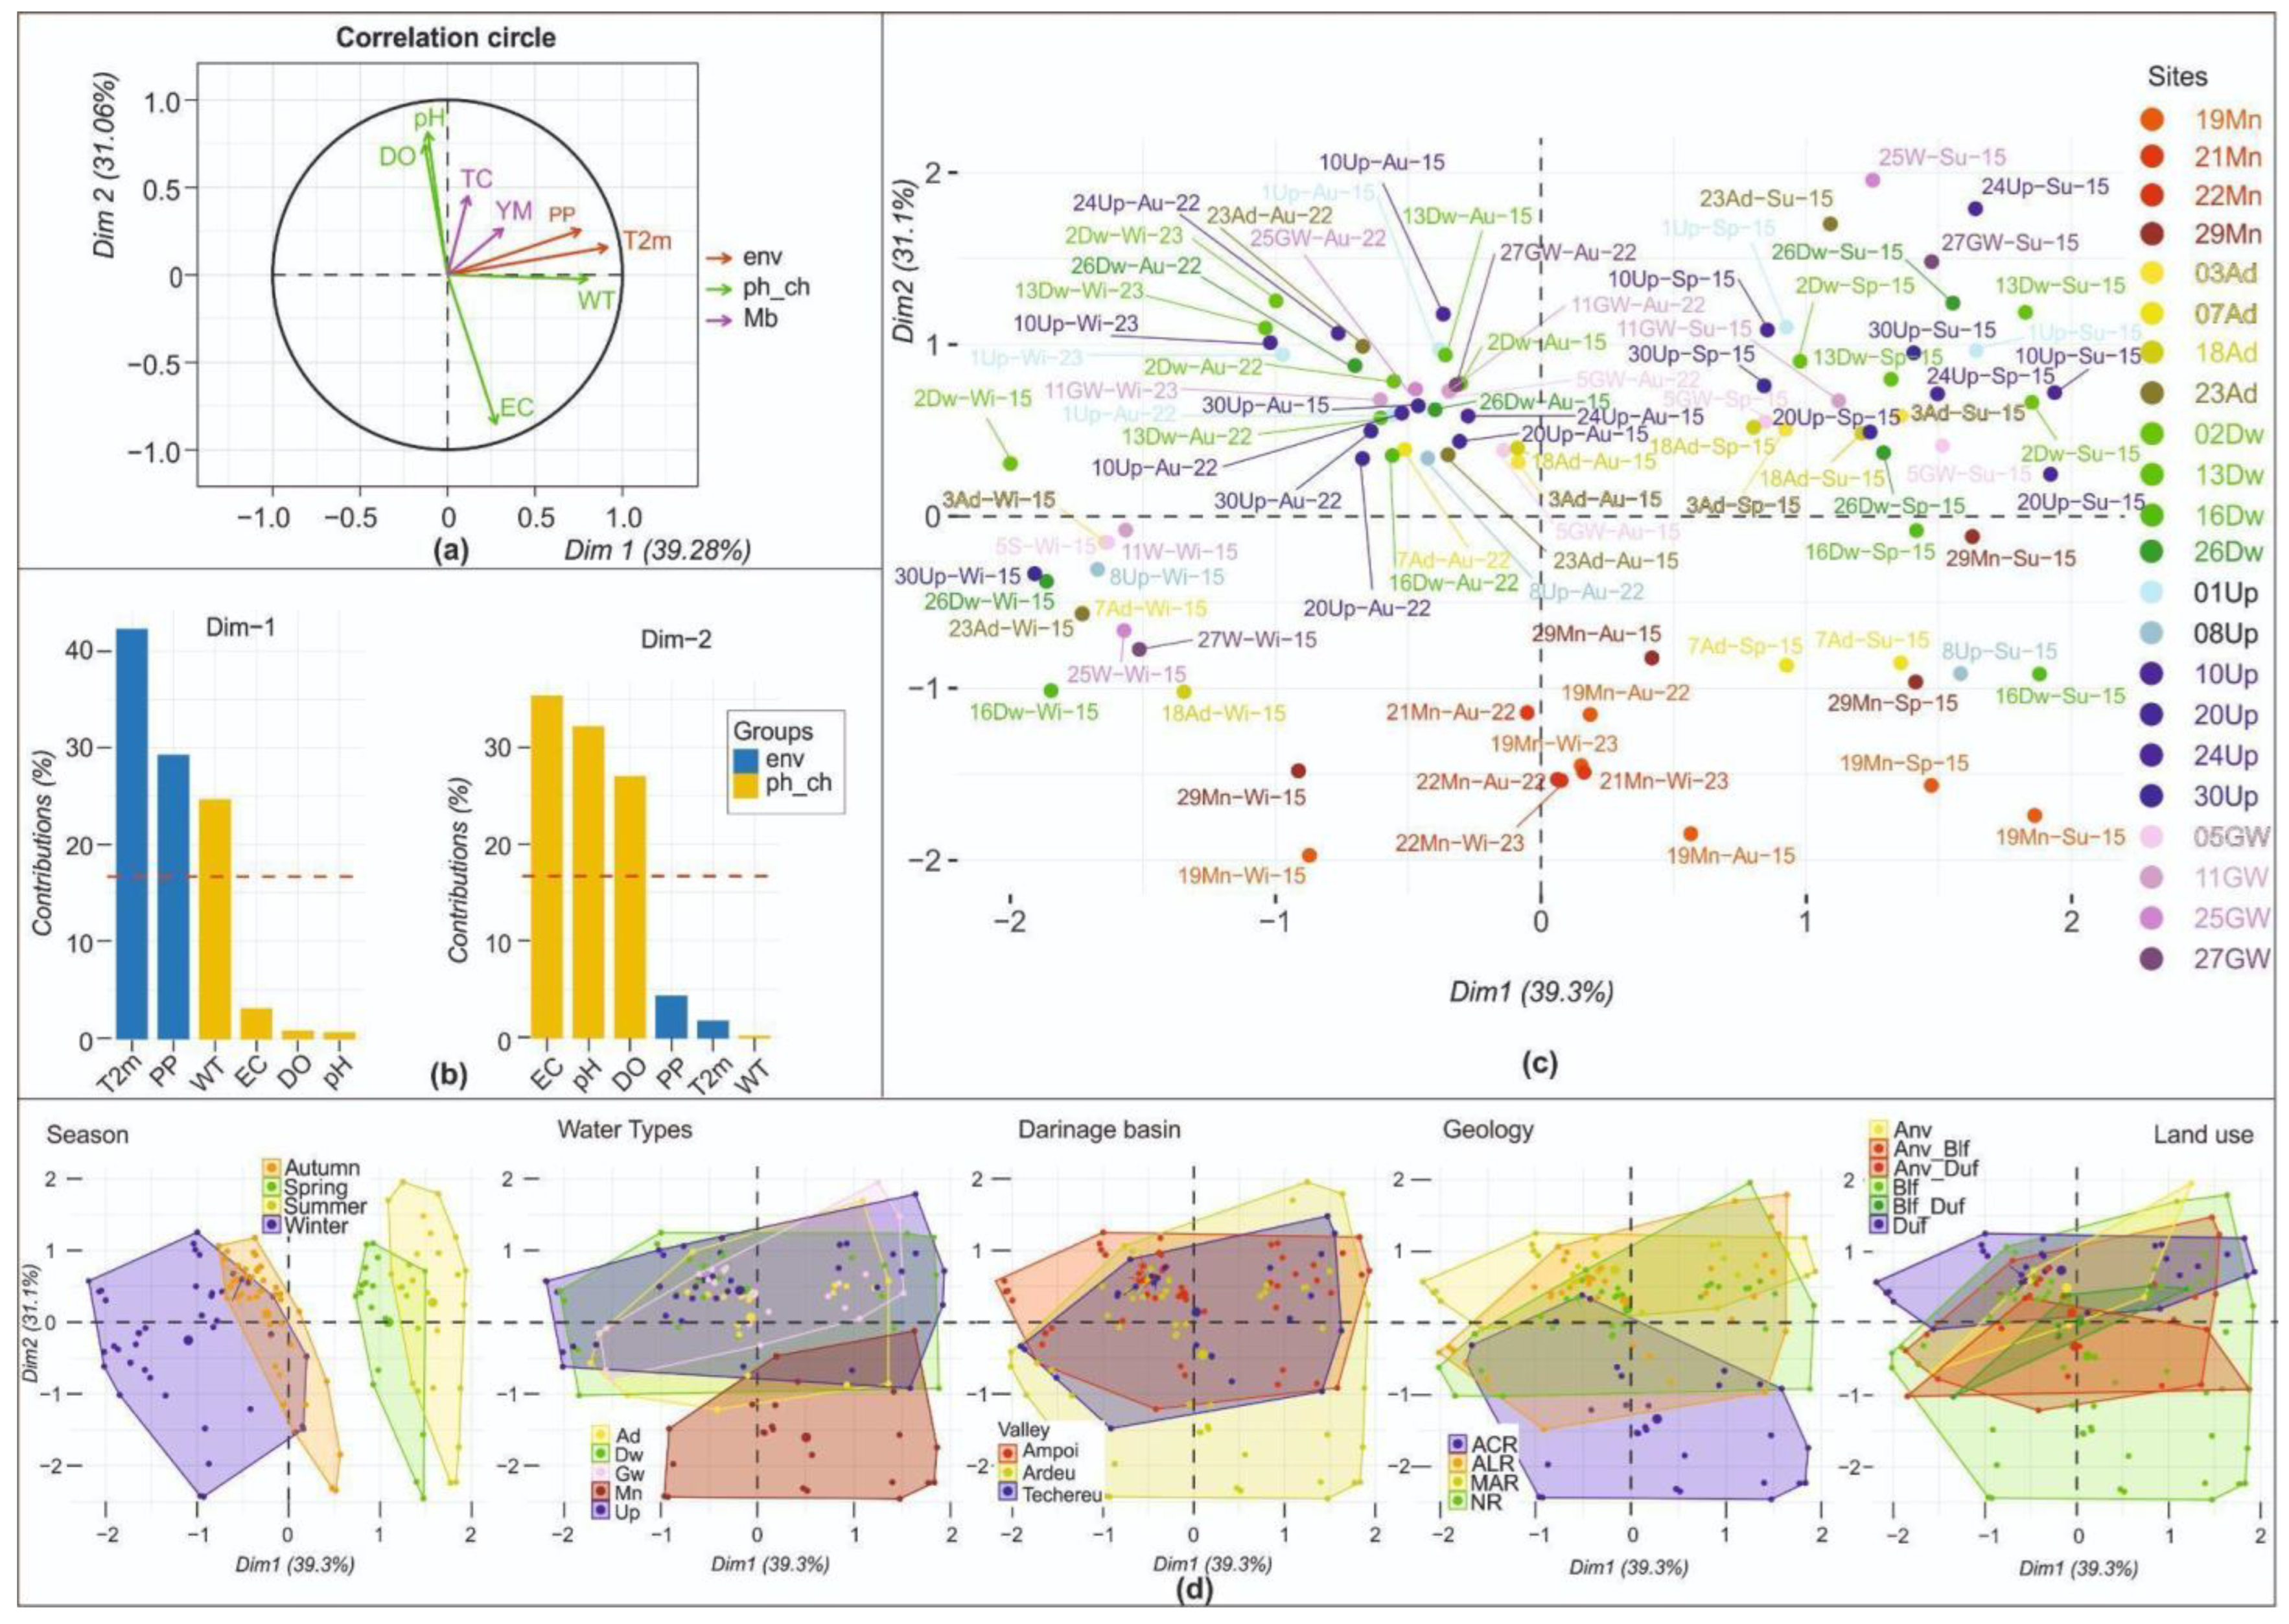
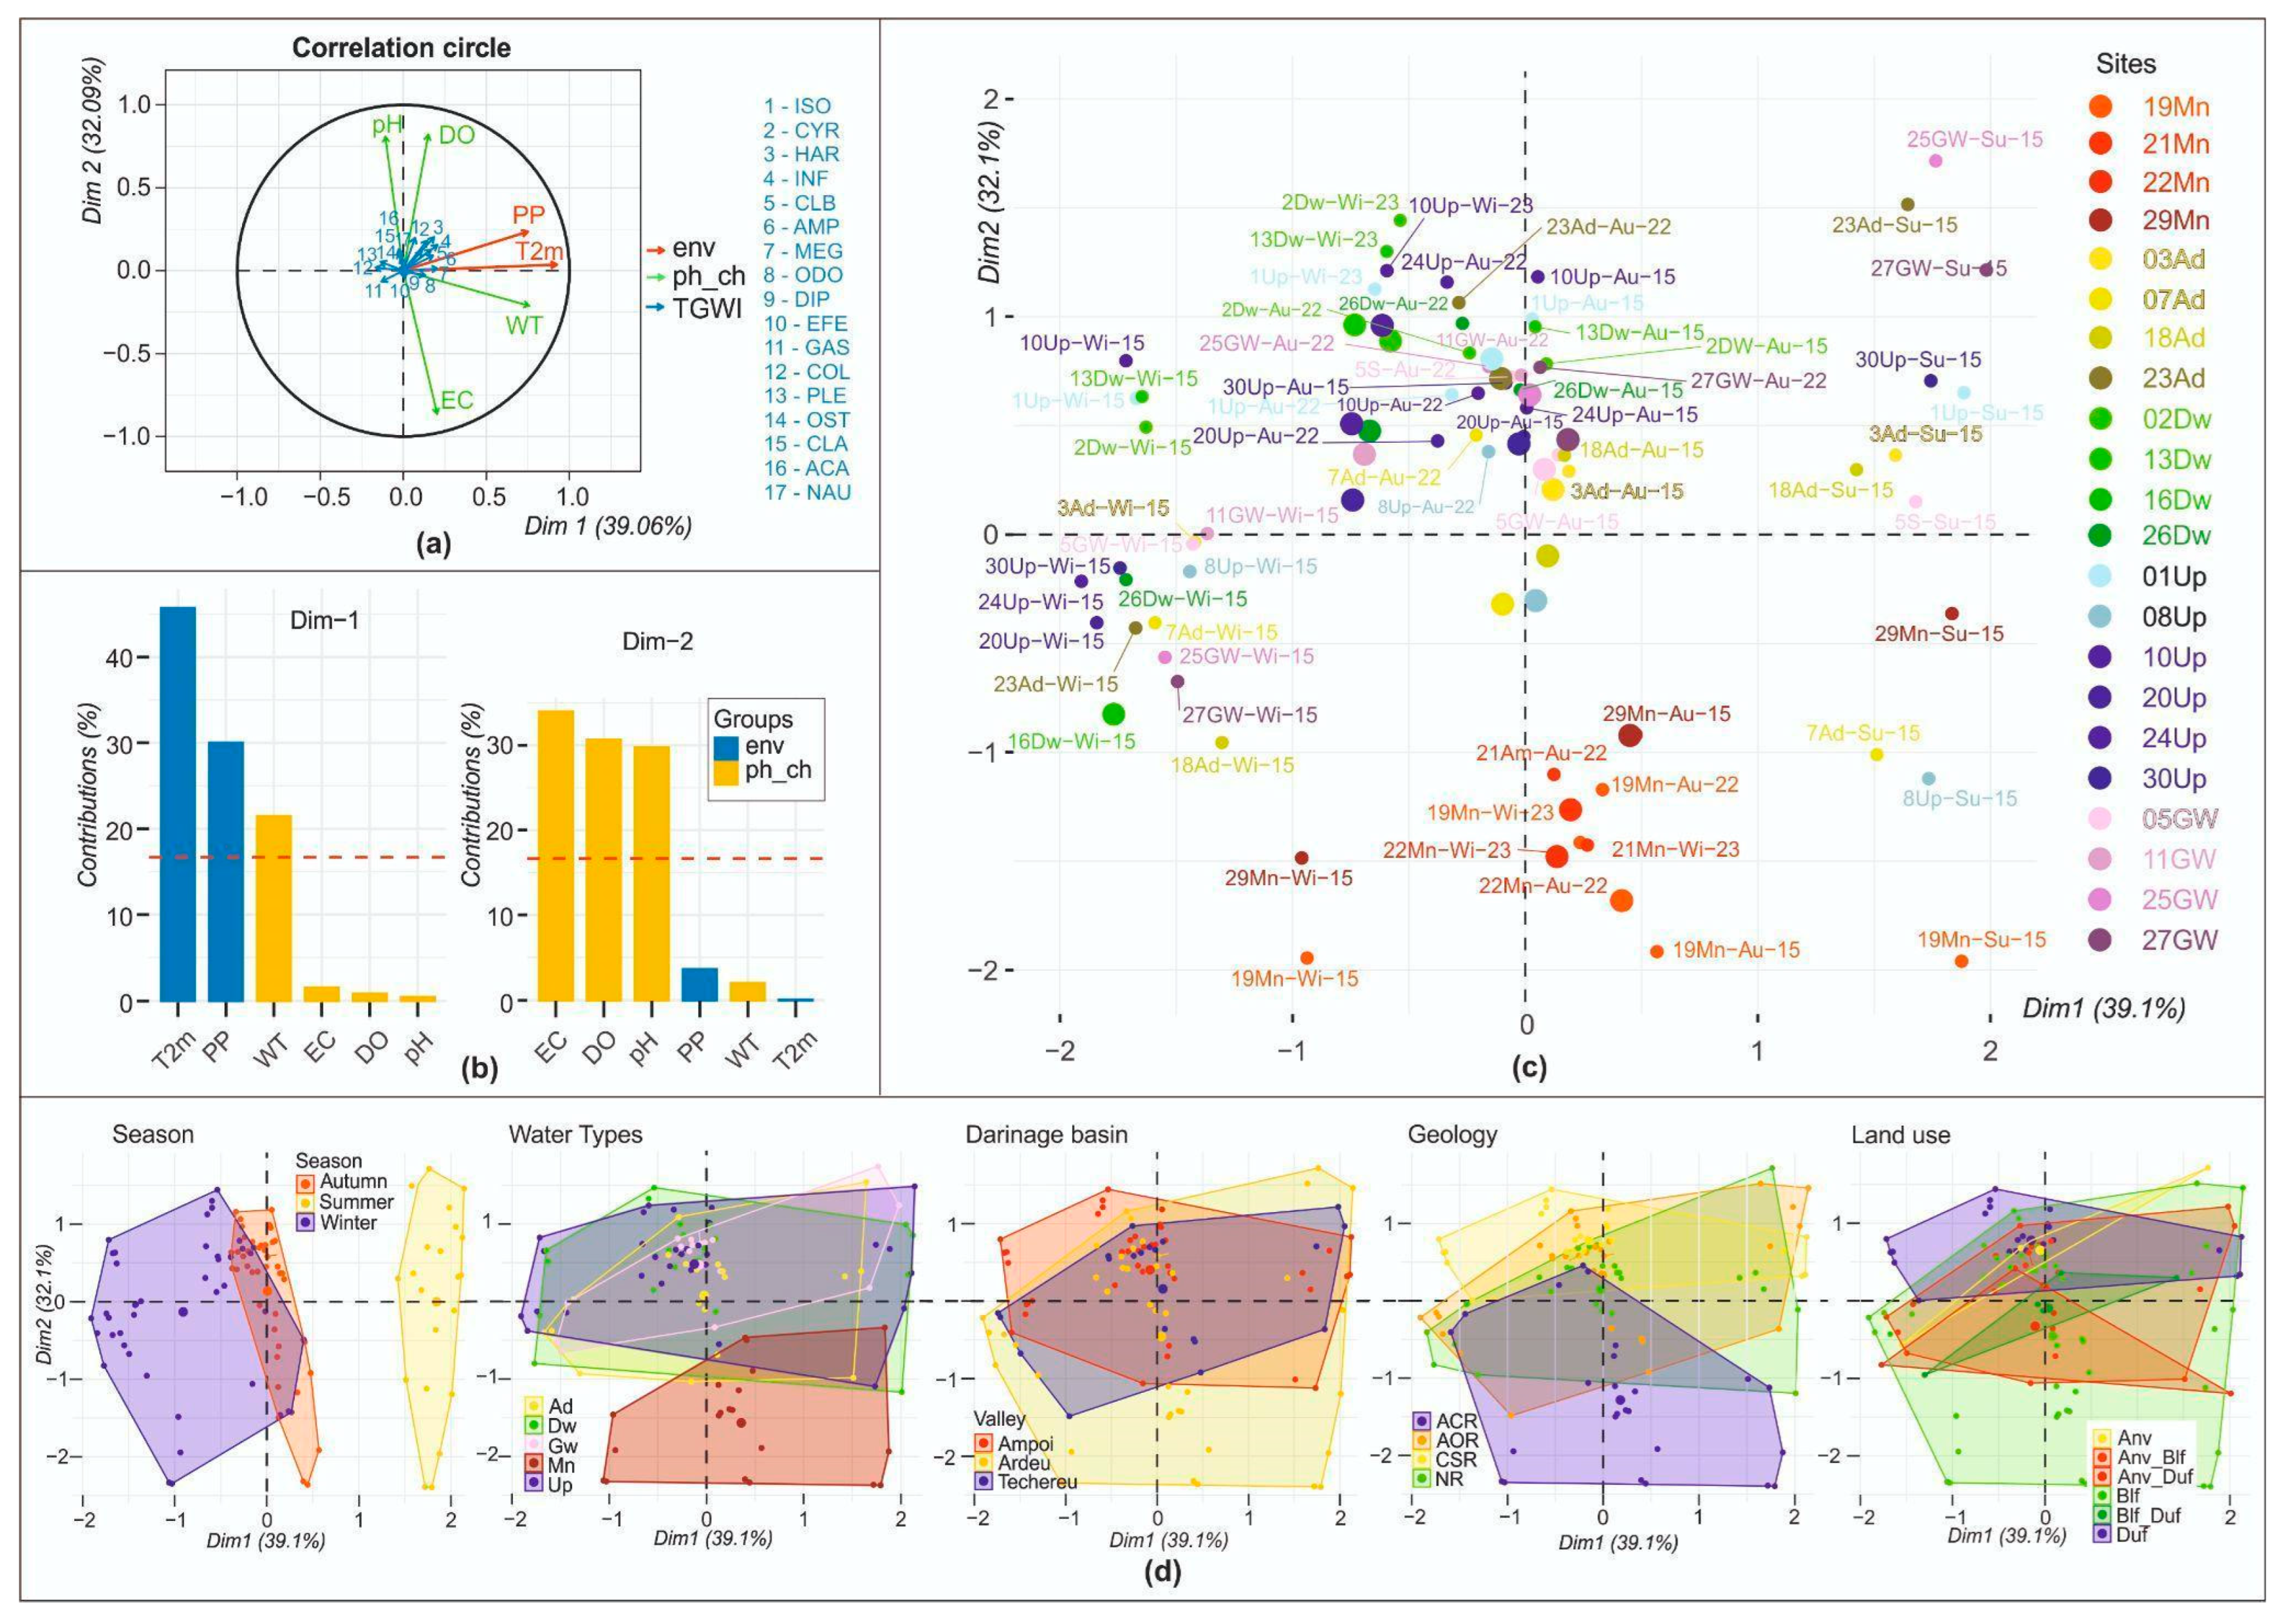
3.3. The Relationship between Biota, Environment, and Geochemical Features of Water Sites

MFA is an analytical approach that is optimal for assessing variance criteria and grouping variables of a similar nature. It enables the simultaneous representation of sites, taxa, and explanatory variables (env and ph-ch) in a two-dimensional space. MFA were conducted on two separate datasets: one for MB and another for WI. The MB dataset consisted of 133 samples with 14 variables, including six active continuous variables describing the environment (env, Supplementary Table S7) and the physicochemical (ph-ch) properties of the waters; eight supplementary variables that included qualitative variables specifying the seasons, water types, drainage basins, geology, and land use (Table 1); as well as two continuous variables quantifying TC and YM. The WI dataset, on the other hand, consisted of 107 samples with 29 variables, including the same six active continuous variables as in the MB dataset, along with 23 supplementary variables that included the same six qualitative variables and 17 continuous variables quantifying the TGWI. The quality of variable representations and their related dimensions are presented in Figure 5a and Figure 6a. In the MFA analysis, the first two dimensions accounted for 70.34% of information in the MB data, while explaining 71.20% of the variability in the WI data. Among the variables, EC showed a negative correlation with both MB and WI, while all the other variables had a positive correlation with MB and WI (Figure 5a and Figure 6a). For both MB and WI, T2M, PP, and WT had the highest contribution to Dim 1, which essentially represent env. On the other hand, EC, pH, and DO had a greater contribution to Dim2, which represent the ph-ch parameters (Figure 5b and Figure 6b). This suggests that these factors play a significant role in shaping the culturable microbial and invertebrate community patterns of the studied waters.
The first axis of the MFA plot divides the samples according to the seasons, with the summer and spring samples having more abundant MB clustering in the right positive quadrant, while the autumn and winter samples with a lower MB clustered in the opposite quadrant (Figure 5c). In the MFA plot for WI, it is observed that MEG, ODO, DIP, AMP, INF, and CLB are clustered in the right positive quadrant, indicating that their abundance and taxonomic richness were positively influenced by T2M, PP, and WT. In contrast, COL, PLE, GAS, and OST are situated in the left quadrant, indicating that they were negatively influenced by the same environmental factors (Figure 6c). The second axis of the MFA is responsible for separating the samples based on water pollution, with mine waters located in the lower part of the axis due to their high EC and low abundance of MB and WI. In contrast, the samples with high values of pH, DO, low EC, and rich MB are located in the upper part of the axis (Figure 5c). Similarly, in Figure 6c, most of the samples with low EC and higher pH and DO are located in the upper part of the axis, correlating with high abundance and TRWI.
The MFA results indicate that several environmental and physicochemical parameters, including WT, PP, T2M, EC, pH, and DO, were closely associated with the ecological effects that had the most notable influence on the richness and community structure of MB and WT in the mining-affected waters of the GMAZ. It is widely recognised that WT [91] and PP are key factors [92] affecting aquatic communities. WT affects the solubility of pollutants and oxygen levels, as well as pH, and EC and promotes microbial and invertebrate growth [91,93]. Additionally, changes in WT can impact the life-cycle phases [94], invertebrate distribution and richness [95], and community structure [96]. PP, in addition to WT, is closely linked to the physicochemical conditions of freshwater ecosystems [92], and contributes to maintaining a stable water flow, which in turn supports high densities of biotic communities [97,98]. In contrast, droughts or extreme floods can lead to low densities of biotic communities [92,99,100]. The seasonal variations observed in the structure of both MB and WI assemblages (Figure 5d and Figure 6d) were also influenced by air temperature, which is often considered a primary driver of WT and PP [92,101], and has been used as a proxy for predicting the distribution of freshwater communities [91,102].
The polygons in Figure 5d and Figure 6d help to visualise the grouping of samples based on different qualitative variables, such as seasons, water types, drainage basins, geology, and land use. These polygons demonstrate how the samples are segregated based on the environmental variables, including seasons as defined by T2M and PP, and water types and the sites’ geology defined by ph-ch properties, with EC being the most significant determinant. The samples from the mine waters characterised by low pH due to ore alteration are clustered in the lower part of the diagrams. On the other hand, the neutral-to-alkaline waters influenced by ophiolitic and sedimentary rocks that increase pH are clustered in the upper part. However, the polygons for drainage basins and land use exhibit some overlap, indicating that the samples could not be clearly separated based on these variables. This suggests similarities in the chemical properties of the water samples across different drainage basins or land use, contributing to the overlapping polygons. Our results (Figure 5d and Figure 6d) highlight the importance of seasonality, water type, and the site’s geology in determining water biota richness and community structures. In contrast, drainage basins and land use have a relatively smaller impact, likely due to the overriding influence of AMD and HM pollution stresses. Other studies [70,103,104,105] have highlighted the significance of various covariates such as substrate, hydrological conditions, or vegetation index in shaping habitat stability and the structure and functioning of aquatic ecosystems.

3.4. Mining Pollution over Time

Two monitoring actions were conducted in 2015 and 2022/2023, and the results show a reduction trend in water pollution reflected by a pH and DO increase and an EC decrease, along with an MB and WI recovery (Figure 7). The number of viable colony-forming units of MB in the mine, adit, and downstream samples increased in 2015 compared to 2022/2023. However, in the groundwaters there was an increase only in YM, while TC decreased. In the upstream waters, there were only minor differences in MB counts (Figure 7a). In 2022/2023, WI showed an increase in the number of individuals in the adit, downstream, and groundwaters, and an increase in the number of taxonomic groups in downstream waters (from three to eight TG). However, there was a slight decrease in WI counts in the mine and upstream waters (Figure 7b). Overall, the taxonomic richness of aquatic biota increased in 19 out of the 22 sites in 2022/2023, except for 1 Up, 20 Up, and 27 W (Figure 7c, Supplementary Table S7).
According to the statistical analysis, there were significant differences in several parameters between the two monitoring periods. Specifically, DO increased significantly in the mine waters (from 1.98 to 6.66 mg/mL, p < 0.001), while YM and PLE increased significantly (p < 0.05) in the adit waters. Additionally, WI increased significantly (p < 0.05) and there was a decrease in EC (492.38 to 200.13 μS/cm, p < 0.01) in the downstream waters, along with an increase in INF in the upstream waters. The groundwaters showed the most significant reduction in pollution, with an increase in pH (from 6.99 to 7.45, p < 0.01) and DO (from 4.9 to 9.59 mg/mL, p < 0.001), and a decrease in EC (from 503 to 265.75 μS/cm, p < 0.05) (Figure 7d).
Our corroborated results suggest that the AMD pollution from the closed mines in the GMAZ undergoes a natural attenuation process over time. The natural attenuation of mine pollution is a well-established phenomenon that occurs without human intervention in waters polluted with AMD and soluble metals [106,107]. It involves natural biological, geochemical, and physical processes [108,109]. The biological process involves the direct uptake of pollutants by living plants [82,83,84], or microbial activities that alkalize and remove metals through sulphate reduction or absorption and exchange reactions with organic matter. The geochemical processes involve the reaction between AMD and alkalinity-generating materials [108]. The acid neutralisation reactions can occur in the saturated zone of tailings deposits due to mineral dissolution–precipitation reactions that control pH and metal mobility [110]. Natural attenuation is influenced by several factors, including the type of mine, the geochemical properties of the host rocks, site hydrology, dilution processes, and environmental conditions [107,111]. In the area of investigation, we identified several of the aforementioned processes that could be involved in the natural attenuation of AMD pollution in the GMAZ: (1) the reduction in AMD production due to the decreased surface area of exposed ore minerals to air or percolated rainwater rich in oxygen, is generally applicable; (2) the rise of water levels in the mines and the subsequent decrease in available oxygen after mining activities ceased and water was no longer actively pumped out, is generally applicable; (3) the uptake of pollutants by plants, as in the case of 23 Ad pool; and (4) the neutralisation of AMD by sedimentary rocks (calcarenites, calcareous marls, and limestones) with a high buffering capacity, as in the case of 13 Dw. In contrast, the alkaline ophiolitic rocks, such as in the case of 29 Mn, lost their ability to neutralise pH over time due to the processes of alteration. However, we acknowledge that the observed patterns in the biotic communities between 2015 and 2022/2023 may also be influenced by interannual variability stemming from environmental conditions that are challenging to fully account for.
In this context, collecting robust time series data and conducting future research are indeed necessary for a more comprehensive understanding of community dynamics and their interannual variation patterns. Only in this way we can validate and further investigate the processes involved in the NA of mining pollution in the GMAZ. Specifically, exploring how the natural variation in biota communities throughout the year and over multiple years is influenced by environmental factors, including additional geochemical processes within the hydrological system, is crucial to gaining deeper insights into the dynamics of the ecosystem.

4. Conclusions

Our study concludes that closed mines from the GMAZ are still impacting the physicochemical parameters of surface- and groundwater, as well as aquatic biota, through the discharge of AMD-containing HM. Our results indicate that the quantifying of the culturable microbiota represent a low-cost, rapid, and easier alternative for monitoring the mining pollution of waters versus the more expensive and time-consuming geochemical analysis. Additionally, we observed that gold mining pollution affects the taxonomic richness of the major groups of aquatic invertebrates, highlighting their vulnerability to the impacts of mining activities. However, it is noteworthy that some of these invertebrate groups exhibit a remarkable versatility in tolerating high concentrations of HM, showcasing their adaptive capacity in the face of pollution. Based on this method, we have obtained the first data that indicate a reduction in mining pollution over the last seven years, with evidence of a possible natural attenuation resulting in overall improvements in water quality and aquatic biota in the GMAZ. The proposed method can be a valuable tool for monitoring programs that gather quantitative and qualitative data from different time points and for understanding the community dynamics and complex processes involved in natural attenuation. Combining these aspects with the regulatory framework of WFD is crucial for implementing effective remediation strategies and enhancing the quality of surface and underground water bodies.

Supplementary Materials

The following supporting information can be downloaded at: https://www.mdpi.com/article/10.3390/w15162883/s1, Table S1: Taxonomic richness of microbiota (TRMB) and water invertebrates (TRWI) in 22 water sources from the Gold Mining Area of Zlatna; Table S2: Seasonal averages of precipitation (PP) and temperature at 2 m above ground level (T2M) in the Gold Mining Area of Zlatna, sourced from the POWER Data Services databases [48,49]; Table S3: Total abundance (TA) of microbiota (MB) and total water invertebrates (TWI) in 22 water sources from the Gold Mining Area of Zlatna; Table S4: Relative abundance (RA%) of microbiota (MB) and total water invertebrates (TWI) in 22 water sources from the Gold Mining Area of Zlatna; Table S5: Frequency (F%) of microbiota (MB) and total water invertebrates (TWI) in 22 water sources from the Gold Mining Area of Zlatna; Table S6: Frequency (F%) of major taxa of water invertebrates (MTWI), in different water types (mine waters, adit waters, upstream waters, downstream waters, and groundwaters); Table S7: Differences in taxonomic richness of biota (TRB) between 2015 and 2022–2023 in the Gold Mining Area of Zlatna.

Author Contributions

Conceptualization: D.R.B., D.C.P., I.C., N.C. and I.N.M.; methodology: D.R.B., I.C., N.C. and I.N.M.; software: D.R.B., N.C., and I.N.M.; field investigation and sampling: D.R.B., D.C.P. and I.C.; resources: D.R.B., D.C.P. and I.N.M.; writing—original draft preparation: D.R.B., D.C.P., I.C., N.C. and I.N.M.; writing—review and editing, D.R.B., I.C., D.C.P., N.C. and I.N.M. All authors have read and agreed to the published version of the manuscript.

Funding

This work was financially supported by the “Emil Racoviţă” Institute of Speleology (Romanian Academy) within Projects 3 and 5 of the Program’s 2021–2025 framework. The field samplings in 2015 were funded by the Romanian National Authority for Scientific Research, CCCDI –UEFISCDI, project 3-004/2014, Tools for sustainable gold mining in EU (SUSMIN). Part of the undertaken statistical analyses were funded by a grant from the Romanian Ministry of Education and Research, CNCS/CCCDI–UEFISCDI, project number PN-III-P4-ID-PCE-2020-0518-P, within PNCDI III.

Data Availability Statement

The raw data supporting the findings of this study are available from the corresponding author (D.R.B.) on request.

Acknowledgments

We are grateful to Aurel Persoiu and Mirela Cimpean, who enabled the continuation of our work by offering access to some laboratory and field instruments and supplies. We would also like to thank Mircea Grindean for assisting in the field and special thanks to Emily Liddell and Dean Smith for English revision of the text.

Conflicts of Interest

The authors declare no conflict of interest. The funders had no role in the design of the study; in the collection, analyses, or interpretation of data; in the writing of the manuscript; or in the decision to publish the results.

References

  1. Ericsson, M.; Löf, O. Mining’s Contribution to National Economies between 1996 and 2016. Miner. Econ. 2019, 32, 223–250. [Google Scholar] [CrossRef] [Green Version]
  2. Munyai, R.; Ogola, H.J.O.; Modise, D.M. Microbial Community Diversity Dynamics in Acid Mine Drainage and Acid Mine Drainage-Polluted Soils: Implication on Mining Water Irrigation Agricultural Sustainability. Front. Sustain. Food Syst. 2021, 5, 701870. [Google Scholar] [CrossRef]
  3. Martín, A.; Arias, J.; López, J.; Santos, L.; Venegas, C.; Duarte, M.; Ortíz-Ardila, A.; de Parra, N.; Campos, C.; Zambrano, C.C. Evaluation of the Effect of Gold Mining on the Water Quality in Monterrey, Bolívar (Colombia). Water 2020, 12, 2523. [Google Scholar] [CrossRef]
  4. Brännvall, M.-L.; Bindler, R.; Emteryd, O.; Nilsson, M.; Renberg, I. Stable Isotope and Concentration Records of Atmospheric Lead Pollution in Peat and Lake Sediments in Sweden. Water Air Soil Pollut. 1997, 100, 243–252. [Google Scholar] [CrossRef]
  5. Renberg, I.; Brännvall, M.L.; Bindler, R.; Emteryd, O. Stable Lead Isotopes and Lake Sediments—A Useful Combination for the Study of Atmospheric Lead Pollution History. Sci. Total Environ. 2002, 292, 45–54. [Google Scholar] [CrossRef]
  6. Rakete, S.; Moonga, G.; Wahl, A.-M.; Mambrey, V.; Shoko, D.; Moyo, D.; Muteti-Fana, S.; Tobollik, M.; Steckling-Muschack, N.; Bose-O’Reilly, S. Biomonitoring of Arsenic, Cadmium and Lead in Two Artisanal and Small-Scale Gold Mining Areas in Zimbabwe. Environ. Sci. Pollut. Res. Int. 2022, 29, 4762–4768. [Google Scholar] [CrossRef]
  7. Ogola, J.S.; Mitullah, W.V.; Omulo, M.A. Impact of gold mining on the environment and human health: A case study in the Migori gold belt, Kenya. Environ. Geochem. Health 2002, 24, 141–157. [Google Scholar] [CrossRef]
  8. Mujere, N.; Isidro, M. Impacts of Artisanal and Small-Scale Gold Mining on Water Quality in Mozambique and Zimbabwe. In Practice, Progress, and Proficiency in Sustainability; IGI Global: Hershey, PA, USA, 2015; pp. 101–119. ISBN 9781466695597. [Google Scholar]
  9. Shotyk, W.; Weiss, D.; Appleby, P.G.; Cheburkin, A.K.; Gloor, R.; Kramers, J.D.; Reese, S.; Van Der Knaap, W.O. History of Atmospheric Lead Deposition since 12,370 (14)C Yr BP from a Peat Bog, Jura Mountains, Switzerland. Science 1998, 281, 1635–1640. [Google Scholar] [CrossRef] [Green Version]
  10. Pérez-García, L.C.; Sánchez-Palencia, F.J.; Torres-Ruiz, J. Tertiary and Quaternary Alluvial Gold Deposits of Northwest Spain and Roman Mining (NW of Duero and Bierzo Basins). J. Geochem. Explor. 2000, 71, 225–240. [Google Scholar] [CrossRef]
  11. Abbott, M.B.; Wolfe, A.P. Intensive Pre-Incan Metallurgy Recorded by Lake Sediments from the Bolivian Andes. Science 2003, 301, 1893–1895. [Google Scholar] [CrossRef] [Green Version]
  12. López-Merino, L.; Martínez Cortizas, A.; Reher, G.S.; López-Sáez, J.A.; Mighall, T.M.; Bindler, R. Reconstructing the Impact of Human Activities in a NW Iberian Roman Mining Landscape for the Last 2500 Years. J. Archaeol. Sci. 2014, 50, 208–218. [Google Scholar] [CrossRef] [Green Version]
  13. Hillman, A.L.; Abbott, M.B.; Valero-Garcés, B.L.; Morellon, M.; Barreiro-Lostres, F.; Bain, D.J. Lead Pollution Resulting from Roman Gold Extraction in Northwestern Spain. Holocene 2017, 27, 1465–1474. [Google Scholar] [CrossRef] [Green Version]
  14. Mighall, T.M.; Timberlake, S.; Foster, I.D.L.; Krupp, E.; Singh, S. Ancient Copper and Lead Pollution Records from a Raised Bog Complex in Central Wales, UK. J. Archaeol. Sci. 2009, 36, 1504–1515. [Google Scholar] [CrossRef]
  15. Kılıç, Z. The Importance of Water and Conscious Use of Water. Int. J. Hydrol. 2020, 4, 239–241. [Google Scholar] [CrossRef]
  16. Jhariya, D.; Khan, R.; Thakur, G.S. Impact of Mining Activity on Water Resource: An Overview Study. In Proceedings of the National Seminar on Recent Practices & Innovations in Mining Industry, Raipur, India, 19–20 February 2016; pp. 271–277. [Google Scholar]
  17. Gold Mining Industry Environmental Pollution Types and Effects. Available online: https://www.longdom.org/open-access/gold-mining-industry-environmental-pollution-types-and-effects.pdf (accessed on 24 May 2023).
  18. Mambou Ngueyep, L.L.; Takougang Kingni, S.; Ayiwouo Ngounouno, M.; Ndi, A.A. The Impact of Gold Mining Exploitation on the Physicochemical Quality of Water: Case of Batouri (Cameroon). Int. J. Energy Water Res. 2021, 5, 159–173. [Google Scholar] [CrossRef]
  19. Torrance, K.W.; Redwood, S.D.; Cecchi, A. The Impact of Artisanal Gold Mining, Ore Processing and Mineralization on Water Quality in Marmato, Colombia. Environ. Geochem. Health 2021, 43, 4265–4282. [Google Scholar] [CrossRef]
  20. Sarmiento, A.M.; Nieto, J.M.; Olías, M.; Cánovas, C.R. Hydrochemical Characteristics and Seasonal Influence on the Pollution by Acid Mine Drainage in the Odiel River Basin (SW Spain). Appl. Geochem. 2009, 24, 697–714. [Google Scholar] [CrossRef]
  21. Papp, D.C.; Cociuba, I.; Baciu, C.; Cozma, A. Origin and Geochemistry of Mine Water and Its Impact on the Groundwater and Surface Running Water in Post-Mining Environments: Zlatna Gold Mining Area (Romania). Aquat. Geochem. 2017, 23, 247–270. [Google Scholar] [CrossRef]
  22. Commission of the European Communities. Directive 2000/60/EC of the European Parliament and of the Council of 23 October 2000 Establishing a Framework for Community Action in the Field of Water Policy; Office for Official Publications of the European Communities: Luxembourg, 2000. [Google Scholar]
  23. Zhou, Q.; Zhang, J.; Fu, J.; Shi, J.; Jiang, G. Biomonitoring: An Appealing Tool for Assessment of Metal Pollution in the Aquatic Ecosystem. Anal. Chim. Acta 2008, 606, 135–150. [Google Scholar] [CrossRef]
  24. Piotrowska-Seget, Z.; Cycoń, M.; Kozdrój, J. Metal-Tolerant Bacteria Occurring in Heavily Polluted Soil and Mine Spoil. Appl. Soil Ecol. 2005, 28, 237–246. [Google Scholar] [CrossRef]
  25. Fashola, M.O.; Ngole-Jeme, V.M.; Babalola, O.O. Heavy Metal Pollution from Gold Mines: Environmental Effects and Bacterial Strategies for Resistance. Int. J. Environ. Res. Public Health 2016, 13, 1047. [Google Scholar] [CrossRef] [PubMed] [Green Version]
  26. Šmejkalová, M.; Mikanová, O.; Borůvka, L. Effects of Heavy Metal Concentrations on Biological Activity of Soil Micro-Organisms. Plant Soil Environ. 2003, 49, 321–326. [Google Scholar] [CrossRef] [Green Version]
  27. Rajapaksha, R.M.C.P.; Tobor-Kapłon, M.A.; Bååth, E. Metal Toxicity Affects Fungal and Bacterial Activities in Soil Differently. Appl. Environ. Microbiol. 2004, 70, 2966–2973. [Google Scholar] [CrossRef] [Green Version]
  28. Gyedu-Ababio, T.K.; Baird, D. Response of Meiofauna and Nematode Communities to Increased Levels of Contaminants in a Laboratory Microcosm Experiment. Ecotoxicol. Environ. Saf. 2006, 63, 443–450. [Google Scholar] [CrossRef]
  29. Moore, C.G.; Bett, B.J. The Use of Meiofauna in Marine Pollution Impact Assessment. Zool. J. Linn. Soc. 1989, 96, 263–280. [Google Scholar] [CrossRef]
  30. DeNicol, D.M.; Stapleton, M.G. Impact of Acid Mine Drainage on Benthic Communities in Streams: The Relative Roles of Substratum vs. Aqueous Effects. Environ. Pollut. 2002, 119, 303–315. [Google Scholar] [CrossRef]
  31. Dills, G.; Rogers, D.T., Jr. Macroinvertebrate Community Structure as an Indicator of Acid Mine Pollution. Environ. Pollut. 1974, 6, 239–262. [Google Scholar] [CrossRef]
  32. Van Damme, P.A.; Hamel, C.; Ayala, A.; Bervoets, L. Macroinvertebrate Community Response to Acid Mine Drainage in Rivers of the High Andes (Bolivia). Environ. Pollut. 2008, 156, 1061–1068. [Google Scholar] [CrossRef]
  33. Byrne, P.; Reid, I.; Wood, P.J. Changes in Macroinvertebrate Community Structure Provide Evidence of Neutral Mine Drainage Impacts. Environ. Sci. Process. Impacts 2013, 15, 393–404. [Google Scholar] [CrossRef]
  34. Oberländer-Târnoveanu, E. Aurul și Argintul Daciei—Origine, Exploatare, Analize. In Aurul și argintul antic al României; Muzeul Național de Istorie a României: București, Romania, 2013; pp. 16–35. [Google Scholar]
  35. Vlad, Ș.-N.; Orlandea, E. Metallogeny of the Gold Quadrilateral: Style and Characteristics of Epithermal—Subvolcanic Mineralized Structures, South Apuseni Mts., Romania. Stud. Univ. Babes-Bolyai Geol. 2004, 49, 15–31. [Google Scholar] [CrossRef] [Green Version]
  36. Vlad, S. Perspective Targeting CuAuMo Porphyries of Romanian Carpathians: Blind Porphyry Mineralization and Its Variable Distal Expression as Vein and Skarns. Open Geosci. 2011, 3, 318–335. [Google Scholar] [CrossRef]
  37. Sima, M.; Zobrist, J.; Senila, M.; Levei, E.-A.; Abraham, B.; Dold, B.; Balteanu, D. Environmental Pollution by Mining Activities—A Case Study in the Criş Alb Valley, Western Carpathians, Romania. Geo-Eco-Marina 2008, 14, 9–20. [Google Scholar] [CrossRef]
  38. Milu, V.; Leroy, J.; Peiffert, C. Water Contamination Downstream from a Copper Mine in the Apuseni Mountains, Romania. Environ. Geol. 2002, 42, 773–782. [Google Scholar] [CrossRef]
  39. ERA-MIN Joint Call 2013 Results: Summary Reports. Available online: https://www.era-min.eu/sites/default/files/docs/era-min_catalogue_2013_0.pdf (accessed on 22 April 2023).
  40. Orlandea, E.; Vlad, Ş.-N. A Novel Conceptual Model of Intrusion Related Gold Bearing Systems and Exploration Tools. Stud. Univ. Babes-Bolyai Geol. 2020, 63, 1–12. [Google Scholar] [CrossRef]
  41. Baron, S.; Tămaş, C.G.; Cauuet, B.; Munoz, M. Lead Isotope Analyses of Gold–silver Ores from Roşia Montană (Romania): A First Step of a Metal Provenance Study of Roman Mining Activity in Alburnus Maior (Roman Dacia). J. Archaeol. Sci. 2011, 38, 1090–1100. [Google Scholar] [CrossRef]
  42. Botezan, C.; Constantin, V.; Meltzer, M.; Radovici, A.; Pop, A.; Alexandrescu, F.; Stefanescu, L. Is There Sustainable Development after Mining? A Case Study of Three Mining Areas in the Apuseni Region (Romania). Sustain. Sci. Pract. Policy 2020, 12, 9791. [Google Scholar] [CrossRef]
  43. Sommerwerk, N.; Bloesch, J.; Baumgartner, C.; Bittl, T.; Čerba, D.; Csányi, B.; Davideanu, G.; Dokulil, M.; Frank, G.; Grecu, I.; et al. The Danube River Basin. In Rivers of Europe; Elsevier: Amsterdam, The Netherlands, 2022; pp. 81–180. [Google Scholar]
  44. Deshaies, M. L’or Controversé de Transylvanie. Rev. Geogr. Est 2009, 49, 1–20. [Google Scholar] [CrossRef]
  45. Borcoş, M.; Berbeleac, I.; Bordea, S.; Bordea, J.; Mantea, G.; Boștinescu, S. Republica Socialista România Harta Geologică 74c Zlatna Sheet; Editura Institutului Geologic al României: Bucharest, Romania, 1981. [Google Scholar]
  46. Roșu, E. Neogene Magmatism in the Apuseni Mountains, Romania. Evolution and Geochemical Features. Rom. J. Miner. Deposit 2001, 79, 19–22. [Google Scholar]
  47. Papp, D.C. Analysis of the Radiogenic Carbon-14 Record of Groundwater at the Zlatna Post-Mining Site (Romania). Carpathian J. Earth Environ. Sci. 2021, 16, 413–422. [Google Scholar] [CrossRef]
  48. Borda, D.; Epure, L.; Meleg, I.N.; Cociuba, I. Preliminary Results on the Quality of Drinking Water Sources in the Runcuri Plateau. Trav. Inst. Spéol. Emil Racovitza 2019, 58, 19–46. [Google Scholar]
  49. The Power Project. Available online: https://power.larc.nasa.gov (accessed on 27 February 2023).
  50. Find Geospatial Learning Resources. Available online: http://www.learngeomatics.com/ (accessed on 27 February 2023).
  51. Modern-Era Retrospective Analysis for Research and Applications (MERRA). Available online: https://gmao.gsfc.nasa.gov/reanalysis/MERRA/data_access/ (accessed on 27 February 2023).
  52. Land Monitoring Service. Available online: https://land.copernicus.eu/ (accessed on 1 March 2023).
  53. R Core Team. R: A Language and Environment for Statistical Computing; R Foundation for Statistical Computing: Vienna, Austria, 2023; Available online: https://www.r-project.org/ (accessed on 1 March 2023).
  54. Kolde, R. Pheatmap: Pretty Heatmaps. R Package Version 1.0.12. Available online: https://CRAN.R-project.org/package=pheatmap (accessed on 1 March 2023).
  55. Wickham, H. ggplot2: Elegant Graphics for Data Analysis; Springer: Berlin/Heidelberg, Germany, 2016; ISBN 9783319242774. [Google Scholar]
  56. Peterson, B.G.; Carl, P. Performance Analytics: Econometric Tools for Performance and Risk Analysis (R Package Version 2.0.4). 2020. Available online: https://CRAN.R-project.org/package=PerformanceAnalytics (accessed on 15 July 2023).
  57. Lê, S.; Josse, J.; Husson, F. FactoMineR: AnRPackage for Multivariate Analysis. J. Stat. Softw. 2008, 25, 1–18. [Google Scholar] [CrossRef] [Green Version]
  58. Kassambara, A.; Mundt, F. R Package Version 1.0.7. Cran—Package Factoextra. Available online: https://cran.r-project.org/web/packages/factoextra/index.html (accessed on 5 March 2023).
  59. Badino, G. Cave Temperatures and Global Climatic Change. Int. J. Speleol. 2004, 33, 103–113. [Google Scholar] [CrossRef]
  60. Guo, X.; Gong, X.; Yuan, D.; Jiang, G.; Cao, J.; Lin, Y.; Lo, K.F.A.; Chen, C. Response of Drip Water Temperature to Climate Variability: A Case Study in Xiaoyan Cave, Southwest China. Hydrol. Sci. J. 2019, 64, 873–884. [Google Scholar] [CrossRef]
  61. Iatan, E.-L. Gold Mining Industry Influence on the Environment and Possible Phytoremediation Applications. In Phytorestoration of Abandoned Mining and Oil Drilling Sites; Elsevier: Amsterdam, The Netherlands, 2021; pp. 373–408. ISBN 9780128212004. [Google Scholar]
  62. Banks, D.; Younger, P.L.; Arnesen, R.-T.; Iversen, E.R.; Banks, S.B. Mine-Water Chemistry: The Good, the Bad and the Ugly. Environ. Geol. 1997, 32, 157–174. [Google Scholar] [CrossRef]
  63. Jurkovića, J.; Muhić-Šaracb, T.; Kolarc, M. Chemical Characterization of Acid Mine Drainage from an Abandoned Gold Mine Site. Chem. Listy 2014, 108, 165–170. [Google Scholar]
  64. Lintnerova, O.; Sucha, V.; Stresko, V. Mineralogy and Geochemistry of Acid Mine Fe-Precipitates from the Mine Slovak Mining Regions. Geol. Carpathica 1999, 50, 394–404. [Google Scholar]
  65. Lin, J.; Ganesh, A. Water Quality Indicators: Bacteria, Coliphages, Enteric Viruses. Int. J. Environ. Health Res. 2013, 23, 484–506. [Google Scholar] [CrossRef]
  66. Saxena, G.; Bharagava, R.N.; Kaithwas, G.; Raj, A. Microbial Indicators, Pathogens and Methods for Their Monitoring in Water Environment. J. Water Health 2015, 13, 319–339. [Google Scholar] [CrossRef]
  67. Borda, C.; Drăghici, C.; Borda, D. The Polluting Effect of Slaughterhouse Waste Waters Discharged into Surface Waters. In Proceedings of the Animals and Environment, Volume 2: Proceedings of the XIIth ISAH Congress on Animal Hygiene, Warsaw, Poland, 4–8 September 2005; Krynski, A., Wrzesien, R., Eds.; BEL Studio sp. z.o.o: Warsaw, Poland, 2005; pp. 255–258. [Google Scholar]
  68. Oarga, A.; Griessler Bulc, T.; Jenssen, P.; Mulec, J. Monitoring of Microbial Indicator Groups in Organically Heavily Loaded Wastewater Treatment Systems by Using RIDA@COUNT Kits. Fresenius Environ. Bull. 2012, 21, 3886–3893. [Google Scholar]
  69. Some, S.; Mondal, R.; Mitra, D.; Jain, D.; Verma, D.; Das, S. Microbial Pollution of Water with Special Reference to Coliform Bacteria and Their Nexus with Environment. Energy Nexus 2021, 1, 100008. [Google Scholar] [CrossRef]
  70. Borda, D.R.; Cociuba, I.; Epure, L.; Cruceru, N.; Meleg, I.N. The Interplay of Environment and Biota in Assessing the Freshwater Quality in Karst. Diversity 2022, 14, 475. [Google Scholar] [CrossRef]
  71. Epure, L.; Borda, D.R. Groundwater Contamination and the Relationship between Water Chemistry and Biotic Components in a Karst System (Bihor Mountains, Romania). Trav. Inst. Speol. 2014, 53, 69–84. [Google Scholar]
  72. Borda, D.; Năstase-Bucur, R.; Spînu, M.; Uricariu, R.; Mulec, J. Aerosolized Microbes from Organic Rich Materials: Case Study of Bat Guano from Caves in Romania. J. Caves. Karst Stud. 2014, 76, 114–126. [Google Scholar] [CrossRef]
  73. Mulec, J.; Oarga, Á. Ecological Evaluation of Air and Water Habitats in the Great Cavern of Santo Tomás, Cuba. Rev. Mex. Biodivers. 2014, 85, 910–917. [Google Scholar] [CrossRef] [Green Version]
  74. Gerič, B.; Pipan, T.; Mulec, J. Diversity of Culturable Bacteria and Meiofauna in the Epikarst of Škocjanske Jame Caves (Slovenia). Acta Carsol. 2016, 33, 301–309. [Google Scholar] [CrossRef]
  75. Laiz, L.; Groth, I.; Gonzalez, I.; Saiz-Jimenez, C. Microbiological Study of the Dripping Waters in Altamira Cave (Santillana Del Mar, Spain). J. Microbiol. Methods 1999, 36, 129–138. [Google Scholar] [CrossRef] [Green Version]
  76. Johnson, D.B.; Hallberg, K.B. The Microbiology of Acidic Mine Waters. Res. Microbiol. 2003, 154, 466–473. [Google Scholar] [CrossRef]
  77. Nayak, N.P. Microorganisms and Their Application in Mining and Allied Industries. Mater. Today 2023, 72, 2886–2891. [Google Scholar] [CrossRef]
  78. Sterritt, R.M.; Lester, J.N. The Microbiological Control of Mine Waste Pollution. Miner. Environ. 1979, 1, 45–47. [Google Scholar] [CrossRef]
  79. Newsome, L.; Falagán, C. The Microbiology of Metal Mine Waste: Bioremediation Applications and Implications for Planetary Health. Geohealth 2021, 5, e2020GH000380. [Google Scholar] [CrossRef]
  80. Mulec, J.; Krištůfek, V.; Chroňáková, A. Monitoring of Microbial Indicator Groups in Caves through the Use of RIDA®COUNT Kits. Acta Carsol. 2012, 41, 287–296. [Google Scholar] [CrossRef] [Green Version]
  81. Mulec, J.; Krištůfek, V.; Chroňáková, A. Comparative Microbial Sampling from Eutrophic Caves in Slovenia and Slovakia Using RIDA®COUNT Test Kits. Int. J. Speleol. 2012, 41, 1–8. [Google Scholar] [CrossRef]
  82. Kelman Wieder, R.; Lang, G. Influence of Wetlands and Coal Mining on Stream Water Chemistry. Water Air Soil Pollut. 1984, 23, 381–396. [Google Scholar] [CrossRef]
  83. Dobberteen, R.A.; Nickerson, N.H. Use of Created Cattail (Typha) Wetlands in Mitigation Strategies. Environ. Manag. 1991, 15, 797–808. [Google Scholar] [CrossRef]
  84. Karaca, O.; Cameselle, C.; Reddy, K.R. Mine Tailing Disposal Sites: Contamination Problems, Remedial Options and Phytocaps for Sustainable Remediation. Rev. Environ. Sci. Biotechnol. 2018, 17, 205–228. [Google Scholar] [CrossRef]
  85. Ali, A.-E.; Sloane, D.R.; Strezov, V. Assessment of Impacts of Coal Mining in the Region of Sydney, Australia on the Aquatic Environment Using Macroinvertebrates and Chlorophyll as Indicators. Int. J. Environ. Res. Public Health 2018, 15, 1556. [Google Scholar] [CrossRef] [PubMed] [Green Version]
  86. Gerhardt, A.; de Bisthoven, L.J.; Soares, A.M.V.M. Effects of Acid Mine Drainage and Acidity on the Activity of Choroterpes Picteti (Ephemeroptera: Leptophlebiidae). Arch. Environ. Contam. Toxicol. 2005, 48, 450–458. [Google Scholar] [CrossRef]
  87. Wright, I.A.; Ryan, M.M. Impact of Mining and Industrial Pollution on Stream Macroinvertebrates: Importance of Taxonomic Resolution, Water Geochemistry and EPT Indices for Impact Detection. Hydrobiologia 2016, 772, 103–115. [Google Scholar] [CrossRef]
  88. Qu, X.; Wu, N.; Tang, T.; Cai, Q.; Park, Y.-S. Effects of Heavy Metals on Benthic Macroinvertebrate Communities in High Mountain Streams. Ann. Limnol. 2010, 46, 291–302. [Google Scholar] [CrossRef]
  89. Rico-Sánchez, A.E.; Rodríguez-Romero, A.J.; Sedeño-Díaz, J.E.; López-López, E.; Sundermann, A. Aquatic Macroinvertebrate Assemblages in Rivers Influenced by Mining Activities. Sci. Rep. 2022, 12, 3209. [Google Scholar] [CrossRef]
  90. Iepure, S.; Selescu, L. Relationship between Heavy Metals and Hyporheic Invertebrate Community Structure in the Middle Basin of the Aries River (Transylvania, North-Western Romania). Transylv. Rev. Syst. Ecol. Res. 2009, 7, 125–148. [Google Scholar]
  91. Bonacina, L.; Fasano, F.; Mezzanotte, V.; Fornaroli, R. Effects of Water Temperature on Freshwater Macroinvertebrates: A Systematic Review. Biol. Rev. Camb. Philos. Soc. 2023, 98, 191–221. [Google Scholar] [CrossRef]
  92. Patrick, C.J.; McGarvey, D.J.; Larson, J.H.; Cross, W.F.; Allen, D.C.; Benke, A.C.; Brey, T.; Huryn, A.D.; Jones, J.; Murphy, C.A.; et al. Precipitation and Temperature Drive Continental-Scale Patterns in Stream Invertebrate Production. Sci. Adv. 2019, 5, eaav2348. [Google Scholar] [CrossRef] [PubMed] [Green Version]
  93. Hamid, A.; Bhat, S.U.; Jehangir, A. Assessment of Ecological Characteristics of Macroinvertebrate Communities and Their Relationship with Environmental Factors in a Stream Ecosystem. Chem. Ecol. 2021, 37, 746–766. [Google Scholar] [CrossRef]
  94. Angilletta, M.J. Evolutionary Thermal Biology. In Thermal Adaptation: A Theoretical and Empirical Synthesis; Oxford University Press: Oxford, UK, 2009. [Google Scholar] [CrossRef]
  95. Castella, E.; Adalsteinsson, H.; Brittain, J.E.; Gislason, G.M.; Lehmann, A.; Lencioni, V.; Lods-Crozet, B.; Maiolini, B.; Milner, A.M.; Olafsson, J.S.; et al. Macrobenthic Invertebrate Richness and Composition along a Latitudinal Gradient of European Glacier-Fed Streams. Freshw. Biol. 2001, 46, 1811–1831. [Google Scholar] [CrossRef]
  96. Dallas, H.F.; Rivers-Moore, N. Ecological Consequences of Global Climate Change for Freshwater Ecosystems in South Africa. S. Afr. J. Sci. 2014, 110, 11. [Google Scholar] [CrossRef] [Green Version]
  97. Grimm, N.B.; Fisher, S.G. Stability of Periphyton and Macroinvertebrates to Disturbance by Flash Floods in a Desert Stream. J. N. Am. Benthol. Soc. 1989, 8, 293–307. [Google Scholar] [CrossRef]
  98. Death, R.G. The Effect of Habitat Stability on Benthic Invertebrate Communities: The Utility of Species Abundance Distributions. Hydrobiologia 1996, 317, 97–107. [Google Scholar] [CrossRef]
  99. Whiles, M.R.; Wallace, J.B. Macroinvertebrate Production in a Headwater Stream during Recovery from Anthropogenic Disturbance and Hydrologic Extremes. Can. J. Fish. Aquat. Sci. 1995, 52, 2402–2422. [Google Scholar] [CrossRef] [Green Version]
  100. Jowett, I.G. Hydraulic Constraints on Habitat Suitability for Benthic Invertebrates in Gravel-Bed Rivers. River Res. Appl. 2003, 19, 495–507. [Google Scholar] [CrossRef]
  101. Segura, C.; Caldwell, P.; Sun, G.; McNulty, S.; Zhang, Y. A Model to Predict Stream Water Temperature across the Conterminous USA. Hydrol. Process. 2015, 29, 2178–2195. [Google Scholar] [CrossRef]
  102. Arai, R.; Nukazawa, K.; Kazama, S.; Takemon, Y. Variation in Benthic Invertebrate Abundance along Thermal Gradients within Headwater Streams of a Temperate Basin in Japan. Hydrobiologia 2015, 762, 55–63. [Google Scholar] [CrossRef]
  103. Feld, C.K.; Hering, D. Community Structure or Function: Effects of Environmental Stress on Benthic Macroinvertebrates at Different Spatial Scales. Freshw. Biol. 2007, 52, 1380–1399. [Google Scholar] [CrossRef]
  104. Poff, N.L.; Pyne, M.I.; Bledsoe, B.P.; Cuhaciyan, C.C.; Carlisle, D.M. Developing Linkages between Species Traits and Multiscaled Environmental Variation to Explore Vulnerability of Stream Benthic Communities to Climate Change. J. N. Am. Benthol. Soc. 2010, 29, 1441–1458. [Google Scholar] [CrossRef] [Green Version]
  105. Verdonschot, R.C.M.; Kail, J.; McKie, B.G.; Verdonschot, P.F.M. The Role of Benthic Microhabitats in Determining the Effects of Hydromorphological River Restoration on Macroinvertebrates. Hydrobiologia 2016, 769, 55–66. [Google Scholar] [CrossRef] [Green Version]
  106. Leonard, P.; Estrada Rendon, C.M.; Amara, G.; Roussy, J.; Tobin, J.; Degorce-Dumas, J.R. Natural Attenuation Study of the Impact of Acid Mine Drainage (AMD) in the Site of Carnoulès. In Biohydrometallurgy and the Environment Toward the Mining of the 21st Century—Proceedings of the International Biohydrometallurgy Symposium; Process Metallurgy; Elsevier: Amsterdam, The Netherlands, 1999; pp. 587–594. ISBN 9780444501936. [Google Scholar]
  107. Sakala, E.; Fourie, F.; Gomo, M.; Madzivire, G. Natural Attenuation of Acid Mine Drainage by Various Rocks in the Witbank, Ermelo and Highveld Coalfields, South Africa. Nat. Resour. Res. 2021, 30, 557–570. [Google Scholar] [CrossRef]
  108. Skousen, J.; Zipper, C.E.; Rose, A.; Ziemkiewicz, P.F.; Nairn, R.; McDonald, L.M.; Kleinmann, R.L. Review of Passive Systems for Acid Mine Drainage Treatment. Mine Water Environ. 2017, 36, 133–153. [Google Scholar] [CrossRef] [Green Version]
  109. Wang, S.; Mulligan, C.N. Natural Attenuation Processes for Remediation of Arsenic Contaminated Soils and Groundwater. J. Hazard. Mater. 2006, 138, 459–470. [Google Scholar] [CrossRef]
  110. Jurjovec, J.; Ptacek, C.J.; Blowes, D.W. Acid Neutralization Mechanisms and Metal Release in Mine Tailings: A Laboratory Column Experiment. Geochim. Cosmochim. Acta 2002, 66, 1511–1523. [Google Scholar] [CrossRef]
  111. Tum, S.; Toda, K.; Matsui, T.; Kikuchi, R.; Kong, S.; Meas, P.; Ear, U.; Ohtomo, Y.; Otake, T.; Sato, T. Seasonal Effects of Natural Attenuation on Drainage Contamination from Artisanal Gold Mining, Cambodia: Implication for Passive Treatment. Sci. Total Environ. 2022, 806, 150398. [Google Scholar] [CrossRef]
Figure 1. The maps of the Gold Mining Area of Zlatna (GMAZ) depict: (a) the locations of the sampling sites, with an emphasis on the taxonomic richness of the culturable microbiota (TRMB) and water invertebrates (TRWI). For TRMB and TRWI details see the first paragraph of Section 2.5. and Supplementary Table S1; (b) land use and human settlements; and (c) the simplified geological map modified after Borcoș et al. [45].
Water 15 02883 g001
Figure 2. Individual value plots showing the seasonal and yearly distribution of the: (a) Water temperature(WT), (b) pH, (c) Dissolved Oygen (DO), and (d) Elecrical Conductivity (EC) of the 22 waters sampled in the GMAZ. The acronyms correspond to the sampled water sites (see Table 1).
Water 15 02883 g002
Figure 3. The aquatic biota in the 22 sites sampled in the GMAZ: (a) average values of the microbiota (MB, shown above), and the total water invertebrates (TWI, shown below) for each sampling site; (b) heatmap of the relative abundances of MB and TWI (shown above), and of the taxonomic groups of water invertebrates (TGWI) (shown below); (c) the frequency of TGWI in the five types of waters. The acronyms correspond to the sampled water sites (see Table 1): TC = total count of culturable bacteria, Y = yeast, M = moulds. The three-letter acronyms correspond to the TGWI: ACA = Acariformes; AMP = Amphipoda; CLA = Cladocera; COL = Coleoptera; CYC = Cyclopoida; CLB = Collembola; DIP = Diptera; EFE = Ephemeroptera; GAS = Gastropoda; HAR = Harpacticoida; INF = insect fragments; ISO = Isopoda; LEP = Lepidoptera; MEG = Megaloptera; ODO = Odonata; OST = Ostracoda, PLE = Plecoptera; and NAU = nauplii of copepoda.
Water 15 02883 g003
Figure 4. Spearman’s rank correlations (rS) between heavy metals and: (a) culturable microbiota (TC and YM) and (b) water invertebrates. The strength of the correlations is indicated as follows: 0 < rS < −3 = weak, −3 < rS < −5 = moderate, and −5 < rS < −7 = strong negative correlations. Only correlations with a p < 0.01 significance are shown. The three-letter acronyms correspond to the TGWI as shown in Figure 3. The Cu, Cr, Fe, Ni, Pb, and Zn values used in our analyses are available in the supplementary data of Papp et al. [21].
Water 15 02883 g004
Figure 5. The multiple factor analysis (MFA) analysis shows the contribution of the physicochemical and environmental parameters to the MB in the GMAZ sampling sites: (a) The correlation circle of the vectors which correspond to the active groups of variables, env and ph-ch, and to the supplementary quantitative variables represented by MB. (b) The contribution of the quantitative variables in the first two dimensions. (c) The MFA plot based on the first two dimensions. (d) The polygons according to the qualitative supplementary variables: seasons, water types, drainage basins, geology, and land use. For the sites and legends acronyms, see Table 1.
Water 15 02883 g005
Figure 6. The MFA analysis shows the contribution of the physicochemical and environmental parameters to the TGWI in the GMAZ sampling sites: (a) The correlation circle of the vectors, which corresponds to the active groups of variables, env and ph-ch, and to the supplementary quantitative variables represented by TGWI. (b) The contribution of the quantitative variables in the first two dimensions. (c) The MFA plot based on the first two dimensions. (d) The polygons according to the qualitative variables: seasons, water types, drainage basins, geology, and land use. For the sites and legends acronyms, see Table 1.
Water 15 02883 g006
Figure 7. Differences between the water samples collected in 2015 and those collected in 2022–2023 in the GMAZ, presented as averages for the five water types: mines, adits, downstream, upstream, and groundwaters: (a) culturable microbiota averages; (b) water invertebrates averages; (c) taxonomic richness of biota (TRB); and (d) physicochemical parameters. * represent significant median differences (p < 0.05), ** represent p < 0.01, *** represent p < 0.001, from the Wilcoxon test.
Water 15 02883 g007
Table 1. Description of the sampling sites. Up = upstream; Dw = downstream; Ad = adit; Mn = mine; W = well; S = spring; Duf = discontinuous urban fabric; Blf = broad-leaved forest; Anv = agriculture and natural vegetation; AOR = alkaline ophiolitic rocks; CSR = carbonate sedimentary rocks; NR = neutral rocks; ACR = acidic rocks.
Drainage
Basin
Site Name and Water TypeSite CodingWater Sampling SourceGeologyLand Use
AmpoiAmpoi upstream1 Upsurface runningCSRDuf
Trâmpoaiele downstream2 Dwsurface runningCSRDuf
IPEG adit3 Adnatural pool with vegetation/bogNRBlf
Larga spring5 Sconcrete basinNRAnv_Blf
Larga adit7 Adfree flow, abundant vegetation/bogACRAnv_Blf
Larga creek8 Upsurface runningACRBlf
Trâmpoaiele upstream10 Upsurface runningCSRDuf
Trâmpoaiele well11 WgroundwaterCSRDuf
Ampoi downstream13 Dwsurface runningCSRDuf
ArdeuArdeu downstream16 Dwsurface runningNRAnv_Duf
Toți Sfinții adit18 Adfree flow, abundant vegetation/bogNRBlf_Duf
Haneș I mine19 Mnconcrete drain with free flowACRBlf
Haneș upstream20 UprunningNRBlf
Haneș II mine21 Mnsmall concrete pool with free flow/bogACRBlf
Valea Babei mine22 Mnsmall concrete pool with free flow/bogACRBlf
23 August adit23 Adlarge natural pool with abundant vegetation/bogAORBlf
Ardeu upstream24 Upsurface runningAORBlf
Ardeu well25 WgroundwaterNRAnv
TechereuTechereu downstream26 Dwsurface runningAORAnv_Blf
Techereu well27 WgroundwaterAORAnv_Blf
Podul Ionului mine29 Mnfree flow/bogAORBlf
Techereu upstream30 UprunningAORBlf
Disclaimer/Publisher’s Note: The statements, opinions and data contained in all publications are solely those of the individual author(s) and contributor(s) and not of MDPI and/or the editor(s). MDPI and/or the editor(s) disclaim responsibility for any injury to people or property resulting from any ideas, methods, instructions or products referred to in the content.

