
Analysis of Spatial and Temporal Variation in Sustainable Water Resources and Their Use Based on Improved Combination Weights


Abstract
:1. Introduction
2. Materials and Methods
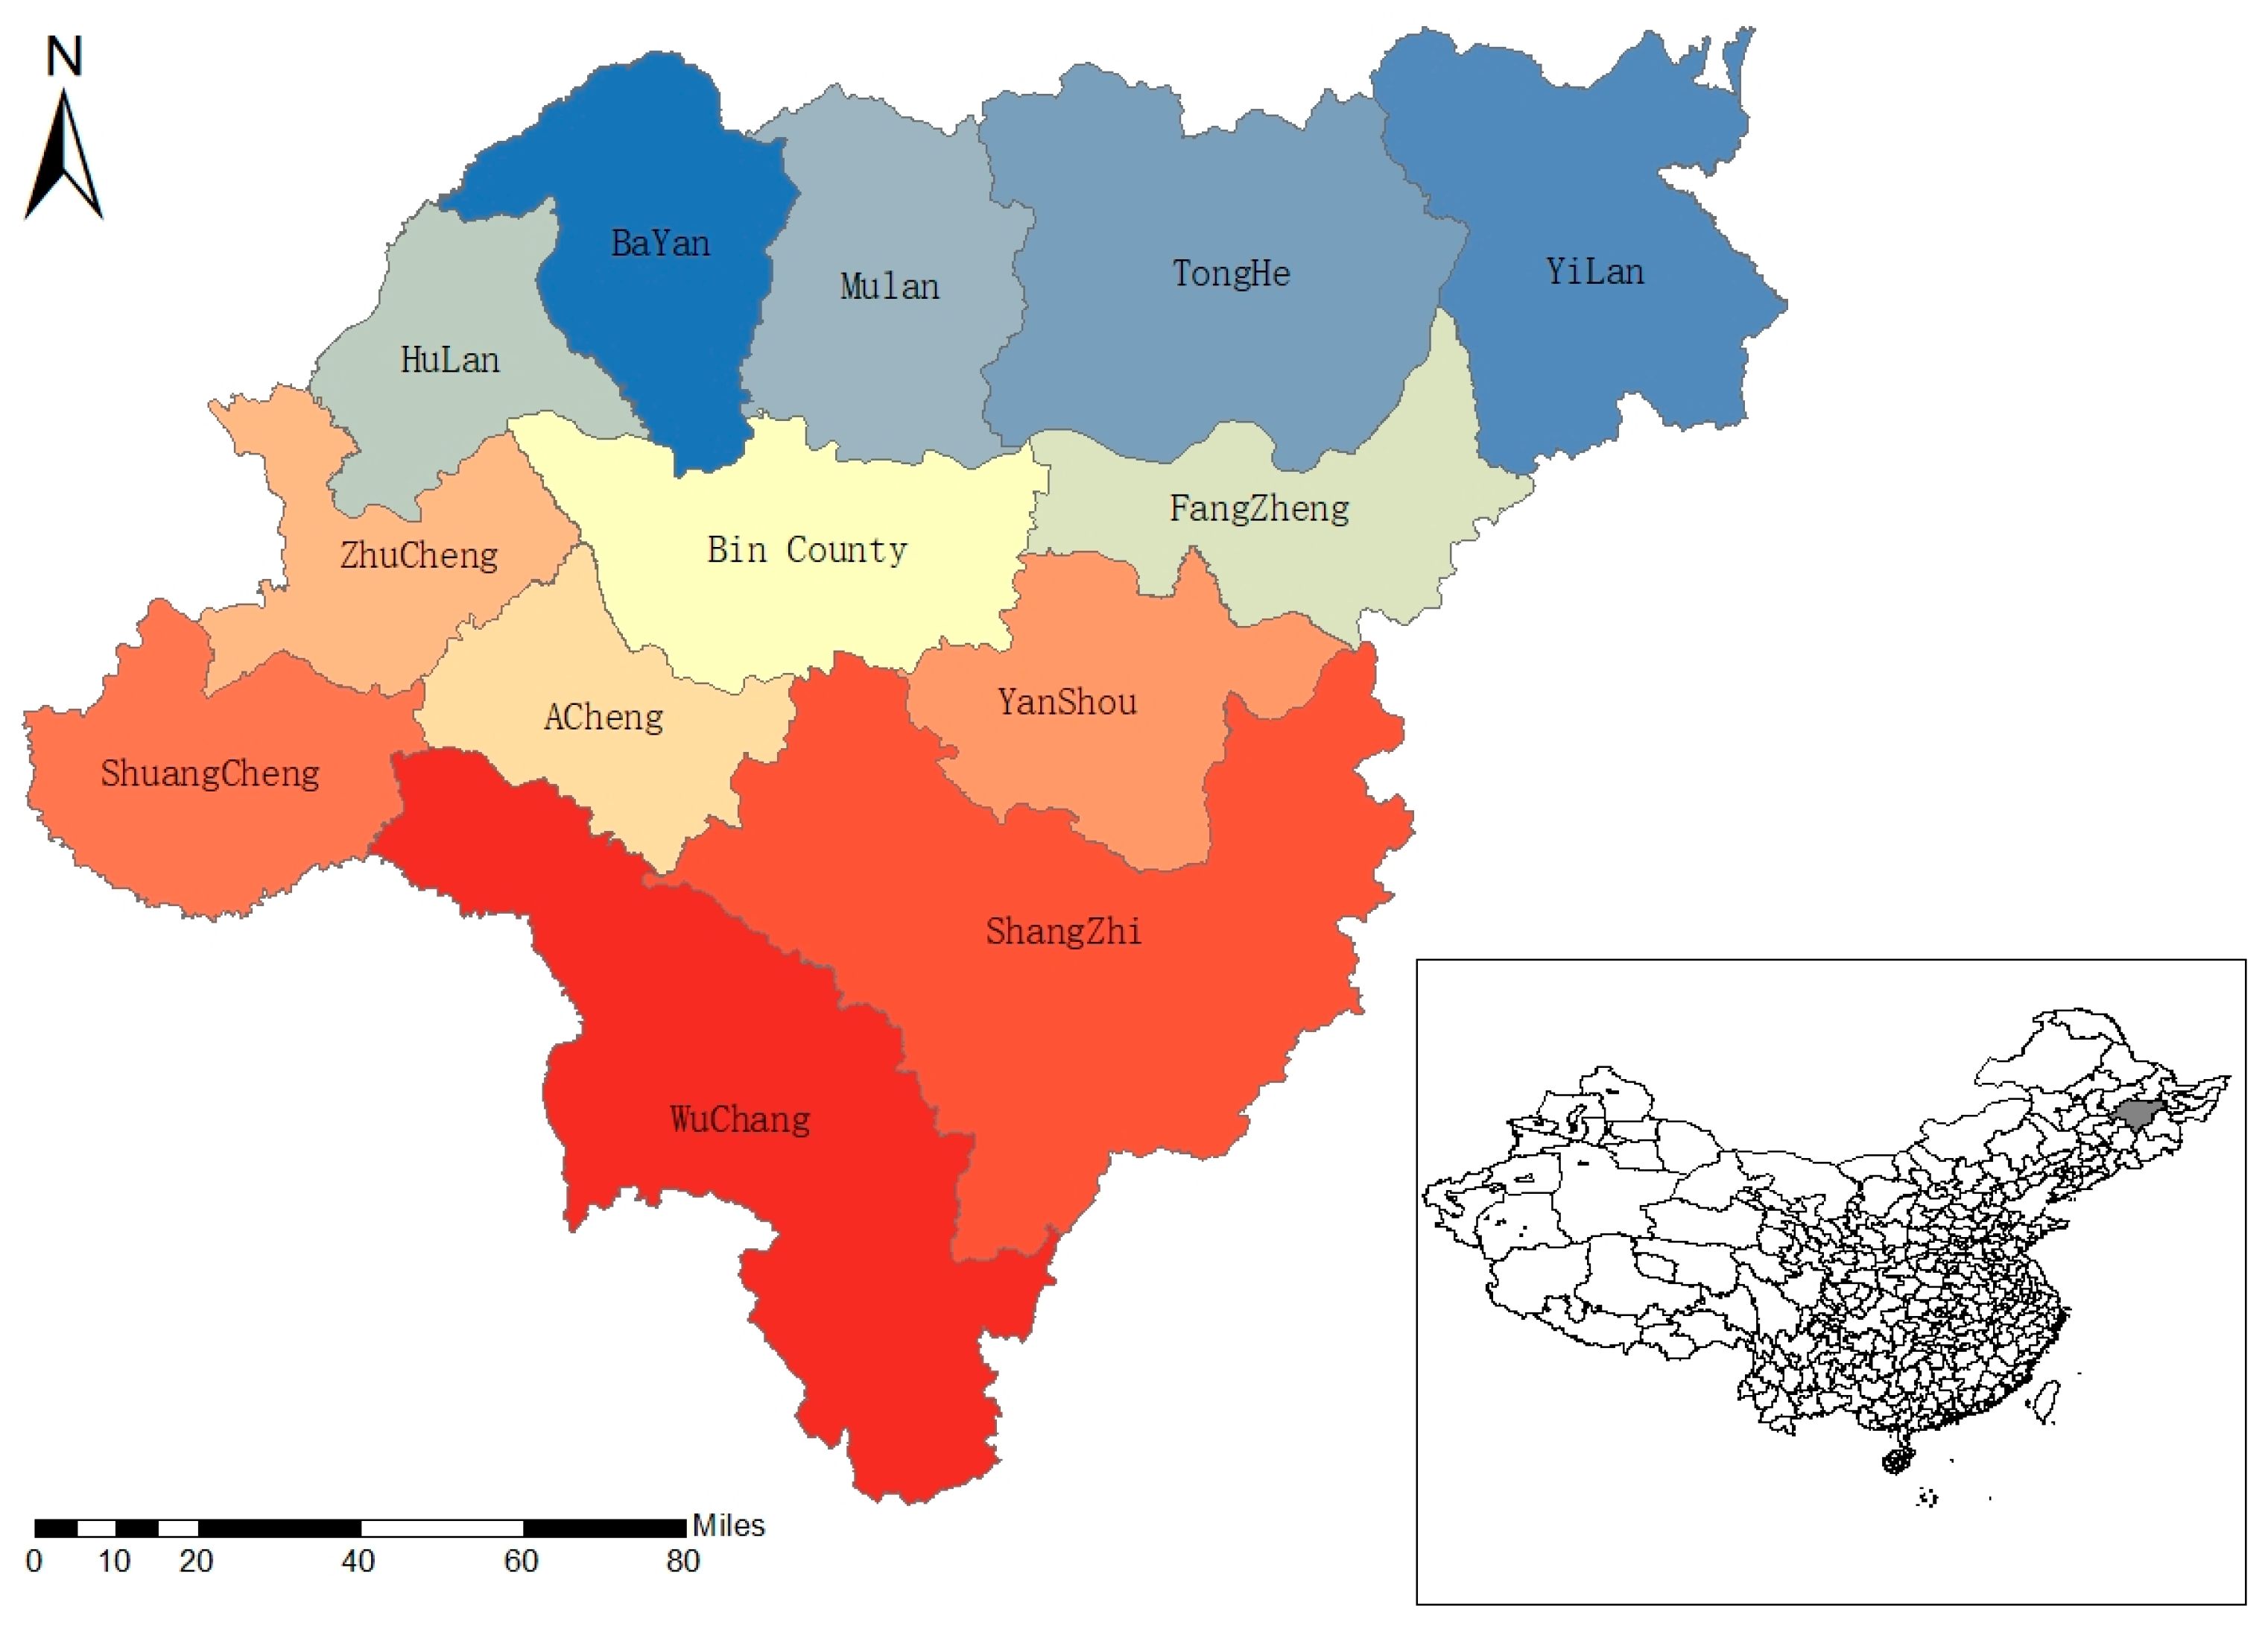
2.1. Study Area
2.2. The Construction of the Evaluation Index System
2.3. Methods
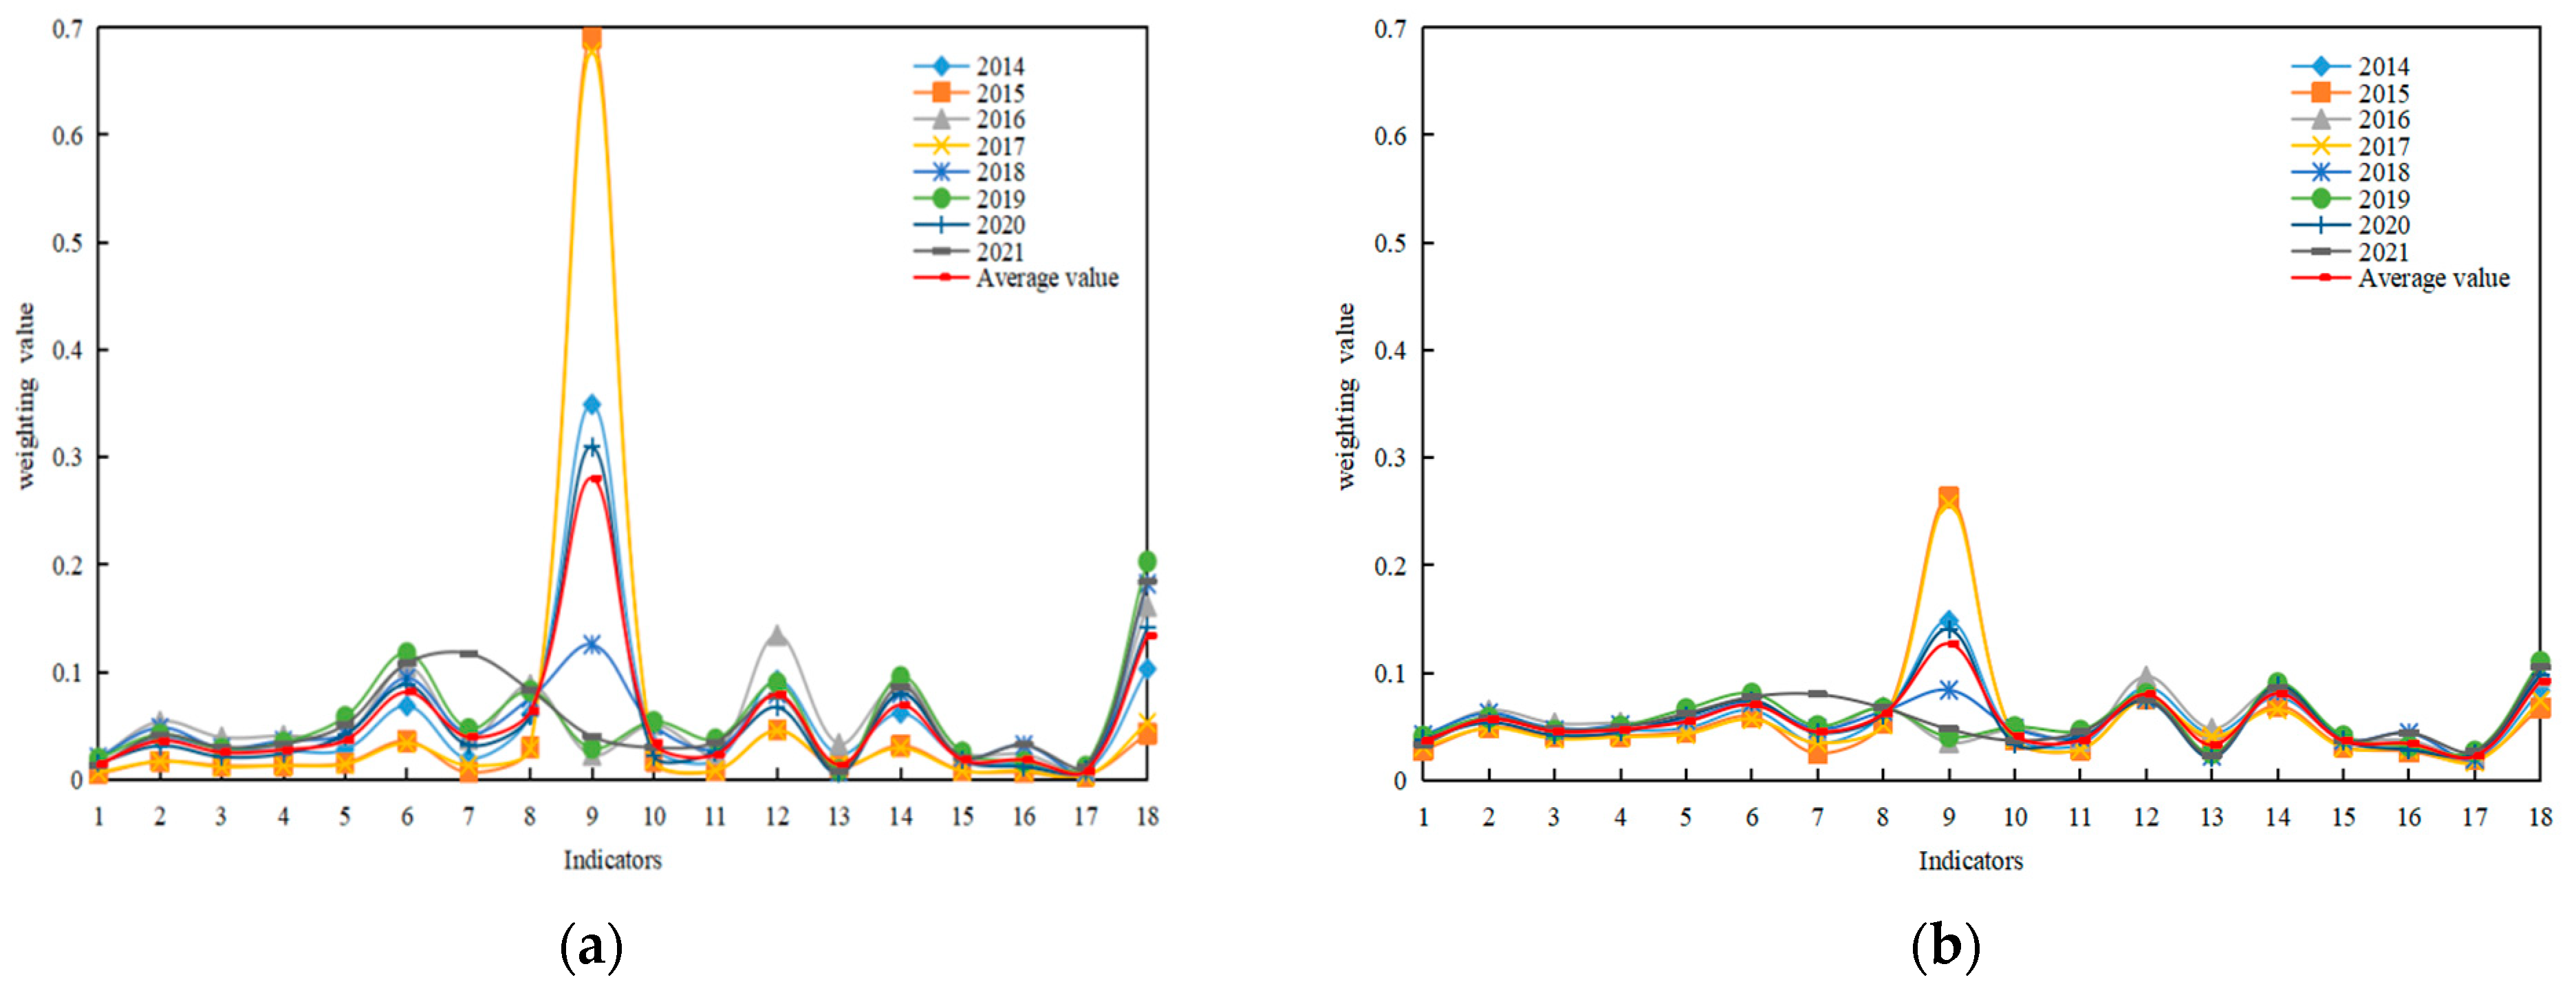
2.3.1. Weighting
- Sequential relationship analysis method (G1 method)
- 2.
- Coefficient of Variation Method (CVM)
- 3.
- Portfolio weights
2.3.2. Method Introduction
- Fuzzy recognition model
- 2.
- Close value method
- 3.
- Hierarchical analysis (AHP method)
- 4.
- Spatial autocorrelation model
2.4. Data Processing
3. Results
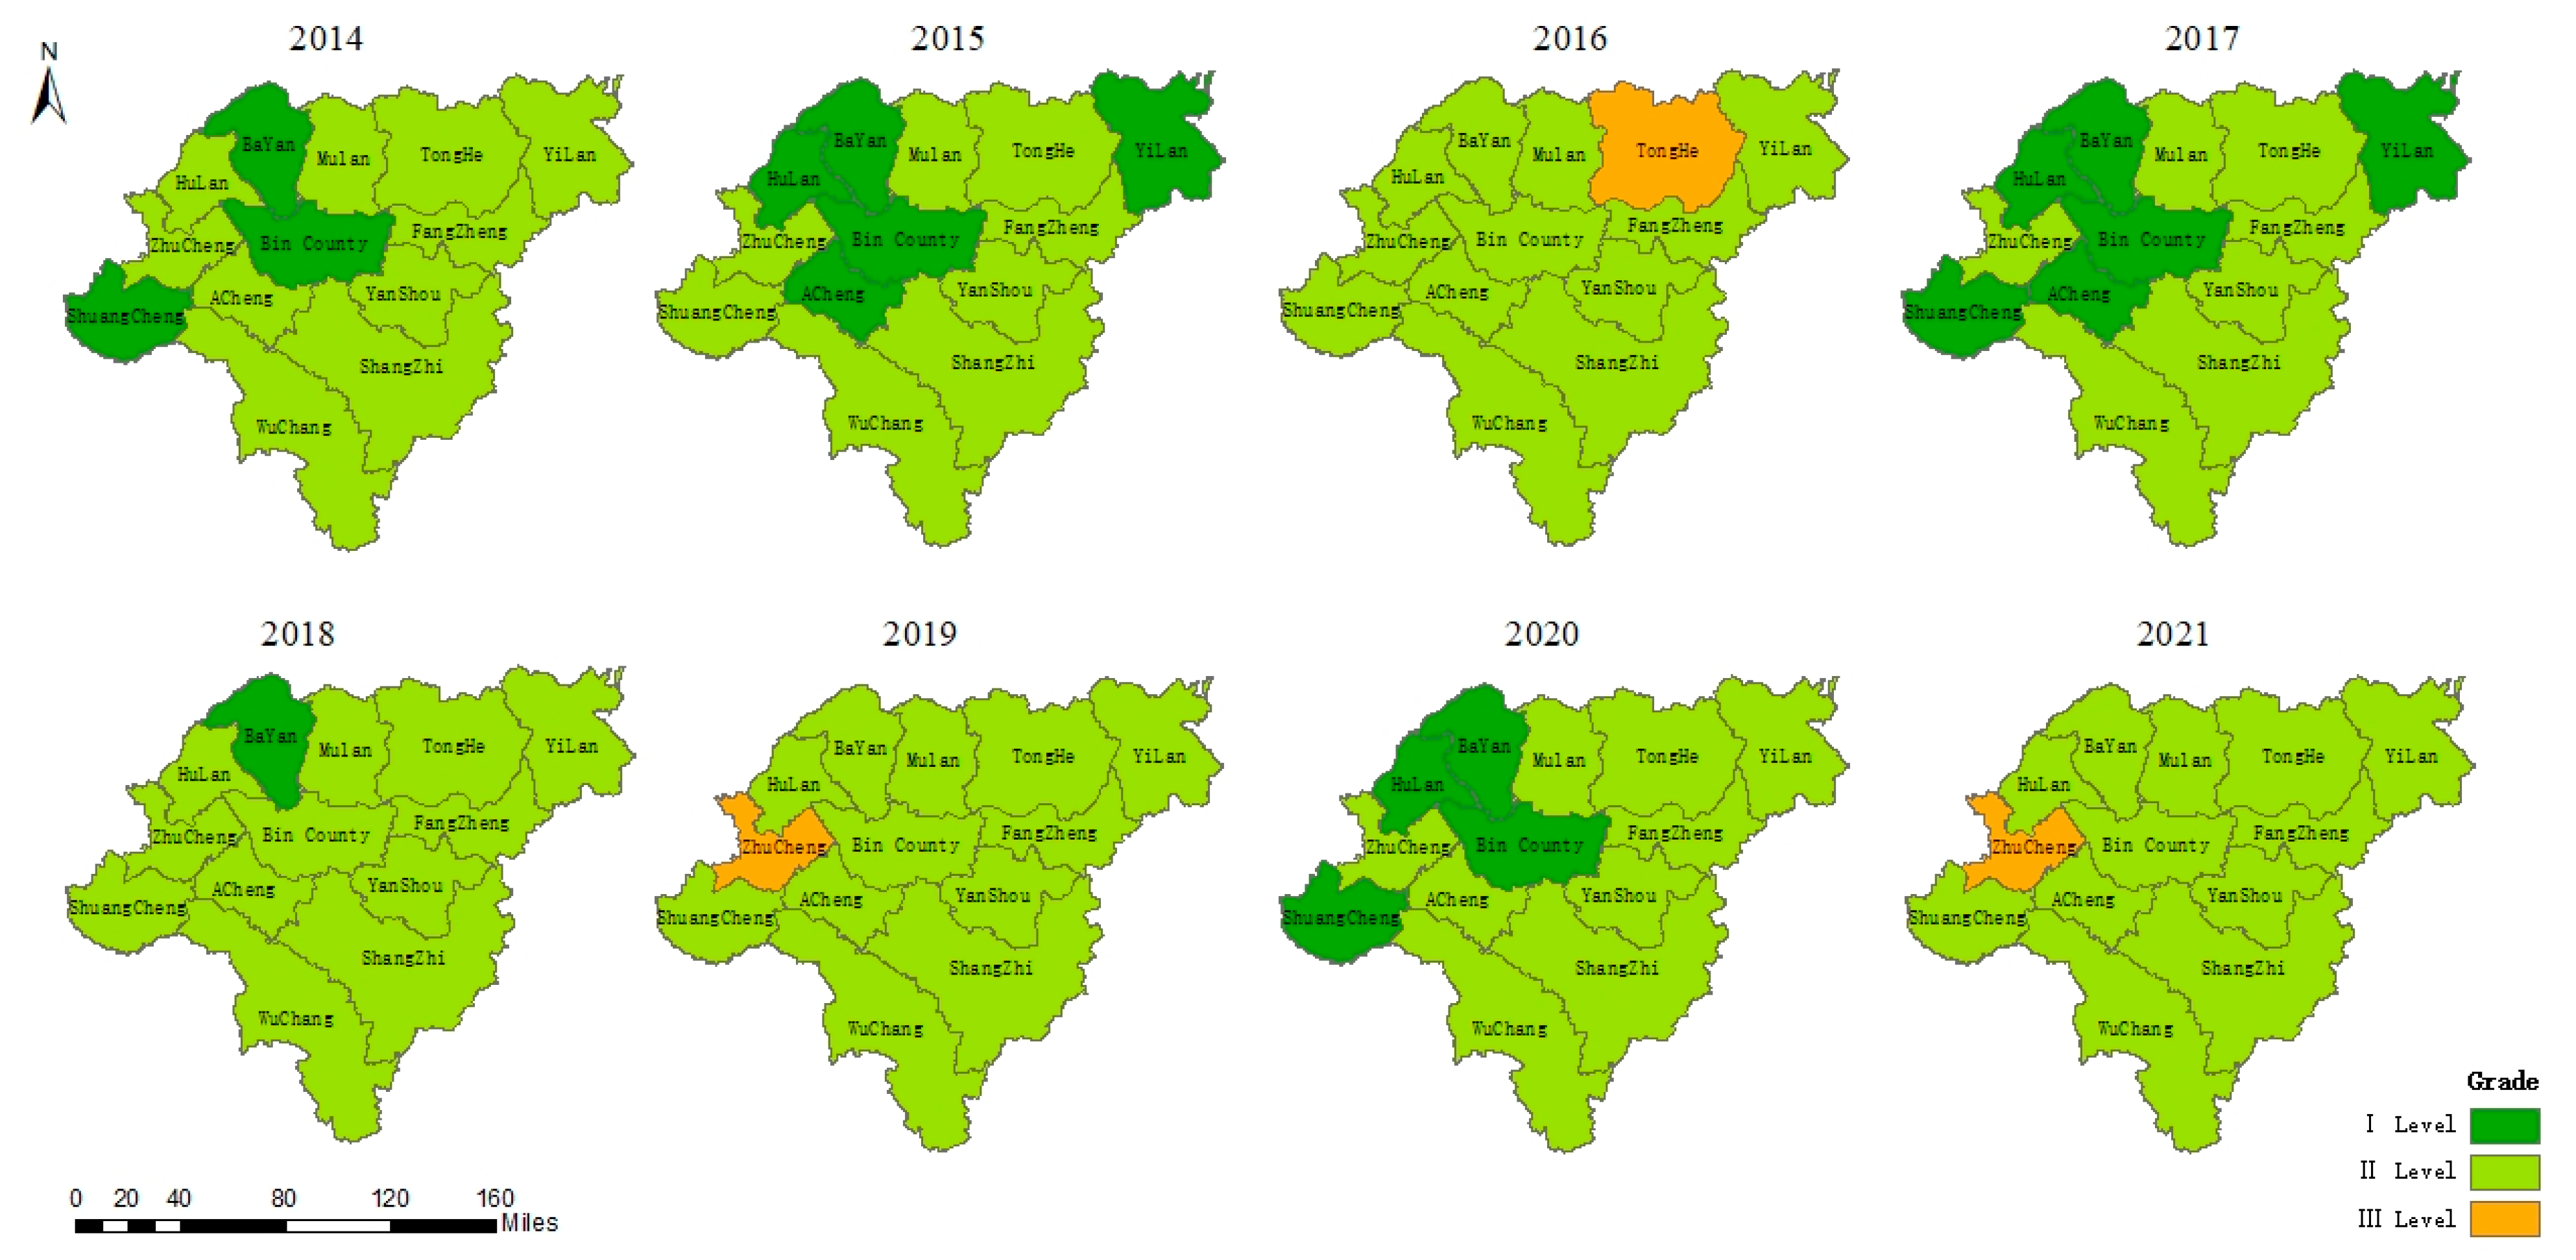
3.1. Analysis of the Degree of Sustainable Use of Water Resources in Time Series
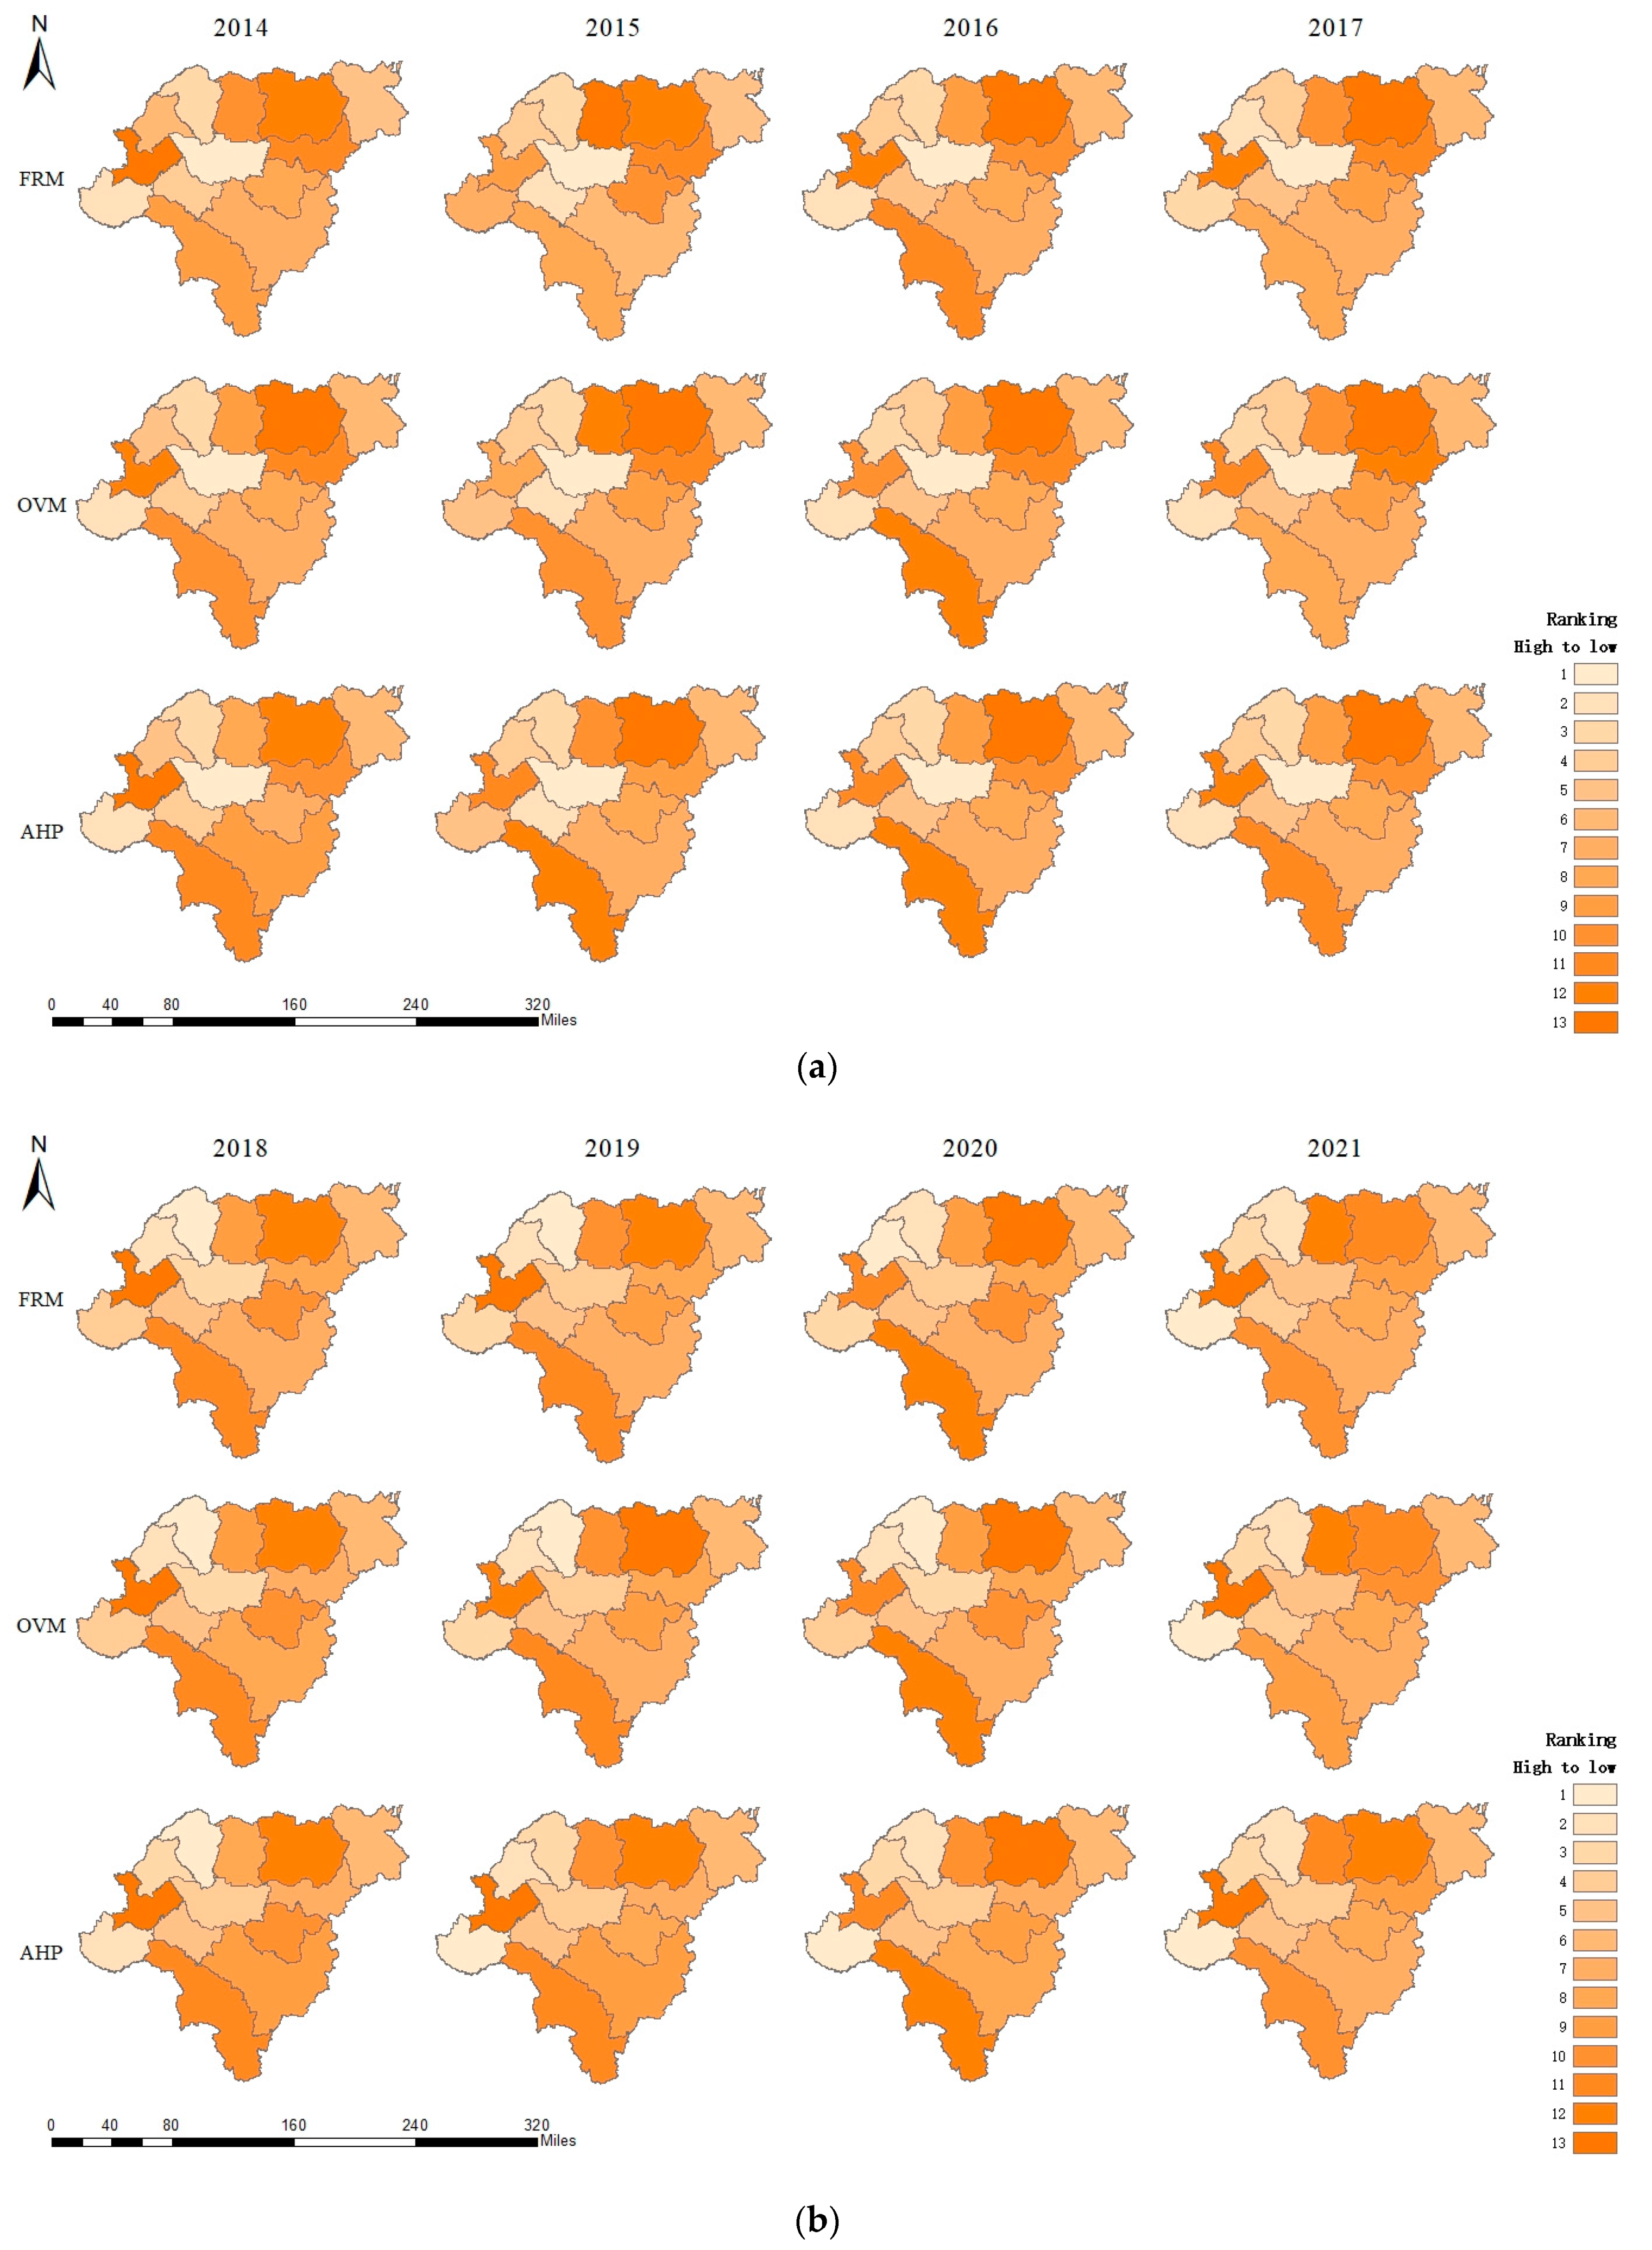
3.2. Analysis of the Degree of Sustainable Use of Water Resources with Respect to the Spatial Distribution
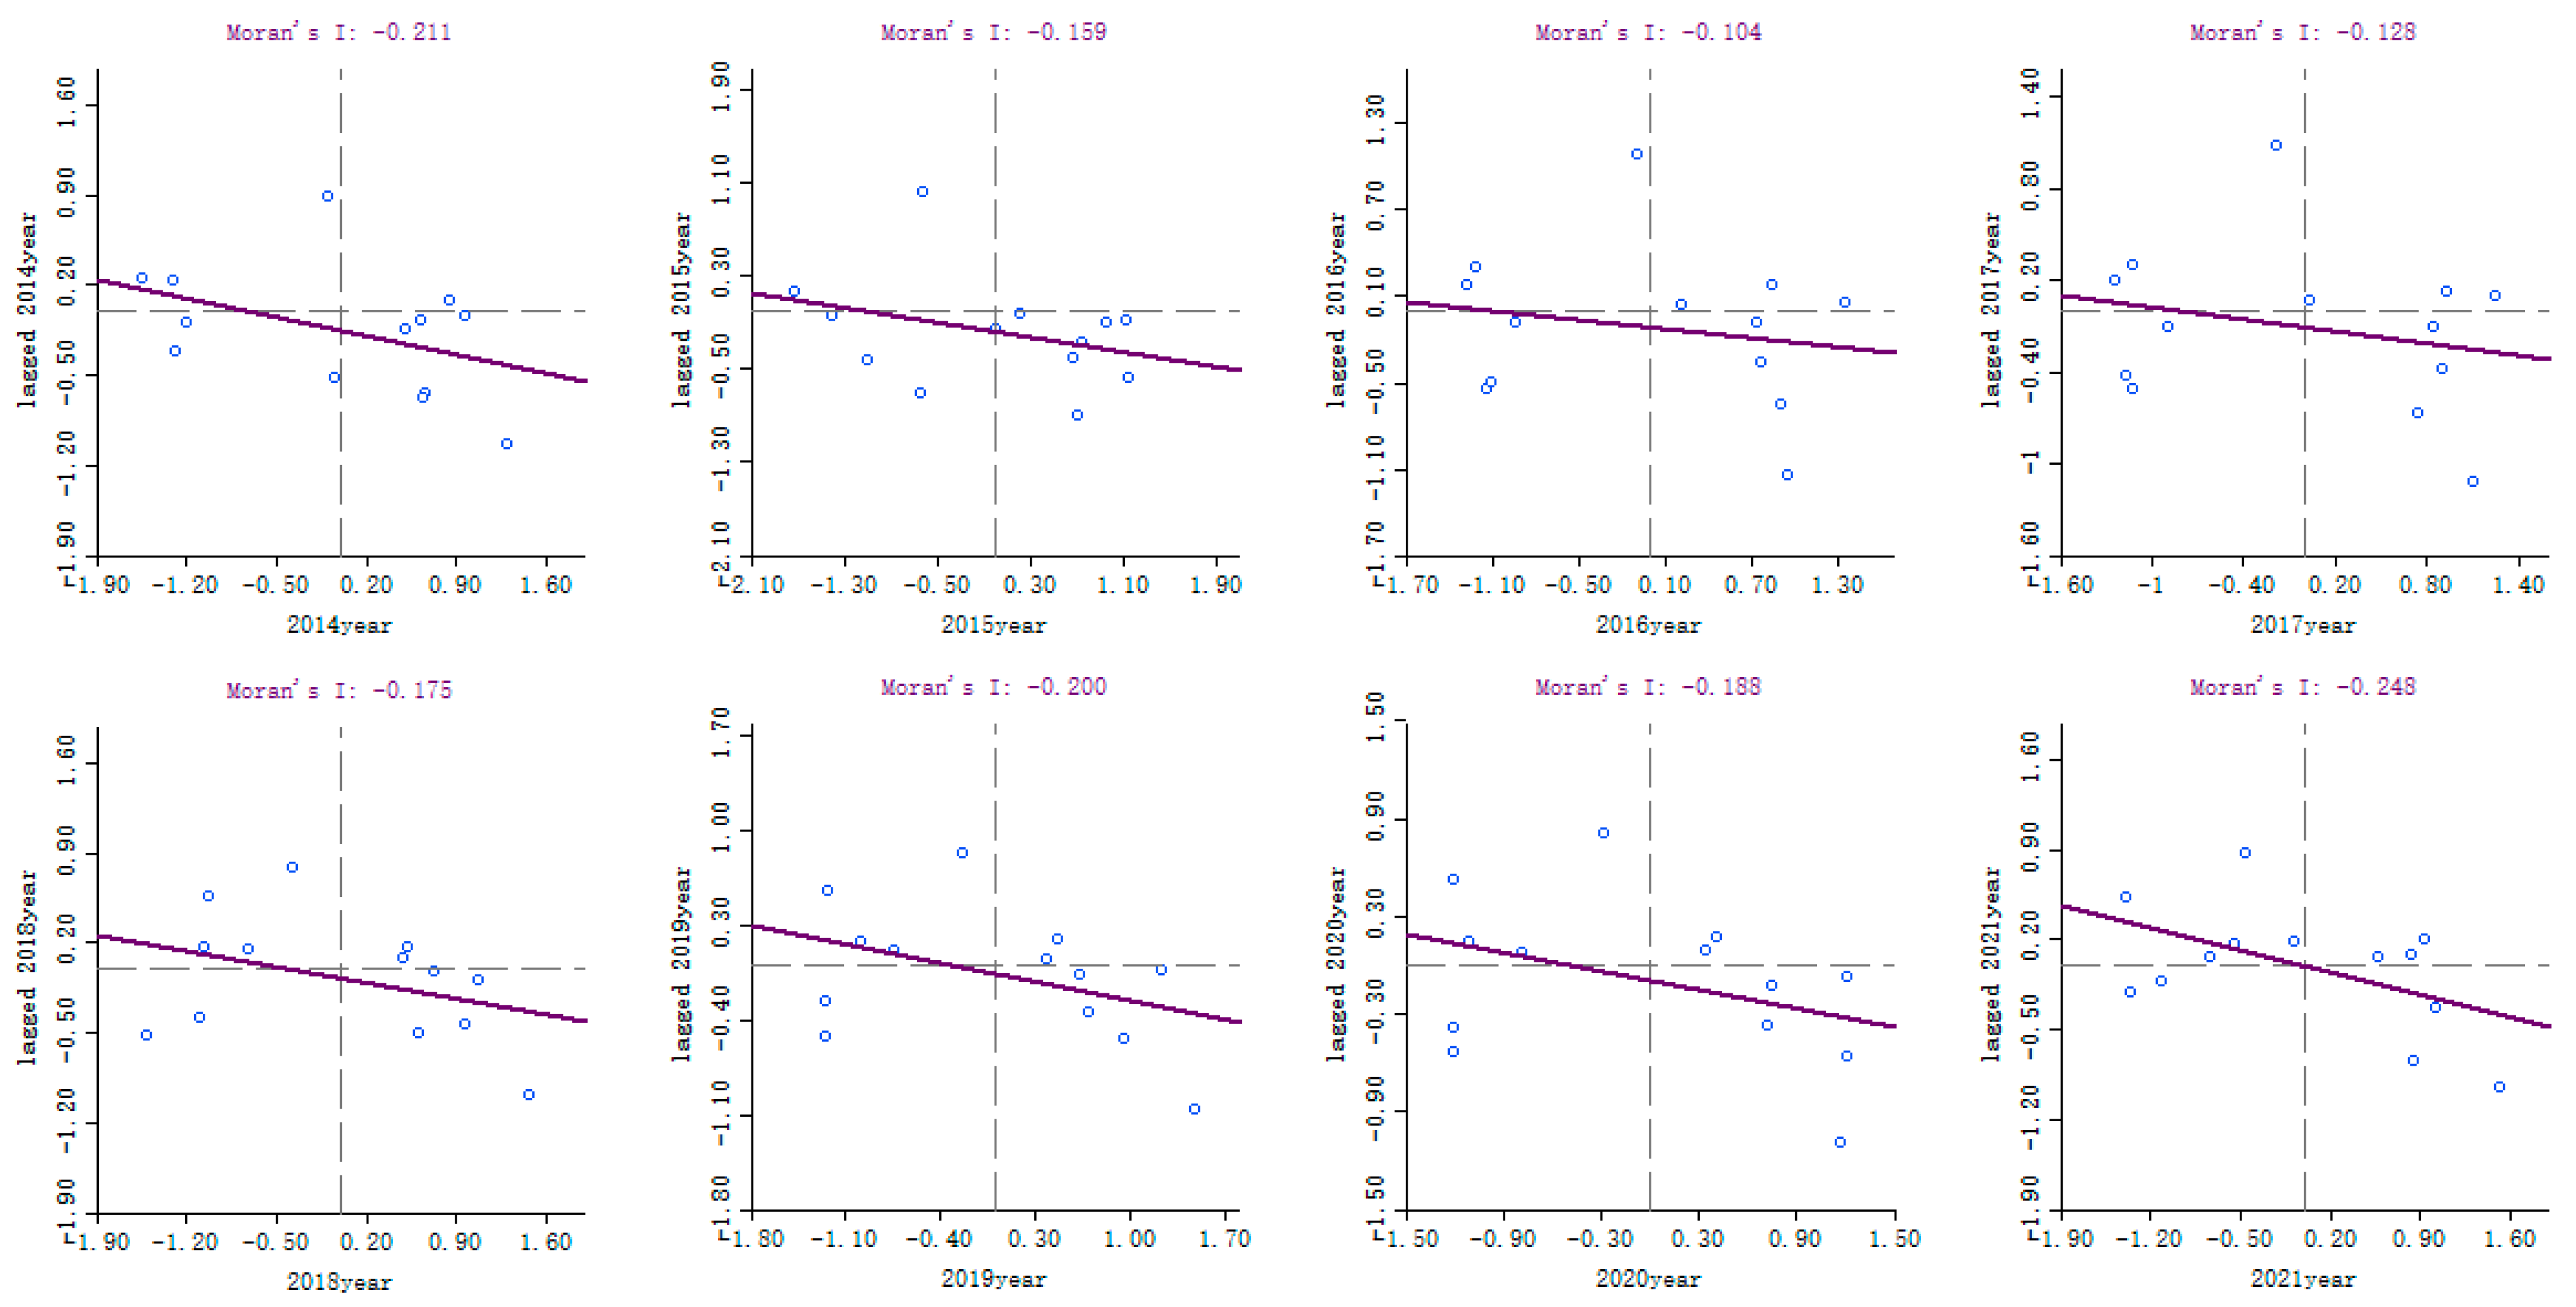
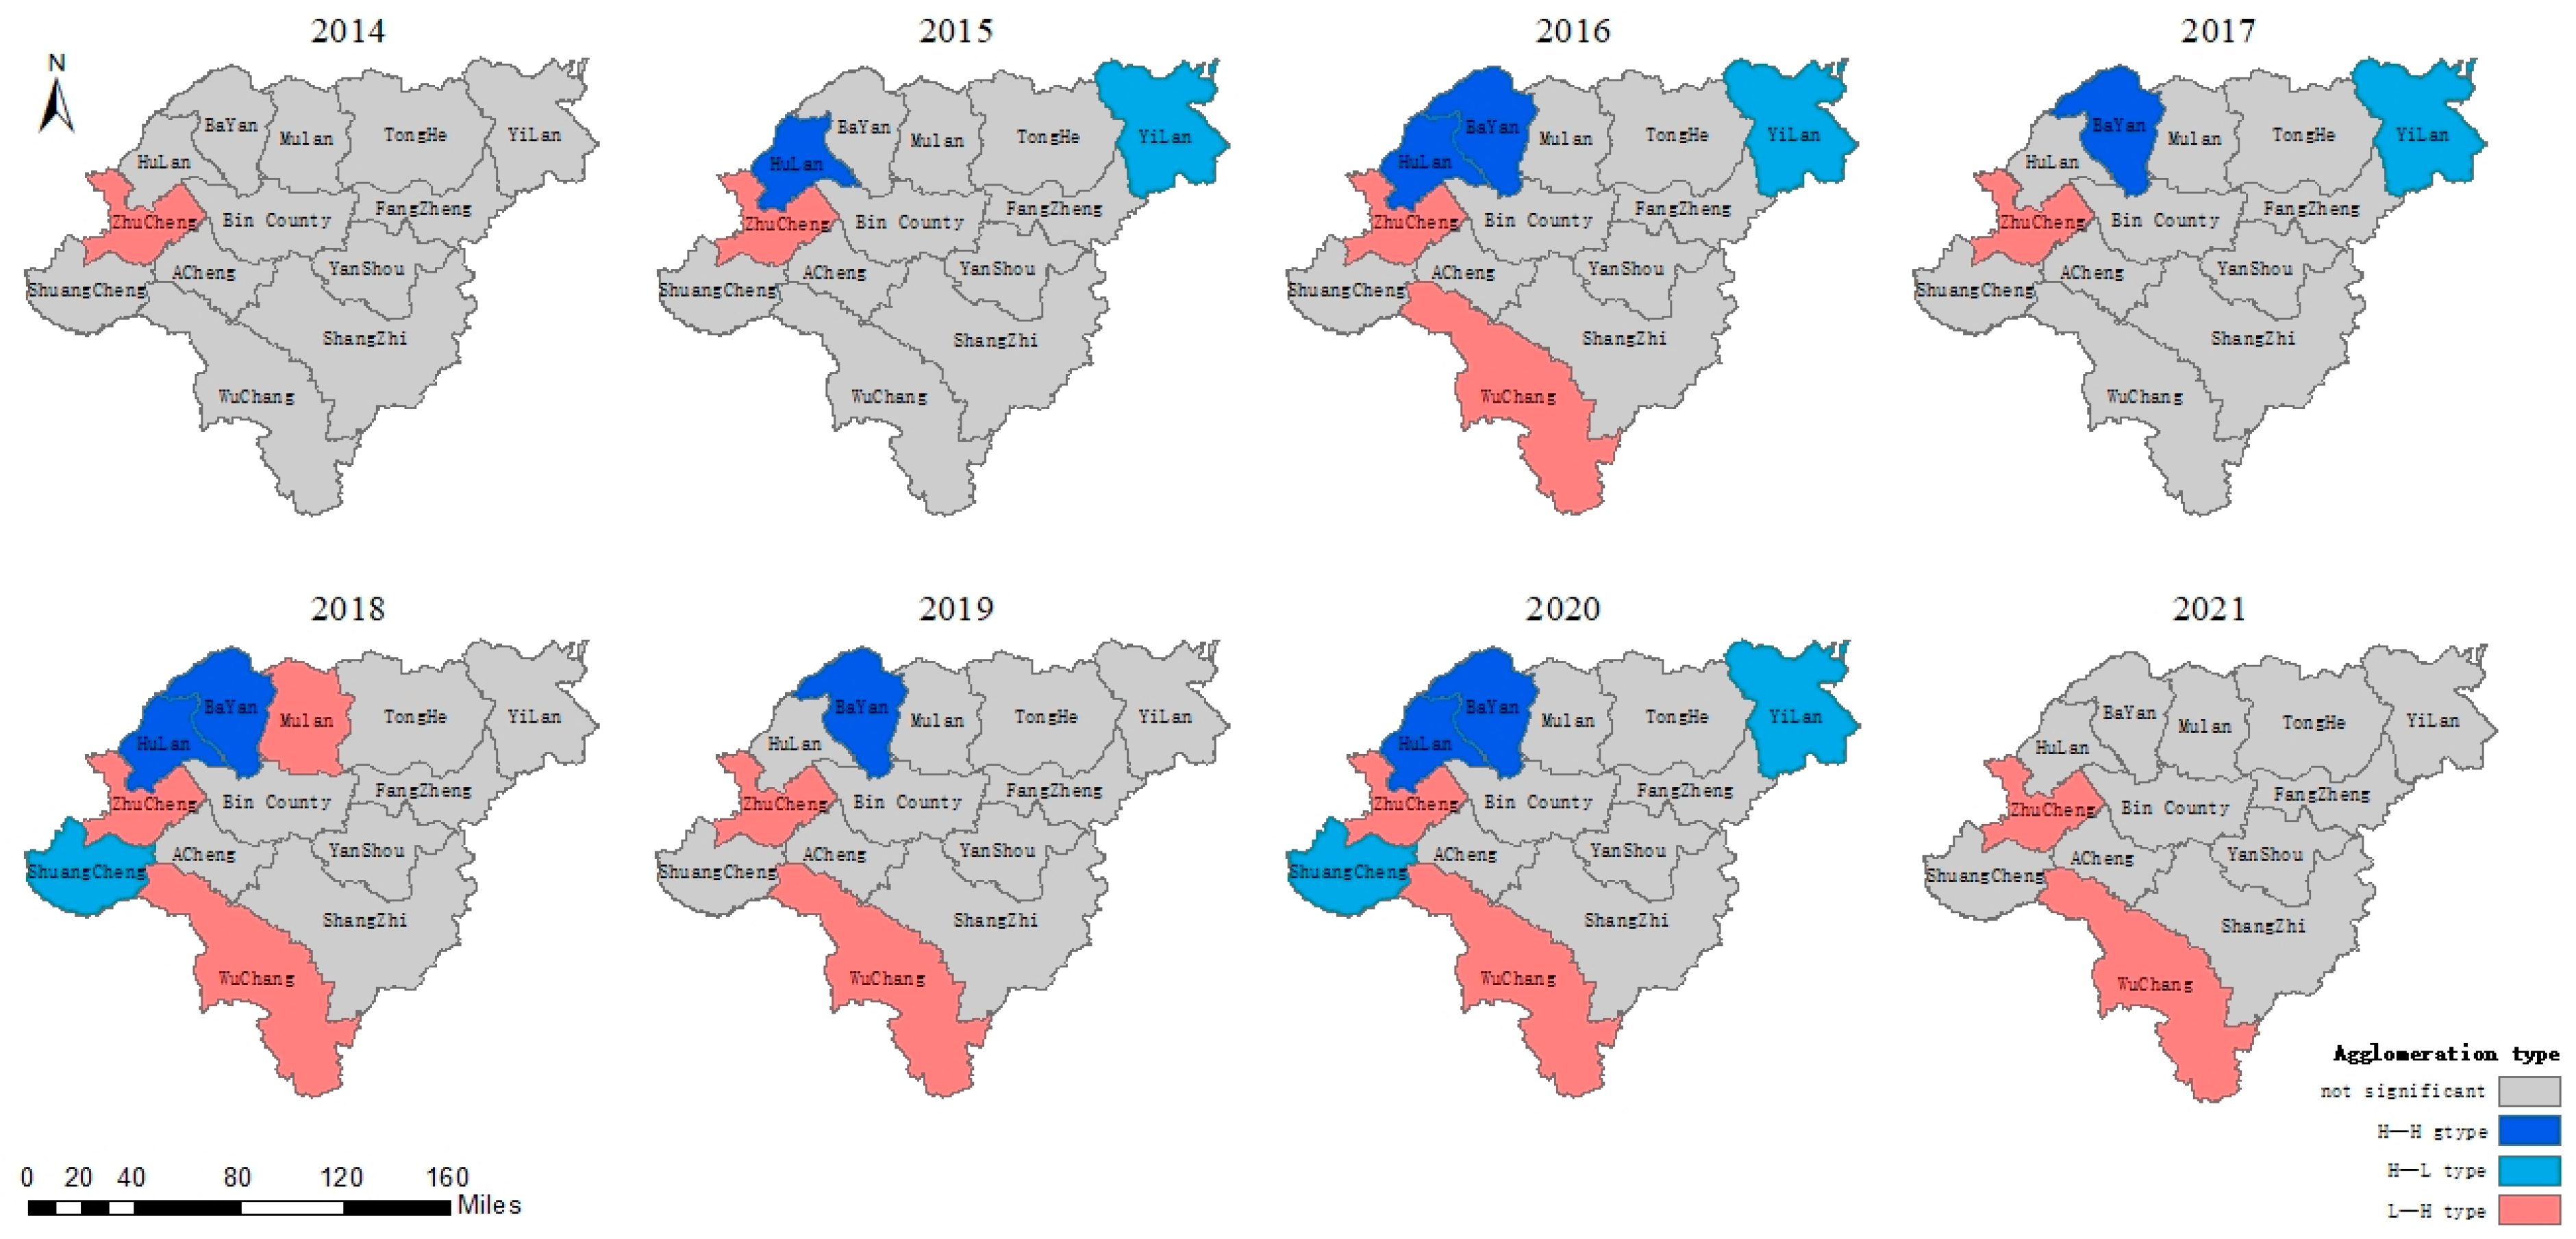
3.3. Analysis of the Spatial Correlation Pattern for the Degree of Sustainable Use of Water Resources
3.4. Method Feasibility Test Results
4. Discussion
5. Conclusions
- In terms of temporal and spatial distribution, over the past 8 years, the overall utilization of sustainable water resources in Harbin City showed a cyclical trend of increasing and then decreasing, and the spatial distribution pattern of sustainable water resources utilization in each district (county) was relatively stable, with the three regions of Binxian, Bayan, and Shuangcheng having better sustainable water resource utilization, and the three regions of Tonghe, the main city, and Wuchang having worse sustainable water resources utilization. In terms of the spatial correlation pattern, the overall spatial distribution of water resources sustainable utilization in the 13 counties of Harbin City showed a negative correlation from 2014 to 2021, and in the local spatial autocorrelation analysis, the main urban area, Wuchang City, Hulan District, Bayan County, Shuangcheng District, and Yilan County showed the clustering type. In the local spatial autocorrelation analysis, the main urban area, Wuchang City, Hulan District, Bayan County, Shuangcheng District, and Yilan County were the main counties that showed the clustering type.
- In the determination of the index weights, the combination of “G1-CVM” was used to render the weights of the same index more consistent over the years. Comparing the selected close value method and the AHP method, the calculation results are consistent with the fuzzy identification model, indicating that the combination of “G1-CVM” is practical and feasible.
Author Contributions
Funding
Data Availability Statement
Conflicts of Interest
References
- UNESCO. The United Nations World Water Development Report 2018: Nature-Based Solutions for Water; UNESCO: Paris, France, 2018. [Google Scholar]
- Kumar, M.B.; Pankaj, K.; Chitresh, S.; Shamik, C.; Arjun, G. Water Security in a Changing Environment: Concept, Challenges and Solutions. Water 2021, 13, 490. [Google Scholar]
- World Commission on Environment and Development. Our Common Future (‘The Brundtland Report’): World Commission on Environment and Development; Routledge: London, UK, 1987; pp. 52–55. [Google Scholar]
- Weerasooriya, R.; Liyanage, L.; Rathnappriya, R. Industrial water conservation by water footprint and sustainable development goals: A review. Environ. Dev. Sustain 2021, 23, 12661–12709. [Google Scholar] [CrossRef]
- Konstantinos, M.; Andrzej, S. Residential Sustainable Water Usage and Water Management: Systematic Review and Future Research. Water 2022, 14, 1027. [Google Scholar]
- Li, N.; Wang, H. Analysis on the evaluation of sustainable utilization of water resources by extension evaluation method. Arab. J. Geosci. 2020, 13, 813. [Google Scholar] [CrossRef]
- Peng, J.; Zheng, B.; Chu, Z.; Wang, X. Attaining Sustainable Water Resource Utilization in Lake Basins Using Progressive Operational Scenario Analysis. Water Resour. Manag. 2020, 34, 887–904. [Google Scholar] [CrossRef]
- Pan, B.; Han, M.; Li, Y.; Wang, M.; Du, H. An Analysis on the Trend of Sustainable Utilization of Water Resources in Dongying City, China. Water Resour. 2021, 48, 158–166. [Google Scholar] [CrossRef]
- Fan, M.; Xu, J.; Chen, Y.; Li, D.; Tian, S. How to Sustainably Use Water Resources—A Case Study for Decision Support on the Water Utilization of Xinjiang, China. Water 2021, 12, 3564. [Google Scholar] [CrossRef]
- Liang, D.; Lu, H.; Feng, L.; Qiu, L.; He, L. Assessment of the Sustainable Utilization Level of Water Resources in the Wuhan Metropolitan Area Based on a Three-Dimensional Water Ecological Footprint Model. Water 2021, 13, 3505. [Google Scholar] [CrossRef]
- Liu, N.; Jiang, W.; Huang, L.; Li, Y.; Zhang, C.; Xiao, X.; Huang, Y. Evolution of Sustainable Water Resource Utilization in Hunan Province, China. Water 2022, 14, 2477. [Google Scholar] [CrossRef]
- Song, M.; Tao, W.; Shang, Y.; Zhao, X. Spatiotemporal characteristics and influencing factors of China’s urban water resource utilization efficiency from the perspective of sustainable development. J. Clean. Prod. 2022, 338, 130649. [Google Scholar] [CrossRef]
- Ouyang, X.; Liao, H.; Jiang, Q.; Wang, Z. Simulation and Regulation of Sustainable Utilization of Water Resources in China Based on Improved Water Resources Ecological Footprint Model. Huanjing Kexue 2023, 44, 1368–1377. [Google Scholar]
- Tian, Y.; Li, C.; Yi, Y.; Wang, X.; Shu, A. Dynamic Model of a Sustainable Water Resources Utilization System with Coupled Water Quality and Quantity in Tianjin City. Sustainability 2020, 12, 4254. [Google Scholar] [CrossRef]
- Anfuding, G.; Yang, G.; Tian, L.; Pan, Y.; Huang, Z.; Xu, X.; Gao, Y.; Li, Y. Analysis of Water Resource Carrying Capacity and Obstacle Factors Based on GRA-TOPSIS Evaluation Method in Manas River Basin. Water 2023, 15, 236. [Google Scholar]
- Sui, X.; Liu, S.; Zhang, N.; Zang, Q.; Xia, Q.; Li, Y. Study on the current situation of water resources in Harbin City. Green Sci. Technol. 2022, 24, 175–178. [Google Scholar]
- Dai, C.; Tang, J.; Li, Z.; Duan, Y. Index System of Water Resources Development and Utilization Level Based on Water-Saving Society. Water 2022, 14, 802. [Google Scholar] [CrossRef]
- Liu, Z.; Li, B.; Chen, M.; Li, T. Evaluation on sustainability of water resource in karst area based on the emergy ecological footprint model and analysis of its driving factors: A case study of Guiyang city, China. Environ. Sci. Pollut. Res. Int. 2021, 28, 49232–49243. [Google Scholar] [CrossRef]
- Wei, X.; Wang, J.; Wu, S. Comprehensive evaluation model for water environment carrying capacity based on VPOSRM framework: A case study in Wuhan, China. Sustain. Cities Soc. 2019, 50, 101640. [Google Scholar] [CrossRef]
- Yang, J.; Yang, P.; Zhang, S.; Wang, W.; Cai, W.; Hu, S. Evaluation of water resource carrying capacity in the middle reaches of the Yangtze River Basin using the variable fuzzy-based method. Environ. Sci. Pollut. Res. Int. 2023, 30, 30572–30587. [Google Scholar] [CrossRef]
- Lv, P.; Liu, D.; Zhao, F. Comprehensive Evaluation of Water Resources Carrying Capacity in Jiansanjiang Branch Bureau. Adv. Mater. Res. 2011, 204, 834–837. [Google Scholar] [CrossRef]
- Su, G.; Jia, B.; Wang, P.; Zhang, R.; Shen, Z. Risk identification of coal spontaneous combustion based on COWA modified G1 combination weighting cloud model. Sci. Rep. 2022, 12, 2992. [Google Scholar] [CrossRef]
- Dong, J.; Gao, H.; Sun, L.; Wei, Y.; Cai, H.; Guo, Y. Computer assisted optimal evaluation of grouting scheme in shallow tunnel through G1 method and GRA. J. Phys. Conf. Ser. 2021, 2033, 012127. [Google Scholar] [CrossRef]
- Jin, M.; Zhang, J.; Cui, S.; Kang, M.; Xiao, Y.; Xiang, R.; Yan, Z. Research on comprehensive evaluation of data link based on G1 method and entropy weight method. J. Phys. Conf. Ser. 2021, 1820, 012115. [Google Scholar] [CrossRef]
- Warisa, T.; Sa-Aat, N.; Suparat, N. A Bayesian Approach for Estimation of Coefficients of Variation of Normal Distributions. Sains Malays. 2021, 50, 261–278. [Google Scholar]
- Dong, C.; Yang, Y. Construction of the Evaluation Index System of China’s Green Economy Development Level-Based on the Dual Model of Entropy Value Method and Coefficient of Variation Method. Int. J. New Dev. Eng. Soc. 2022, 6, 38–44. [Google Scholar]
- Iqbal, J.; Gorai, K.A.; Katpatal, B.Y.; Pathak, G. Development of GIS-based fuzzy pattern recognition model (modified DRASTIC model) for groundwater vulnerability to pollution assessment. Int. J. Environ. Sci. Technol. 2015, 12, 3161–3174. [Google Scholar] [CrossRef]
- Bhanu, C.B.; Amit, K.G. Development of Fuzzy Pattern Recognition Model for Underground Metal Mining Method Selection. Int. J. Ambient Comput. Intell. (IJACI) 2021, 12, 64–78. [Google Scholar]
- Yuan, D.; Xue, F.; Li, M. Application of Fuzzy Pattern Recognition Model on the Regional Water Resources Carrying Capacity Evaluation. Appl. Mech. Mater. 2014, 3488, 43–48. [Google Scholar]
- Wen, L.; Yang, Y.; Li, Y. A Comprehensive Evaluation Method of Safety Behavior of Concrete Face Rockfill Dam Based on Regression Relationship Method and Fuzzy Recognition Model. IOP Conf. Ser. Earth Environ. Sci. 2021, 643, 012070. [Google Scholar] [CrossRef]
- Zhao, H. Evaluation model of manufacturing technological learning and product innovation performance. In Proceedings of the IEEE 16th International Conference on Industrial Engineering and Engineering Management, Beijing, China, 21–23 October 2009; Institute of Electrical and Electronic Engineers, Beijing Section: Beijing, China; Chinese Industrial Engineering Institute of Chinese Mechanical Engineering Society: Beijing, China, 2009; Volume 2, pp. 897–900. [Google Scholar]
- Li, P.; Wu, J.; Qian, H. Groundwater quality assessment based on entropy weighted osculating value method. Int. J. Environ. Sci. 2010, 1, 621–630. [Google Scholar]
- Slavica, D.; Danica, B.; Milica, K.; Stefan, Z. An AHP approach to airport choice by freight forwarder. Sustain. Futures 2023, 5, 100106. [Google Scholar]
- Saaty, T.L.; Kearns, K.P. The Analytic Hierarchy Process: Analytical Planning; Elsevier: Amsterdam, The Netherlands, 1985; pp. 63–86. [Google Scholar]
- Shirali, G.A.; Rashnoudi, P.; Salehi, V.; Ghanbari, S. A hierarchical assessment of resilience engineering indicators in petrochemical industries using AHP and TOPSIS. Hum. Factors Ergon. Manuf. Serv. Ind. 2022, 33, 3–26. [Google Scholar] [CrossRef]
- Purwaningsih, T.; Cintami, A. Analysis of factors affecting the area of forest and land fires in Indonesia uses spatial regression Geoda and SaTScan. J. Inform. 2019, 12, 58. [Google Scholar] [CrossRef] [Green Version]
- Harbin Water Affairs Bureau. Harbin Water Resources Bulletin Harbin 2014; Water Affairs Bureau: Harbin, China, 2014. [Google Scholar]
- Harbin Water Affairs Bureau. Harbin Water Resources Bulletin Harbin 2015; Water Affairs Bureau: Harbin, China, 2015. [Google Scholar]
- Harbin Water Affairs Bureau. Harbin Water Resources Bulletin Harbin 2016; Water Affairs Bureau: Harbin, China, 2016. [Google Scholar]
- Harbin Water Affairs Bureau. Harbin Water Resources Bulletin Harbin 2017; Water Affairs Bureau: Harbin, China, 2017. [Google Scholar]
- Harbin Water Affairs Bureau. Harbin Water Resources Bulletin Harbin 2018; Water Affairs Bureau: Harbin, China, 2018. [Google Scholar]
- Harbin Water Affairs Bureau. Harbin Water Resources Bulletin Harbin 2019; Water Affairs Bureau: Harbin, China, 2019. [Google Scholar]
- Harbin Water Affairs Bureau. Harbin Water Resources Bulletin Harbin 2020; Water Affairs Bureau: Harbin, China, 2020. [Google Scholar]
- Harbin Water Affairs Bureau. Harbin Water Resources Bulletin Harbin 2021; Water Affairs Bureau: Harbin, China, 2021. [Google Scholar]
- Harbin Bureau of Statistics. Harbin Statistical Yearbook 2014; China Statistics Press: Beijing, China, 2014. [Google Scholar]
- Harbin Bureau of Statistics. Harbin Statistical Yearbook 2015; China Statistics Press: Beijing, China, 2015. [Google Scholar]
- Harbin Bureau of Statistics. Harbin Statistical Yearbook 2016; China Statistics Press: Beijing, China, 2016. [Google Scholar]
- Harbin Bureau of Statistics. Harbin Statistical Yearbook 2017; China Statistics Press: Beijing, China, 2017. [Google Scholar]
- Harbin Bureau of Statistics. Harbin Statistical Yearbook 2018; China Statistics Press: Beijing, China, 2018. [Google Scholar]
- Harbin Bureau of Statistics. Harbin Statistical Yearbook 2019; China Statistics Press: Beijing, China, 2019. [Google Scholar]
- Harbin Bureau of Statistics. Harbin Statistical Yearbook 2020; China Statistics Press: Beijing, China, 2020. [Google Scholar]
- Harbin Bureau of Statistics. Harbin Statistical Yearbook 2021; China Statistics Press: Beijing, China, 2021. [Google Scholar]
- Mitina, U.; Kunal, D.; Darshana, P.; Suvarna, T.; Sandipan, D. Delineation of potential groundwater recharge zones using remote sensing, GIS, and AHP approaches. Urban Clim. 2023, 48, 101415. [Google Scholar]
- Majeed, M.; Lu, L.; Mushahid, M.A.; Aqil, T.; Qin, S.; Mohamed, E.E.-H.; Mohamed, E.S.; Li, Q.; Abdulrahman, A. Prediction of flash flood susceptibility using integrating analytic hierarchy process (ahp) and frequency ratio (fr) algorithms. Front. Environ. Sci. 2023, 10, 1037547. [Google Scholar] [CrossRef]
- Nadira, A.S.; Li, S. The Current Situation and Sustainable Development of Water Resources in Bangladesh. Am. J. Water Sci. Eng. 2018, 4, 9–15. [Google Scholar] [CrossRef] [Green Version]
- Nezami, S.R.; Feizi, A. Achieving Groundwater Resource Sustainability at Watershed Scale by Conjunctive Use of Groundwater and surface Resources. J. Appl. Sci. Environ. Manag. 2018, 22, 1263–1268. [Google Scholar] [CrossRef] [Green Version]
- Bathla, S.; Mukherjee, M. Issues and options for sustainable development of water resource and use in India. Soc. Chang. 2001, 31, 61–74. [Google Scholar] [CrossRef]


| Number | Evaluation Indicators | Unit | Calculation Formula | Type of Indicator | Level of Sustainable Use of Water Resources | |||
|---|---|---|---|---|---|---|---|---|
| Level Ⅰ | Level Ⅱ | Level Ⅲ | Level Ⅳ | |||||
| X1 | Water production modulus | Million m3·km−2 | Statistics | + | ≥60 | 45 | 30 | ≤15 |
| X2 | Total water resources | Billion m3 | Statistics | + | ≥5 | 20 | 30 | ≤45 |
| X3 | Groundwater resources | Billion m3 | Statistics | + | ≥2 | 4 | 6 | ≤8 |
| X4 | Annual precipitation | Billion m3 | Statistics | + | ≥15 | 35 | 55 | ≤75 |
| X5 | Water supply modulus | Million m3/km2 | Water supply/Land area | − | ≤6 | 10 | 25 | ≥35 |
| X6 | Combined water consumption per capita | m3/per | Total water consumption/Total population | − | ≤200 | 500 | 1000 | ≥2000 |
| X7 | Residential water consumption | Billion m3 | Statistics | − | ≤0.05 | 0.5 | 1 | ≥2 |
| X8 | Population density | People/km2 | Statistics | − | ≤150 | 300 | 500 | ≥800 |
| X9 | Natural population growth rate | ‰ | Statistics | − | ≤0 | 3 | 5 | ≥7 |
| X10 | Urbanization rate | % | Urban population/Total population | − | ≤20 | 40 | 50 | ≥60 |
| X11 | GDP per capita | USD | Regional GDP/Total population | + | ≥1400 | 4200 | 7000 | ≤11,200 |
| X12 | Water consumption of USD 10,000 GDP | m3/Million USD | Total water consumption/Regional GDP | − | ≤710 | 2140 | 3570 | ≥5000 |
| X13 | Water consumption of USD 10,000 of industrial added value | m3/Million | Industrial water consumption/Industrial added value | − | ≤180 | 360 | 540 | ≥1070 |
| X14 | Water consumption for agricultural irrigation | Billion m3 | Statistics | − | ≤2 | 5 | 7 | ≥10 |
| X15 | Water use rate for agricultural irrigation | % | Water consumption for agricultural irrigation/Total water consumption | − | ≤30 | 50 | 70 | ≥90 |
| X16 | Industrial water rate | % | Industrial water consumption/Total water consumption | − | ≤1 | 8 | 15 | ≥25 |
| X17 | The proportion of tertiary industry | % | Tertiary industry value/Regional GDP | + | ≥35 | 50 | 60 | ≤75 |
| X18 | Ecological water use rate | % | Ecological water consumption/Total water consumption | + | ≥0.1 | 1 | 3 | ≤4 |
| District (County) | Zhu Cheng | Acheng | Hulan | Shuang Cheng | Wu Chang | Shang Zhi | Binxian | Yan Shou | Bayan | Mulan | Tonghe | Yilan | |
|---|---|---|---|---|---|---|---|---|---|---|---|---|---|
| Level Eigenvalue | 2014 | 2.315 | 1.503 | 1.880 | 1.469 | 2.103 | 2.057 | 1.388 | 2.094 | 1.476 | 2.106 | 2.206 | 1.859 |
| 2015 | 1.770 | 1.275 | 1.455 | 1.651 | 1.757 | 1.603 | 1.202 | 1.778 | 1.348 | 1.869 | 1.867 | 1.457 | |
| 2016 | 2.380 | 1.701 | 1.640 | 1.604 | 2.360 | 2.114 | 1.579 | 2.299 | 1.634 | 2.313 | 2.520 | 2.004 | |
| 2017 | 1.843 | 1.305 | 1.234 | 1.243 | 1.744 | 1.554 | 1.211 | 1.772 | 1.244 | 1.789 | 1.882 | 1.496 | |
| 2018 | 2.440 | 1.726 | 1.605 | 1.627 | 2.279 | 2.119 | 1.615 | 2.200 | 1.470 | 2.159 | 2.311 | 1.843 | |
| 2019 | 2.517 | 1.735 | 1.558 | 1.564 | 2.333 | 2.131 | 1.648 | 2.220 | 1.555 | 2.244 | 2.432 | 1.913 | |
| 2020 | 2.259 | 1.584 | 1.439 | 1.442 | 2.272 | 1.972 | 1.470 | 2.114 | 1.439 | 2.104 | 2.274 | 1.758 | |
| 2021 | 2.547 | 1.751 | 1.616 | 1.518 | 2.312 | 1.982 | 1.820 | 2.214 | 1.533 | 2.373 | 2.338 | 1.851 | |
| Ranking | 2014 | 13 | 4 | 6 | 2 | 9 | 7 | 1 | 8 | 3 | 10 | 12 | 5 |
| 2015 | 9 | 2 | 4 | 7 | 8 | 6 | 1 | 10 | 3 | 13 | 12 | 5 | |
| 2016 | 12 | 5 | 4 | 2 | 11 | 7 | 1 | 8 | 3 | 9 | 13 | 6 | |
| 2017 | 12 | 5 | 2 | 3 | 8 | 7 | 1 | 9 | 4 | 10 | 13 | 6 | |
| 2018 | 13 | 5 | 2 | 4 | 11 | 7 | 3 | 10 | 1 | 9 | 12 | 6 | |
| 2019 | 13 | 5 | 2 | 3 | 11 | 7 | 4 | 9 | 1 | 10 | 12 | 6 | |
| 2020 | 11 | 5 | 1 | 3 | 12 | 7 | 4 | 10 | 2 | 9 | 13 | 6 | |
| 2021 | 13 | 4 | 3 | 1 | 10 | 7 | 5 | 8 | 2 | 12 | 11 | 6 | |
Disclaimer/Publisher’s Note: The statements, opinions and data contained in all publications are solely those of the individual author(s) and contributor(s) and not of MDPI and/or the editor(s). MDPI and/or the editor(s) disclaim responsibility for any injury to people or property resulting from any ideas, methods, instructions or products referred to in the content. |
© 2023 by the authors. Licensee MDPI, Basel, Switzerland. This article is an open access article distributed under the terms and conditions of the Creative Commons Attribution (CC BY) license (https://creativecommons.org/licenses/by/4.0/).
Share and Cite
Tian, X.; Jiang, N.; Jin, C.; Nie, T.; Gao, Y.; Meng, F. Analysis of Spatial and Temporal Variation in Sustainable Water Resources and Their Use Based on Improved Combination Weights. Water 2023, 15, 2752. https://doi.org/10.3390/w15152752
Tian X, Jiang N, Jin C, Nie T, Gao Y, Meng F. Analysis of Spatial and Temporal Variation in Sustainable Water Resources and Their Use Based on Improved Combination Weights. Water. 2023; 15(15):2752. https://doi.org/10.3390/w15152752
Chicago/Turabian StyleTian, Xiaoran, Ning Jiang, Chaojie Jin, Tangzhe Nie, Yu Gao, and Fanxiang Meng. 2023. "Analysis of Spatial and Temporal Variation in Sustainable Water Resources and Their Use Based on Improved Combination Weights" Water 15, no. 15: 2752. https://doi.org/10.3390/w15152752