
Experimental Research on Backward Erosion Piping Progression

Faculty of Civil Engineering, Brno University of Technology, Veveri 95, 602 00 Brno, Czech Republic
*
Author to whom correspondence should be addressed.
Water 2023, 15(15), 2749; https://doi.org/10.3390/w15152749
Submission received: 16 June 2023
/
Revised: 26 July 2023
/
Accepted: 27 July 2023
/
Published: 29 July 2023
(This article belongs to the Topic Natural Hazards and Disaster Risks Reduction)
Abstract
:Internal erosion is caused by seepage body forces acting on the soil particles. One of the most dangerous modes of internal erosion at hydraulic structures is backward erosion piping, which usually initiates at the downstream end of a seepage path, e.g., at the downstream toe of the dam. The progress of backward erosion and the development of erosion pipes were tested in a newly developed laboratory device for three types of sand with grain sizes of 0/2, 0.25/2, and 0.25/1. The piezometric head along the gradually developing seepage “pipe” was observed by seventeen piezometers and seven pressure sensors. The seepage amount was measured by the volumetric method. The critical hydraulic gradient was determined and related to the soil porosity. The progression of the seepage path and relevant characteristics such as the piezometric and pressure heads and the amount of trapped sediment were observed by two synchronous cameras. Based on the analysis of the results of 42 tests, a new empirical formula for the backward erosion rate was proposed. The characteristics of lateral erosion were evaluated and compared with the available literature, which provided reasonably good agreement.
1. Introduction
A large number (about 46%) of incidents and failures of hydraulic structures may be attributed to internal erosion [1,2]. This failure mode concerns both embankment structures and the foundation of hydraulic schemes. The European Working Group on Internal Erosion (EWGIE) was set up in 1993, and its work continues to this day. Until now, the internal erosion problems have been discussed at 23 workshops [3], where experimental research, numerical modeling, and case histories have been presented.
One of the most dangerous types of soil instability is backward erosion piping (BEP), which initiates at the downstream toe of the scheme or downstream face of an internal section such as a dam core. It starts with an erosion “pipe” developing below the “roof”, i.e., a layer composed of a plastic cohesive soil or of the concrete foundation of the hydraulic structure. The “pipe” may proceed backwards to the upstream side of the hydraulic structure, and in its final stage, it can burst through upstream into the reservoir. At the same time, its diameter is increasing due to lateral erosion. It occurs mainly in loose soils such as sands at places where the soil loses its stability due to seepage forces and soil grains are transported downstream by the seepage flow entering the “pipe”. The particle detachment occurs basically at the upstream tip of a privileged flow path, where the pressure gradients are the greatest. Therefore, the mechanisms related to the development of seepage paths have been studied by numerous researchers [4,5].
In the study of BEP, the process may be divided into two simultaneous phenomena, namely backward and lateral erosion. Backward erosion proceeds in the upstream direction due to instability and detachment of soil particles at the erosion “pipe” tip, which causes an elongation of the erosion “pipe”. Until now, there has been a lack of experimental and reliable field data on the backward erosion progression and rate related to various configurations and eroded materials.
Lateral erosion results in an increase in the “pipe” diameter due to instability and erosion of the soil along the pipe walls [6,7,8]. The particle detachment occurs to a limited extent during the development of the “pipe”, but more extensive lateral erosion proceeds after the development of the continuous pipe connecting the upstream reservoir with the downstream toe of the dam. For the investigation of lateral erosion and the quantification of erodibility characteristics (critical shear stress, coefficient of soil erosion), experimental methods such as hole erosion tests, slot erosion tests, and others were developed. However, the research focused mostly on cohesive soils with relatively slow enlargement of the erosion pipe (Wan and Fell 2002).
In the past, the criteria for global stability related to internal erosion were expressed via the mean critical hydraulic gradient derived from an analysis of existing dams [9,10,11,12,13]. Some of these criteria have been applied until now.
During the last decades, the BEP has been analyzed within experimental laboratory research and using numerical methods. In this way, valuable data have been provided for the validation and calibration of computer models. Well known is the extensive research, counting more than 70 BEP tests, carried out at the Deltares Hydro Facilities and Geotechnical Laboratory in Delft [14,15,16].
The results of 37 piping experiments performed at the University of Florida from 1981 to 1995 were summarized by Schmertmann [17]. These experiments were performed on the sand bed covered by “overburden” with a seepage length of 1524 mm and a cross section of 305 × 305 mm. An artificial pipe was created on the upper side below the overburden; its length measured between 152 and 762 mm.
Small-scale, two-dimensional experiments with two soils were carried out by Van Beek et al. [18] to test the effect of lateral heterogeneity on the pipe’s development. The length of the sand box was about 380 mm. Homogeneous samples provided that the pipe developed in the upstream direction without reaching equilibrium in pipe formation. In the heterogeneous samples, a pipe formed from the downstream edge in the fine sand and stopped at the interface between soils with coarser gradation.
The tests on uniform sands were systematically analyzed by van Beek et al. [19]. An extensive summary of BEP research completed by the author’s own research is compiled in the PhD thesis of Van Beek [20] and in the papers published by Robbins and van Beek [21] and Rice et al. [22].
The U.S. Army Corps of Engineers has performed a wide range of laboratory-scale experiments on BEP carried out on various fine-grained cohesionless materials [23,24] and extended the study to fine gravels [25]. These experiments were focused on the determination of the critical hydraulic gradient. A novel laboratory test has been developed to study local hydraulic characteristics, including pore pressures in the soil and eroded pipe [26]. The rate of BEP was simulated in a small-scale flume where nine uniform sands were analyzed [27]. The temporal progression of BEP was also studied via a small-scale model by Pol et al. [28].
Sellmeijer [29] developed a method for the estimation of the effect of BEP by computing the critical piezometric head in the subbase of a levee based on the experimental data obtained by de Wit et al. [14]. The model was calibrated by Silvis (1991) and adopted for designing levees in the Netherlands. During the following years, the model was improved by Weijers and Sellmeijer [16] and Sellmeijer et al. [13]. The experimental data obtained may be employed in the validation of more advanced numerical models [30,31].
Nevertheless, numerical models still frequently fail due to the complexity of the factors involved, including the general randomness of the phenomena and different geomechanical and seepage properties.
As mentioned above, there is still a deficiency of experimental research and field investigation providing enough data on the backward erosion piping phenomenon. In order to at least partially fill the knowledge gap and to provide more experimental data on BEP initiation and progression, a small-scale experimental device was proposed, constructed, and tested [32]. A set of BEP tests were performed to identify the dependence between the mean and local hydraulic gradients and their relation to soil porosity. The experimental research aimed to find out the principal dependencies between soil characteristics, hydraulic conditions, and BEP erosion rate, verify the proposed methodology of the testing, and discuss related uncertainties in the results obtained. Based on the obtained data, the authors derived a simple formula for the estimation of the backward erosion rate. Characteristics for lateral erosion were also derived and compared with the available literature.
2. Materials and Methods
2.1. Rationale
Previous research indicates that the erosion “pipe” initiates and develops due to soil instability at its upstream tip. At this place, due to the concentration of seepage flow, the pressure and hydraulic gradients reach their maximum values. The backward erosion proceeds upstream due to the local detachment of soil particles close to the “pipe” tip [20,33].
Robbins et al. [27] indicate that the rate of tip advancement depends on the hydraulic gradient, grain size, and void ratio of the soil. The local geometry at the “pipe” tip and the shear strength characteristics of the soil are functions of the soil compaction (void ratio, porosity) and the grain size and shape. As these may be regarded as independent of the scale, a scaled model may be employed for a credible description of the process for a given soil. The pressure and hydraulic gradient are the most important parameters characterizing the “body load”. Therefore, the experimental device was designed in such a way to enable identification of the development over time of the piezometric head. As the rapid progression of backward erosion during its progression phase was expected, the pressure measurements had to be taken continuously in the course of the tests.
2.2. Experimental Device
The testing apparatus was described in more detail by Petrula and Říha [32]. The apparatus had a square cross section with dimensions of 120 × 120 mm and a length of 350 mm. An approx. 70 mm thick gravel layer was placed at the inlet section to homogenize the inflow into the sample. The gravel was separated from the tested sand material by the fine screen. Water seeping through the sample together with eroded material entered through a hole created in the upper edge of the downstream front wall of the box and flowed to a sedimentation cone. From the downstream side, a predefined opening with a diameter of 12 mm was holed below the top cover of the box to preclude the random development of an erosion pipe, as was evidenced by Van Beek [20]. The diameter of the pipe varied from 12 mm to 30 mm according to material type and sample compaction. 17 piezometers were installed in the top cover of the device along the predefined “pipe” and the expected path of its progression. The piezometers were attached to the vertical board mounted behind the box to enable comfortable readings of hydraulic heads during the tests. Seven of these piezometers were equipped with pressure cells to automate the recording of pressure during the tests (Figure 1). Automatic sensing and recording of the water pressure in the sand sample was necessary, namely towards the end of the test when soil erosion proceeded very fast. The apparatus was linked to a movable tank, which allowed variations in the upstream piezometric head (boundary condition). The downstream boundary condition was fixed by the level of the outlet hole in the downstream front wall of the box. Two cameras installed above and on the side of the device were continuously recording the BEP process. The overall photograph of the testing device can be seen in Figure 1.
2.3. Experimental Research
The testing procedure is described in a previous paper by Petrula and Říha [32]. Three types of uniform sand taken from a local quarry were tested. The grain size characteristics are shown in Table 1, along with the number of tests. To obtain better statistics on behavior and more data indicating dependencies, the sand with a grain size of 0/2 mm was subjected to more extensive testing, amounting to 26 tests, while the artificially prepared sands (0.25/2 mm and 0.25/1 mm) were tested only 8 times each. In total, 42 experiments were performed on the sands mentioned. The extent of the time-consuming testing was limited by the capabilities of the Laboratory of Hydraulic Research and the schedule of the research project.
The preparatory work started with the filling of the box with sandy material. The filling was carried out in a vertically arranged box with variable compaction time (0 to 60 s) in order to achieve variable sample porosity (Table 1). After placing the upstream gravel layer with the screen and mounting the upstream front wall, the length of the sand sample was measured to determine the porosity and bulk density of the sample. Then the box was turned to the horizontal position, the “predefined” seepage pipe was formed, and the box was connected to the water inlet and to piezometers and pressure sensors. Finally, the sample was slowly saturated with water.
The porosity of the prepared samples varied due to the random compacting factor. This allowed the influence of porosity values on critical hydraulic gradients and the erosion rate to be investigated. It can be seen from Table 1 that the less uniform sand provided a wider range of sample porosity.
After saturation, the soil sample was gradually subjected to seepage with a stepwise raising upstream of a vertically movable tank attached to the testing apparatus [32]. Each time the tank was raised, hydraulic conditions in the sample took approximately 15 min to stabilize. In the initial phase, erosion did not occur. Random detachment of single particles was not considered to be the beginning of erosion. These individual grains were detached from the sample during the process of predefining the pipe. During this phase, data on the piezometric heads and local hydraulic gradients along the sample were recorded and evaluated. The outflow discharge was measured volumetrically. At a certain upstream piezometric head, governed by the vertical position of the tank, erosion of the sand initiates at the pipe tip. At this instant, both local and mean critical hydraulic gradients were recorded.
Increases in pipe length and dimensions were recorded by the camera. During the erosion, which became quite rapid during the final phase, pressure measurements were performed automatically along the developing erosion pipe using pressure cells. The sediment was captured in a sedimentation cone, and the volume of sediment was continuously monitored by a side camera. The eroded volume material was then dried and weighted, and the resulting values were then compared with pipe volumes to verify the experiment’s validity.
3. Results and Discussion
The analysis of the results focuses on the critical hydraulic gradient and both the backward and lateral erosion rates.
3.1. Critical Hydraulic Gradient
The basic observed parameters were the local critical hydraulic gradient Jc at the “pipe” tip and the mean critical hydraulic gradient Jc,mena in the sample, corresponding to the distance between the “pipe” tip and the point of entry of water to the sand sample. It is obvious that both the local and mean critical gradients relate to the shortest seepage path between the upstream edge of the sample and the pipe tip, where piezometric heads were observed.
When both the local and mean critical gradients were correlated with the sample porosity, it was observed that with increasing porosity, the critical hydraulic gradient considerably decreased (Figure 2 and Figure 3). This states that the less compacted the samples were, the less resistance there was to soil erosion initiation. This qualitative behavior is consistent with the results of previous research [23,25,26]. For the 0/2 mm sand within the porosity range n ∈ (0.286; 0.381), the best fit indicated the following relationship:
Equation (1) will be used. The scatter in the obtained values is due to various factors, including the inherent uncertainty of the phenomenon, inaccuracies in the piezometric head readings (single percents), and the measurement of soil sample length. For the 26 tests for 0/2 mm sand, the standard deviation based on Equation (1) was determined as follows:
In Equations (1) and (2), n is the porosity of the sample, Jc,mean is the mean critical hydraulic gradient obtained from the measurements, is the critical hydraulic gradient determined using Equation (1), s is the standard deviation, and N is the number of tests.
Even if the local body force due to seepage acting on the soil at the “pipe” tip is represented by the local hydraulic gradient, in practical assessment, the mean hydraulic gradient is frequently used as a hydraulic criterion for particle detachment and internal erosion initiation [9,10,11,12,13]. Quantifying the proportion between local and mean hydraulic gradients is therefore of considerable interest. The comparison shows a linear relation between local and mean hydraulic gradients (Figure 4). The local gradients at the tip of the pipe are about 2.4 times higher than the mean gradients in the soil sample. It is obvious that the thus measured local hydraulic gradients are still “average” values coming from the piezometers adjacent to the pipe tip. In this research, “local” gradients were determined from the distance of 20 mm between two neighboring piezometers. It is suggested that the ratio of 2.4 between local and mean gradients is therefore still underestimating true conditions at the pipe tip. Even lower ratios, ranging approximately from 1.4 to 1.8 for the distance of 100 mm between piezometers (pressure cells), are provided in the study published by [26], who carried out their tests in 1.53 m long tubes with internal diameters of 25.4, 76.2, and 152.4 mm.
In Figure 5, the obtained mean critical hydraulic gradients are compared with the results that Robbins et al. [25] obtained from experiments on uniform gravel with grain sizes of d10 = 4.67 mm, d30 = 6.13 mm, d60 = 7.79 mm, and Cu = 1.67. One can see that the mean critical gradient values obtained by Robbins [25] fit the lowest envelope of our values. The study carried out by Robbins et al. [26] on two uniform sands, the first with d10 = 0.227 mm, d30 = 0.268 mm, d60 = 0.322 mm, and Cu = 1.42, and the second with d10 = 0.465 mm, d30 = 0.541 mm, d60 = 0.645 mm, and Cu = 1.38, manifests similar results as the study performed with gravels [25].
Figure 5 shows only minor differences in the magnitude of critical hydraulic gradients for the three tested sands. It seems that sand with a larger uniformity coefficient Cu provides slightly higher resistance in terms of critical hydraulic gradient, though for a more reliable statement, more tests are needed for materials 0.25/1 and 0.25/2.
Advanced efficiency criteria for the dependence in Figure 4 were evaluated. The mean square error (MSE):
where n is the number of measurements, is the measured mean hydraulic gradient, and yi is the predicted value of the local hydraulic gradient using the relation in Figure 4.
The Nash–Sutcliff efficiency coefficient:
where is the mean of the observed value of the mean hydraulic gradient, and the meaning of other variables is the same as in Equation (3).
The values of advanced criteria indicate good predictive ability of the relation in Figure 4.
Comparisons were made with experimental results and predictions by Sellmeijer et al. [13]. It was found that, as with the findings of Robbins et al. [25], Sellmeijer’s values rather overestimated the mean critical hydraulic gradients, except in the case of 2 mm glass beads (Figure 6). However, the comparisons obtained from experiments performed with beads are not relevant due to the “absolute” uniformity and regular shape of glass beads and their smooth surface.
3.2. Soil Erosion
During each experiment, the progression of soil erosion was observed and evaluated (Figure 7). Backward erosion was separated from lateral erosion for further analysis. The soil volume transported from the pipe tip was attributed to backward erosion, while the volume corresponding to pipe widening was assigned to lateral erosion (Figure 8).
The backward erosion rate at the pipe tip was derived from the records from each experiment. As expected, the rate of backward erosion increased with the shortening of the seepage length. The velocity of BEP progression was up to tens of mm/s.
Based on the recorded pipe shape, for each time interval Δti the volume changes and mass Mi of the eroded soil were calculated both for backward erosion and lateral erosion. Given the known eroded mass and pipe-wetted surface for two consecutive time instants, the rates of backward erosion and lateral erosion were calculated using the following formulae:
where is the erosion rate at the ith time interval Δti = tj+1 – tj, AB,I is the mean area of the cross section at the pipe tip corresponding to the time interval Δti, and AL,i denotes the corresponding wetted surface (Figure 8).
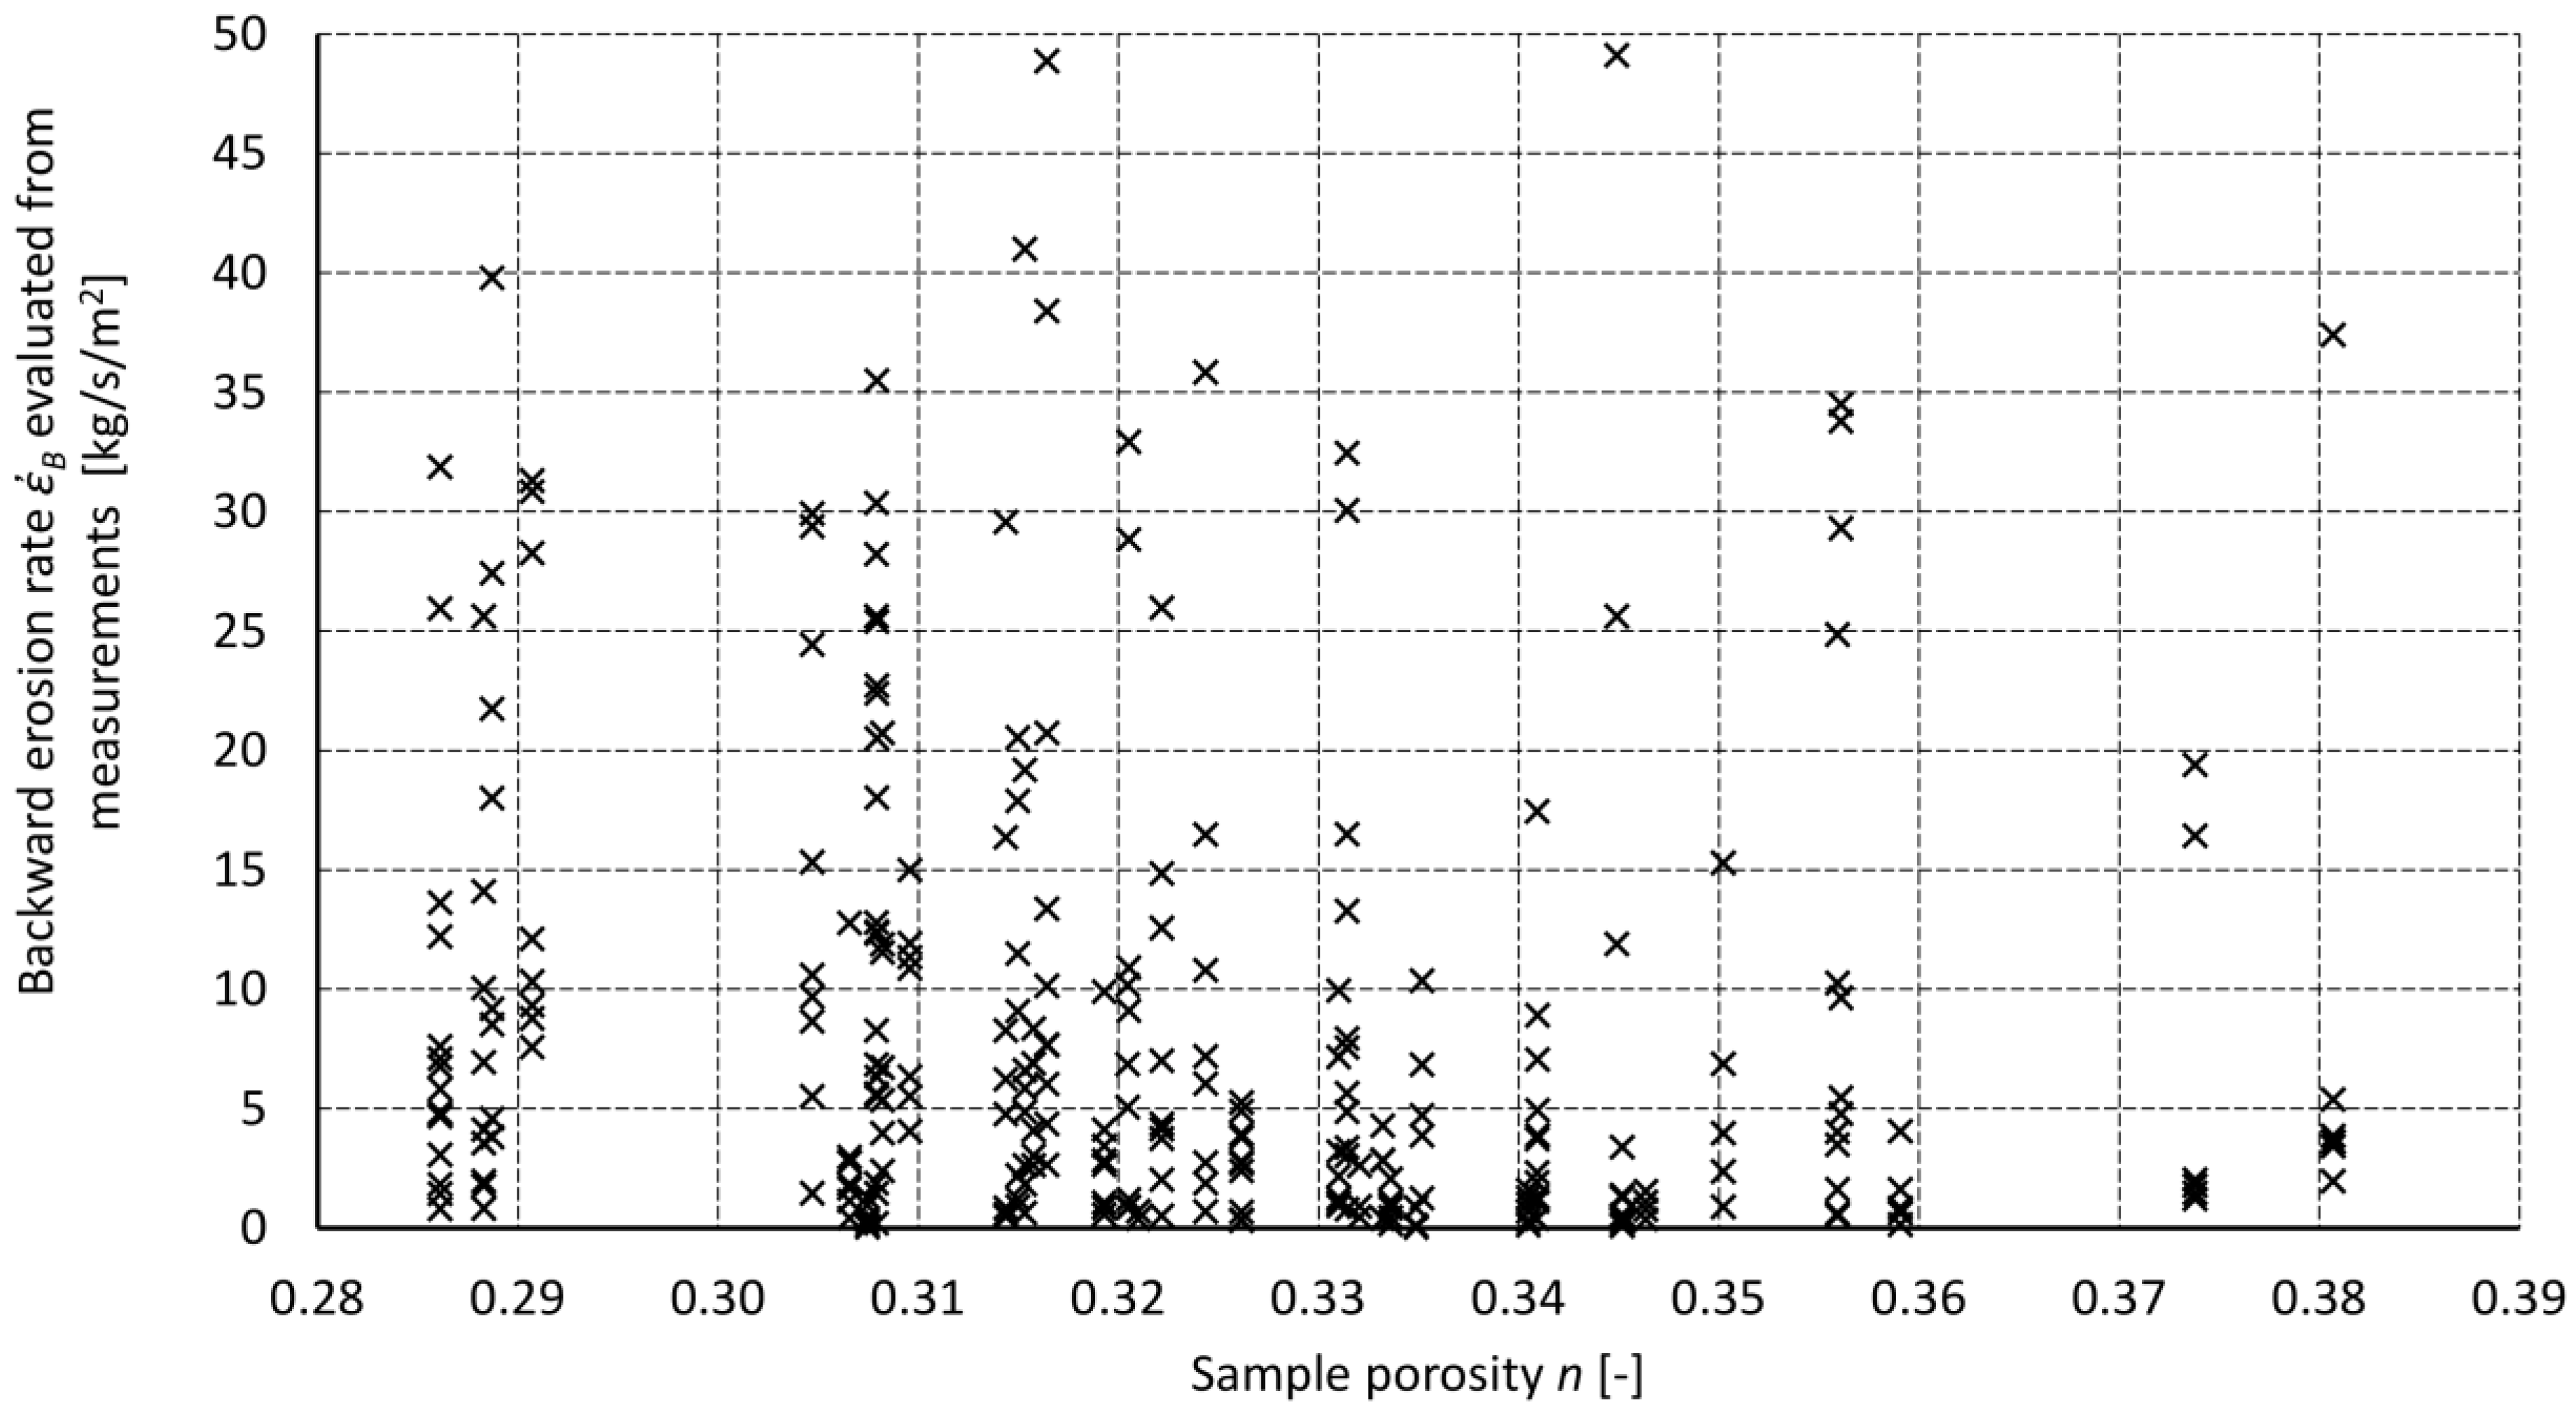
Backward erosion rates ranged from almost zero at the very beginning of the tests up to almost 50 kg/s/m2 at the instant just before the pipe tip broke at the upstream part of the sample (Figure 9, Figure 10 and Figure 11). Before the erosion pipe fully developed, the lateral erosion rates were very low, ranging from 0.25 to 2 kg/s/m2 for all tested sands. After the erosion pipe had completely developed, lateral erosion rates increased up to 25 to 50 kg/s/m2.
At the same time, it was observed that for materials with higher porosity, the erosion rates were lower due to lower unit mass (the higher the porosity, the smaller the bulk density of the soil).
3.2.1. Backward Erosion Piping
Based on the data obtained from the experiments, the relation between backward erosion rate and mean critical gradient Jc,mean, soil porosity n, and mean grain size d50 was analyzed. A summary of all calculated erosion rates, sorted according to the experiments from which they were obtained, was used to derive the relationships and functional dependencies of individual variables. Using the least squares method, the shapes of functional dependencies were derived; the criterion for the selection of the relation was the coefficient of determination R2. The following conditions were applied when constructing the final relationship determined by the least squares approximation:
- -
- increases exponentially with increasing Jc,mean (Figure 9);
- -
- decreases with increasing n for most of the measured data (Figure 10);
- -
- decreases with increasing d50, according to Figure 11, and according to the theory that with increasing grain size, larger forces must be in action to cause erosion.
Based on the trend analysis for the mean hydraulic gradient, an exponential relation was chosen for the porosity, and for grain size, a linear dependence was used. The beginning of the BEP was expressed by introducing the mean critical hydraulic gradient calculated from Equation (1). The final formula for determination holds:
where is the backward erosion rate [kg/s/m2], d50 is the grain size corresponding to 50% passing [mm], Jmean is the mean hydraulic gradient during the BEP, Jc,mean is the critical mean gradient from Equation (1) [-], and n is porosity.
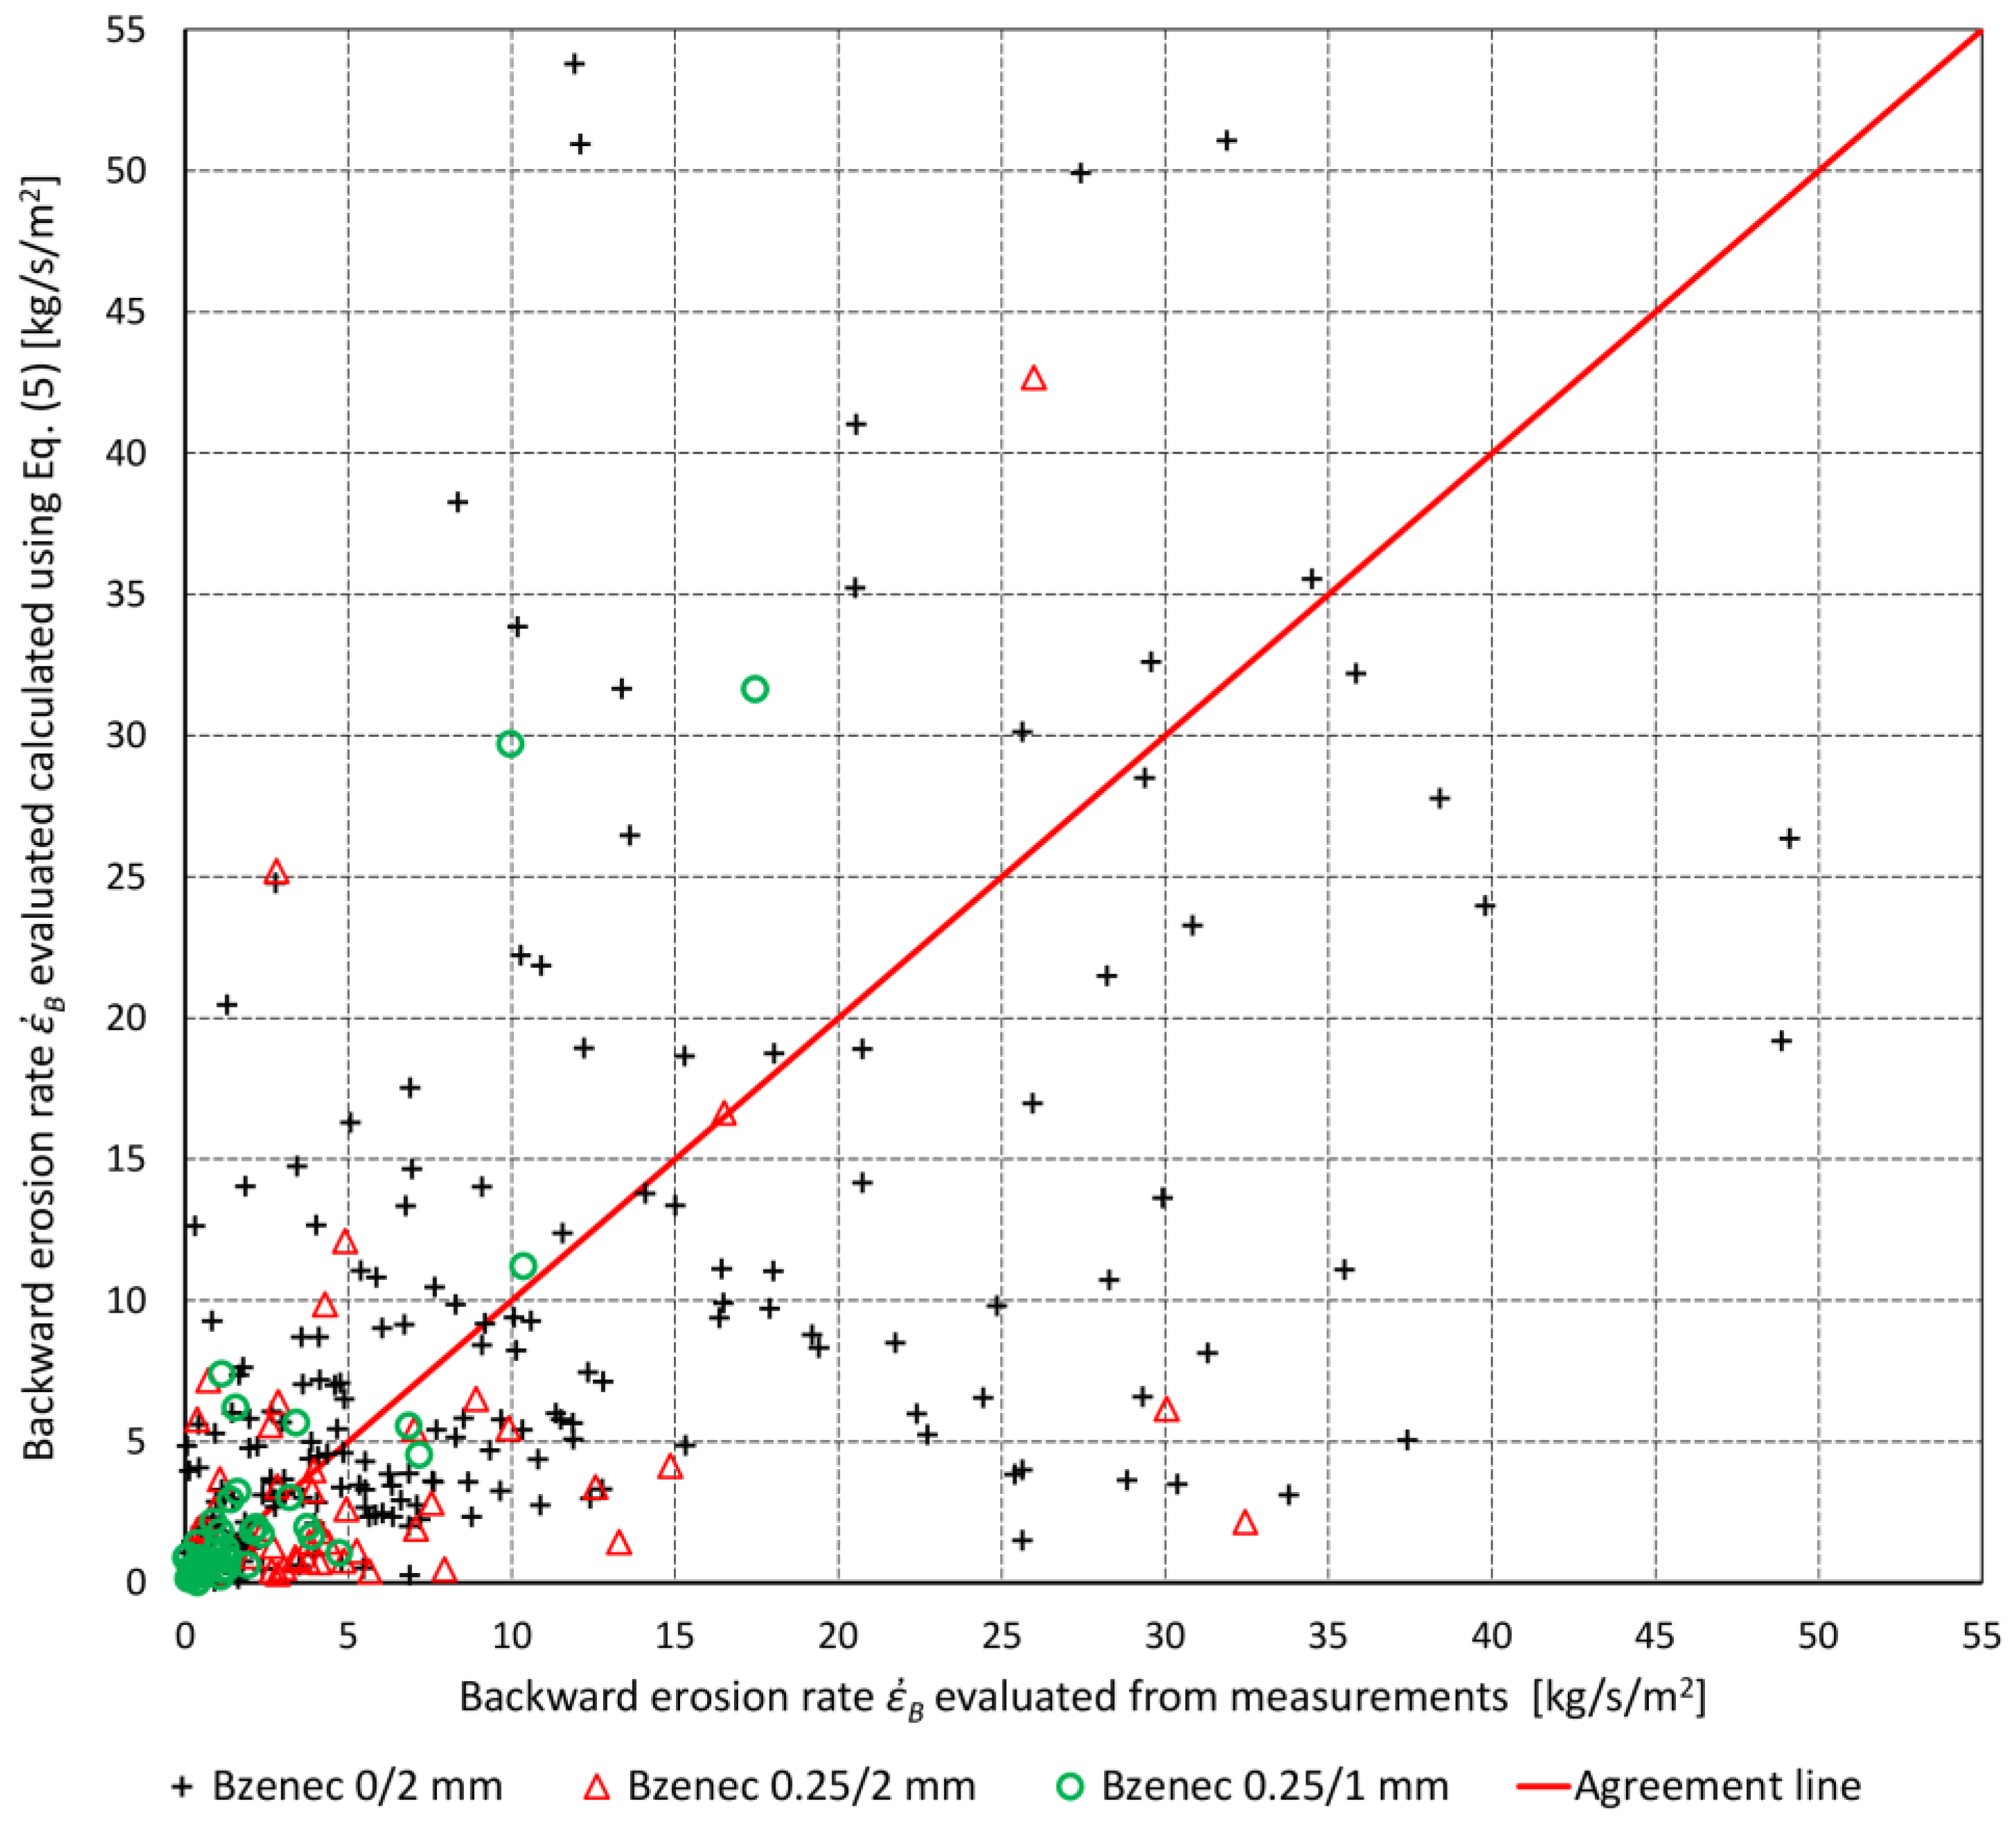
Equation (5) holds for uniform soils (uniformity coefficient Cu ≤ 3 with d50 ≤ 0.35 mm). The constant 0.476 represents the maximum porosity of loose spheres with Cu = 1. Other constants were determined using the weighted least squares method:
where Sq is the sum of squared residuals, w is the number of experimentally determined values, is the backward erosion rate from experiments, and denotes the backward erosion rates calculated using Equation (7). A comparison of experimental and calculated values is shown in Figure 12 and Figure 13.
From Figure 9, Figure 10, Figure 11, Figure 12 and Figure 13, it can be seen that the scatter of obtained values is large, resulting in small values of R2. This is caused by the random nature of the soil erosion and additionally by uncertainties arising during the evaluation of experimental BEP rates, i.e., the reading of the erosion pipe dimensions from the video logs, the estimation of the pipe “depth” from its final depth at the end of the test, and errors in the time step due to the high speed of the erosion at the end of the test. Moreover, some soil characteristics were not taken into account, such as grain shape and the roughness or uniformity of the sand (in a very narrow range). Figure 11 indicates that, relatively speaking, better agreement is achieved in the range of 0 to 5 kg/s/m2.
3.2.2. Lateral Erosion
As the erosion pipe widened during the tests, the characteristics of lateral erosion during the BEP were evaluated using a methodology similar to that used by Wan and Fell (2004) [7], who expressed the lateral erosion rate as follows:
where Ce is the coefficient of soil erosion, τ is the shear stress along the erosion pipe, and τC is the critical shear stress.
The critical shear stress and coefficient of soil erosion were derived from the experimental data. The critical shear stress was determined using values read at the instant of the incipient movement of particles along the pipe wall using the formula:
where ρ is water density, g is acceleration due to gravity, R is the hydraulic radius related to the erosion pipe (semicircle) with the diameter D when neglecting the effect of the smooth plexiglass surface (R ≈ D/4), and J is the hydraulic gradient in the pipe at the instant of incipient particle movement. In Figure 14, the dependence of critical shear stress on sample porosity is depicted. The critical shear stress drops with increasing porosity and increases with increasing sand uniformity. The obtained values fit the critical shear stress τC < 6.4 Pa obtained by Wan and Fell [7] for loose soils (USCS Classification SM) well.
The derived coefficients of soil erosion do not show any analytical dependence on sample porosity (Figure 15). However, the values of Ce in the range from 0.022 to 1.7 (with 80% of values being less than 0.4) correspond to the range obtained by Wan and Fell (2004) [7] for loose soils (Ce from 0.02 to 0.25).
4. Conclusions
In the paper, the results of experimental research on backward erosion piping through uniform sand with grain sizes of 0/2, 0.25/2, and 0.25/1 mm are presented. Critical hydraulic gradients were also investigated for glass beads with diameters of 0.2 and 0.5 mm. The small-scale measuring device and measurement methodology used were proposed in a previous study [32].
The comparison of local hydraulic gradients at the pipe tip with mean hydraulic gradients shows that in the case of this study, the local gradients are about 2.4 times higher than the mean ones. Analysis of both local and mean hydraulic gradients indicated an approximately linear relation to the sample porosity. The mean hydraulic gradients range from 0.5 to 1.8 depending on sample compaction (porosity), which in some cases exceeds values published in previous studies [26], though the gradients from previous studies were derived for rather higher porosities.
The rates of backward and lateral erosion were derived from experiments. The formula Equation (5) for the estimation of backward erosion rate was derived to be applied to uniform sand (uniformity coefficient Cu ≤ 3) with the mean grain size d50 ≤ 0.35 mm.
The characteristics of lateral erosion, namely the critical shear stress and coefficient of soil erosion, comply with values derived by Wan and Fell (2004) [7].
The obtained results, namely predicted erodibilities, suffer from a considerably wide scatter. The scatter may also be observed in the results of internal erosion studies [20,34], namely concerning critical shear stress, erodibility, slope angle at slope-type experiments, critical hydraulic gradient, etc. The wide scatter may be attributed to the randomness of the soil erosion phenomenon and to uncertainties and inaccuracies in the evaluation of experimental erosion rates (reading of the erosion pipe dimensions from the video logs, determination of the pipe “depth”, and time step errors in the case of very fast erosion). During some tests, backward erosion temporarily stopped, which resulted in an almost zero erosion rate during the corresponding time interval. After that, erosion reinitiated, sometimes with more intensive particle detachment, which resulted in an extremely high erosion rate. Related inaccuracies in input and measured variables are shown in Table 2.
Some of these imperfections may be eliminated by using a longer experimental device adapted to a longer sample and by using laser equipment for measuring pipe depth and cross-sectional area. Further research will focus on testing more soil types with more variable properties (e.g., grain size) with the aim of verifying the proposed formulas for less uniform sands with a larger grain size. Glass beads are not suitable for such experiments due to their smooth surface and spherical shape. The resulting formulae will be tested using the BEP tests performed by other authors and field data from real dam failures. The verification will need further extensive data sets from the experimental research and from backward analysis of true incidents and accidents.
Author Contributions
Conceptualization, methodology and data curation: Lubomir Petrula; formal analysis, investigation, resources, writing—original draft preparation, supervision, project administration, funding acquisition: Jaromir Riha. All authors have read and agreed to the published version of the manuscript.
Funding
This research received no external funding.
Data Availability Statement
The research data can be requested primarily via e-mail communication directly from manuscript authors. It is up to authors to consider and to accept the request.
Acknowledgments
This study is part of the project TH04030087, tools for optimization of the levee system management and is also part of the project FAST-S-23-8233. Sensitivity analysis of selected input parameters in water flow numerical modeling.
Conflicts of Interest
The authors declare no conflict of interest.
References
- Saxena, K.R.; Sharma, V.M. Dams: Incidents and Accidents; A. A. Balkema Publishers: New Delhi, India, 2005; 228p. [Google Scholar]
- Bulletin 164: Internal Erosion of Existing Dams, Levees and Dikes, and Their Foundations; Internal Erosion Processes and Engineering Assessment; ICIL Bulletin: Paris, France, 2015; Volume 1, 342p.
- EWGIE. European Working Group on Internal Erosion in Embankment Dams, Dikes and Levees & Their Foundations. 2023. Available online: https://www6.inrae.fr/eucold-ewgie-ewgooe/History/EWGIE (accessed on 12 July 2023).
- Fell, R.; Fry, J.J. Internal Erosion of Dams and Their Foundations; Taylor & Francis: New York, NY, USA, 2005; 245p. [Google Scholar]
- Bonelli, S. (Ed.) Erosion in Geomechanics Applied to Dams and Levees; ISTE Ltd.: London, UK; John Wiley & Sons, Inc.: Hoboken, NJ, USA,, 2013; 388p. [Google Scholar]
- Fell, R.; Wan, C.F.; Cyganiewicz, J.; Foster, M. Time for Development of Internal Erosion and Piping in Embankment Dams. J. Geotech. Geoenvironmental Eng. 2003, 129, 307–314. [Google Scholar] [CrossRef]
- Wan, C.F.; Fell, R. Laboratory Tests on the Rate of Piping Erosion of Soils in Embankment Dams. Geotech. Test. J. 2004, 27, 295–303. [Google Scholar]
- Benahmed, N.; Bonelli, S. Investigating concentrated leak erosion behaviour of cohesive soils by performing hole erosion tests. Eur. J. Environ. Civ. Eng. 2012, 16, 43–58. [Google Scholar] [CrossRef]
- Bligh, W.G. Dams Barrages and Weirs on Porous Foundations. Eng. News 1910, 64, 708–710. [Google Scholar]
- Lane, E.W. Security from Under-Seepage Masonry Dams on Earth Foundations. Trans. Am. Soc. Civ. Eng. 1935, 100, 1235–1272. [Google Scholar] [CrossRef]
- Chugayev, R.R. The Subsurface Shape of Hydraulic Structures; ENERGIA: Leningrad, Russia, 1974; 237p. (In Russian) [Google Scholar]
- Chugayev, R.R. Hydraulic Structures; AGROPROMIZDAT: Moscow, Russia, 1985; 237p. (In Russian) [Google Scholar]
- Sellmeijer, H.; De La Cruz, J.L.; Van Beek, V.; Knoeff, H. Fine-tuning of the backward erosion piping model through small-scale, medium-scale and IJkdijk experiments. Eur. J. Environ. Civ. Eng. 2011, 15, 1139–1154. [Google Scholar] [CrossRef]
- De WIT, G.N.; Sellmeijer, J.B.; Penning, A. Laboratory tests on piping. In Proceedings of the 10th International Conference Soil Mechanics and Foundation Engineering, Stockholm, Sweden, 15–19 June 1981; Balkema: Rotterdam, The Netherlands, 1981; pp. 517–520. [Google Scholar]
- Silvis, F. Verificatie Piping Model; Proeven in de Deltagoot. Eval. Rapp. Grondmechanica Delft CO 317710/7 1991. [Google Scholar]
- Weijers, J.B.A.; Sellmeijer, J.B. A new model to deal with the piping mechanism. In Filters in Geotechnical and Hydraulic Engineering; Brauns, J., Heibaum, M., Schuler, U., Eds.; Balkema: Rotterdam, The Netherlands, 1993. [Google Scholar]
- Schmertmann, J.H. The non-filter factor of safety against piping through sands. In Judgment and Innovation; Silva, F., Kavazanjian, E., Eds.; ASCE Geotechnical Special Publication: Reston, VA, USA, 2000; Volume 111, pp. 65–132. [Google Scholar]
- Van Beek, V.M.; Koelewijn, A.; Kruse, G.; Sellmeijer, H.; Barends, F. Piping phenomena in heterogeneous sands—Experiments and simulations. In Proceedings of the 4th International Conference on Scour and Erosion, Tokyo, Japan, 5–7 November 2008; pp. 453–459. [Google Scholar]
- Van Beek, V.; Sellmeijer, J.B.; Barends, F.B.J.; Bezuijen, A. Initiation of backward erosion piping in uniform sands. Géotechnique 2014, 64, 927–941. [Google Scholar] [CrossRef] [Green Version]
- Van Beek, V. Backward Erosion Piping: Initiation and Progression. Ph.D. Thesis, Technical University of Delft, Delft, The Netherlands, 2015; 263p. [Google Scholar]
- Robbins, B.A.; Van Beek, V.M. Backward Erosion Piping: A Historical Review and Discussion of Influential Factors. In Proceedings of the ASDO Dam Safety Conference, New Orleans, LA, USA, 13–17 September 2015; 20p. [Google Scholar]
- Rice, J.; Van Beek, V.; Bezuijen, A. History and Future of Backward Erosion Research. In Proceedings of the 10th International Conference on Scour and Erosion, Online, 18–20 October 2021; 23p. [Google Scholar]
- Robbins, B.A.; Sharp, M.K.; Corcoran, M.K. Laboratory Tests for Backwards Piping Erosion. In Geotechnical Safety and Risk V; Schweckendiek, T., van Tol, A.F., Staveren, D.P., van Cools, M.T.P.M.C.B.M., Eds.; IOS Press: Amsterdam, The Netherland, 2015. [Google Scholar] [CrossRef]
- Robbins, B.A.; Montalvo Bartolomei, A.M.; López-Soto, J.; Stephens, I.J. Laboratory Measurements of Critical Gradients of Cohesionless Soils. In Celebrating the Value of Dams and Levees—Yesterday, Today and Tomorrow; Unites States Society on Dams (USSD): Denver, CO, USA, 2016; pp. 927–937. [Google Scholar]
- Robbins, B.A.; Stephens, I.J.; Leavell, D.A.; López-Soto, J.F.; Montalvo-Bartolomei, A.M. Laboratory Piping Tests on Fine Gravel. Can. Geotech. J. 2018, 55, 1552–1563. [Google Scholar] [CrossRef]
- Robbins, B.A.; Van Beek, V.M.; López Soto, J.F.; Montalvo Bartolomei, A.M.; Murphy, J. A novel laboratory test for backward erosion piping. Int. J. Phys. Model. Geotech. 2018, 18, 266–279. [Google Scholar] [CrossRef]
- Robbins, B.A.; Griffiths, D.V.; Montalvo Bartolomei, A.M. Analyses of Backward Erosion Progression Rates from Small-Scale Flume Experiments. J. Geotech. Geoenviron. Eng. 2020, 146, 04020093. [Google Scholar] [CrossRef]
- Pol, J.C.; Kanning, W.; Van Beek, V.M.; Robbins, B.A.; Jonkman, S.N. Temporal evolution of backward erosion piping in small-scale experiments. Acta Geotech. 2022, 17, 4555–4576. [Google Scholar] [CrossRef]
- Sellmeijer, J.B. On the Mechanism of Piping under Impervious Structures. Ph.D. Thesis, Technical University of Delft, Delft, The Netherland, 1988. [Google Scholar]
- Wang, D.; Fu, X.; Jie, Y.; Dong, W. Hu, D. Simulation of pipe progression in a levee foundation with coupled seepage and pipe flow domains. Soils Found. 2014, 54, 974–984. [Google Scholar] [CrossRef]
- Robbins, B.A.; Griffiths, D.V. Modelling of Backward Erosion Piping in Two- and Three- Dimensional Domains. In Internal Erosion in Earthdams, Dikes and Levees: Proceedings of EWG-IE 26th Annual Meeting 2018; Springer Nature: Cham, Switzerland, 2019; pp. 149–158. [Google Scholar]
- Petrula, L.; Říha, J. A new small-scale experimental device for testing backward erosion piping. J. Hydrol. Hydromech. 2022, 70, 376–384. [Google Scholar] [CrossRef]
- Hanses, U. Zur Mechanik der Entwicklung von Erosionskanälen in geschichtetem Untergrund unter Stauanlagen. Ph.D. Thesis, Grundbauinstitut der Technischen Universität Berlin, Berlin, Germany, 1985. [Google Scholar]
- Wan, C.F.; Fell, R. Investigation of Internal Erosion and Piping of Soils in Embankment Dams by the Slot Erosion Test and the Hole Erosion Test—Interpretative Report; The University of South Wales: Cardiff, Wales, 2002; 177p. [Google Scholar]
Figure 1.
The experimental device.

Figure 2.
Local critical hydraulic gradients at the pipe tip in relation to sample porosity for 0/2 mm sand.
Figure 2.
Local critical hydraulic gradients at the pipe tip in relation to sample porosity for 0/2 mm sand.

Figure 3.
Mean critical hydraulic gradients at the pipe tip in relation to sample porosity for 0/2 mm sand.
Figure 3.
Mean critical hydraulic gradients at the pipe tip in relation to sample porosity for 0/2 mm sand.

Figure 4.
Relationship between local and mean critical gradients.

Figure 5.
Mean critical hydraulic gradients in relation to sample porosity.

Figure 6.
Measured mean critical hydraulic gradients compared with the prediction by Sellmeijer et al. [13].
Figure 6.
Measured mean critical hydraulic gradients compared with the prediction by Sellmeijer et al. [13].

Figure 7.
Changes in the pipe shape during BEP—two instants related to Figure 6 are marked by the red color.
Figure 7.
Changes in the pipe shape during BEP—two instants related to Figure 6 are marked by the red color.

Figure 8.
Separation of backward and lateral erosion: tj = 20,309 s; tj+1 = 20,312 s; and Δt = 3 s.

Figure 9.
The dependence between BEP rate and mean hydraulic gradient.

Figure 10.
The dependence between BEP rate and soil porosity.

Figure 11.
The dependence between BEP rate and d50.

Figure 12.
Comparison of experimentally obtained and calculated backward erosion rates.

Figure 13.
Comparison of experimentally obtained and calculated backward erosion rates—detail.

Figure 14.
Critical shear stress related to sample porosity.

Figure 15.
Coefficient of soil erosion related to sample porosity.


Table 1.
Experimental plan—numbers of experiments and sample properties.
| Material Grain Size | Number of Tests | Uniformity Coefficient Cu | Grain Density ρd | Porosity n | |
|---|---|---|---|---|---|
| [-] | [-] | [kg/m3] | [-] | ||
| Min. | Max. | ||||
| 0/2 mm | 26 | 2.98 | 2638 | 0.286 | 0.381 |
| 0.25/2 mm | 8 | 2.08 | 2638 | 0.319 | 0.341 |
| 0.25/1 mm | 8 | 1.84 | 2638 | 0.331 | 0.346 |
Table 2.
Absolute and relative deviations of measured and calculated variables.
| Variable | Measured (M)/ Calculated (C) | Absolute Deviation [-] | Relative Deviation [%] |
|---|---|---|---|
| Cross-sectional dimensions of testing box | M | 0.01 mm | 0.008 |
| Sample length | M | 1 mm | 0.5 |
| Sample weight | M | 0.1 g | 0.004 |
| Grain density | C | 10 kg/m3 | 0.38 |
| Sample porosity | C | 0.0065 | 1.85 |
| Distance of piezometers | M | 0.5 mm | 2.5 |
| Piezometric head | M | 0.5 mm | 3.13 |
| Seepage discharge | C | 2.16 × 10⁻⁸ m3/s | 1.44 |
| Hydraulic conductivity | C | 9.6 × 10⁻⁶ m/s | 7.5 |
| Critical local hydraulic gradient | C | 0.05 | 5 |
| Width of the pipe | M | 0.5 mm | 3.3 |
| Depth of the pipe | M/C | 0.5 mm | 10 |
| Bulk density of eroded material | C | 10 kg/m3 | 0.55 |
| Rate of erosion | C | 0.016 kg/s/m2 | 12.5 |
| Mean hydraulic gradient during backward erosion | C | 0.17 | 4.4 |
| Mean hydraulic gradient during lateral erosion | C | 0.015 | 1 |
| Cross-sectional area of the pipe | C | 6.97 mm2 | 11.8 |
| Cross-sectional wetted length of the pipe | C | 1.12 mm | 5.7 |
| Shear stress | C | 8.6 Pa | 19.7 |
Disclaimer/Publisher’s Note: The statements, opinions and data contained in all publications are solely those of the individual author(s) and contributor(s) and not of MDPI and/or the editor(s). MDPI and/or the editor(s) disclaim responsibility for any injury to people or property resulting from any ideas, methods, instructions or products referred to in the content. |
© 2023 by the authors. Licensee MDPI, Basel, Switzerland. This article is an open access article distributed under the terms and conditions of the Creative Commons Attribution (CC BY) license (https://creativecommons.org/licenses/by/4.0/).
Share and Cite
MDPI and ACS Style
Riha, J.; Petrula, L. Experimental Research on Backward Erosion Piping Progression. Water 2023, 15, 2749. https://doi.org/10.3390/w15152749
AMA Style
Riha J, Petrula L. Experimental Research on Backward Erosion Piping Progression. Water. 2023; 15(15):2749. https://doi.org/10.3390/w15152749
Chicago/Turabian StyleRiha, Jaromir, and Lubomir Petrula. 2023. "Experimental Research on Backward Erosion Piping Progression" Water 15, no. 15: 2749. https://doi.org/10.3390/w15152749
Note that from the first issue of 2016, this journal uses article numbers instead of page numbers. See further details here.