Article

Research on the Features of Rainfall Regime and Its Influence on Surface Runoff and Soil Erosion in the Small Watershed, the Lower Yellow River

1
State Key Laboratory of Simulation and Regulation of Water Cycle in River Basin, China Institute of Water Resources and Hydropower Research, Beijing 100038, China
2
College of Water Conservancy and Civil Engineering, Shandong Agricultural University, Taian 271018, China
3
Hydrological Center of Taian City, Taian 271001, China
*
Author to whom correspondence should be addressed.
These authors contributed equally to this work.
Water 2023, 15(14), 2651; https://doi.org/10.3390/w15142651
Submission received: 26 June 2023 / Revised: 19 July 2023 / Accepted: 20 July 2023 / Published: 21 July 2023
(This article belongs to the Special Issue Soil Erosion Monitoring and Modeling)

Abstract

:
Rainfall has a significant impact on surface runoff and erosion in a watershed, and there is a lack of information about the features of rainfall regimes and how they affect runoff and soil erosion. In the paper, based on 59 rainfall events from 2021 to 2022 in the lower Yellow River Culai Mountain sub-watershed, various statistical analysis methods were used to preliminarily explore the rainfall regime features and their influence on surface runoff and soil erosion. The results showed that the rainfall in the watershed was divided into three regimes: Rainfall Regime I had the highest frequency of occurrence, reaching 74.58%, and Rainfall Regime III was the main power source for surface runoff and soil erosion. The paper filtered out three indicators (P, I, and I30) to analyze the degree of influence of rainfall features on surface runoff and erosion, and the results show that precipitation is the main influencing factor affecting the variation in surface runoff, and the maximum 30 min rainfall intensity is the main factor impacting the variation in sediment yield. The results can provide a theoretical basis for soil conservation, hydrological forecasting, and non-point source pollution management.

1. Introduction

Rainfall is the key driver of watershed surface runoff and soil erosion [1,2,3,4,5,6], especially erosive rainfall, which affects the separation of soil particles as well as sediment movement and deposition [7,8]. Erosive rainfall can increase regional soil erosion, taking away nutrient-rich topsoil and leading to a decrease in soil fertility [9,10,11,12,13]. Additionally, a significant amount of soil nutrients are transported into water bodies via soil erosion [14], causing water pollution and eutrophication. Therefore, soil erosion is also a source in the watershed of non-point source pollution [15]. The study of rainfall regimes and their effects on surface runoff and soil erosion has become a hot issue of concern in ecohydrology, and it is of significant practical value for the prevention and control of soil erosion and non-point source pollution.
Rainfall characteristics include precipitation, rainfall duration, rainfall intensity, maximum 30 min rainfall intensity, movement direction and movement speed, etc. [16]. Precipitation is the sum of all the time periods in the interval from the beginning to the end of the precipitation for this rainfall event. Rainfall duration is the period of time from the beginning to the end of a rainfall event. Rainfall intensity characterizes the precipitation per unit time period and is calculated by dividing the total precipitation from a single rainfall event by rainfall duration. Maximum 30 min rainfall intensity means during a rainfall event, use the maximum value of the sum of precipitation in any 30 min time period divided by 0.5 h; the value obtained is the maximum 30 min rainfall intensity. The movement direction is relative to stationary rainfall and means a rainfall center that moves in a certain direction during the course of the rainfall process. The movement speed refers to the speed at which the center of rainfall moves in a certain direction during the rainfall process. Many academics have conducted extensive research on the influence of rainfall characteristics on surface runoff and soil erosion [17,18,19,20,21]. The findings indicate that rainfall intensity (I) and rainfall duration (D) are the two major factors influencing the creation of watershed runoff and that high-intensity or long-duration rainfall will hasten the onset of runoff generation and increase runoff [1,21], which in turn will lead to an increase in sediment yield (S) and intensify soil erosion [22]; high-intensity rainfall can also cause damage to slopes, leading to geologic hazards [23]. The rainfall erosion indicator (EI30) defined by the Universal Soil Loss Equation is commonly used to calculate rainfall erosivity for an individual rainfall event, which is equal to the product of the total kinetic energy of a rainfall (E, MJ·h m−2) and maximum 30 min rainfall intensity (I30, mm·h−1) during the rainfall. A study by Tu et al. [24] in Jiangxi province, China, found a power function relationship between the rainfall erosion indicator (EI30) and precipitation (P) [24] and a primary function relationship between the rainfall erosion indicator (EI30) and sediment yield (S) [25]. Liu et al. [26] found that soil erosion intensity and rainfall duration (D) were power functions on bare slopes and exponential functions on vegetated slopes in the Qinghai–Tibet Plateau region of China. Deng et al. [27] conducted a simulated rainfall experiment at the Agricultural Science Experiment Station of Zhejiang University; the results showed that the runoff (W) and sediment yield (S) increase with the increase in rainfall intensity (I) on different slopes, and the relationship can be expressed as a power function.
The aforementioned studies demonstrate that runoff and sediment yield are closely related to substrate conditions (topography, vegetation, etc.) as well as rainfall characteristics such as precipitation (P), rainfall duration (D), and rainfall intensity (I) [8]. Most of the above studies focus on the influence of single rainfall characteristics on runoff and sediment yield and lack of systematic evaluation [1], as runoff and sediment generation may vary greatly depending on different rainfall regimes [28]. Wei et al. [29] used the K-mean clustering method to classify 131 rainfall events in the Loess Plateau region of China from 1986 to 1999 into 3 categories based on 3 indicators: precipitation (P), rainfall duration (D), and maximum 30 min rainfall intensity (I30), and to analyze the effects of different rainfall regimes on the runoff and sediment yield. The results show that Rainfall Regime II, with high rain intensity, short duration, and high-frequency characteristics, is most likely to produce runoff and sediment in the watershed. Fang et al. [30] conducted the same study in the Three Gorges area of China and found that Rainfall Regime II (which has the largest precipitation (P) and rainfall duration (D)) has the largest mean runoff coefficient and mean sediment yield. Yan et al. [31], in the Molisol region of northeast China, found that Rainfall Regime I (characterized by maximum precipitation (P) and maximum 30 min rainfall intensity (I30)) had the highest soil loss rate. The results of Peng and Wang [22], using the hierarchical clustering method for karst landscape areas in Guizhou Province, China, are consistent with Yan et al. [31]; they both found that rainfall regimes with high-intensity features caused the most surface runoff and soil erosion and were the most destructive rainfall regimes in the region. In the Iguatú watershed in Ceará State, Brazil, dos Santos et al. [32] used a hierarchical clustering method based on three indicators: precipitation (P), rainfall duration (D), and maximum 30 min rainfall intensity (I30), and it was found that the precipitation (P) and maximum 30 min rainfall intensity (I30) of Rainfall Regime I in this basin were the largest, the rainfall duration (D) was the longest, and its occurrence frequency was the smallest but most likely to cause runoff and sediment yield, so this rainfall regime is most concerning. In summary, the rainfall characteristics of different regions are different, and there are differences in the main rainfall characteristics that cause the production of runoff and sediment, while the analysis methods of rainfall regimes mostly adopt the K-mean clustering method or hierarchical clustering method but lack the rationality test of rainfall regimes’ classification; moreover, the relationship between several rainfall characteristics, such as precipitation (P), rainfall duration (D), rainfall intensity (I), maximum 30 min rainfall intensity (I30), and the response of runoff and sediment yield, is unclear.
The northern soil and rocky mountain area is one of the first-grade zones of soil and water conservation in China, and the 2021 China Soil and Water Conservation Bulletin shows [33] that the soil erosion area in the northern soil and rocky mountain area is 160,000 square kilometers, accounting for 19.84% of its total land area, and the main erosion type in this area is hydraulic erosion, accounting for 87.25% of the total soil erosion area. Intense hydraulic erosion has caused serious soil nutrient loss in the area, resulting in reduced crop yields and having a significant detrimental effect on environmental sustainability. In the paper, a typical small watershed in the northern soil and rocky mountainous areas, the Yellow River downstream Culai Mountain watershed, was selected as the study area, which is located in Taian City, Shandong Province, China. The area is characterized by high mountains and steep slopes, and the soil is mainly brown loam and brown soil, with a loose texture and thin soil layer, with an annual rainfall of 690.6 mm; it is a warm temperate continental monsoon climate zone, influenced by monsoons [34], with rainfall concentrated in summer and often heavy, and is one of the rainstorm centers in Shandong Province. The combination of soil and rainfall has led to very serious soil erosion in the watershed, seriously affecting local agricultural and economic development.
At present, there are few studies on the influence of rainfall regimes on watershed runoff and sediment yield in northern soil and rocky mountain areas, and the majority of the current research focuses on the northwest Loess region [16,29,35], the northeast black soil region [31], the southern red soil region, etc. [36]. Therefore, we aimed to clarify the features of rainfall regimes in the typical small watershed of the northern soil and rocky mountainous areas, the Culai Mountain watershed, and to explore the influence of each rainfall characteristic indicator on runoff and sediment yield. In this paper, various cluster analysis methods (K-means clustering method and hierarchical clustering method) are used to classify the rainfall events in 2021–2022 in the Culai Mountain watershed, and discriminant analysis and ANOVA are used to analyze the rationality of rainfall regime classification. Using the multiple linear regression method and through path analysis, the response relationship models of rainfall characteristic indicators (P, D, I, and I30) and runoff and sediment yield are established to quantify the relationship between rainfall characteristics indicators (P, D, I, and I30), and runoff and sediment yield are established using multiple linear regression and path analysis in order to provide a theoretical foundation for regional non-point source pollution control and soil and water conservation.

2. Materials and Methods

2.1. Study Area

The study area is located at the Culai Mountain Integrated Soil and Water Conservation Observatory in Taian City, Shandong Province, China (117°13′27″–117°14′9″ E, 36°3′46″–36°4′32″ N; elevation 195.986–423.934 m; area 0.921 km2), which is located in the Low Foothill Area of South Central Shandong Province, is part of to the Dawen River basin, and the first-level basin is the Yellow River basin (Figure 1). The cumulative length of the dry ditch in the basin is 1.26 km, with an average ratio of 0.14; the cumulative length of main branch ditch is 4.09 km, with an average ratio of 0.18; and the average gully density is 5.82 km/km2. A runoff observatory has been set up at the outlet of the watershed. The annual runoff of the basin is 2.189 × 10⁵ m3, and the annual sediment yield is 9.582 × 10⁴ kg.
The region has a warm temperate continental monsoon climate with an average annual precipitation of 690.6 mm; the precipitation from June to September is 528.6 mm, accounting for 76.5% of the annual precipitation. This region features 2494 annual sunshine hours and an average annual temperature of 12.9 °C. The highest average temperature in the region is 26.4 °C in July, the lowest average temperature is −2.6 °C in January, the highest extreme temperature is 42.5 °C, the lowest extreme temperature is −22.6 °C, and the annual frost-free period is 190–210 days. The soil in the area is mainly brown soil and cinnamon soil, and the vegetation types in the watershed are mainly red pine, acacia, sagebrush oak, chestnut, and yellow wattle; the land use in the watershed is predominantly forest land, followed by grassland.

2.2. Rainfall Data Monitoring

The rainfall data were collected by siphon self-registering rain gauges in the observatory. The instrument recording error is ±0.05 mm, the recording time is 1 min, and the raw observation data include time and precipitation by time period.
Then, the rainfall events were divided. The interval between two rainfall events was controlled to be 6 h, the time when the precipitation was zero was greater than or equal to 6 h, then the subsequent rainfall was categorized as a second rainfall event [37,38]. A total of 59 different rainfall events overall were identified over the study period, and the precipitation (P, mm), rainfall duration (D, h), rainfall intensity (I, mm·h−1), and maximum 30 min rainfall intensity (I30, mm·h−1) were collated for each rainfall event. The definitions of the four rainfall indicators are listed below:
Precipitation: The sum of the precipitation amounts for all time periods in the interval from the beginning to the end of the rainfall event is taken as the precipitation amount for this rainfall event (P).
Rainfall duration: Total duration of a rainfall event, from start to finish.
Rainfall intensity: This indicator characterizes the precipitation per unit time period and is calculated by dividing the total precipitation from a single rainfall event by the rainfall duration(D). The unit of this value is mm·h−1.
Maximum 30 min rainfall intensity: Means during a rainfall event, use the maximum value of the sum of precipitation in any 30 min time period (P30, mm), divided by 0.5 h; the value obtained is the maximum 30 min rainfall intensity (I30, mm·h−1).

2.3. Runoff and Sediment Yield Data Monitoring

The study area has a runoff station at the outlet of the watershed, where HCJ1 self-registering water level meter and automatic monitoring device for runoff and sediment yield in small watersheds are installed, which are international advanced devices capable of realizing automation and refinement of runoff and sediment yield data collection. The data collected by the device are copied out through the interface, and the original data interval is five minutes, including the time period runoff and sediment content. The formula for calculating the runoff (W, m3) and the sediment yield (S, kg) for each rainfall event is as follows:
W = n = 1 d R n 1 + R n 2 × t n
where W denotes runoff by a rainfall (m3), R n 1 is streamflow (m3/s) recorded by the device at the beginning of the time period, R n is streamflow (m3/s) recorded by the device at the end of the time period, d is the number of periods of this rainfall, and t n is the duration of the time period(s).
S = n = 1 d L n 1 + L n 2 × t n
where S denotes sediment yield by a rainfall (kg); L n 1 is loss of dry river sediment (kg/s) recorded by the device at the beginning of the time period; L n is loss of dry river sediment (kg/s) recorded by the device at the end of the time period; and the other symbols, such as d , t n , are consistent with Formula (1).
The runoff and sediment yield data were compared with the occurrence time of 59 rainfall events to finalize a total of 11 rainfall events with runoff and sediment production during the study period; the occurrence time, precipitation, rainfall duration, rainfall intensity, maximum 30 min rainfall intensity, and runoff and sediment yield for each of the rainfall events with runoff and sediment production are shown in Table 1.

2.4. Statistical Analysis

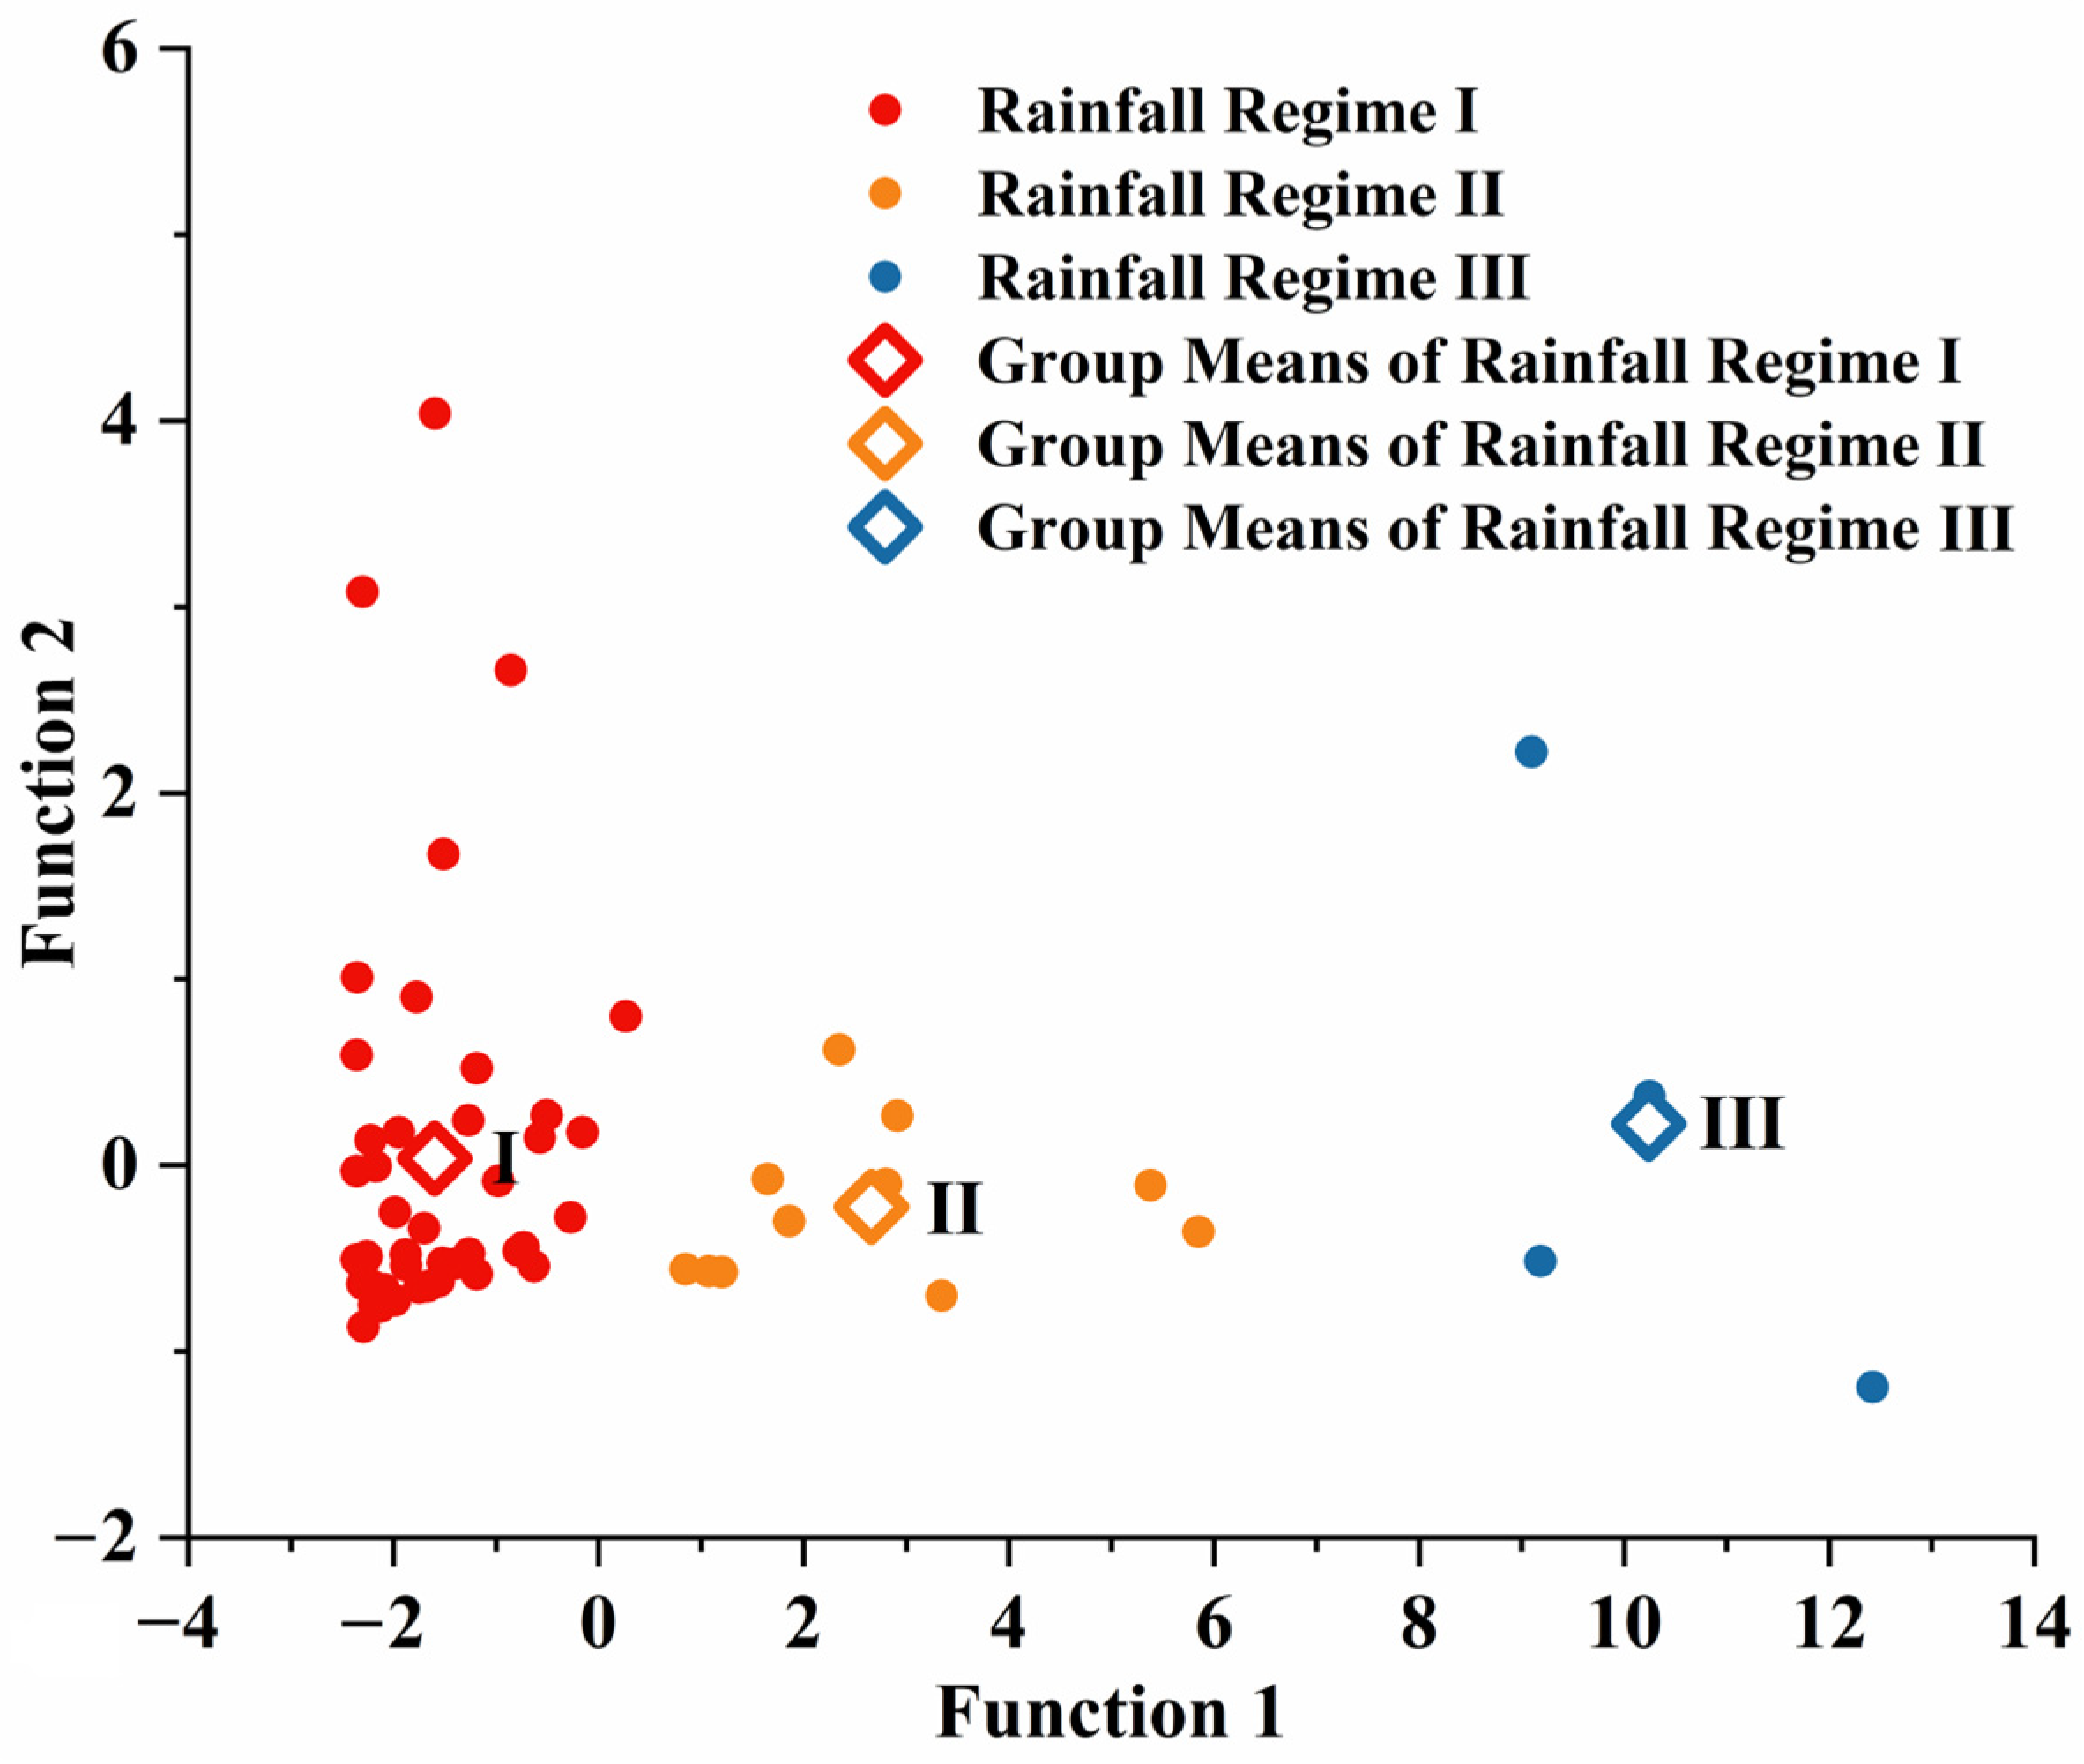
The correlation between rainfall characteristic indicators and runoff and sediment yield was explored in this study using Pearson correlation analysis, which identified the rainfall characteristic indicators used in clustering. The number of clusters was determined using the elbow rule, and the rainfall events were clustered using the K-means clustering method and the systematic clustering method. The results were then tested using ANOVA and Fisher discriminant analysis to confirm the findings, with primary, quadratic, power functions, etc., fit curves to represent relationships between individual rainfall variables, runoff, and sediment output. The multiple linear regression analysis method and the path analysis method were used to analyze the comprehensive effect of rainfall characteristic indicators on the runoff and sediment yield, quantify the degree of influence of each rainfall characteristic indicator on the runoff and sediment yield, select the rainfall characteristic indicators that have the most impact on the production of runoff and sediment, and carry out the construction of the rainfall characteristic indicators–runoff and sediment yield response relationship model.

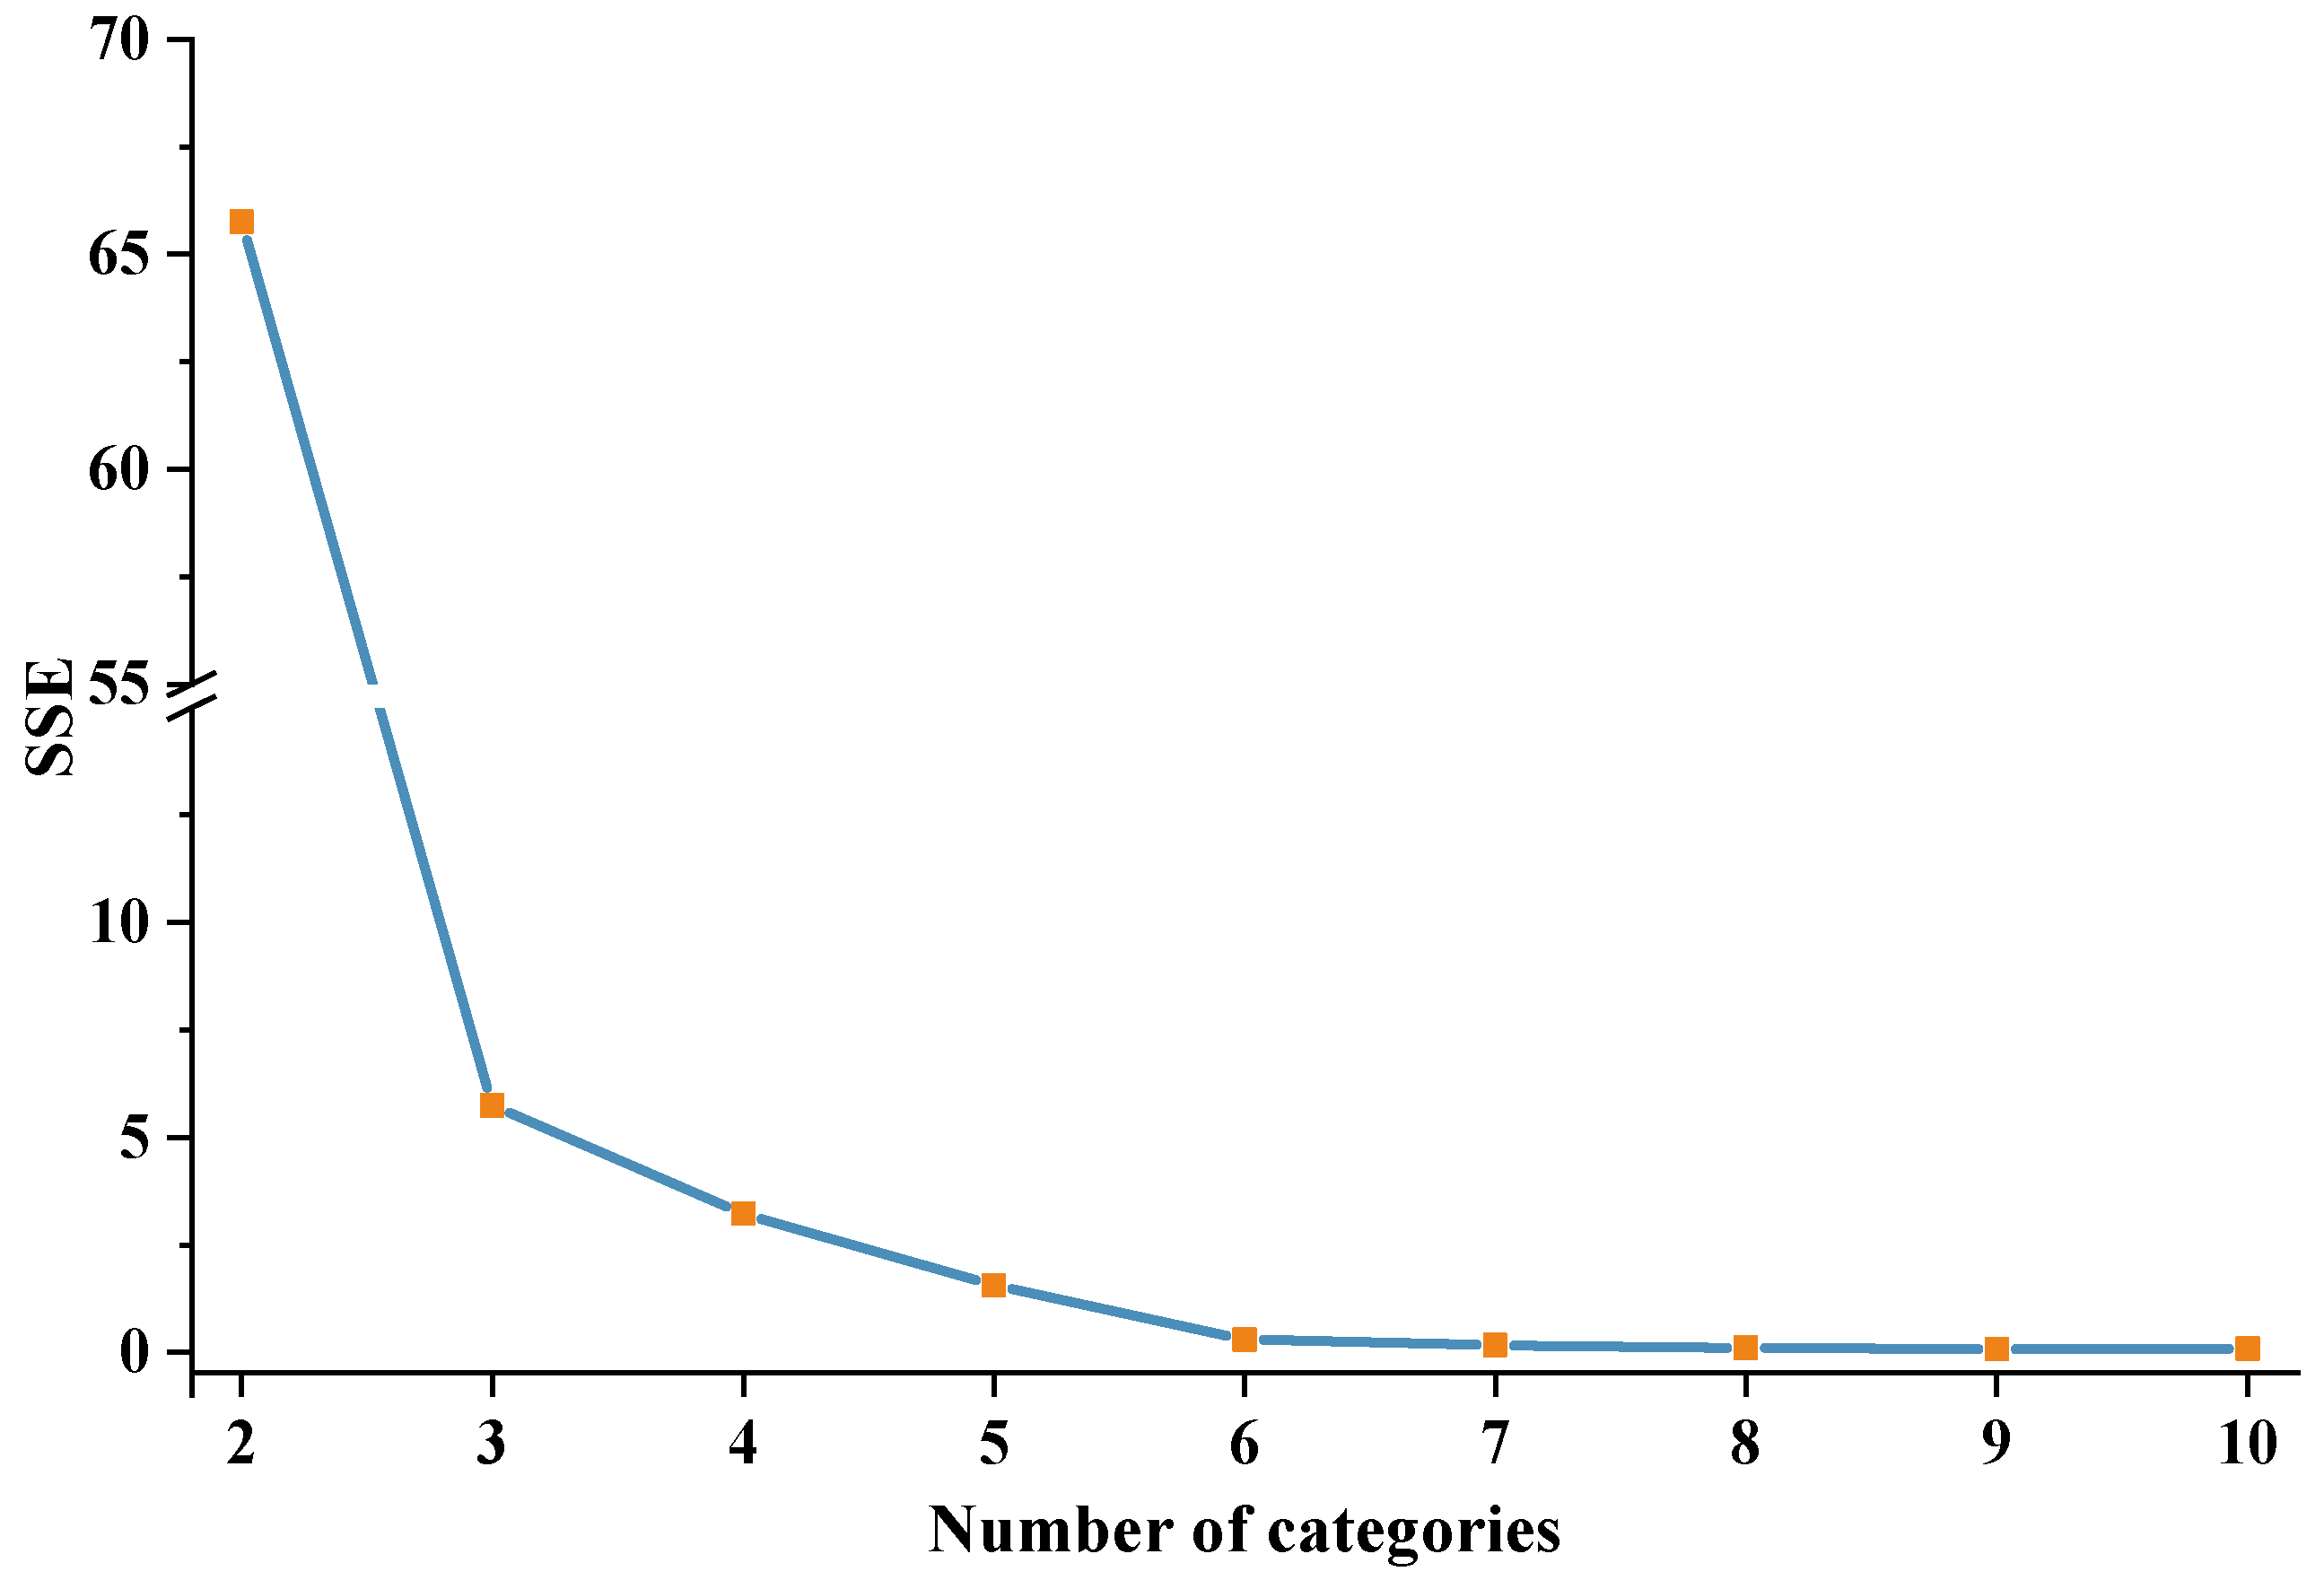
2.4.1. Principle of the Elbow Rule

The principle of the elbow rule is as follows [39]: if the sample is divided into most number of categories, then the structure within each category is looser, and the aggregation coefficient is smaller; the smaller the number of categories, then the tighter the structure within each category, and the larger the aggregation coefficient.
The aggregation coefficient will significantly drop as the number of categories is increased in the elbow rule approach when the number of categories is fewer than the ideal number of clusters, while when the number of categories is equal to the optimal number of clusters, the decrease in the aggregation coefficient will decrease abruptly, and thereafter the decrease in the aggregation coefficient will gradually level off with the increase in the number of categories. Therefore, the folding graph of aggregation coefficient is similar to the shape of the elbow, and the number of categories corresponding to the elbow position is the optimal number of clusters.

2.4.2. Path Analysis

Geneticist Sewall Wright proposed the through-path analysis in 1921 [40], and this method has been continuously improved and refined to form a multivariate statistical technique. The method steps are as follows:
{ 1 r 12 r 13 r 1 p r 21 1 r 23 r 2 p r 31 r 32 1 r 3 p r p 1 r p 2 r p 3 1 } { b 1 y b 2 y b 3 y b p y } = { r 1 y r 2 y r 3 y r p y }
Assuming that there are p factors affecting the dependent variable Y : X 1 , X 2 , , X p , r iy is the simple correlation coefficient of the independent variable X i on the dependent variable Y . The path analysis aims to decompose the simple correlation coefficient r iy into the direct effect of X i on Y and the indirect effect of X i on the dependent variable Y through X j (other independent variables). In summary, the following formula holds:
r ij   = b iy + j i r ij b jy
The direct path coefficient, indirect path coefficient, and simple correlation coefficient can reflect the direct effect of the independent variable X i on the dependent variable Y , the indirect effect of the independent variable X i on the dependent variable Y through the other independent variables X j , and the total effect among the many influencing factors on the dependent variable. However, there is inconsistency in the ranking of these coefficients, making it difficult for users to make decision judgments. The decision coefficient in the path analysis provides a solution to this problem. Yuan et al.’s [41] proposal, R i 2 = b iy 2 + 2 j i b iy r ij b jy , should be used to represent the decision coefficient of the independent variable X i on the dependent variable Y . The decision coefficient reflects both the direct influence of the independent variable X i on the dependent variable Y and the indirect influence of the independent variable X i on the dependent variable Y through other independent variables, which can be used to reflect the size of the influence ability of each variable on the dependent variable in a comprehensive manner and make decision judgments accordingly.
For this paper, graphics were created using Origin 2018b program, and statistical analysis was performed using SPSS 26.0.

3. Results

3.1. Rainfall Status Statistics of the Study Area Watersheds from 2021 to 2022

According to the Taian Water Resources Bulletin (2010–2021), the average multi-year precipitation in the Culai Mountain watershed is 690.6 mm. With 75% of the precipitation falling between June and September in this area, the order of magnitude of precipitation is July > August > June > September. The monthly precipitation and monthly average erosive precipitation (total precipitation for rainfall events that produce runoff and sediment in a watershed) in the Culai Mountain watershed from 2021 to 2022 are shown in Figure 2. The precipitation in the area in 2021 was 769.5 mm, with precipitation concentrated in July–September, and in 2022 was 673.5 mm, with precipitation concentrated in June–August. The average annual precipitation in 2021 and 2022 in the Culai Mountain watershed was basically the same as the multi-year average precipitation. In 2021, under the influence of the sub-high pressure warm and humid airflow, from 28 August to 3 October, Taian City had continuous average precipitation of nearly 380 mm, continuous precipitation caused by the “autumn flood” phenomenon, resulting in October 2021 precipitation reaching the year’s maximum. In June 2022, the most precipitation in history for the same period occurred under the influence of an unusual atmospheric circulation, making June’s precipitation in the basin far exceed the multi-year average precipitation for that month. The two anomalous precipitation events did not change the intra-annual temporal distribution of precipitation in the basin, which was still concentrated from June to September, but significantly increased the proportion of June to September precipitation in the year. The precipitation from June to September in 2021 and 2022 accounted for 90.25% and 87.72% of the total precipitation, respectivel (the multi-year average was 75%), and the erosive precipitation in 2021 and 2022 in the Culai Mountain watershed occurred from June to September, indicating that the precipitation in 2021 and 2022 had a certain universality.

3.2. Clustering Analysis of Precipitation Events in Culai Mountain Watershed from 2021 to 2022

3.2.1. Precipitation–Runoff–Sediment Yield Correlation Analysis

In this paper, Pearson correlation analysis was conducted for six indicators: precipitation (P, mm), rainfall duration (D, h), rainfall intensity (I, mm·h−1), maximum 30 min rainfall intensity (I30, mm·h−1), runoff (W, m3), and sediment yield (S, kg) for the 11 rainfall events with runoff and sediment production occurring in 2021–2022. The results showed that there was a significant positive correlation (p < 0.01) between P and W, S, and P was significantly positively correlated with D at the p < 0.05 level; D was significantly positively correlated with S at the p < 0.05 level; and I30 was significantly positive correlated with S at the p < 0.01 level and with W at the p < 0.05 level (Table 2). Three indicators, P, D, and I30, were more closely related to W and S, while the correlation of I on W and S was slightly lower compared to the other three indicators.
Therefore, in this study, three indicators of P, D, and I30 were selected, and different clustering methods were used to cluster the 59 rainfall events that occurred in the Culai Mountain watershed from 2021 to 2022.

3.2.2. Clustering Analysis of Rainfall Events

  • Elbow rule
Both the systematic clustering approach and the K-means clustering method have a drawback: the user needs to choose the number of clusters according to personal experience or practical situations. Currently, there are two main types of methods to determine the number of clusters, the elbow rule and the contour coefficient method. The contour coefficient method has the disadvantage in that the optimal value is not always the optimal number of classifications, and sometimes the elbow rule is needed to jointly determine the number of classifications. Therefore, this study was conducted to determine the number of classifications with the help of the elbow rule.
The elbow rule results are shown in Figure 3, where the inflection point of the image is at three classifications. The degree of the sum of squares due to error (SSE) variation was significantly reduced when the number of classifications increased again. Therefore, this study proposes to analyze the 59 rainfall events in 2021–2022 into three categories.
2.
K-means clustering method
The number of classifications was chosen as 3. P, D, and I30 were used as classification indicators and classified by K-means clustering, and Table 3 displays the results of the classification.
3.
Systematic clustering method
The inter-group connection method of the systematic clustering method was used, the distance determination method was set to the squared Euclidean distance to classify the rainfall events, and the spectrum map of the systematic clustering method was obtained (Figure 4).
The result of the elbow rule shows that three clusters are optimal; therefore, the rainfall is classified at a distance of 2844. The 59 rainfall events were classified into three categories (Figure 4), which are indicated by different colors in the figure. Rainfall Regime I has the highest number of rainfall events, 21 (yellow part of the graph); followed by Rainfall Regime II, with 11 (green part); and Rainfall Regime III, with the lowest number of events, 4 (blue part).
By comparing the results of the K-means clustering method and the systematic clustering method, it was found that the two methods have the same classification results for rainfall events, and thus the classification results can be mutually verified in terms of methods.

3.2.3. Reasonableness Analysis of Clustering Results

The 59 rainfall events in the Culai Mountain watershed from 2021 to 2022 were classified into three categories using the clustering method. In order to investigate whether the rainfall regime classification is reasonable, ANOVA and discriminant analysis were used to test the reasonableness of the classification results. Before ANOVA was used, the suitability of the data needs to be checked. The findings of testing the data’s normality using the skewness coefficient and kurtosis coefficient methods are displayed in Table 4. The S and K values of D for Rainfall Regime I were greater than 1.96 (p > 0.05), and the S value of I30 was greater than 1.96 (p > 0.05). Accordingly, the D and I30 of Rainfall Regime I can be judged as not obeying the normal distribution, while the rest of the indicators are in line with the normal distribution (Table 4).
The Levene test was used to test the variance chi-square condition. The results show that the precipitation (F (2,56) = 11.867, p < 0.001) and rainfall duration (F (2,56) = 7.422, p = 0.001) of the three rainfall regimes do not satisfy the variance chi-square condition, and the maximum 30 min rainfall intensity satisfies the variance chi-square (F (2,56) = 1.257, p = 0.293).
One of the assumptions of One-Way ANOVA is that the observations in each group obey a normal distribution. For data that do not obey a normal distribution, the conventional view is to use a nonparametric test (Kruskal–Wallis test) for analysis, but this method assumes that different groups have the same distribution, and this assumption will lead to less-than-accurate results when analyzing data that do not satisfy the chi-squared condition. The One-Way ANOVA method is not particularly sensitive to deviations from the assumption of normality, and McDonald [42] simulated various non-normal distributions, with false positives always around 5% or less. Consequently, for data that do not exhibit a normal distribution, McDonald recommends continuing using the One-Way ANOVA method. When analyzing data with unequal variances, Welch’s ANOVA was used for the test, and the results obtained when comparing two by two using the Games–Howell test method will be more accurate than those obtained using the nonparametric test method. However, it is important to note that if the ANOVA results do not have a P value well below 0.05 and the data are extremely non-normal, then it is prudent to reject the original hypothesis condition [42].
Therefore, Welch’s ANOVA and Games–Howell test were used to analyze the P and D of each regime of rainfall; I30 obeyed both normal distribution and variance chi-square condition, and One-Way ANOVA and Bonferroni method were used for analysis.
The results showed highly significant differences (p < 0.01) in P, D, and I30 (Table 5). However, whether P, D, and I30 differ from each other under the three rainfall regimes needs to be determined via post hoc comparison.
The findings of the post hoc comparison are displayed in Figure 5. The histograms in Figure 5 exhibit the average values of each rainfall feature for various rainfall regimes, and the distinct lettering (a, b, and c) denotes statistically significant differences (p < 0.05) in the data.
The results showed that the P and I30 of the three rain regimes were significantly different from each other (p < 0.05). There was a significant difference (p < 0.05) in the D between Rainfall Regime I, II, and Rainfall Regime III, but the difference in the rainfall duration (D) between Rainfall Regime II and III was not significant (p > 0.05).
In conclusion, the ANOVA findings showed that the three rainfall regimes generally differed significantly from one another.
In order to explore the rationality of rainfall regimes clustering in depth, the distribution of the typical discriminant function scatter in the center of mass of the group for the three rainfall regimes was analyzed in the paper using discriminant analysis. The results show that the typical discriminant function scatter distribution of Rainfall Regime II is relatively concentrated, while Rainfall Regime I and Rainfall Regime III are more dispersed. The scatter points of the discriminant functions of Rainfall Regime I, III, and Rainfall Regime II were far apart with clear boundaries, and the scatter points of the discriminant functions of Rainfall Regime I and II were close together but did not cross (Figure 6).
The reasonableness of the clustering results determined via ANOVA and Discriminant Analysis shows that there are three rainfall regimes in the watershed, and each rainfall characteristic indicator of different rainfall regimes has significant differences in general. The three rainfall regimes are dispersed and evenly distributed around the center of the mass, according to the results of the discriminant analysis, and the cluster analysis also produced promising results. In conclusion, the classification results of the rainfall events in the Culai Mountain watershed meet the statistical requirements and satisfy the classification expectations.

3.2.4. Analysis of the Rainfall Regime Features of the Culai Mountain Watershed

The 59 rainfall events in the Culai Mountain watershed from 2021 to 2022 were classified into three categories (Rainfall Regimes I, II, and III) (Table 6). There were 44 rainfall events for Rainfall Regime I, of which 3 rainfall events caused runoff and sediment generation, accounting for 74.58%. There were 11 rainfall events for Rainfall Regime II, of which 4 rainfall events caused runoff and sediment generation, accounting for 18.64%; Rainfall Regime III had 4 rainfall events, all of which triggered runoff and sediment generation, accounting for 6.78%. The mean values of P, D, and I30 are Rainfall Regime III > Rainfall Regime II > Rainfall Regime I, from largest to smallest. Therefore, the features of Rainfall Regime I are small amounts of precipitation with a short duration and low intensity, the features of Rainfall Regime II are medium amounts of precipitation with medium duration and intensity, and the features of Rainfall Regime III are heavy precipitation with a long duration and high intensity.

3.3. Investigation of the Relationship between Rainfall Indicators and the Response of Runoff and Sediment Yield

3.3.1. Equation Fitting of Four Indicators to the Runoff and Sediment Yield

The influence of each rainfall characteristic indicator on the runoff (W) and sediment yield (S) was investigated in this study in order to investigate the impact of each indicator on the runoff and sediment yield. The results are displayed in Figure 7. The method to determine the fitting curve of rainfall characteristic indicator and the runoff and sediment yield is to fit the scatter with different functional relationships, and according to the coefficient of determination of each fitting line, the curve with the largest coefficient of determination is selected as the fitting curve [43]. The fitted lines of P, I30, and W were a linear function (Figure 7a,d); D was a quadratic square related to W (Figure 7b); I is related to W as a power function (Figure 7c). In the fitting equation of each rainfall characteristic indicator to S, P, D, I30, and S are all quadratic functions (Figure 7e,f,h); I is related to S as a power function (Figure 7g).

3.3.2. Multiple Linear Regression Analysis and Path Analysis

In order to investigate the response relationship between rainfall characteristic indicators and the runoff and sediment yield, firstly, covariance statistics were conducted for four rainfall characteristic indicators: precipitation (X1), rainfall duration (X2), rainfall intensity (X3), and maximum 30 min rainfall intensity (X4).
The maximum value of VIF among the independent variables is 7.566, which is less than 10, thus determining that there is no covariance among the independent variables [44]. The Durbin–Watson test of four rainfall characteristics, X1, X2, X3, and X4, on Y1 and Y2 showed test values of 2.255 and 2.461, respectively, indicating that the data satisfy the independence condition. The residuals basically conformed to the normal distribution, and the distribution was unordered random distribution, which satisfied the requirement of variance chi-squared and met the requirement of regression analysis. Therefore, multiple linear regression analysis was used to explore the relationship between the independent variables X1, X2, X3, and X4 and the dependent variables Y1 and Y2. The results of multiple linear regression were subjected to F-test, and the F-statistic values were 35.122 (p < 0.01) and 50.951 (p < 0.01), which reached a highly significant level.
Significant effects (p < 0.05) of X3 and X4 on Y1 and Y2 according to the significance tests of the respective variables in the regression analysis; Based on the results of multiple linear regression analysis, the effects of X1 and X2 on Y1 and Y2 were not statistically significant (p > 0.05).
The R2 of linear regressions were 0.959 and 0.971, respectively, indicating that the four rainfall characteristic indicators could better explain the variation of Y1 and Y2. The F-test results for the multiple linear regression equations of rainfall characteristics indicators and runoff and sediment yield all reached a highly significant level (p < 0.01), indicating that the regression relationships were statistically significant and allowed for a multi-factor path analysis. The results are shown in Table 7.
This paper uses the method of path analysis to further clarify the degree of influence of each rainfall indicator on the production of runoff and sediment in the Culai Mountain watershed.
The path analysis results on the influence of each rainfall characteristic indicator on Y1 are shown in Table 8. The direct path coefficient of X1, X2, X3, and X4 on Y1 are all positive, and the sum of the indirect path coefficient of each indicator is also positive, indicating that the direct effects of the four indicators on Y1 are positive, and at the same time, the effects of each indicator on the Y1 through other indicators are also positive. Given the decision coefficients, it can be seen that the indicator with the greatest combined effect on Y1 is X1, followed by X4, and again by X3, with the least being X2.
The path analysis results on the influence of each rainfall characteristic indicator on Y2 are shown in Table 9. The direct path coefficient of X1, X2, X3, and X4 on Y2 are all positive, indicating that the direct effects of the four indicators on Y2 are positive. X4 has the greatest direct effect on Y2, followed by X3, with X2 in third place and X1 in last. Given the total indirect path coefficient, it is clear that although X1 has the least direct effect on Y2, its indirect effect on Y2 is the greatest. Meanwhile, it is noteworthy that the sum of the indirect path coefficient of X3 on Y2 is −0.006, indicating that the effect of rainfall intensity X3 on Y2 through the remaining three indicators is weakly negative.
In summary, the direct effects of all indicators on the production of runoff and sediment are positive, and the direct path coefficient of X3 and X4 is in the top two positions of each rainfall indicator, indicating that the direct effects of the two indicators on the runoff and sediment yield are greater. The direct effects of X1 and X2 on runoff and sediment yield are small, but the indirect path coefficients are generally large, and both are positive, indicating that although the direct effects of X1 and X2 on runoff and sediment yield are small, they still play an important role in runoff and sediment generation through other indicators.
The decision coefficient is a quantitative indicator reflecting the combined effect of different independent variables on the dependent variable. The decision coefficients of X1 on Y1 and Y2 are 0.454 (first place) and 0.407 (second place). The multiple regression analysis results showed that X3 and X4 had significant effects on Y1 and Y2. Combining the results of multiple regression analysis and path analysis, the main rainfall indicators that affect the runoff and sediment generation in the Culai Mountain watershed are X1, X3, and X4.

3.3.3. Construction of a Rainfall Characteristic Indicator–Runoff–Sediment Yield Fitting Model in Culai Mountain Watershed

The results of multiple regression analysis and path analysis show that the main rainfall characteristic indicators affecting the runoff and sediment generation in the Culai Mountain watershed are precipitation (X1), rainfall intensity (X3), and maximum 30 min rainfall intensity (X4). Using the above rainfall characteristic indicators, regression equations between precipitation, rainfall intensity, and maximum 30 min rainfall intensity and runoff and sediment yield were established as follows:
Y 1 = 188.710 X 1 + 3089.353 X 3 + 334.621 X 4 + 5660.100 F = 40.294   ( p   <   0.001 ) ,   R 2 = 0.945
Y 2 = 90.074 X 1 + 740.219 X 3 + 218.115 X 4 + 1449.567 F = 50.334   ( p   <   0.001 ) ,   R 2 = 0.956
F = 40.292 and 50.334 were found for the two regression equations (p < 0.001), indicating that the established equations can reflect the changes in the dependent variable more accurately. The R2 of the fitted equations were 0.945 and 0.956, respectively, indicating that the multiple linear regression model can better reflect the influence of rainfall characteristic indicators on the runoff and sediment generation in the Culai Mountain watershed.

4. Discussion

4.1. Study on the Characteristics of Rainfall Regime in Culai Mountain Watershed

The 59 rainfall events in the Culai Mountain watershed from 2021 to 2022 were classified into 3 types using the K-mean clustering method and systematic clustering method. Rainfall Regime I is a collection of low-precipitation events with a short rainfall duration and low intensity (74.58% of the total rainfall events), Rainfall Regime II is a collection of medium-precipitation events with medium rainfall duration and medium intensity (18.64% of the total rainfall events), and Rainfall Regime III is a collection of significant-precipitation events with a long rainfall duration and high intensity (6.78% of the total rainfall events) (Table 6). Given the frequency of the three regimes of rainfall in the Culai Mountain watershed, it can be seen that the frequency of small rainfall events is the largest, the frequency of large rainfall events is low, the process is long, and the total precipitation is significant. These results are in general agreement with the rainfall regimes clustering results of the Lower Dawen River Xiagang sub-watershed in the lower Yellow River [45].
In the studies of other scholars, it has been found that there are also rainfall regimes characterized by short-duration intense rainfall and long-duration weak rainfall in certain areas. Zhao et al. [35] found that regime IV rainfall, which is characterized by higher precipitation, shorter rainfall duration, and higher rainfall intensity, occurs with the lowest frequency in the Caijiachuan watershed in Shanxi Province, China, but it causes the most soil erosion. Peng et al. [22] also found this phenomenon in Guizhou Province, China. After comparing the natural geographic environment and climatic conditions of the study area, it was found that the above area is at a higher elevation compared to the Culai Mountain watershed, which receives more sunshine and is subjected to higher temperatures after being illuminated, thus accelerating the convective rise, and thus it is easier to form a short-duration intense rainfall. Wei et al. [29] found that a low-intensity, long-duration rainfall regime exists in the Anjiapo watershed in Gansu Province, which causes little runoff and soil erosion compared to other regimes because of its low intensity. This region has a low average annual precipitation of about 427 mm, and the warm and humid summer climate is one of the reasons for this regime of rainfall.
According to the China Meteorological Administration’s criteria for the classification of rainstorms, “Precipitation of 16 mm or more per hour, or 30 mm or more for 12 consecutive hours, or 50 mm or more for 24 consecutive hours” [46]. Rainfall Regime II in this paper is medium rainfall, of which 7 rainfall events met the criteria for rainstorms; all 4 rainfall events of Rainfall Regime III met the criteria for rainstorms; and a total of 11 rainstorm events occurred in the study area from 2021 to 2022. Yu et al. [47] studied the spatial distribution of the average annual rainstorm frequency in China from 1984 to 2008, which decreased gradually from southeast to northwest in China, with the average annual rainstorm frequency in the upper and middle Yellow River basins being less than one, while the average annual rainstorm frequency in the lower Yellow River increased to 1–3. The average frequency of rainstorms in the Culai Mountain watershed in 2021–2022 reached 5.5 times, with a high frequency of rainstorms. As the watershed is dominated by woodland and grassland, the vegetation cover is high, reaching more than 75%. High summer temperatures lead to high evapotranspiration, a large amount of water vapor rises in the lower layers and condenses into clouds when it meets, and as the temperature drops rapidly with the height, the water particles of different phases in the clouds collide, merge, and change phases with each other, forming larger particles; natural landing also occurs under the action of gravity, and convective movement occurs for a long time, forming rainstorms, which is the reason for their increased occurrence in this area in the summer. The characteristics of rainfall regimes vary widely from place to region as a result of climate and land surface conditions. The Culai Mountain watershed is located in the Low Foothill Area of South Central Shandong Province; its climate type is a warm temperate continental monsoon climate. The region is influenced by the East Asian monsoon in summer, which brings abundant precipitation from the tropical ocean, while the winter wind mainly comes from the cold northern part of the Asian and European continent around Siberia and Mongolia; its rainfall is characterized by rain and heat at the same time, with 75% of the annual precipitation concentrated in the months of June to September. The region experiences cold and dry winters with minimal rainfall [48]. The distribution pattern of rainfall in this region is consistent with that of northern China [49].

4.2. The Effect of Rainfall Regime on the Production of Runoff and Sediment

There were 44 rainfall events for Rainfall Regime I in the Culai Mountain watershed from 2021 to 2022, of which only 3 rainfall events caused the production of runoff and sediment. This phenomenon is inextricably linked to the role of vegetation; on the one hand, the vegetation canopy can intercept rainfall and lessen the quantity of rain that lands on the ground through leaves and other means [50,51], and on the other hand, vegetation’s root systems have the ability to penetrate the ground and increase soil porosity, which encourages infiltration and lessens runoff [36,52].
Along with increasing the topsoil’s ability to store water and reducing runoff generation, vegetation’s apoplastic material also helps to collect runoff [53]. A similar phenomenon was found in the Loess Plateau, where rainfall with the highest frequency of small precipitation and small rainfall intensity occurred, and the effect of vegetation interception resulted in less runoff and sediment yield in the watershed [35].
The percentages of cumulative precipitation, cumulative runoff, and cumulative sediment yield of each rainfall regime in the Culai Mountain watershed from 2021 to 2022 are shown in Figure 8. The cumulative precipitation of Rainfall Regime II has the highest proportion, but its cumulative runoff and cumulative sediment yield are between Rainfall Regime I and III. This is mainly due to the fact that the number of rainfall events of Rainfall Regime II is smaller than that of Rainfall Regime I but much greater than that of Rainfall Regime III. The accumulated rainfall, accumulated runoff, and accumulated sediment yield of Rainfall Regime II are larger than that of Rainfall Regime I, but Rainfall Regime II caused only 4 rainfall events of runoff and sediment generation, and the runoff and sediment yield were smaller than that of Rainfall Regime III. The order of magnitude of the ratio of rainfall to runoff is Rainfall Regime I (1.369) > Rainfall Regime II (1.274) > Rainfall Regime III (0.707), and the order of magnitude of the ratio to sediment yield is Rainfall Regime I (1.578) > Rainfall Regime II (1.293) > Rainfall Regime III (0.670), indicating that Rainfall Regime III has the strongest ability to produce runoff and sediment per unit of precipitation, followed by Rainfall Regime II, and the weakest being Rainfall Regime I. Comprising 36.20% of the precipitation, Rainfall Regime III produced 51.23% of the runoff with 54.00% of the sediment yield, which is the main power source of runoff and sediment production in the watershed.
Rainfall Regime III features heavy precipitation with a long duration and high rain intensity, and the maximum 30 min rainfall intensity (I30) is the largest, which tends to make the soil form surface crusts and seals, reducing the infiltration of rainwater into the soil and increasing surface runoff, which in turn increases the transport of sediment [54,55]. This result was also observed by dos Santos et al. [32] in the state of Ceará, Brazil, whose study showed that the rainfall with the greatest precipitation, the longest rainfall duration, and a greater maximum 30 min rainfall intensity occurred with the lowest frequency, but produced larger amounts of runoff and sediment, and that this regime of rainfall is of concern.
According to the cumulative runoff and cumulative sediment yield of different rainfall regimes (Figure 8), the cumulative runoff and cumulative sediment yield of Rainfall Regime III are larger, which is because, with an increase in rainfall intensity, surface runoff causes a higher rate of soil loss than raindrops directly hitting the soil surface. In other words, during high-intensity rainfall, sediment production is the result of a combination of raindrop strikes and surface runoff, and the contribution of the surface runoff to the total soil loss is higher than that of raindrops [53]. The I30 of Rainfall Regime III is the largest. When Rainfall Regime III occurs, it generates a larger amount of runoff, and the runoff affects the sediment production process, thus generating a larger sediment yield.
On an annual scale, there were 11 rainfall events in 2021–2022 that were runoff-producing and sediment-producing, of which 3 were Rainfall Regime I, 4 were Rainfall Regime II, and 4 were Rainfall Regime III. Rainfall Regime II and III had the same number of runoff and sediment yield events, and Rainfall Regime III had 4 fields in total, which was the least frequent among the 3 regimes of rainfall, but all of its 4 rainfalls caused runoff and sediment yield, and its runoff and sediment yield capacity per unit of precipitation was the largest. Therefore, when Rainfall Regime III is forecast to occur in the Culai Mountain watershed, the relevant departments should be prepared for emergency precautions to cut down the adverse effects caused by flooding as well as soil erosion.

4.3. Response of Rainfall Characteristic Indicators to the Production of Runoff and Sediment

The results of the fitting curve from the single rainfall characteristic indicator to runoff and sediment yield show that the runoff increased linearly with the precipitation and the maximum 30 min rainfall intensity, that the relationship between the rainfall duration and runoff is a quadratic function, that the runoff increases gradually with the increase in rainfall duration, that the relationship between rainfall intensity and runoff is a power function, and the runoff gradually converges to a fixed value with the increase in rainfall intensity (Figure 7a–d). Therefore, the upper limit of maximum runoff is influenced by rainfall intensity in the Culai Mountain watershed. Precipitation, rainfall duration, maximum 30 min rainfall intensity, and sediment yield are quadratic functions, and rainfall intensity and sediment yield are power functions. The upward trend of sediment yield gradually slows down as rainfall intensity rises. It can be seen that, similar to the runoff, there is an upper limit to the sediment yield in the Culai Mountain watershed (Figure 7e–h). According to the findings of similar studies, steep slopes’ sediment loads tend to increase with increasing rainfall intensity before gradually declining [56]. The trend of sediment load reduction has not yet been observed in the course of our analysis, but this does not prevent us from concluding that there is an upper bound to the sediment yield. By analyzing the correlation between each indicator and the runoff and sediment yield, respectively, the time when the sediment yield reached the upper limit was significantly earlier than the time when the runoff reached the upper limit.
Given the analysis of the fitted curves of single rainfall characteristic indicators for runoff and sediment yield (Figure 7), there are some scattered points outside the fitted curves, indicating that the process of runoff generation and soil loss is the result of the combined action of multiple elements, which cannot be accurately predicted by a single rainfall characteristic indicator [22,57]. Therefore, a comprehensive analysis of the effects of multiple rainfall characteristic indicators on the production of runoff and sediment is required.
In the analysis of the degree of influence of multiple rainfall characteristics indicators on the production of runoff and sediment and the construction of the fitted model, the decision coefficient of each indicator shows that the order of the magnitude of the combined influence on the production of runoff is P > I30 > I > D, and the order of the magnitude of the combined influence on the production of sediment is I30 > P > D > I. P was the main influencing factor for the variation of runoff, and I30 was the main influencing factor for the variation in sediment yield; this result is generally consistent with the research results in several regions of China [58].
In order to further explore the response relationship between rainfall characteristic indicators and the runoff and sediment yield, three rainfall characteristic indicators (P, I, and I30) were selected in this paper based on the analysis results of the influence of the rainfall characteristic indicators on the runoff and sediment yield, and the response relationship models of the runoff and sediment yield in the Culai Mountain watershed with rainfall characteristic indicators were established, respectively. In a similar study, Kou et al. [59] modeled the link between runoff and rainfall characteristic indicators via P, D, and I30 in the Pearl River Basin of southern China’s red soil region. The response relationship between the sediment yield modulus and rainfall characteristic indicators was modeled by P, I, I30, and R (rainfall erosion force). The similarity with that paper is that both selected P and I30 for the construction of the runoff and sediment yield model. The difference is that in the construction of the runoff model, the influence of D on the runoff was considered to be greater than that of I. This paper finds that the influence of I on the runoff is greater, which is caused by the differences in climatic features between different study areas.

5. Conclusions

The aim of this study is to investigate the features of rainfall regimes in the lower Yellow River small watershed and their effects on the production of runoff and sediment. Based on 59 rainfall events in the Culai Mountain watershed from 2021 to 2022, the rainfall regime classification was carried out via the K-mean clustering method and systematic clustering method, and the rainfall regime classification results were tested for validity with the help of ANOVA and the discriminant analysis method. In order to further clarify the degree of influence of rainfall characteristic indicators on the production of runoff and sediment, multivariate linear analysis and path analysis were used to screen out three rainfall characteristic indicators that have a greater influence on the production of runoff and sediment in the watershed and to establish a model of the response relationship between the production of runoff and sediment and rainfall characteristics in the watershed. In total, the following results were obtained:
  • There are three regimes of rainfall in the Culai Mountain watershed. Rainfall Regime I is small rainfall with a short duration and low intensity, Rainfall Regime II is medium rainfall with medium duration and medium intensity, and Rainfall Regime III is heavy rainfall with a long duration and high intensity. The frequency of Rainfall Regime I is the highest, and the frequency of Rainfall Regime III is the lowest, but Rainfall Regime III is the main power source for the runoff and sediment yield in the Culai Mountain watershed.
  • Analysis of the influence of individual rainfall characteristic indicators on the runoff and sediment yield, in which precipitation, rainfall intensity, and maximum 30 min rainfall intensity have a bigger impact on runoff and sediment production in the watershed.
  • Multiple linear regression models were constructed for watershed runoff, sediment yield and precipitation, rainfall intensity, and maximum 30 min rainfall intensity, respectively, with R2 of 0.945 for the runoff equation and R2 of 0.956 for the sediment yield equation. Analyzed from the perspective of rainfall regime characteristics, precipitation was the main factor influencing the variation in the runoff, and the maximum 30 min rainfall intensity was the main factor influencing the variation in sediment yield.
The shortcomings of this study are that the comprehensive observation station for soil and water conservation in the Culai Mountain watershed was established over a short time and failed to collect multi-year data, but the annual average precipitation in 2021–2022 is close to the multi-year average precipitation, which is somewhat representative; the research results can be considered to represent the multi-year rainfall condition of the watershed to a certain extent; and the study can provide reference for local hydrological forecasting and soil and water conservation work.

Author Contributions

Conceptualization, L.Z. and L.H.; methodology, L.Z.; software, L.Z. and Y.W.; validation, J.L., L.H. and Y.F.; investigation, Z.Z.; data curation, L.Z. and Z.Z.; writing—original draft preparation, L.Z.; writing—review and editing, L.H.; funding acquisition, F.D. All authors have read and agreed to the published version of the manuscript.

Funding

This research was funded by the Open Research Fund for the State Key Laboratory of Simulation and Regulation of Water Cycle in River Basin, the China Institute of Water Resources and Hydro-power Research (Address: No. A1 Fuxing Road, Beijing, China) (No: IWHR-SKL-202219).

Data Availability Statement

Restrictions apply to the availability of these data. Data were obtained from the Hydrological Center of Taian City (No. 264, Daizong Street Taian, Shandong Province, P. R. China) and are available from the authors with the permission of the Hydrological Center of Taian City.

Acknowledgments

We would like to extend our sincere gratitude to the Taian City Hydrological Center for their assistance in providing data support.

Conflicts of Interest

The authors declare no conflict of interest.

References

  1. Ran, Q.; Su, D.; Li, P.; He, Z. Experimental study of the impact of rainfall characteristics on runoff generation and soil erosion. J. Hydrol. 2012, 424–425, 99–111. [Google Scholar] [CrossRef]
  2. Yin, J.; He, F.; Xiong, Y.J.; Qiu, G.Y. Effects of land use/land cover and climate changes on surface runoff in a semi-humid and semi-arid transition zone in northwest China. Earth Syst. Sci. 2017, 21, 183–196. [Google Scholar] [CrossRef] [Green Version]
  3. Guzha, A.C.; Rufino, M.C.; Okoth, S.; Jacobs, S.; Nóbrega, R. Impacts of land use and land cover change on surface runoff, discharge and low flows: Evidence from East Africa. J. Hydrol. Reg. Stud. 2018, 15, 49–67. [Google Scholar] [CrossRef]
  4. Martínez-Mena, M.; Carrillo-López, E.; Boix-Fayos, C.; Almagro, M.; García Franco, N.; Díaz-Pereira, E.; Montoya, I.; de Vente, J. Long-term effectiveness of sustainable land management practices to control runoff, soil erosion, and nutrient loss and the role of rainfall intensity in Mediterranean rainfed agroecosystems. Catena 2020, 187, 104352. [Google Scholar] [CrossRef]
  5. Niu, Y.; Li, S.; Liu, Y.; Shi, J.; Wang, Y.; Ma, Y.; Wu, G.-L. Regulation of alpine meadow patch coverage on runoff and sediment under natural rainfall on the eastern Qinghai-Tibetan Plateau. J. Hydrol. 2021, 603, 127101. [Google Scholar] [CrossRef]
  6. Liu, Y.; Zhao, L.; Liu, Y.; Huang, Z.; Shi, J.; Wang, Y.; Ma, Y.; Lucas-Borja, M.E.; López-Vicente, M.; Wu, G.-L. Restoration of a hillslope grassland with an ecological grass species (Elymus tangutorum) favors rainfall interception and water infiltration and reduces soil loss on the Qinghai-Tibetan Plateau. Catena 2022, 219, 106632. [Google Scholar] [CrossRef]
  7. Angulo-Martínez, M.; Beguería, S.; Navas, A.; Machín, J. Splash erosion under natural rainfall on three soil types in NE Spain. Geomorphology 2012, 175–176, 38–44. [Google Scholar] [CrossRef]
  8. Meng, X.; Zhu, Y.; Yin, M.; Liu, D. The impact of land use and rainfall patterns on the soil loss of the hillslope. Sci. Rep. 2021, 11, 16341. [Google Scholar] [CrossRef]
  9. Duan, X.; Xie, Y.; Ou, T.; Lu, H. Effects of soil erosion on long-term soil productivity in the black soil region of northeastern China. Catena 2011, 87, 268–275. [Google Scholar] [CrossRef]
  10. Kervroëdan, L.; Armand, R.; Saunier, M.; Ouvry, J.-F.; Faucon, M.-P. Plant functional trait effects on runoff to design herbaceous hedges for soil erosion control. Ecol. Eng. 2018, 118, 143–151. [Google Scholar] [CrossRef] [Green Version]
  11. Xie, Y.; Tang, J.; Gao, Y.; Gu, Z.; Liu, G.; Ren, X. Spatial distribution of soil erosion and its impacts on soil productivity in Songnen typical black soil region. Int. Soil Water Conserv. Res. 2023. [Google Scholar] [CrossRef]
  12. Xin, Y.; Xie, Y.; Liu, Y.; Liu, H.; Ren, X. Residue cover effects on soil erosion and the infiltration in black soil under simulated rainfall experiments. J. Hydrol. 2016, 543, 651–658. [Google Scholar] [CrossRef] [Green Version]
  13. Li, X.; Zhang, Y.; Ji, X.; Strauss, P.; Zhang, Z. Effects of shrub-grass cover on the hillslope overland flow and soil erosion under simulated rainfall. Environ. Res. 2022, 214, 113774. [Google Scholar] [CrossRef]
  14. Peng, K.; Li, J.-K.; Hao, G.-R.; Liu, Y.-W.; Zhou, X.; Xie, W.-F. Characteristics of non-point source pollution based on monitoring experiment in the Yingwugou small watershed, China. Ecohydrol. Hydrobiol. 2023, 23, 1–14. [Google Scholar] [CrossRef]
  15. Guo, Z.; Ma, M.; Cai, C.; Wu, Y. Combined effects of simulated rainfall and overland flow on sediment and solute transport in hillslope erosion. J. Soils Sediments 2018, 18, 1120–1132. [Google Scholar] [CrossRef]
  16. Chen, H.; Zhang, X.; Abla, M.; Lü, D.; Yan, R.; Ren, Q.; Ren, Z.; Yang, Y.; Zhao, W.; Lin, P.; et al. Effects of vegetation and rainfall types on surface runoff and soil erosion on steep slopes on the Loess Plateau, China. Catena 2018, 170, 141–149. [Google Scholar] [CrossRef]
  17. Singh, V.P. Effect of spatial and temporal variability in rainfall and watershed characteristics on stream flow hydrograph. Hydrol. Process 1997, 11, 1649–1669. [Google Scholar] [CrossRef]
  18. de Lima, J.L.M.P.; Singh, V.P.; de Lima, M.I.P. The influence of storm movement on water erosion: Storm direction and velocity effects. Catena 2003, 52, 39–56. [Google Scholar] [CrossRef]
  19. de Lima, J.L.M.P.; Tavares, P.; Singh, V.P.; de Lima, M.I.P. Investigating the nonlinear response of soil loss to storm direction using a circular soil flume. Geoderma 2009, 152, 9–15. [Google Scholar] [CrossRef]
  20. Shi, Z.H.; Fang, N.F.; Wu, F.Z.; Wang, L.; Yue, B.J.; Wu, G.L. Soil erosion processes and sediment sorting associated with transport mechanisms on steep slopes. J. Hydrol. 2012, 454–455, 123–130. [Google Scholar] [CrossRef]
  21. Wei, W.; Jia, F.; Yang, L.; Chen, L.; Zhang, H.; Yu, Y. Effects of surficial condition and rainfall intensity on runoff in a loess hilly area, China. J. Hydrol. 2014, 513, 115–126. [Google Scholar] [CrossRef]
  22. Peng, T.; Wang, S.-j. Effects of land use, land cover and rainfall regimes on the surface runoff and soil loss on karst slopes in southwest China. Catena 2012, 90, 53–62. [Google Scholar] [CrossRef]
  23. Yang, S.-R.; Huang, L.-J. Infiltration and Failure Behavior of an Unsaturated Soil Slope under Artificial Rainfall Model Experiments. Water 2023, 15, 1599. [Google Scholar] [CrossRef]
  24. Tu, A.; Xie, S.; Li, Y.; Liu, Z.; Shen, F. Effect of fixed time interval of rainfall data on calculation of rainfall erosivity in the humid area of south China. Catena 2023, 220, 106714. [Google Scholar] [CrossRef]
  25. Tu, A.; Zeng, J.; Liu, Z.; Zheng, H.; Xie, S. Effect of minimum inter-event time for rainfall event separation on rainfall properties and rainfall erosivity in a humid area of southern China. Geoderma 2023, 431, 116332. [Google Scholar] [CrossRef]
  26. Liu, Q.; Su, L.; Zhang, C.; Hu, B.; Xiao, S. Responses of Infiltration Potential and Soil-Erosion Processes to Rainfall Patterns in Two Types of Slopes over the Eastern Region of the Tibetan Plateau. Eurasian Soil Sci. 2022, 55, 1720–1732. [Google Scholar] [CrossRef]
  27. Deng, L.; Zhang, L.; Fan, X.; Sun, T.; Fei, K.; Ni, L. Effects of rainfall intensity and slope gradient on runoff and sediment yield from hillslopes with weathered granite. Environ. Sci. Pollut. Res. 2019, 26, 32559–32573. [Google Scholar] [CrossRef]
  28. Ran, Q.; Wang, F.; Gao, J. Modelling Effects of Rainfall Patterns on Runoff Generation and Soil Erosion Processes on Slopes. Water 2019, 11, 2221. [Google Scholar] [CrossRef] [Green Version]
  29. Wei, W.; Chen, L.; Fu, B.; Huang, Z.; Wu, D.; Gui, L. The effect of land uses and rainfall regimes on runoff and soil erosion in the semi-arid loess hilly area, China. J. Hydrol. 2007, 335, 247–258. [Google Scholar] [CrossRef]
  30. Fang, N.-F.; Shi, Z.-H.; Li, L.; Guo, Z.-L.; Liu, Q.-J.; Ai, L. The effects of rainfall regimes and land use changes on runoff and soil loss in a small mountainous watershed. Catena 2012, 99, 1–8. [Google Scholar] [CrossRef]
  31. Yan, Y.; Jiang, Y.; Guo, M.; Zhang, X.; Chen, Y.; Xu, J. Effects of grain-forage crop type and natural rainfall regime on sloped runoff and soil erosion in the Mollisols region of Northeast China. Catena 2023, 222, 106888. [Google Scholar] [CrossRef]
  32. dos Santos, J.C.N.; de Andrade, E.M.; Medeiros, P.H.A.; Guerreiro, M.J.S.; de Queiroz Palácio, H.A. Effect of Rainfall Characteristics on Runoff and Water Erosion for Different Land Uses in a Tropical Semiarid Region. Water Resour. Manag. 2017, 31, 173–185. [Google Scholar] [CrossRef]
  33. Ministry of Water Resources of the People’s Republic of China. 2021 China Soil and Water Conservation Bulletin. Ministry of Water Resources of the People’s Republic of China Bulletin; Ministry of Water Resources of the People’s Republic of China: Beijing, China, 2022; pp. 22–35. (In Chinese)
  34. Xu, H.; Xu, C.-Y.; Chen, H.; Zhang, Z.; Li, L. Assessing the influence of rain gauge density and distribution on hydrological model performance in a humid region of China. J. Hydrol. 2013, 505, 1–12. [Google Scholar] [CrossRef]
  35. Zhao, J.; Zhang, J.; Hu, Y.; Li, Y.; Tang, P.; Gusarov, A.V.; Yu, Y. Effects of land uses and rainfall regimes on surface runoff and sediment yield in a nested watershed of the Loess Plateau, China. J. Hydrol. Reg. Stud. 2022, 44, 101277. [Google Scholar] [CrossRef]
  36. Huang, Z.; Ouyang, Z.; Li, F.; Zheng, H.; Wang, X. Response of runoff and soil loss to reforestation and rainfall type in red soil region of southern China. J. Environ. Sci. 2010, 22, 1765–1773. [Google Scholar] [CrossRef] [PubMed]
  37. Wischmeier, W.H. A Rainfall Erosion Index for a Universal Soil-Loss Equation. Soil Sci. Soc. Am. J. 1959, 23, 246–249. [Google Scholar] [CrossRef]
  38. Renard, K.G.; Foster, G.R.; Weesies, G.A.; Mccool, D.K.; Yoder, D.C. Predicting Soil Erosion by Water: A Guide to Conservation Planning with the Revised Universal Soil Loss Equation (RUSLE); U.S. Department of Agriculture, Agricultural Research Service: Washington, DC, USA, 1997.
  39. Zhou, H.B.; Gao, J.T. Automatic method for determining cluster number based on silhouette coefficient. Adv. Mater. Res. 2014, 951, 227–230. [Google Scholar] [CrossRef]
  40. Wright, S. Correlation and causation. J. Agric. Sci. 1921, 20, 557–585. [Google Scholar]
  41. Yuan, Z.; Zhou, J.; Guo, M.; Lei, X.; Xie, X. Decision coefficient—The decision index of path analysis. J. Northwest AF Univ. (Nat. Sci. Ed.) 2001, 29, 131–133. (In Chinese) [Google Scholar]
  42. McDonald, J.H. Handbook of Biological Statistics; Sparky House Publishing: Baltimore, MD, USA, 2009; Volume 2. [Google Scholar]
  43. Mohamadi, M.A.; Kavian, A. Effects of rainfall patterns on runoff and soil erosion in field plots. Int. Soil Water Conserv. Res. 2015, 3, 273–281. [Google Scholar] [CrossRef] [Green Version]
  44. Mammadova, U.; Özkale, M.R. Profile monitoring for count data using Poisson and Conway–Maxwell–Poisson regression-based control charts under multicollinearity problem. Comput. Appl. Math. 2021, 388, 113275. [Google Scholar] [CrossRef]
  45. Zhang, C.; Dong, Z.; Gao, B.; Pan, J.; Liu, C.; An, C.; Wu, Q. Effects of Erosive Rainfall Patterns and Different Vegetation Types on Soil Erosion in Slope with Brown Soil. Res. Soil Water Conserv. 2023, 30, 36–41+49. (In Chinese) [Google Scholar] [CrossRef]
  46. Huang, G.; Chen, Y.; Yao, Z. Spatial and temporal evolution characteristics of extreme rainfall in the Pearl River Delta under high urbanization. Adv. Water Sci. 2021, 32, 161–170. (In Chinese) [Google Scholar] [CrossRef]
  47. Yu, l.; Xu, Y.; Zhang, Y. Temporal and spatial variation of rainstorms and the impact of flood disasters due to rainstorms in China in the past 25 years. Torrential Rain Disasters 2018, 37, 67–72. (In Chinese) [Google Scholar]
  48. Li, Y.; Zhao, L.; Zhang, Z.; Li, J.; Hou, L.; Liu, J.; Wang, Y. Research on the Hydrological Variation Law of the Dawen River, a Tributary of the Lower Yellow River. Agronomy 2022, 12, 1719. [Google Scholar] [CrossRef]
  49. Zhang, C.; Duan, X.; Yang, L.; Yue, K.; Zhang, L. Characteristics of precipitation and response of soil moisture to precipitation pulse in meadow steppe: A case of Ergun City in Hulunbuir steppe. Arid. Land. Geogr. 2022, 45, 1881–1889. (In Chinese) [Google Scholar] [CrossRef]
  50. Zhang, Y.-F.; Wang, X.-P.; Hu, R.; Pan, Y.-X. Throughfall and its spatial variability beneath xerophytic shrub canopies within water-limited arid desert ecosystems. J. Hydrol. 2016, 539, 406–416. [Google Scholar] [CrossRef]
  51. Shou, W.; Musa, A.; Liu, Z.; Qian, J.; Niu, C.; Guo, Y. Rainfall partitioning characteristics of three typical sand-fixing shrubs in Horqin Sand Land, north-eastern China. Hydrol. Res. 2016, 48, 571–583. [Google Scholar] [CrossRef] [Green Version]
  52. Palese, A.M.; Vignozzi, N.; Celano, G.; Agnelli, A.E.; Pagliai, M.; Xiloyannis, C. Influence of soil management on soil physical characteristics and water storage in a mature rainfed olive orchard. Soil Tillage Res. 2014, 144, 96–109. [Google Scholar] [CrossRef]
  53. Hartanto, H.; Prabhu, R.; Widayat, A.S.E.; Asdak, C. Factors affecting runoff and soil erosion: Plot-level soil loss monitoring for assessing sustainability of forest management. For. Ecol. Manag. 2003, 180, 361–374. [Google Scholar] [CrossRef]
  54. Vandervaere, J.P.; Peugeot, C.; Vauclin, M.; Angulo Jaramillo, R.; Lebel, T. Estimating hydraulic conductivity of crusted soils using disc infiltrometers and minitensiometers. J. Hydrol. 1997, 188–189, 203–223. [Google Scholar] [CrossRef]
  55. Assouline, S. Rainfall-Induced Soil Surface Sealing: A Critical Review of Observations, Conceptual Models, and Solutions. Vadose Zone J. 2004, 3, 570–591. [Google Scholar] [CrossRef]
  56. Zhao, Q.; Li, D.; Zhuo, M.; Guo, T.; Liao, Y.; Xie, Z. Effects of rainfall intensity and slope gradient on erosion characteristics of the red soil slope. Stoch. Environ. Res. Risk Assess. 2015, 29, 609–621. [Google Scholar] [CrossRef]
  57. Arnaez, J.; Lasanta, T.; Ruiz-Flaño, P.; Ortigosa, L. Factors affecting runoff and erosion under simulated rainfall in Mediterranean vineyards. Soil Tillage Res. 2007, 93, 324–334. [Google Scholar] [CrossRef]
  58. Zhang, Z.; Song, X.; Li, L.; Zhang, L.; Li, H. Response of water and sediment characteristics to different rainfall regime in a typical grassland watershed in the gully region of the Loess Plateau. J. Arid. Land. Resour. Environ. 2020, 34, 108–115. (In Chinese) [Google Scholar] [CrossRef]
  59. Kou, X.; Jiang, X.; Huang, J.; Jin, P.; Lin, L.; Xu, Z.; Li, L. Analysis of Factors Affecting Runoff and Sediment Yield and Its Modelling Construction in Individual Rainfall in Small Watershed of Red Soil Region. Bull. Soil Water Conserv. 2017, 37, 34–42. (In Chinese) [Google Scholar] [CrossRef]
Figure 1. Location map of the study area watershed.
Water 15 02651 g001
Figure 2. Monthly precipitation and monthly average erosive precipitation map of the Culai Mountain watershed for 2021–2022.
Water 15 02651 g002
Figure 3. Graph of aggregation coefficients of different classification numbers.
Water 15 02651 g003
Figure 4. Systematic clustering method spectrum chart. The rainfall serial number is the order of the occurrence of 59 rainfall events, the yellow part is rainfall regime I, the green part is rainfall regime II and the blue part is rainfall regime III.
Water 15 02651 g004
Figure 5. Variability between P, D, and I30 (post hoc comparison results). Bars of the same color with different letters (a, b, c) indicate that the regime of rainfall they represent is significantly different for this indicator.
Water 15 02651 g005
Figure 6. Discriminant analysis results.
Water 15 02651 g006
Figure 7. Relationships between different rainfall characteristic and runoff, sediment yield. (a,e) Relationship between precipitation and runoff, sediment yield, (b,f) Relationship between rainfall duration and runoff, sediment yield, (c,g) Relationship between rainfall intensity and runoff, sediment yield, (d,h) Relationship between maximum 30 min rainfall intensity and runoff, sediment.
Water 15 02651 g007
Figure 8. Proportions of cumulative precipitation, cumulative runoff, and cumulative sediment yield under different rainfall regimes.
Water 15 02651 g008
Table 1. Information on the 11 rainfalls with runoff and sediment production during the study period.
Serial NumberStart Time of RainfallEnd Time of RainfallP (mm)D (h)I (mm·h−1)I30 (mm·h−1)W (m3)S (kg)
162021/07/08 17:382021/07/08 21:0917.503.524.9720.2034,675.9012,800.00
172021/07/09 03:572021/07/09 10:2817.506.502.6930.0025,468.819830.00
192021/07/12 19:592021/07/13 07:5718.5011.971.5517.0016,500.636470.00
252021/07/28 09:252021/07/29 08:45155.0023.336.6426.0060,525.3325,900.00
342021/08/29 14:252021/08/31 21:3897.5055.221.7761.0052,463.5625,890.00
362021/09/04 05:152021/09/05 16:4847.5035.561.3411.0023,129.289340.00
372021/09/18 10:582021/09/20 08:39121.5045.682.6644.0051,132.0325,160.00
392021/09/25 21:412021/09/27 01:5675.5028.252.6731.0040,578.3118,410.00
512022/06/26 13:232022/06/27 21:08117.1031.753.6963.7460,175.4626,530.00
522022/07/05 12:012022/07/06 13:0582.2025.083.2823.3645,640.0414,330.00
562022/07/28 04:052022/07/29 01:0649.1021.002.3434.4027,561.4816,980.00
Table 2. Pearson correlation coefficient matrix of rainfall characteristic indicators, runoff, and sediment yield in Culai Mountain watershed.
PDII30WS
P1
D0.631 *1
I0.442−0.3241
I300.5230.591−0.0391
W0.910 **0.5250.5570.660 *1
S0.894 **0.647 *0.3860.786 **0.925 **1
Notes: ** indicates significant correlation at the 0.01 level; * indicates significant correlation at the 0.05 level.
Table 3. Results of K-means clustering method. The rainfall serial number is the order of the occurrence of 59 rainfall events.
Rainfall RegimeRainfall Serial Number
I1 2 3 4 5 6 7 8 9 10 11 12 13 14 15 16 17 18 19 20 21 22 23 24
26 27 28 29 30 31 32 33 35 38 40 41 42 43 44 45 46 49 54 58
II36 39 47 48 50 52 53 55 56 57 59
III25 34 37 51
Table 4. Skewness coefficient (S) and kurtosis coefficient (K) for each rainfall regime indicator.
Rainfall RegimeRainfall IndicatorSkewness Coefficient (S)Kurtosis Coefficient (K)
IP1.8671.243
D5.8016.752
I303.7341.307
IIP1.8520.202
D0.1491.338
I300.0760.209
IIIP0.8270.665
D1.0640.050
I300.8020.506
Table 5. ANOVA results for different rainfall regimes P, D, and I30.
PDI30
Test methodWelch’s ANOVAOne-Way ANOVA
Statistical value71.48122.51826.998
Significance<0.0010.001<0.001
Table 6. Features of different rainfall regimes.
Rainfall
Regime
Rainfall IndicatorFrequencyThe
of Rainfall Event with Runoff and Sediment Production
P (mm)D (h)I30 (mm·h−1)
IMean7.3864.47511.165443
V252.0000.5003.188
V7512.0006.62815.383
IIMean49.13618.05329.745114
V2537.0008.00023.360
V7560.60026.00035.000
IIIMean122.77543.23348.68544
V25102.40031.43530.500
V75146.62559.54863.055
Table 7. Results of the multiple linear regression analysis of runoff and sediment yield in Culai Mountain watershed.
Rainfall IndicatorVIFRunoff (Y1)Sediment Yield (Y2)
Regression CoefficientStandardized CoefficientsSignificance (p)Regression CoefficientStandardized CoefficientsSignificance (p)
Precipitation (X1)7.56697.5570.2980.23842.7130.2680.208
Rainfall duration (X2)6.921301.5540.3090.205156.6810.3300.119
Rainfall intensity (X3)4.9955253.3130.5390.0271864.5680.3930.044
Maximum 30 min rainfall intensity (X4)1.633308.8650.3430.018204.7320.4670.002
Constant value −1378.781 −2207.69
R2 0.9590.971
Table 8. Results of the path analysis of the influence of each rainfall characteristic indicator on the runoff (Y1) in Culai Mountain watershed.
Rainfall IndicatorCorrelation CoefficientsDirect Path CoefficientIndirect Path CoefficientDecision Coefficient
X1-Y1X2-Y1X3-Y1X4-Y1Total
X10.910 **0.298 0.094−0.2710.3560.1790.454
X20.5250.3090.194 0.1980.4030.7950.229
X30.5570.5390.136−0.048 −0.0270.0610.310
X40.660 *0.3430.1610.0880.024 0.2730.335
Notes: ** indicates significant correlation at the 0.01 level; * indicates significant correlation at the 0.05 level.
Table 9. Results of the path analysis of the influence of each rainfall characteristic indicator on the sediment yield (Y2) in Culai Mountain watershed.
Rainfall IndicatorCorrelation CoefficientsDirect Path CoefficientIndirect Path CoefficientDecision Coefficient
X1-Y2X2-Y2X3-Y2X4-Y2Total
X10.894 **0.268 0.2080.1740.2440.6260.407
X20.647 *0.3300.169 −0.1270.2760.3180.318
X30.3860.3930.119−0.107 −0.018−0.0060.149
X40.786 **0.4670.1400.195−0.015 0.3200.516
Notes: ** indicates significant correlation at the 0.01 level; * indicates significant correlation at the 0.05 level.
Disclaimer/Publisher’s Note: The statements, opinions and data contained in all publications are solely those of the individual author(s) and contributor(s) and not of MDPI and/or the editor(s). MDPI and/or the editor(s) disclaim responsibility for any injury to people or property resulting from any ideas, methods, instructions or products referred to in the content.

