Article

Denitrification Assays for Testing Effects of Xenobiotics on Aquatic Denitrification and Their Degradation in Aquatic Environments

by
Kristína Pániková
1,
Gabriele Weigelhofer
2,3,*,
Zuzana Bílková
4 and
Jitka Malá
1
1
Institute of Chemistry, Faculty of Civil Engineering, Brno University of Technology, 602 00 Brno, Czech Republic
2
Institute of Hydrobiolgy and Aquatic Ecosystem Management, University of Natural Resources and Life Sciences Vienna, 1180 Vienna, Austria
3
WasserCluster Lunz—Biological Station, 3293 Lunz am See, Austria
4
RECETOX, Faculty of Science, Masaryk University, 611 37 Brno, Czech Republic
*
Author to whom correspondence should be addressed.
Water 2023, 15(14), 2536; https://doi.org/10.3390/w15142536
Submission received: 18 June 2023 / Revised: 6 July 2023 / Accepted: 7 July 2023 / Published: 11 July 2023

Abstract

:
We developed, tested, and optimized two laboratory denitrification assays for both managers and scientists to assess the effects of xenobiotics on the denitrification process over 7 days (short batch assay, SBA) and 28 days (long semi-continuous assay, LSA). The assays facilitate (1) measuring the efficiency of nitrate removal under the influence of xenobiotics, (2) determining the removal of the tested xenobiotics via adsorption or biotic decomposition, and (3) testing the influencing parameters for optimizing the denitrification process. The adsorption of the xenobiotics was assessed by inhibiting all biological processes through the addition of HgCl2. Our tests demonstrate that the ratio of the initial nitrate concentration to the amount of bioavailable organic matter provided is essential to avoid organic carbon or nitrate limitation. While a pH < 7 resulted in decreased denitrification, a pH > 8 led to nitrite accumulation, indicating incomplete denitrification. Over durations of more than a week, weekly replenishments of the nitrate and HgCl2 and weekly purging with argon gas to reduce the oxygen concentrations are needed. The assays provide information about the accumulation of xenobiotics in the bioreactors that is necessary for the environmentally friendly treatment of the bioreactor fillings and provide insight into the potential of the bioreactors to remove pesticides from polluted water resources.

Graphical Abstract

1. Introduction

Denitrification is an important process in aquatic ecosystems, as it permanently removes nitrate from polluted surface and subsurface waters [1,2,3], thus preventing the harmful effects of nitrogen accumulation on both the aquatic system and human health [4,5]. Denitrification is the facultative anaerobic reduction of nitrate (NO3) to nitrous oxide (N2O) and di-nitrogen (N2) by denitrifying organisms, such as bacteria, archaea, and fungi, in the presence of an organic substrate as an energy source [6,7]. Key natural sites for denitrification are organic-rich, largely anoxic sediments in rivers, wetlands, and lakes, where the interactions between different water flows and denitrifying microbes create spots of high biogeochemical reactivity [6,8]. In nitrate-loaded subsurface waters in intensively used agricultural areas, denitrifying bioreactors can be used as a cost-effective, durable, and easily maintainable technology for effective nitrate removal [5,9]. Denitrifying bioreactors are devices filled with (mostly) particulate organic material that can be installed in groundwater [10], drainage waters [11,12,13], and stream sediments [14] to optimize nitrate removal via denitrification [15].
In agricultural regions, nitrogen pollution often comes along with pollution by various other potentially harmful substances, such as pesticides and veterinary antibiotics. These substances may accumulate in subsurface sediments, waters, and denitrifying bioreactors [16,17], where they can inhibit or also stimulate certain steps of the denitrification process, thus changing the denitrification rates and reducing the denitrification efficiency [18]. The toxic effects of these xenobiotics on the denitrifying community depend on the substrate type, concentration, and exposure time, and may increase in mixtures of different substances due to synergistic effects [19,20]. Independent of their effects on denitrification, pesticides and antibiotics can be decomposed and/or adsorbed within bioreactors and, thus, be removed from the aquatic system [21,22,23]. However, the decomposition of xenobiotics can result in metabolites with an even higher toxicity than the original substrate [16,17].
For both aquatic research and water management, it is important to understand the effects of xenobiotics on the denitrification efficiency of denitrifying bioreactors and the fate of these substances within the bioreactors. While lab-scaled denitrifying bioreactors enable good insight into the processes under near-natural flowing conditions [24,25,26], their construction and maintenance are time-consuming, are costly, and need sufficient space often not available in commercial laboratories. Laboratory batch experiments provide an effective, low-effort, and low-cost alternative for studying denitrification in bioreactors [27,28]. However, so far, no consistent and standardized methods exist that enable comparisons and generalizations of the results from different xenobiotic studies. Operational procedures vary in the initial NO3-N concentrations, the ratio between the substrate and the volume of the medium, the pH buffering, and the method of establishing anoxic conditions, to name just a few examples. What is more, the influence of the experimental design on the study results is rarely tested. In this paper, we present easily applicable, tested, and optimized denitrification assays to assess the inhibitory or stimulating effects of xenobiotics on the denitrification process in denitrifying bioreactors and to track the fate of xenobiotics during the denitrification process. The assays facilitate (1) measuring the efficiency of the nitrate removal under the influence of xenobiotics, (2) determining the removal of the tested xenobiotics via adsorption or biotic decomposition, and (3) testing various influencing parameters for optimizing the denitrification process, such as the initial nitrate concentrations, amount and fractions of wood shavings, and pH. We discuss the test results of the optimization process of the assays and demonstrate the applicability and potential of the methods via a case study on the effect of metolachlor on the denitrification in woodchip reactors. We selected metolachlor for testing the method, as this chloroacetanilide herbicide is one of the most frequently used herbicides applied to maize crops and it belongs to the most frequently detected herbicides in Central European groundwater [29].

2. Materials and Methods

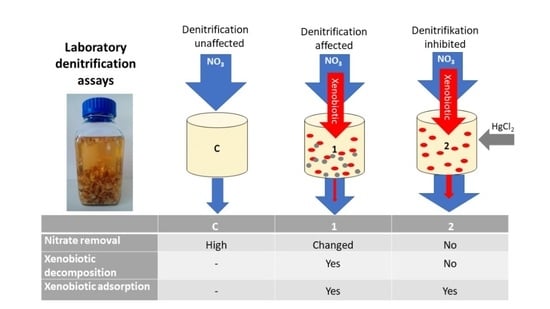
2.1. Design of the Laboratory Denitrification Assays

The assays were designed as a seven-day “short” batch assay (SBA) to test the effects of xenobiotics on the denitrification and a twenty-eight-day “long” semi-continuous assay (LSA) to examine both the temporal changes in the nitrate removal and the fate of the xenobiotics. Both assays were performed in two-liter glass bottles in aqueous solutions under controlled laboratory conditions.
The assays are based on the comparison of the denitrification rates and the concentrations of the tested xenobiotics and their metabolites in three treatments: C (control)—denitrification in progress without any disturbance; treatment T1—the xenobiotics present can influence the denitrification and undergo both biotic decomposition and abiotic adsorption; and treatment T2—the addition of an inhibitor stops the denitrification and other biological processes, and the tested xenobiotics can undergo only adsorption. Various substances can be used to inhibit biological processes, such as sodium azide [30]. As mercuric chloride has proven to be an efficient inhibitor of bacterial activities [31] (ISO 8192:2007), it was used for T2 in this study.
The denitrification rate, rD, is calculated as:
r D = c N O X - N i n i t c ( N O X - N ) e n d n   [ m g L 1 d 1 ]
where c(NOX-N)init is the initial concentration of nitrate-nitrogen, c(NOx-N)end is the final concentration of nitrate- and nitrite-nitrogen, and n is the duration of the assay expressed in days. The effect of the tested xenobiotics on the denitrification, INH(den), is assessed using the difference of the denitrification rates, rD, in treatments C and T1 as follows:
I N H d e n = r D C r D T 1 r D C 100   [ % ]
The loss of the tested xenobiotics in T1, D(xen)tot, corresponds to the total loss caused by both biotic and abiotic processes:
D ( x e n ) t o t = c ( x e n ) T 1 i n i t c x e n T 1 e n d   [ µ g L 1 ]
where c(xen)T1 init and c(xen)T1 end are the initial and final concentrations of the tested xenobiotics in T1, respectively. The loss of the tested xenobiotics via abiotic processes (D(xen)abio) is calculated from T2 as:
D ( x e n ) a b i o = c ( x e n ) T 2 i n i t c x e n T 2 e n d   [ µ g L 1 ]
where c(xen)T2 init and c(xen)T2 end are the initial and final concentrations of the tested xenobiotics in T2, respectively. The biotic loss (D(xen)bio) can be calculated as the difference between the total and the abiotic losses:
D ( x e n ) b i o = D ( x e n ) t o t D x e n a b i o   [ µ g L 1 ]
Due to the usually low solubility in water, the tested xenobiotics need to be dissolved in methanol. As methanol fosters denitrification [32], the same volume of methanol must be added to the control treatment, C. Wood shavings from poplar (Populus sp.) trees were used as a suitable source of easily biodegradable organic compounds in the assays [9]. However, the dissolved organic compounds released from wood shavings are acidic, potentially inhibiting denitrification [33]. To avoid this effect, NaHCO3 was added as a buffer. To remove dissolved oxygen (DO) from the water and provide anoxic conditions right at the beginning of the assays, we propose purging the reaction system with argon [27]. In this study, we used argon gas purchased from Linde Gas (Czech Republic) at a purity of 99.996%.

2.2. Procedure

We tested the following conditions in the SBA to optimize the assays:
(1)
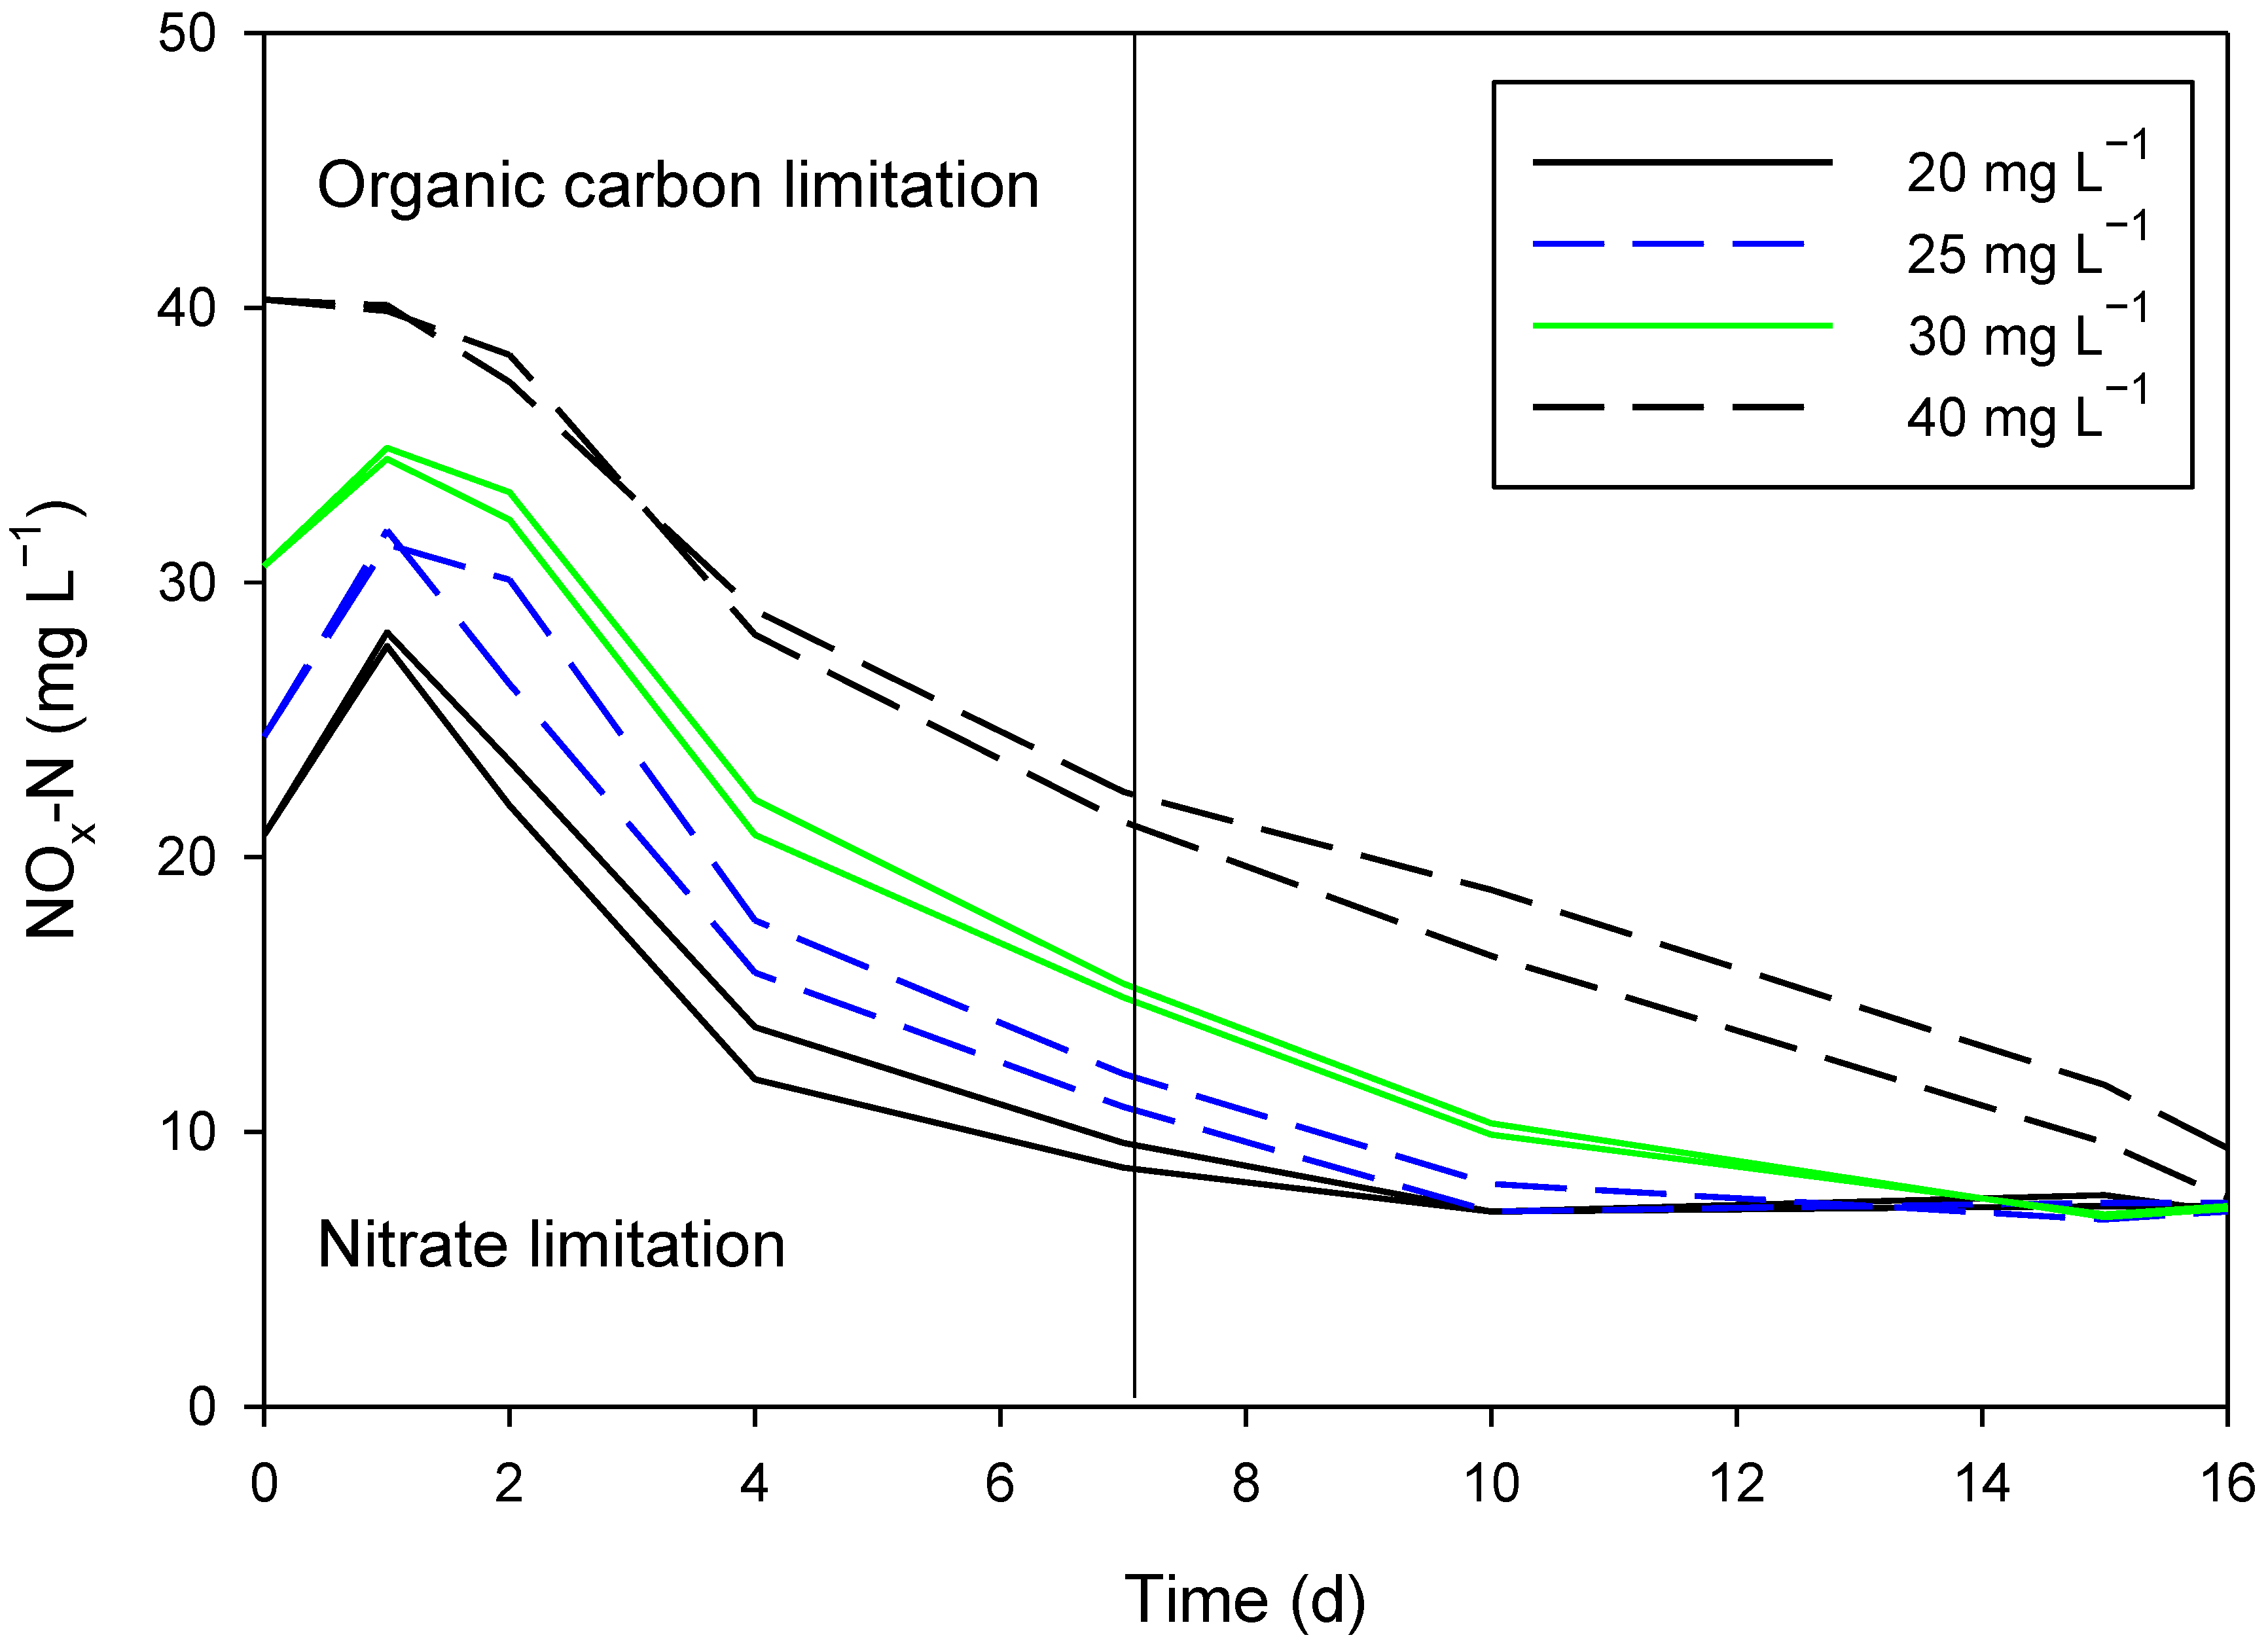
Initial NO3-N concentrations (pre-test, 20–40 mg L−1; test, 15 and 30 mg L−1) (test conditions: 12.5 g L−1 wood shavings, 10–15 mm fraction, and 0.5 g L−1 NaHCO3);
(2)
Concentrations of poplar wood shavings (7.5, 12.5, and 25 g L−1) (test conditions: 10–15 mm fraction, 0.5 g L−1 NaHCO3, and 15 mg L−1 NO3-N);
(3)
Fraction of wood shavings (0.5–1.0 cm and 1.0–1.5 cm) (test conditions: 12.5 g L−1 wood shavings, 0.5 g L−1 NaHCO3, and 15 mg L−1 NO3-N);
(4)
Concentrations of NaHCO3 (0, 0.5, 1.0, and 2.0 g L−1) (test conditions: 12.5 g L−1 wood shavings, 10–15 mm fraction, and 15 mg L−1 NO3-N).
The optimal conditions for the tests were selected based on the following parameters: (1) the denitrification rate (rD; the higher, the better); (2) the variability (the lower, the better); (3) the turbidity (the lower, the better); (4) the chemical oxygen demand (COD); and (5) the pH. All tests were performed after purging with argon. In addition, we tested the effect of argon purging on the dissolved oxygen concentrations (optimum is <0.5 mg L−1) [34] and the denitrification rates, rD, compared to non-purged samples in the SBA.
The SBA (short batch assay) was performed using 4 replicates per treatment in this study. At the beginning of each test, 2 L bottles are filled with clean poplar wood shavings and 2000 mL of a solution prepared from deionized water (DIW) with the addition of NaHCO3 and KNO3 (as nitrate sources) (Table 1). The bottles are purged with argon until the DO concentrations are below 0.5 mg L−1. The bottles are closed and incubated at T = 20 ± 0.5 °C in the dark. After 48 h, 25 mL water samples are taken from each bottle and the concentrations of NOX-N and DO as well as the pH are analyzed. The bottles are then divided into three groups for the different treatments, C, T1, and T2, and the respective reagents are added (Table 1). After mixing, 10 mL water samples are taken from all the treatments and the samples from T1 and T2 are immediately analyzed for the initial concentrations of the tested xenobiotics. The bottles are closed and incubated at T = 20 ± 0.5 °C in the dark. The test is terminated after 7 days. In our study, water samples from T1 and T2 were collected for the analyses of the tested xenobiotic and their metabolites immediately after opening the bottles, and then the DO concentrations, the pH, and the COD were measured. However, we recommend measuring the DO concentrations before collecting the water samples to avoid changes due to exposure to air. The remaining liquid phase is filtered through qualitative filter paper (KA2, mesh size: 8 μm) and the NO2-N and NOx-N concentrations are determined in the supernatant.
The LSA (long semi-continuous assay) differs from the SBA in the following features: every seven days, 25 mL water samples are taken from each treatment for the analyses of NOX-N and also for an analysis of the tested xenobiotics and their metabolites in T1 and T2. Additionally, the nitrate concentrations are replenished in C and T1 by adding a KNO3 solution to each bottle so that the same concentration of NOX-N is reached as at the beginning. After adding the solution, the bottles are closed and incubated again. The LSA is terminated after 28 days. In this study, we also used 4 replicates for the LSA.
The dose of KNO3 added every seven days is calculated as:
V r e q = c ( N O X - N ) r e q × V i n i t V t a k + V a d d c N O X - N i n i t × V i n i t V t a k + V a d d c ( K N O 3 ) a d d c ( N O X - N ) r e q   [ m L ]
where c(NOX-N)req is the required concentration of NOX-N in the bottle; Vinit, Vtak, and Vadd are the initial volume, the volume taken from the bottle, and the volume added to the bottle, respectively; and c(KNO3)add is the concentration of the added KNO3 solution.
The xenobiotic concentration is diluted by the volume of KNO3 added to the bottle. Thus, for comparisons of T1 and T2, the concentration in T1 needs to be recalculated as follows:
c ( x e n ) T 1 e n d = c ( x e n ) T 1 e n d m × 1 + D i l   [ n g   m L 1 ]
D i l = 1 c x e n T 1 D i l c x e n T 1 i n i t   [ % ]
c ( x e n ) T 1 D i l = V i n i t V t a k + V a d d × c ( x e n ) T 1 i n i t V i n i t V t a k + V a d d + V K N O 3   [ n g   m L 1 ]
where c(xen)T1 end m is the measured concentration of the xenobiotics at the end of the assay; Dil is the dilution factor; c(xen)T1 Dil and c(xen)T1 init are the initial and the diluted concentrations of the xenobiotics, respectively; and Vinit, Vtak, Vadd, and VKNO3 are the initial volume, the volume taken from the bottle, the volume added to the bottle, and the added volume of KNO3 to the bottle, respectively.

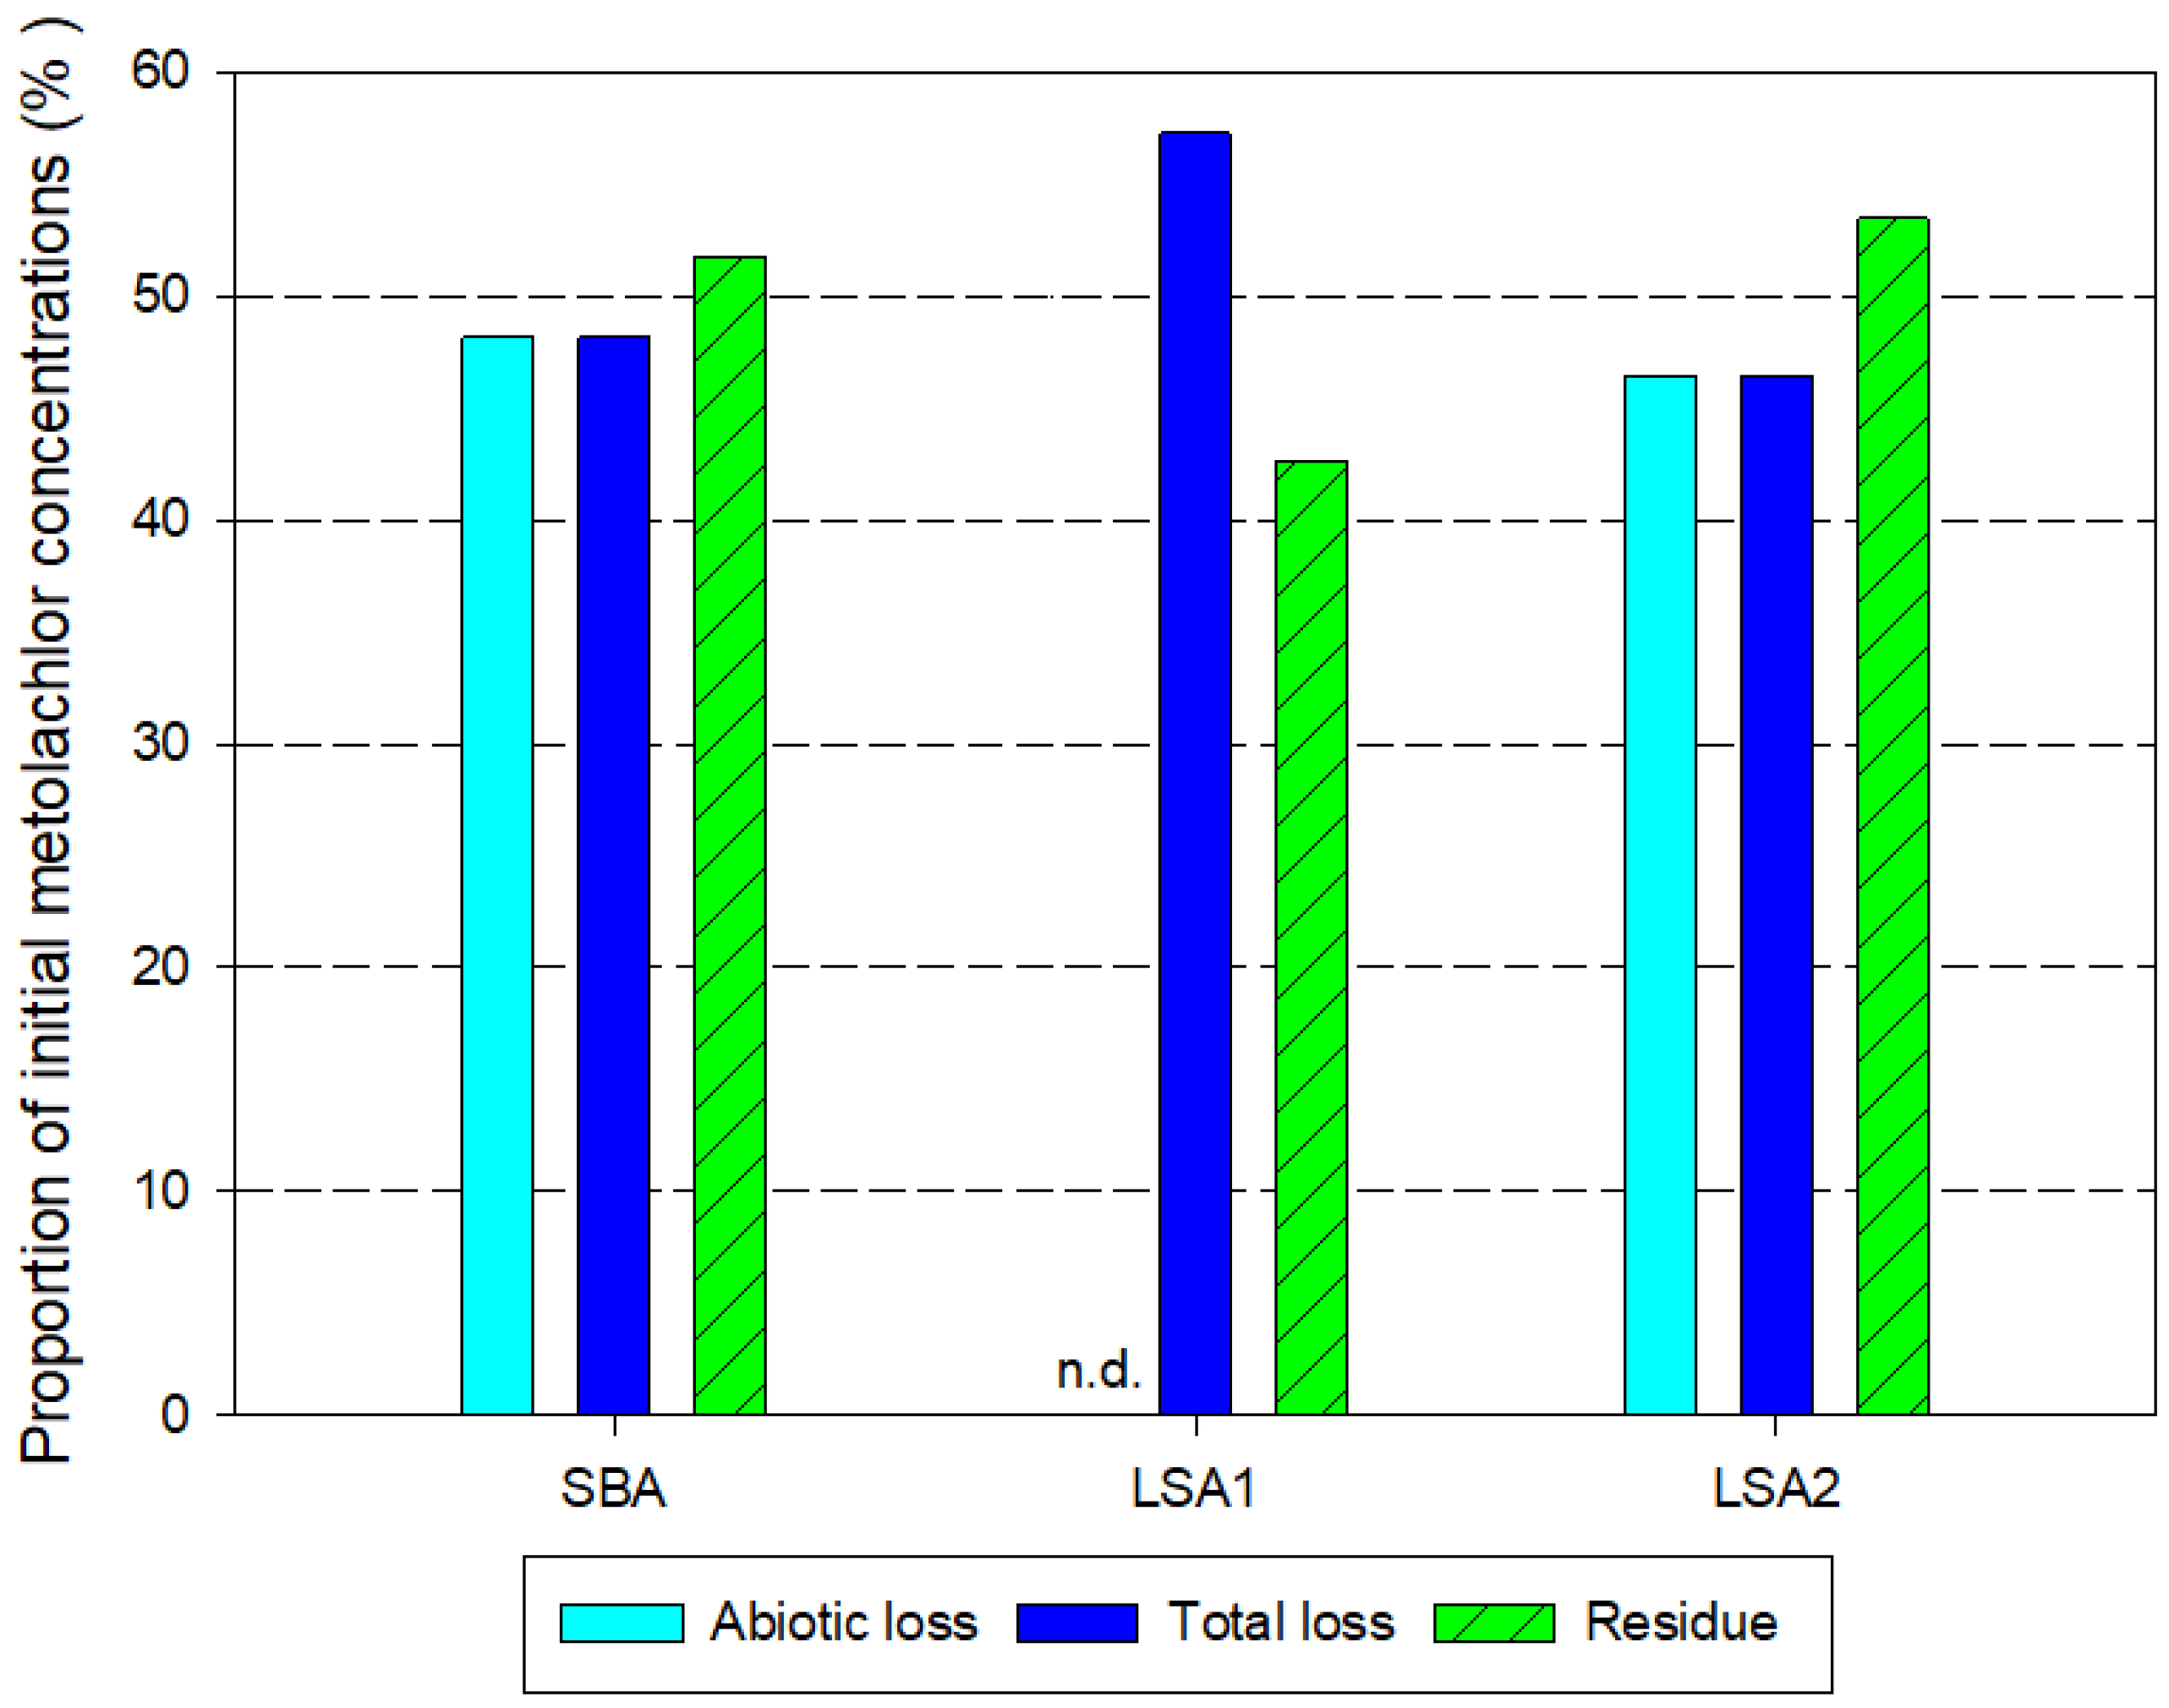
2.3. Validation of Tests with Metolachlor

The effect of the herbicide metolachlor on denitrification was tested via both an SBA and an LSA. The metolachlor analytical standard (PESTANAL® product line) was purchased from Sigma-Aldrich (Germany) at ≥98% purity. The stock solution was prepared in analytical-grade methanol at a concentration of 1000 mg L−1 and was stored in the dark at 4 °C. Metolachlor was added to reach a final concentration of 100 ng mL−1 in the incubation bottles.
The test conditions were set as follows: 12.5 g L−1 of wood shavings (10–15 mm), 0.5 g L−1 of NaHCO3, and either 30 mg L−1 (SBA) or 15 mg L−1 (LSA) for the initial NO3-N concentration. The samples were purged with Ar at the start of the assay.
Immediately after opening the bottles, metolachlor was extracted from the water samples using solid-phase extraction (SPE) cartridges (Oasis HLB, 6 mL, 0.5 g HLB sorbent material) (Waters, Milford, MA, USA) activated with 7.5 mL of methanol:acetone (3:2) (Sigma-Aldrich, Steinheim, Germany). A 5 mL water sample and 100 µL of the internal standard (IS) epoxiconazol (c = 5 μg mL−1) were passed through the SPE cartridge. The SPE columns were washed with DIW and air-dried for 5 min, and the adsorbed pesticide was eluted with 5 mL of methanol:acetone (3:2). After the SPE, the samples were stored in the dark at 4 °C until the high-performance liquid chromatography (HPLC) analysis was performed, using an Agilent 1200 chromatographic system (Agilent, Santa Clara, CA, USA) equipped with an Agilent Triple Quad 6410 mass spectrometer (Agilent, Santa Clara, CA, USA). The mean water recovery of the pesticide was 98%, and the limit of quantification (LOQ) achieved was 1 µg L−1. We could not test for metabolites due to an analytical shortage.
The laboratory analyses for both the assay optimization and the metolachlor experiment were performed as follows: the pH and DO concentrations were determined with a Hach HQ40D multi meter (Hach Lange GmBH, Düsseldorf, Germany); the chemical oxygen demand, COD, was assessed at 445 nm with a DR3900 spectrophotometer (Hach Lange GmBH, Düsseldorf, Germany; ISO 8192:2007); and the NOX-N concentrations were determined via the UV absorption method (Harris 2003) with a Hach optical Nitratax plus sc Sensor (Hach Lange GmBH, Düsseldorf, Germany). The probe was originally intended for the NOX-N analysis in activated sludge. It was adapted to laboratory measurements in order to avoid the results being affected by organic substances leached from the woodchips. The NO2-N concentrations were measured via a spectrophotometric analysis with sulphanilic acid and 1-naphtylamine at 515 nm (Fresenius et al. 1988) using a DR3900 spectrophotometer (Hach Lange GmBH, Düsseldorf, Germany). The turbidity was measured at 560 nm with a DR3900 spectrophotometer (Hach Lange GmBH, Düsseldorf, Germany).

2.4. Statistics

The differences between the sets of test variables were investigated using an analysis of variance. If a significant difference was detected among the treatments, the Welch two-sample t-test was performed. The statistical analyses were performed using the R software version 3.0.2 (R Development Core Team, 2019; http://www.R-project.org, accessed on 1 June 2022).

3. Results and Discussion

3.1. Evaluation of the SBA and LSA Optimization

Table 2 shows the results of the optimization tests for the 7-day SBA. The wood shavings serve as an electron donor during the oxidation–reduction reaction of denitrification [35]. Based on the stoichiometry, a COD of 2.86 g is theoretically needed for the reduction of 1 g of NO3-N to N2. The real COD is higher, since part of the substrate is used for biomass synthesis and also due to the biodegradation of the substrate [36,37]. Our test results yielded significantly different COD values between the treatments, with the COD increasing with increasing amounts of wood shavings from 83 to 390 mg L−1 (Table 2). However, the denitrification rates were similar among the treatments, ranging between 1.3 and 1.6 mg L−1 d−1 for an initial NO3-N concentration of 15 mg L−1. This indicates that the lowest COD was already sufficient for denitrification, which agrees with the findings of the authors of [38]. They proposed a minimum COD/N ratio between 3.5 and 5 to facilitate complete denitrification. Our ratios amounted to 5.5, 9.8, and 26 for the low, medium, and high wood shaving concentrations, respectively, whereby these numbers represent the residual COD after the denitrification, not the initial COD. However, with increasing amounts of wood shavings, the turbidity in the water samples increases, causing problems during subsequent photometric measurements. In our test, the turbidity increased significantly from the low to the high concentrations of wood shavings, with the lowest value of 7.7 ± 0.3 ZF already requiring filtration of the samples (Table 2). Thus, based on the COD and the turbidity, the lowest concentration of wood shavings was considered the best option for the SBA.
The initial NO3-N concentrations need to be adjusted to the amount of wood shavings so that the turbidity remains low and the COD/N ratio ensures sufficiently high denitrification rates to be measured. Low denitrification rates may arise from both COD/N ratios below 3.5 (i.e., high amounts of NO3-N compared to low amounts of wood shavings, resulting in carbon limitation) and COD/N ratios far above 5. In the second case, the initial NO3-N concentrations need to ensure denitrification throughout the 7-day test without reaching nitrate-limiting conditions (i.e., sufficient NOX-N needs to be present until the end of the test). Furthermore, the NOX-N changes need to lie clearly above the detection limit of the respective laboratory. With a detection limit of 1 mg L−1 of NOX-N for our lab, we set the minimum required denitrification rate at 1.5 mg L−1 of NOX-N over 7 days or 0.21 mg L−1 d−1 of NOX-N. Finally, the focus of the respective assays was to also determine the initial NO3-N concentrations used to enable comparability with the real situation (e.g., waste water, agricultural streams, etc.). Figure 1 shows the temporal development of the NOX-N concentrations for different initial NO3-N concentrations in a pre-test over 16 days. With the exception of the highest N concentration of 40 mg L−1, the NOX-N concentrations increased during the first day and showed an exponential decline afterwards. All curves flattened at about 7 mg L−1 of NOX-N, below which the denitrification rates did not differ from zero anymore (linear regression, p > 0.05). At this point, the denitrification was nitrate-limited. Another flattening of the curves was observed at very high NOX-N concentrations (30 and 40 mg L−1) during days 1 and 2, indicating that the process was carbon-limited at that time. Interestingly, all tests showed an initial increase in the NOX-N concentrations, which was greater at lower starting NO3-N concentrations. We explain this peak by an initial short leaching of nitrate from the wood shavings [13].
Our SBA tests with 15 and 30 mg L−1 initial NO3-N concentrations yielded denitrification rates of 0.6 mg L−1 d−1 (i.e., above the detection limit) and NOX-N end concentrations of >11 mg L−1 (Table 2). Thus, the starting concentration of 15 mg L−1 of NO3-N fulfilled our criteria for the SBA and was selected for all further analyses, as it resembled the real NOX-N concentrations in agricultural catchments more closely than higher nitrate concentrations.
The optimal pH for denitrification lies between 7.0 and 8.0 according to the literature [33,35]. A decrease in the pH causes an increase in the proportion of undissociated HNO2 (the intermediate product of denitrification) in the total NO2-N. The authors of [39] observed a significant inhibition of denitrification at a pH of 6.5. The same study also reported an accumulation of nitrite during denitrification with an increasing pH from 7.5 to 9.0 owing to alkalization [40]. The NaHCO3 additions significantly affected the pH in our tests, but only concentrations of 0.5 g L−1 and 1.0 g L−1 of NaHCO3 provided the required pH (Table 2). The denitrification rates were similar among the NaHCO3 treatments, even at pH values higher than the optimum. However, in alkaline conditions, we observed increased NO2-N concentrations at the end of the tests, indicating that the denitrification processes already ended after the first step of nitrate reduction to nitrite [6]. Under optimal pH conditions, nitrites are further reduced to N2O, but at higher pH values, nitrites can accumulate during the denitrification process [40]. Thus, while the alkaline pH did not significantly affect the experimental conditions, it reduced the efficiency of the denitrification and resulted in the accumulation of environmentally harmful substances. In the treatment without NaHCO3, the pH was lower than the optimum, also showing a significantly lower rD value. Thus, NaHCO3 concentrations between 0.5 g L−1 and 1.0 g L−1 proved suitable for keeping the pH in the required range during the test.
The fractions of the wood shavings did not affect the results significantly (Table 2). However, we recommend using the larger fraction due to less compaction at the bottom of the bottles during the test and more comfortable manipulation.
The upper oxygen threshold, which may inhibit denitrification, ranges from 0.19 to 2 mg L−1 of DO [41]. At the beginning of the tests, DO was present in the test suspension and there was an air headspace in the test bottles. Thus, in order to stimulate the establishment of anoxic conditions, purging with argon or helium is proposed in the literature [27,28,42]. We compared the development of the DO concentrations and the denitrification rates in samples purged with argon, with initial DO concentrations of 0.5 mg L−1, to those without purging. After two days, the average DO concentration in the purged samples was 0.26 mg L−1, while the DO concentrations in the unpurged samples were around 0.8 mg L−1 (Table 2). After 7 days, the DO concentrations in the unpurged samples, however, were already at 0.4 mg L−1, demonstrating the high oxygen consumption in the SBA. Despite the slightly higher DO concentrations in the unpurged samples at the beginning, the denitrification rates, rD, did not differ between the two treatments (Table 2). This confirms the study in [41], in which ongoing denitrification was found up to a threshold of 2 mg L−1 of DO. Thus, purging with argon is not required, but is recommended to facilitate the fast establishment of anoxic conditions during the SBA.

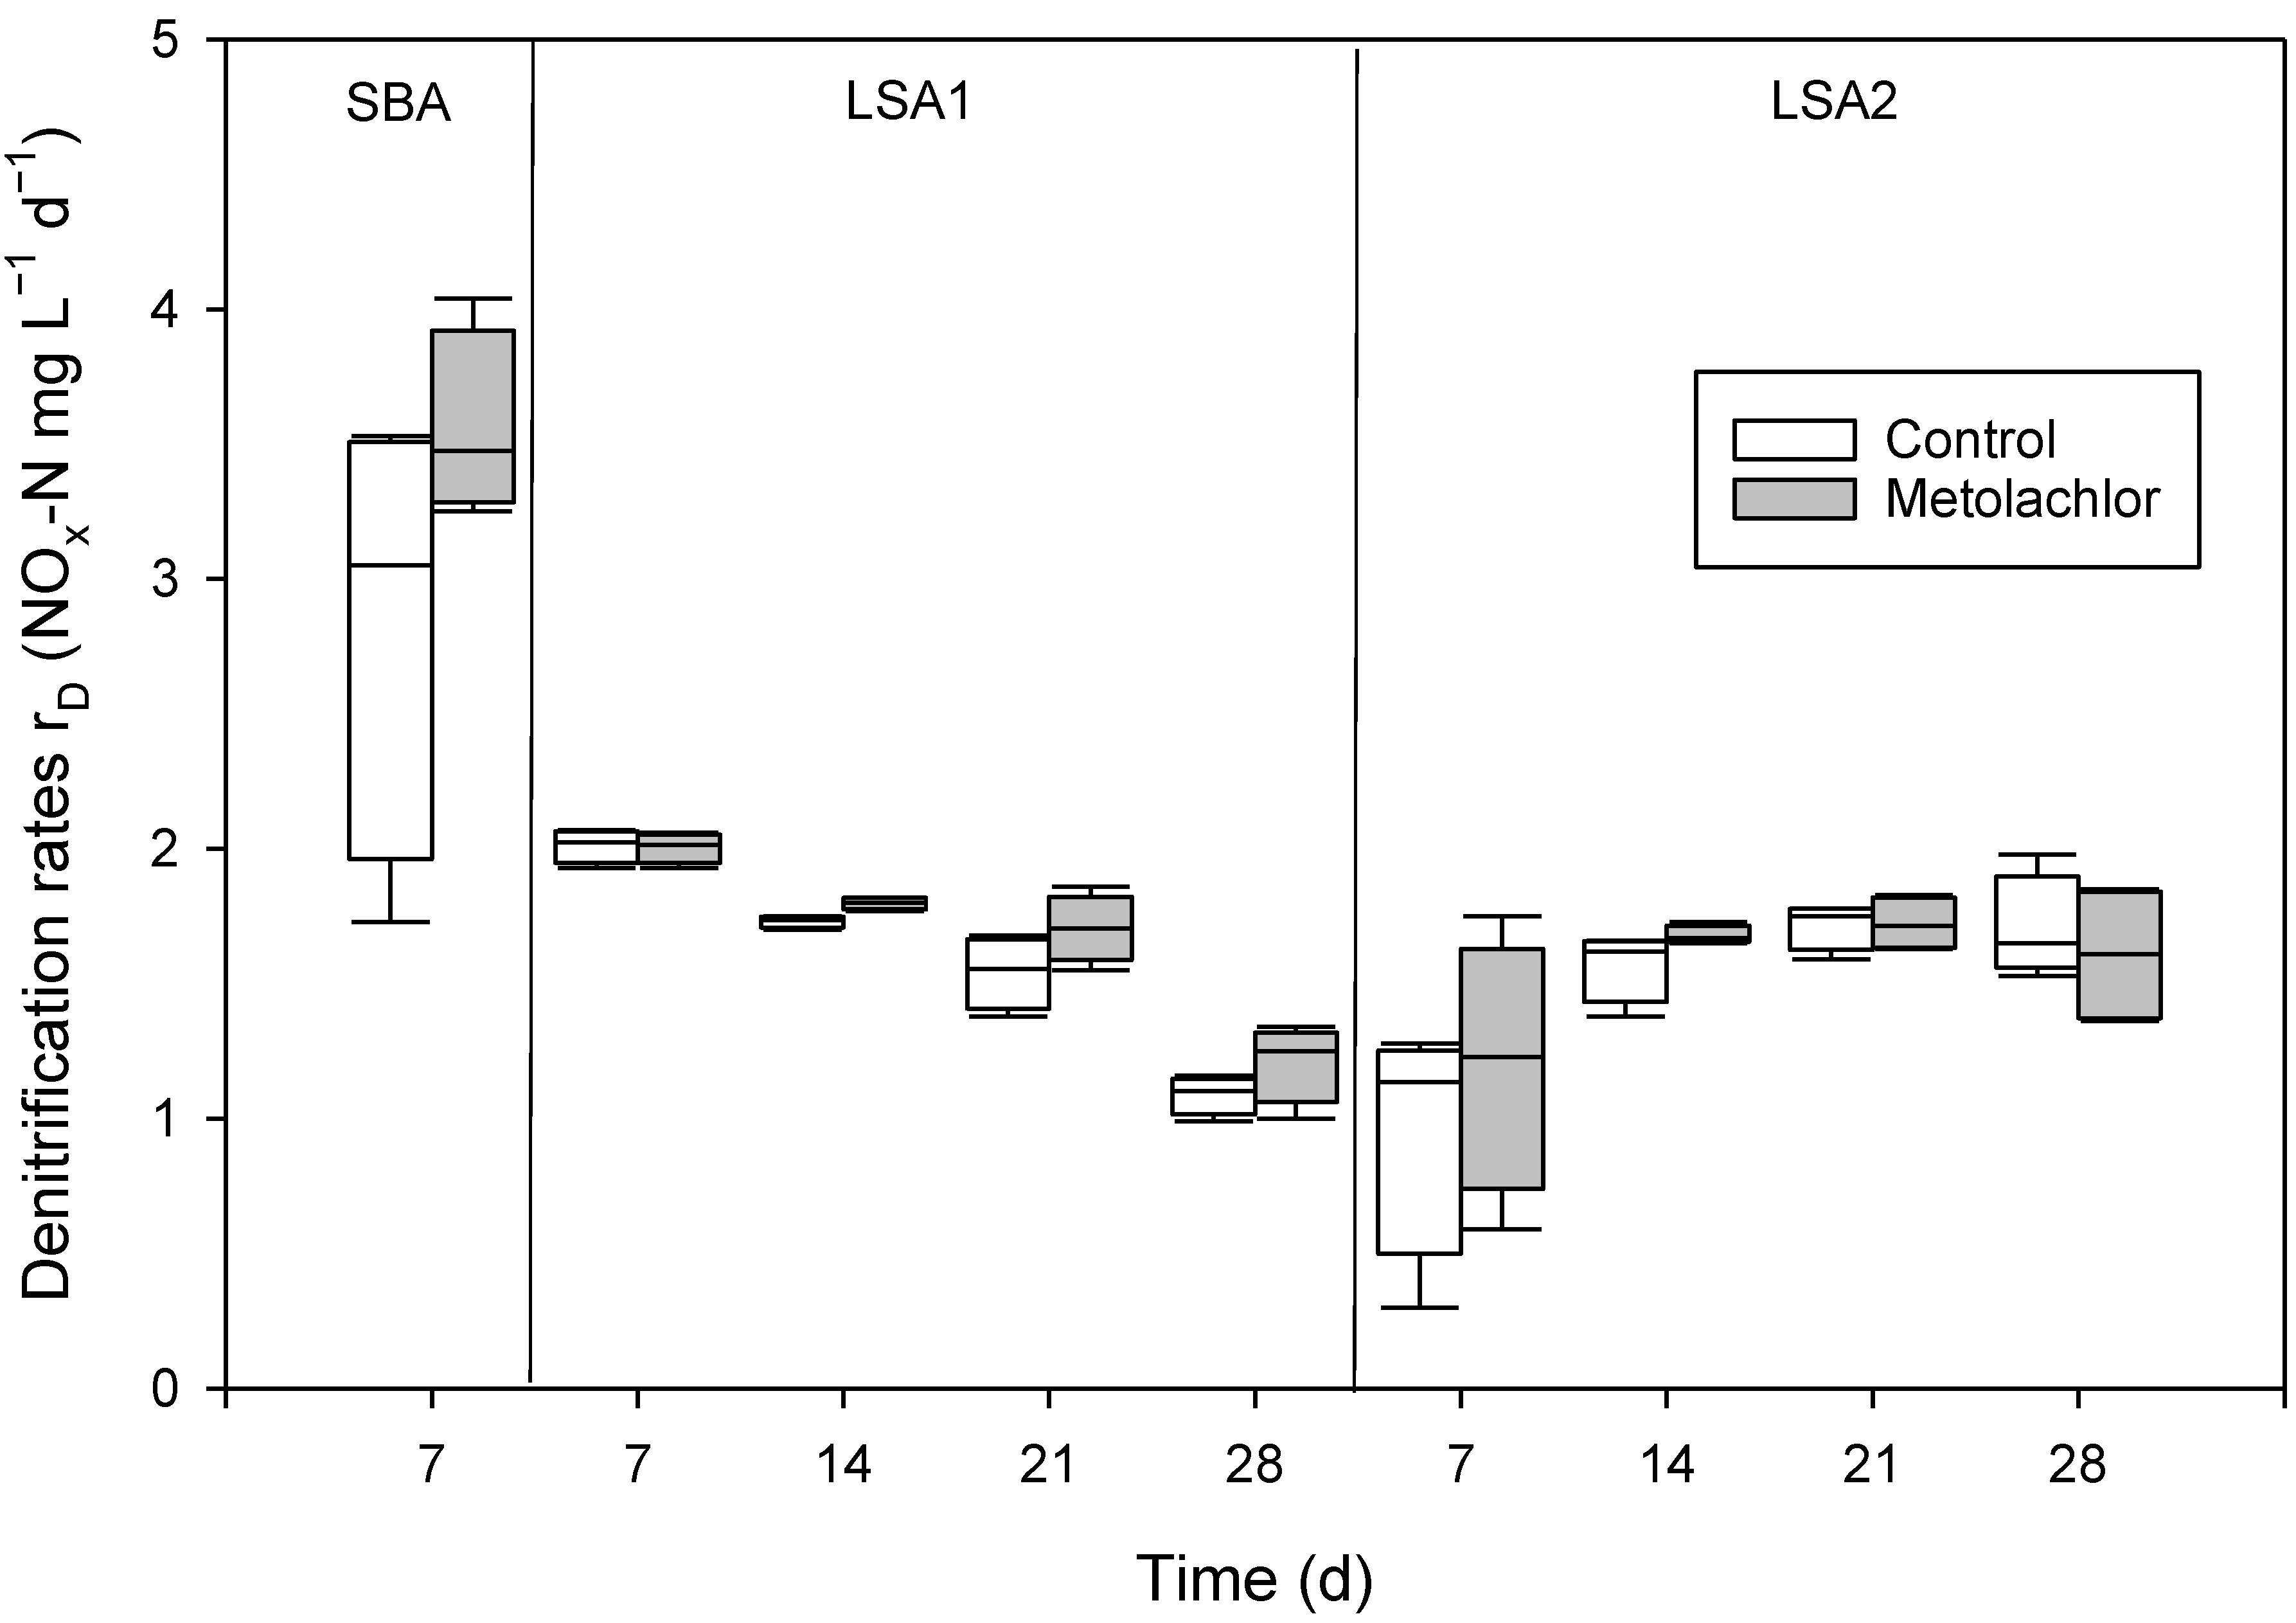
3.2. Validation of the Methodology by Testing the Effects of Metolachlor

Table 3 shows the conditions during the experiments. The average pH values measured at the end of each experiment were within the optimal range of 7–8 [35] for all assays. The COD values were similar among the experiments and treatments, showing COD:N ratios of about 7–8. The nitrite concentrations at the end of each experiment were low except for the SBA T2 treatment. In this group, the high nitrite concentrations may have resulted from nitrate reduction during the 48 h pre-conditioning phase, before mercury was added and all biological activities were stopped. However, this was not observed in T2 of the LSA2, for which the conditions were similar.
At the end of the 7-day SBA, the DO concentrations were <0.5 mg L−1 in the treatments C and T1 with ongoing denitrification, while high DO concentrations were found in T2 due to the inhibition of all biological processes (Table 3). However, at the end of LSA1, the DO concentrations were above 2 mg L−1 in C and T1, while an unexpected low value was measured in T2 (Table 3). In this group, denitrification rates of 0.43 and 0.90 mg L−1 d−1 were measured after 21 and 28 days, respectively. Both the low DO concentrations and the measured denitrification indicated that the single HgCl2 treatment at the beginning of the test was not enough to inhibit the bacterial activities completely. Thus, we adapted the original method in a second experiment, LSA2, by adding 1 mL of HgCl2 every 7 days. The high DO concentrations in T2 at the end of LSA2 confirmed that the denitrification process was successfully inhibited by this adaptation. Like LSA1, LSA2 resulted in measurements of relatively high ending DO concentrations above 2 mg L−1 in both the C and T1 treatments, despite the initial purging. This increase in DO concentrations was probably caused by the opening and closing of the bottles every 7 days during the experiments. Despite the suboptimal DO conditions, denitrification went on, albeit at lower rates. The authors of [43] observed that the DO concentrations inside activated sludge flocs were lower than the bulk DO concentration of the solution. We assume that the denitrification process was not evenly distributed in our incubation bottles, but showed lower rates in the water column and higher rates in the micropores of the wood shavings, where anoxic conditions may have prevailed. Nevertheless, we recommend purging every 7 days to optimize the denitrification process in the LSA.
In the SBA, the denitrification was slightly, but not significantly, stimulated by the metolachlor (Figure 2). The stimulation of denitrification has also been observed in soils for other pesticides, such as glyphosate [44], Topogard 50 WP [45], and mesotrione [46]. The stimulatory effects in these studies were explained by either abundance shifts in the denitrifying bacteria or the use of the pesticides as an additional nutrient source. In the LSA experiments, no significant inhibition or stimulation was observed. These results correspond to the findings by the authors of [23], who found no inhibitory effects of metolachlor on the denitrification in reactors packed with ceramic biofilm carriers over ten weeks of exposition.
Figure 3 shows the loss of metolachlor during the experiments. We observed no biotic loss of metolachlor in the SBA and LSA2, while the adsorption on the wood shavings amounted to slightly less than 50% of the metolachlor initially added. We assumed the adsorption of metolachlor on the glass walls of the test vessels to be neglectable in accordance with the findings in [47]. In the LSA1 experiment, only the total loss of metolachlor could be quantified due to the insufficient inhibition of the biotic processes. However, the results were comparable to those of the other assays. As the proportion of adsorption was similar in the SBA after 7 days and the LSA after 28 days, it can be assumed that the adsorption of metolachlor had already reached an equilibrium during the first days of the experiments. Other studies have also reported considerable abiotic losses of pesticides and herbicides via sorption on wood particles [22,27]. The authors of [48] observed a low biodegradability for S-metolachlor of less than 5% after 28 days. These results agree with our observations.

4. Conclusions

Our study presents easily applicable, tested, and optimized denitrification assays for both managers and scientists to assess the effects of xenobiotics on the denitrification process in denitrifying bioreactors or in natural systems with similar conditions. The presented assay methodologies facilitate the determination of the fate of xenobiotics in bioreactors to obtain insight into the potential of bioreactors to remove xenobiotics from polluted water resources. This information is also necessary for the environmentally friendly treatment of bioreactor fillings after experiments or upon exchange in water treatment facilities, amongst others.
The presented assay methodologies are designed to cover periods of 7 and 28 days. The experiments over the 28-day period yield information about the development of both the denitrification under a longer exposition to the studied xenobiotics and the environmental conditions in the bioreactors. The comparison of undisturbed denitrification and inhibited biotic processes further allows biotic and abiotic losses of the xenobiotics in the bioreactors to be calculated.
During the development of the methodology, the optimal denitrification conditions were identified to be 12.5 g L−1 of poplar wood shavings, 0.5 g L−1 of NaHCO3, and 15 mg L−1 and 30 mg L−1 initial NO3-N concentrations for the LSA and the SBA, respectively. However, based on the results of our study, we highly recommend conducting pre-tests before the actual experiments, as well as continuous monitoring during the experiments to avoid interference between the effects of the xenobiotics and the effects of the environmental conditions (e.g., pH, DO) on the denitrification process. Specifically, our study highlights the significance of the ratio of organic carbon to nitrate in the assays to ensure optimal conditions for denitrification that are neither carbon- nor nitrate-limited. We also want to encourage further systematic studies using long-term laboratory assays that focus on maintaining optimal conditions for stable denitrification over longer time periods.

Author Contributions

Conceptualization, J.M.; data curation, K.P. and Z.B.; formal analysis, K.P. and Z.B.; funding acquisition, J.M.; investigation, K.P.; methodology, J.M.; supervision, J.M.; visualization, K.P. and G.W.; writing—original draft, K.P., G.W., and J.M.; writing—review and editing, G.W. and J.M. All authors have read and agreed to the published version of the manuscript.

Funding

This work was financially supported by the Brno University of Technology Junior Specific Research Project (FAST-J-22-7911) “Denitrification and degradation of pesticides” (KP) and by the Program to Support Strategic Management of Higher Education Institutions for 2022–2025 financed by the Czech Ministry of Education Youth and Sports (GW). The authors thank the Research Infrastructure RECETOX (No. LM2018121) financed by the Ministry of Education, Youth and Sports, and Operational Programme Research, Development, and Innovation—project CETOCOEN EXCELLENCE (No. CZ.02.1.01/0.0/0.0/17_043/0009632) and by the European Union’s Horizon 2020 research and innovation program under grant agreement No. 857560 for supportive background (ZB). The funders had no role in the study design, data collection and analysis, decision to publish, or preparation of the manuscript.

Data Availability Statement

The data are available upon request.

Conflicts of Interest

The authors declare no conflict of interest. The funders had no role in the design of the study; in the collection, analyses, or interpretation of data; in the writing of the manuscript; or in the decision to publish the results.

References

  1. Pina-Ochoa, E.; Alvarez-Cobelas, M. Denitrification in Aquatic Environments: A Cross-System Analysis. Biogeochemistry 2006, 81, 111–130. [Google Scholar] [CrossRef]
  2. Mulholland, P.J.; Helton, A.M.; Poole, G.C.; Hall, R.O.; Hamilton, S.K.; Peterson, B.J.; Tank, J.L.; Ashkenas, L.R.; Cooper, L.W.; Dahm, C.N.; et al. Stream Denitrification across Biomes and Its Response to Anthropogenic Nitrate Loading. Nature 2008, 452, 202-U46. [Google Scholar] [CrossRef]
  3. Findlay, S.E.G.; Mulholland, P.J.; Hamilton, S.K.; Tank, J.L.; Bernot, M.J.; Burgin, A.J.; Crenshaw, C.L.; Dodds, W.K.; Grimm, N.B.; McDowell, W.H.; et al. Cross-Stream Comparison of Substrate-Specific Denitrification Potential. Biogeochemistry 2011, 104, 381–392. [Google Scholar] [CrossRef]
  4. Rivett, M.O.; Buss, S.R.; Morgan, P.; Smith, J.W.N.; Bemment, C.D. Nitrate Attenuation in Groundwater: A Review of Biogeochemical Controlling Processes. Water Res. 2008, 42, 4215–4232. [Google Scholar] [CrossRef] [PubMed]
  5. Addy, K.; Gold, A.J.; Christianson, L.E.; David, M.B.; Schipper, L.A.; Ratigan, N.A. Denitrifying Bioreactors for Nitrate Removal: A Meta-Analysis. J. Environ. Qual. 2016, 45, 873–881. [Google Scholar] [CrossRef] [PubMed] [Green Version]
  6. Pinto, R.; Weigelhofer, G.; Brito, A.G.; Hein, T. Effects of Dry-Wet Cycles on Nitrous Oxide Emissions in Freshwater Sediments: A Synthesis. PeerJ 2021, 9, e10767. [Google Scholar] [CrossRef] [PubMed]
  7. Zhao, S.; Zhang, B.; Sun, X.; Yang, L. Hot Spots and Hot Moments of Nitrogen Removal from Hyporheic and Riparian Zones: A Review. Sci. Total Environ. 2021, 762, 144168. [Google Scholar] [CrossRef]
  8. Pinay, G.; Gumiero, B.; Tabacchi, E.; Gimenez, O.; Tabacchi-Planty, A.M.; Hefting, M.M.; Burt, T.P.; Black, V.A.; Nilsson, C.; Iordache, V.; et al. Patterns of Denitrification Rates in European Alluvial Soils under Various Hydrological Regimes. Freshw. Biol. 2007, 52, 252–266. [Google Scholar] [CrossRef]
  9. Malá, J.; Bílková, Z.; Hrich, K.; Schrimpelová, K.; Kriška, M.; Šereš, M. Sustainability of Denitrifying Bioreactors with Various Fill Media. Plant Soil Environ. 2017, 63, 442–448. [Google Scholar] [CrossRef] [Green Version]
  10. Jaynes, D.B.; Kaspar, T.C.; Moorman, T.B.; Parkin, T.B. In Situ Bioreactors and Deep Drain-Pipe Installation to Reduce Nitrate Losses in Artificially Drained Fields. J. Env. Qual. 2008, 37, 429–436. [Google Scholar] [CrossRef] [Green Version]
  11. Robertson, W.D.; Merkley, L.C. In-Stream Bioreactor for Agricultural Nitrate Treatment. J. Environ. Qual. 2009, 38, 230–237. [Google Scholar] [CrossRef] [Green Version]
  12. Christianson, L.E.; Bhandari, A.; Helmers, M.J. A Practice-Oriented Review of Woodchip Bioreactors for Subsurface Agricultural Drainage. Appl. Eng. Agric. 2012, 28, 861–874. [Google Scholar] [CrossRef]
  13. Weigelhofer, G.; Hein, T. Efficiency and Detrimental Side Effects of Denitrifying Bioreactors for Nitrate Reduction in Drainage Water. Environ. Sci. Pollut. Res. 2015, 22, 13534–13545. [Google Scholar] [CrossRef] [PubMed]
  14. Elgood, Z.; Robertson, W.D.; Schiff, S.L.; Elgood, R. Nitrate Removal and Greenhouse Gas Production in a Stream-Bed Denitrifying Bioreactor. Ecol. Eng. 2010, 36, 1575–1580. [Google Scholar] [CrossRef]
  15. Schipper, L.A.; Robertson, W.D.; Gold, A.J.; Jaynes, D.B.; Cameron, S.C. Denitrifying Bioreactors—An Approach for Reducing Nitrate Loads to Receiving Waters. Ecol. Eng. 2010, 36, 1532–1543. [Google Scholar] [CrossRef]
  16. Gothwal, R.; Shashidhar, T. Antibiotic Pollution in the Environment: A Review. CLEAN Soil Air Water 2015, 43, 479–489. [Google Scholar] [CrossRef]
  17. de Souza, R.M.; Seibert, D.; Quesada, H.B.; de Jesus Bassetti, F.; Fagundes-Klen, M.R.; Bergamasco, R. Occurrence, Impacts and General Aspects of Pesticides in Surface Water: A Review. Process Saf. Environ. Prot. 2020, 135, 22–37. [Google Scholar] [CrossRef]
  18. Li, Z.L.; Cheng, R.; Chen, F.; Lin, X.Q.; Yao, X.J.; Liang, B.; Huang, C.; Sun, K.; Wang, A.J. Selective Stress of Antibiotics on Microbial Denitrification: Inhibitory Effects, Dynamics of Microbial Community Structure and Function. J. Hazard. Mater. 2021, 405, 124366. [Google Scholar] [CrossRef]
  19. Yin, G.; Liu, M.; Zheng, Y.; Li, X.; Lin, X.; Yin, G.; Liu, M.; Zheng, Y.; Li, X.; Lin, X.; et al. Effects of Multiple Antibiotics Exposure on Denitrification Process in the Yangtze Estuary Sediments. Chemosphere 2017, 171, 118–125. [Google Scholar] [CrossRef]
  20. Roose-Amsaleg, C.; David, V.; Alliot, F.; Guigon, E.; Crouzet, O.; Laverman, A.M. Synergetic Effect of Antibiotic Mixtures on Soil Bacterial N2O-Reducing Communities. Environ. Chem. Lett. 2021, 19, 1873–1878. [Google Scholar] [CrossRef]
  21. Aslan, Ş. Combined Removal of Pesticides and Nitrates in Drinking Waters Using Biodenitrification and Sand Filter System. Process Biochem. 2005, 40, 417–424. [Google Scholar] [CrossRef]
  22. Krause Camilo, B.; Matzinger, A.; Litz, N.; Tedesco, L.P.; Wessolek, G. Concurrent Nitrate and Atrazine Retention in Bioreactors of Straw and Bark Mulch at Short Hydraulic Residence Times. Ecol. Eng. 2013, 55, 101–113. [Google Scholar] [CrossRef]
  23. Cesar, A.; Roŝ, M. Long-Term Study of Nitrate, Nitrite and Pesticide Removal from Groundwater: A Two-Stage Biological Process. Int. Biodeterior. Biodegrad. 2013, 82, 117–123. [Google Scholar] [CrossRef]
  24. Gottschall, N.; Edwards, M.; Craiovan, E.; Frey, S.K.; Sunohara, M.; Ball, B.; Zoski, E.; Topp, E.; Khan, I.; Clark, I.D.; et al. Amending Woodchip Bioreactors with Water Treatment Plant Residuals to Treat Nitrogen, Phosphorus, and Veterinary Antibiotic Compounds in Tile Drainage. Ecol. Eng. 2016, 95, 852–864. [Google Scholar] [CrossRef]
  25. Tseng, Y.-J.; Lai, W.W.-P.L.; Tung, H.; Lin, A.Y.-C. Pharmaceutical_anticorrosive Substance Removal by Woodchip Column Reactor.Pdf. Environ. Sci. Process Impacts 2020, 22, 187. [Google Scholar] [CrossRef]
  26. Lepine, C.; Christianson, L.; Soucek, D.; McIsaac, G.; Summerfelt, S. Metal Leaching and Toxicity of Denitrifying Woodchip Bioreactor Outflow—Potential Reuse Application. Aquac. Eng. 2021, 93, 102129. [Google Scholar] [CrossRef]
  27. Ilhan, Z.E.; Ong, S.K.; Moorman, T.B. Dissipation of Atrazine, Enrofloxacin, and Sulfamethazine in Wood Chip Bioreactors and Impact on Denitrification. J. Environ. Qual. 2011, 40, 1816–1823. [Google Scholar] [CrossRef]
  28. Chen, L.; Huang, F.; Zhang, C.; Zhang, J.; Liu, F.; Guan, X. Effects of Norfloxacin on Nitrate Reduction and Dynamic Denitrifying Enzymes Activities in Groundwater. Environ. Pollut. 2021, 273, 116492. [Google Scholar] [CrossRef]
  29. Hvězdová, M.; Kosubová, P.; Košíková, M.; Scherr, K.E.; Šimek, Z.; Brodský, L.; Šudoma, M.; Škulcová, L.; Sáňka, M.; Svobodová, M.; et al. Currently and Recently Used Pesticides in Central European Arable Soils. Sci. Total Environ. 2018, 613–614, 361–370. [Google Scholar] [CrossRef]
  30. Michel, C.; Baran, N.; André, L.; Charron, M.; Joulian, C. Side Effects of Pesticides and Metabolites in Groundwater: Impact on Denitrification. Front. Microbiol. 2021, 12, 662727. [Google Scholar] [CrossRef]
  31. Novak, P.J.; Christ, S.J.; Parkin, G.F. Kinetics of Alachlor Transformation and Identification of Metabolites Under Anaerobic Conditions. Water Res. 1997, 31, 3107–3115. [Google Scholar] [CrossRef]
  32. Peng, Y.Z.; Yong, M.A.; Wang, S. Denitrification Potential Enhancement by Addition of External Carbon Sources in a Pre-Denitrification Process. J. Environ. Sci. 2007, 19, 284–289. [Google Scholar] [CrossRef]
  33. Tate, R.L. Soil Microbiology, 2nd ed.; Wiley: New York, NY, USA, 2000. [Google Scholar]
  34. Christensen, M.H.; Harremoës, P. Biological Denitrification of Sewage: A Literature Review. In Proceedings of the Conference on Nitrogen As a Water Pollutant; Jenkins, S.H., Ed.; Pergamon: Oxford, UK, 2013; pp. 509–555. ISBN 978-1-4832-1344-6. [Google Scholar]
  35. Zhao, J.; He, Q.; Chen, N.; Peng, T.; Feng, C. Denitrification Behavior in a Woodchip-Packed Bioreactor with Gradient Filling for Nitrate-Contaminated Water Treatment. Biochem. Eng. J. 2020, 154, 107454. [Google Scholar] [CrossRef]
  36. Stensel, H.D.; Loehr, R.C.; Lawrence, A.W. Biological Kinetics of Suspended-Growth Denitrification. J. Water Pollut. Control Fed. 1973, 45, 249–261. [Google Scholar]
  37. Bolzonella, D.; Innocenti, L.; Pavan, P.; Cecchi, F. Denitrification Potential Enhancement by Addition of Anaerobic Fermentation Products from the Organic Fraction of Municipal Solid Waste. Water Sci. Technol. 2001, 44, 187–194. [Google Scholar] [CrossRef] [PubMed]
  38. Lahdhiri, A.; Lesage, G.; Hannachi, A.; Heran, M. Minimum COD Needs for Denitrification: From Biological Models to Experimental Set-Up. Desalin. Water Treat. 2017, 61, 326–334. [Google Scholar] [CrossRef]
  39. Glass, C.; Silverstein, J. Denitrification of High-Nitrate, High-Salinity Wastewater. Water Res. 1999, 33, 223–229. [Google Scholar] [CrossRef]
  40. Qian, W.; Ma, B.; Li, X.; Zhang, Q.; Peng, Y. Long-Term Effect of PH on Denitrification: High PH Benefits Achieving Partial-Denitrification. Bioresour. Technol. 2019, 278, 444–449. [Google Scholar] [CrossRef]
  41. Wilson, L.P.; Bouwer, E.J. Biodegradation of Aromatic Compounds under Mixed Oxygen/Denitrifying Conditions: A Review. J. Ind. Microbiol. Biotechnol. 1997, 18, 116–130. [Google Scholar] [CrossRef]
  42. Hou, L.; Yin, G.; Liu, M.; Zhou, J.; Zheng, Y.; Gao, J.; Zong, H.; Yang, Y.; Gao, L.; Tong, C. Effects of Sulfamethazine on Denitrification and the Associated N2O Release in Estuarine and Coastal Sediments. Environ. Sci. Technol. 2015, 49, 326–333. [Google Scholar] [CrossRef]
  43. Daigger, G.T.; Adams, C.D.; Steller, H.K. Diffusion of Oxygen Through Activated Sludge Flocs: Experimental Measurement, Modeling, and Implications for Simultaneous Nitrification and Denitrification. Water Environ. Res. 2007, 79, 375–387. [Google Scholar] [CrossRef]
  44. Carlisle, S.M.; Trevors, J.T. Effect of the Herbicide Glyphosate on Nitrification, Denitrification, and Acetylene Reduction in Soil. Water Air Soil Pollut. 1986, 29, 189–203. [Google Scholar] [CrossRef]
  45. Kara, E.E.; Arli, M.; Uygur, V. Effects of the Herbicide Topogard on Soil Respiration, Nitrification, and Denitrification in Potato-Cultivated Soils Differing in PH. Biol. Fertil. Soils 2004, 39, 474–478. [Google Scholar] [CrossRef]
  46. Crouzet, O.; Poly, F.; Bonnemoy, F.; Bru, D.; Batisson, I.; Bohatier, J.; Philippot, L.; Mallet, C. Functional and Structural Responses of Soil N-Cycling Microbial Communities to the Herbicide Mesotrione: A Dose-Effect Microcosm Approach. Environ. Sci. Pollut. Res. 2016, 23, 4207–4217. [Google Scholar] [CrossRef] [PubMed]
  47. Wessel-Bothe, S.; Pätzold, S.; Klein, C.; Behre, G.; Welp, G. Adsorption von Pflanzenschutzmitteln Und DOC an Saugkerzen Aus Glas Und Keramik. J. Plant Nutr. Soil Sci. 2000, 163, 53–56. [Google Scholar] [CrossRef]
  48. Gutowski, L.; Olsson, O.; Leder, C.; Kümmerer, K. A Comparative Assessment of the Transformation Products of S-Metolachlor and Its Commercial Product Mercantor Gold® and Their Fate in the Aquatic Environment by Employing a Combination of Experimental and in Silico Methods. Sci. Total Environ. 2015, 506–507, 369–379. [Google Scholar] [CrossRef]
Figure 1. NOX-N concentrations over time in 16 d-long pre-tests for different starting NO3-N concentrations. The grey areas represent the thresholds above/below which the denitrification process becomes organic carbon/nitrate limited, respectively. Each line represents one sample.
Water 15 02536 g001
Figure 2. Denitrification rates, rD, in the control and metolachlor treatments of the 7 d short batch assay (SBA), the 28 d long semi-continuous assay (LSA1) with one dose of HgCl2 at the beginning, and LSA2 with one dose of HgCl2 every 7 days. Shown are the 10th, 25th, 50th, 75th, and 90th percentiles (n = 4).
Water 15 02536 g002
Figure 3. Abiotic loss, total loss, and residue of metolachlor in the SBA after 7 days and in LSA1 and LSA2 after 28 days (mean, n = 4). No biotic losses could be observed in the SBA or LSA2. In LSA1, the biotic/abiotic loss could not be calculated due to the insufficient inhibition of biotic processes in treatment 2 (n.d. = not determined).
Water 15 02536 g003
Table 1. Composition of the liquid phase of the treatments. The initial solution of all treatments contains KNO3 + NaHCO3 dissolved in DIW.
TreatmentDescriptionAdditional Reagents Added after 48 h
C (Control)Denitrification unaffected0.1 mL of pure methanol per L of sample
T1Xenobiotics affect denitrification; xenobiotics can undergo adsorption and decomposition0.1 mL of the tested xenobiotics per L of sample (conc.: 1000 mg L−1 in pure methanol solution)
T2Inhibitor stops denitrification; xenobiotics can undergo only adsorption0.1 mL of the tested xenobiotics per L of sample (conc.: 1000 mg L−1 in pure methanol solution) + 3.8 mL HgCl2 (123.5 mg L−1)
Table 2. Optimization of the test conditions for the 7-day assay (SBA) showing the test variables, test conditions, results (means +/− standard deviations), and statistics, where “>” and “<” denote significant differences between conditions at p < 0.05 (t-test, n = 4); ~ = not significant. COD = chemical oxygen demand (mg L−1), rD = nitrate removal rate (mg L−1d−1), turb = turbidity (ZF), NOx-N = concentration of nitrate- and nitrite-nitrogen (mg L−1), and DO = dissolved oxygen (mg L−1).
Tested VariableResults
Concentration of wood chips:
7.5 (low), 12.5 (mid), 25 g L−1 (high)
COD: high (390 ± 70) > mid (147 ± 5) > low (83 ± 10)
rD: high (1.6 ± 0.01) ~ mid (1.3 ± 0.2) ~ low (1.5 ± 0.2)
turb: high (20.6 ± 2.8) ~ mid (13.8 ± 4.1) ~ low (7.7 ± 0.3), high > low
Concentration of NaHCO3:
0.0 (zero), 0.5 (low), 1.0 (mid), 2.0 g L−1 (high)
pH: zero (6.5 ± 0.2) < low (7.5 ± 0.05) < mid (7.8 ± 0.08) < high (8.2 ± 0.02)
rD: zero (0.8 ± 0.1) < low (1.3 ± 0.1) ~ mid (1.2 ± 0.2) ~ high (1.1 ± 0.1)
Starting NO3-N:
15 mg L−1 (low), 30 mg L−1 (high)
COD: low (173 ± 12) ~ high (180 ± 14)
End NOx-N: low (11.0 ± 0.4) < high (21.5 ± 0.3)
rD: low (0.6 ± 0.06) < high (1.2 ± 0.04)
Fraction of wood shavings:
5–10 (low), 10–15 mm (high)
COD: high (143 ± 30) ~ low (119 ± 10)
rD: high (1.5 ± 0.1) ~ low (1.5 ± 0.3)
turb: high (10.1 ± 1.4) ~ low (10.3 ± 1.9)
Purging with ArDO after 2 days: yes (0.3 ± 0.03) < no (0.8 ± 0.1)
DO after 7 days: yes (0.2 ± 0.01) < no (0.4 ± 0.08)
rD: yes (0. 6 ± 0.06) < no (1.0 ± 0.17)
Table 3. Average assay conditions, showing the pH, dissolved oxygen concentrations (DO), chemical oxygen demand (COD), nitrite concentrations at the end of the experiments, and denitrification rate, rD (SBA = 7-day short batch assay, LSA = 28-day long semi-continuous assay). Treatment C = full denitrification (control), T1 = addition of metolachlor, and T2 = biotic processes inhibited by HgCl2 addition; n = 4.
pHDO (mg L−1)COD (mg L−1)NO2-N (mg L−1)rD (mg L−1 d−1)
SBAC7.520.302300.152.84
T17.610.232300.153.56
T27.667.672900.990.20
LSA1C7.712.461200.111.59
T17.762.351000.071.68
T27.670.391700.160.34
LSA2C7.672.511300.081.49
T17.651.631400.161.55
T27.758.273100.160.08
Disclaimer/Publisher’s Note: The statements, opinions and data contained in all publications are solely those of the individual author(s) and contributor(s) and not of MDPI and/or the editor(s). MDPI and/or the editor(s) disclaim responsibility for any injury to people or property resulting from any ideas, methods, instructions or products referred to in the content.

