Article

Assessing the Possibilities of Backwash Water Reuse Filters in the Water Treatment System—Case Analysis

by
Małgorzata Wolska
1,* and
Halina Urbańska-Kozłowska
1,2
1
Department of Environmental Engineering, Wroclaw University of Science and Technology, Wybrzeże Wyspiańskiego 27, 50-370 Wrocław, Poland
2
Municipal Water and Sewage Company, Ul. Na Grobli 14-16, 50-421 Wrocław, Poland
*
Author to whom correspondence should be addressed.
Water 2023, 15(13), 2452; https://doi.org/10.3390/w15132452
Submission received: 6 June 2023 / Revised: 29 June 2023 / Accepted: 30 June 2023 / Published: 4 July 2023

Abstract

:
Due to the worldwide water crisis and diminishing water supplies, it is imperative to reduce water use and reuse it. One possible source of water is the washings created during the purification of drinking water. Backwashing constitutes 2–8% of the treated water used globally; it is more commonly used, primarily for irrigation or to expand surface/groundwater resources. Therefore, recirculating it at the beginning of the water treatment system is reasonable and justifiable, as it can lead to a decrease in the cost of the water that is being used. A study of variations in the content of washings in two water treatment plants revealed the requirement for pollutants to be removed before the water is reused. For the safety of consumers, the presence of microbes in backwashings from both facilities was essential. Variability in the amount and composition of backwashings was higher for surface water treatment in comparison to infiltration water treatment; however, the amount of backwashings was greater in infiltration water. The quantity of microorganisms, including indicator ones, was substantially higher in washings following surface water treatment. On the other hand, in the washings from the infiltration water treatment, large amounts of iron and manganese compounds were present, the recycling of which would reduce the effectiveness of infiltration water treatment. Pre-treatment backwashings from both facilities will be suitable for the suspension separation procedures and disinfection. It is essential to compare the costs connected with water use against the anticipated cost of washing. The potential to purify additional water in the event of a worsening water shortage, however, is the most significant advantage of water reuse. Recycling of the washings will allow to reduce the fees for the use of the environment, even to EUR 150,000 and EUR 250,000 per year for surface and infiltration WTP, respectively.

1. Introduction

Every year, the amount of available water in the world decreases, and due to hydrological droughts, more and more areas are at risk of experiencing a water shortage. Water resources at a level of 1600 m3/person are thought to represent the limit of the water stress zone, which affects many nations [1]. This implies that, in order to minimise water use, sources of drinking water must be made available in developed countries [2]. Reducing water consumption for water treatment facilities’ internal demands by optimising the water treatment procedures is one approach to rational use of water resources. Filtration is one of the fundamental techniques used to treat water, regardless of its intake source. According to the EPA, conventional filtration (preceded by coagulation, flocculation, and sedimentation) is the most widely used process unit in water treatment. It is used in 63% of water treatment plants (WTP) in the USA, and after accounting for the use of direct filtration, this share exceeds 90% of water plants [3]. In other regions of the world, filters are most commonly used for water purification, regardless of their source, and their functionality in technological systems depends on the type of filter material. The most prevalent types of filters are adsorption filters, which operate properly when the beds of sand or activated carbon are routinely backwashed. The resulting backwashings account for 2–8% [1,4] of the treated water and around 10% [5] in the case of DynaSand filters. According to EPA recommendations [6], it should be in the range of 2–10% of treated water, although in properly functioning filters, it drops to less than 5%. This implies that several thousand to several millions of backwashings are produced annually in each plant. Which justifies and calls for reuse in order to manage water resources sustainably. Zielina et al.’s [4] research demonstrated that a municipal water treatment facility in northern Europe with a capacity of about 25,000 m3/d may be able to save as much as 71,045 m3 of water annually from backwashing the sand filter beds. This amount represents about 8.5% of the total volume of water used for this purpose and approximately 0.78% of the water treatment facility’s total output. Recycling washings can help save operational expenses by reducing energy usage, which will also help reduce the quantity of wastewater produced. According to research to examine water losses during filter backwashing in swimming pool installations, process optimization can reduce water consumption and energy costs when using pressure filters [7]. These studies have demonstrated that water losses associated with swimming pool installations are significantly higher than those associated with water filtration systems.
These backwashings are more and more often used, mainly for irrigation or to increase the resources of surface/groundwater [8]. The regulation of the European Parliament and the Council on Minimum Requirements for Water Reuse recommended the use of backwashings for irrigation, but most often they are used to increase intake water resources [9].
Research on the potential for backwashing management and the prerequisites for its reuse is being conducted all around the world [10,11]. According to these studies, backwashing composition varies greatly depending on the kind and degree of contamination in the treated water, the frequency of backwashing, and the backwashing parameters utilized [11,12]. According to the type of coagulant utilized, organic materials, microorganisms, and iron- or aluminium-compounds are listed as limiting factors affecting the return of backwashings from the processing system to the technological system [13,14,14]. However, in the case of groundwater treatment, the dominant pollutants are iron and manganese compounds, whose concentrations are many times higher than those in the intake waters [14]. Due to the level of contamination, they require the implementation of pre-treatment before reuse, most often coagulation and sedimentation processes as well as membrane separation processes. The facility in Wierden, the Netherlands, is one example of the use of microfiltration for backwashing pretreatment. The installation present within the facility with a capacity of 50 m3/h allows for the recovery of roughly 99% of backwashings [15]. On the other hand, in the mixed water treatment plant (surface and groundwater) in WTP “Mosina”, backwashings are treated in the coagulation and sedimentation processes [16]. The choice of backwashing management method and the method of their pre-treatment should be selected on the basis of their composition and their seasonal variability. Therefore, it was reasonable to conduct research on the amount and composition of the backwashings in two plants treating surface and infiltrated water, each with a capacity of about 100,000 m3/d, in order to determine the possibility of their reuse in the main water treatment trial.
There is no information in the literature on the fluctuation of washing composition and its amount over time, despite the specified contaminants present in the washings, which are a factor restricting their reuse. Additionally, there are no clear indicators as to how thoroughly the washings must be cleaned before being returned to the water treatment system. Some argue that washings should be recycled in a certain proportion to the water to be treated (40/60%), which is supposed to increase the efficiency of water treatment and does not require washings to be pre-treated [17]. The findings of a survey of water supply companies reveal that many of them lack information on the volume and, more importantly, the makeup of washings produced in plants. Therefore, it was reasonable to conduct research on surface and infiltration water treatment plants with similar capacities. In order to compare the quantity and provide an assessment of the variability of the quantity and composition of washings produced depending on the kind of treated water. Since the washings must be pre-treated before being combined with the treated water, it is important to assess the effectiveness of any potential pre-treatment installations and specify the procedures required to pre-treat the washings, i.e., to state the minimum volume produced annually. The present study sought to ascertain the volume and composition of washings as well as their variation throughout the course of the year in water treatment facilities run by a single municipal corporation, as well as the viability of returning these washings to water treatment systems. Consequently, a potential assessment of how to increase water resources while decreasing operating expenditures is required.

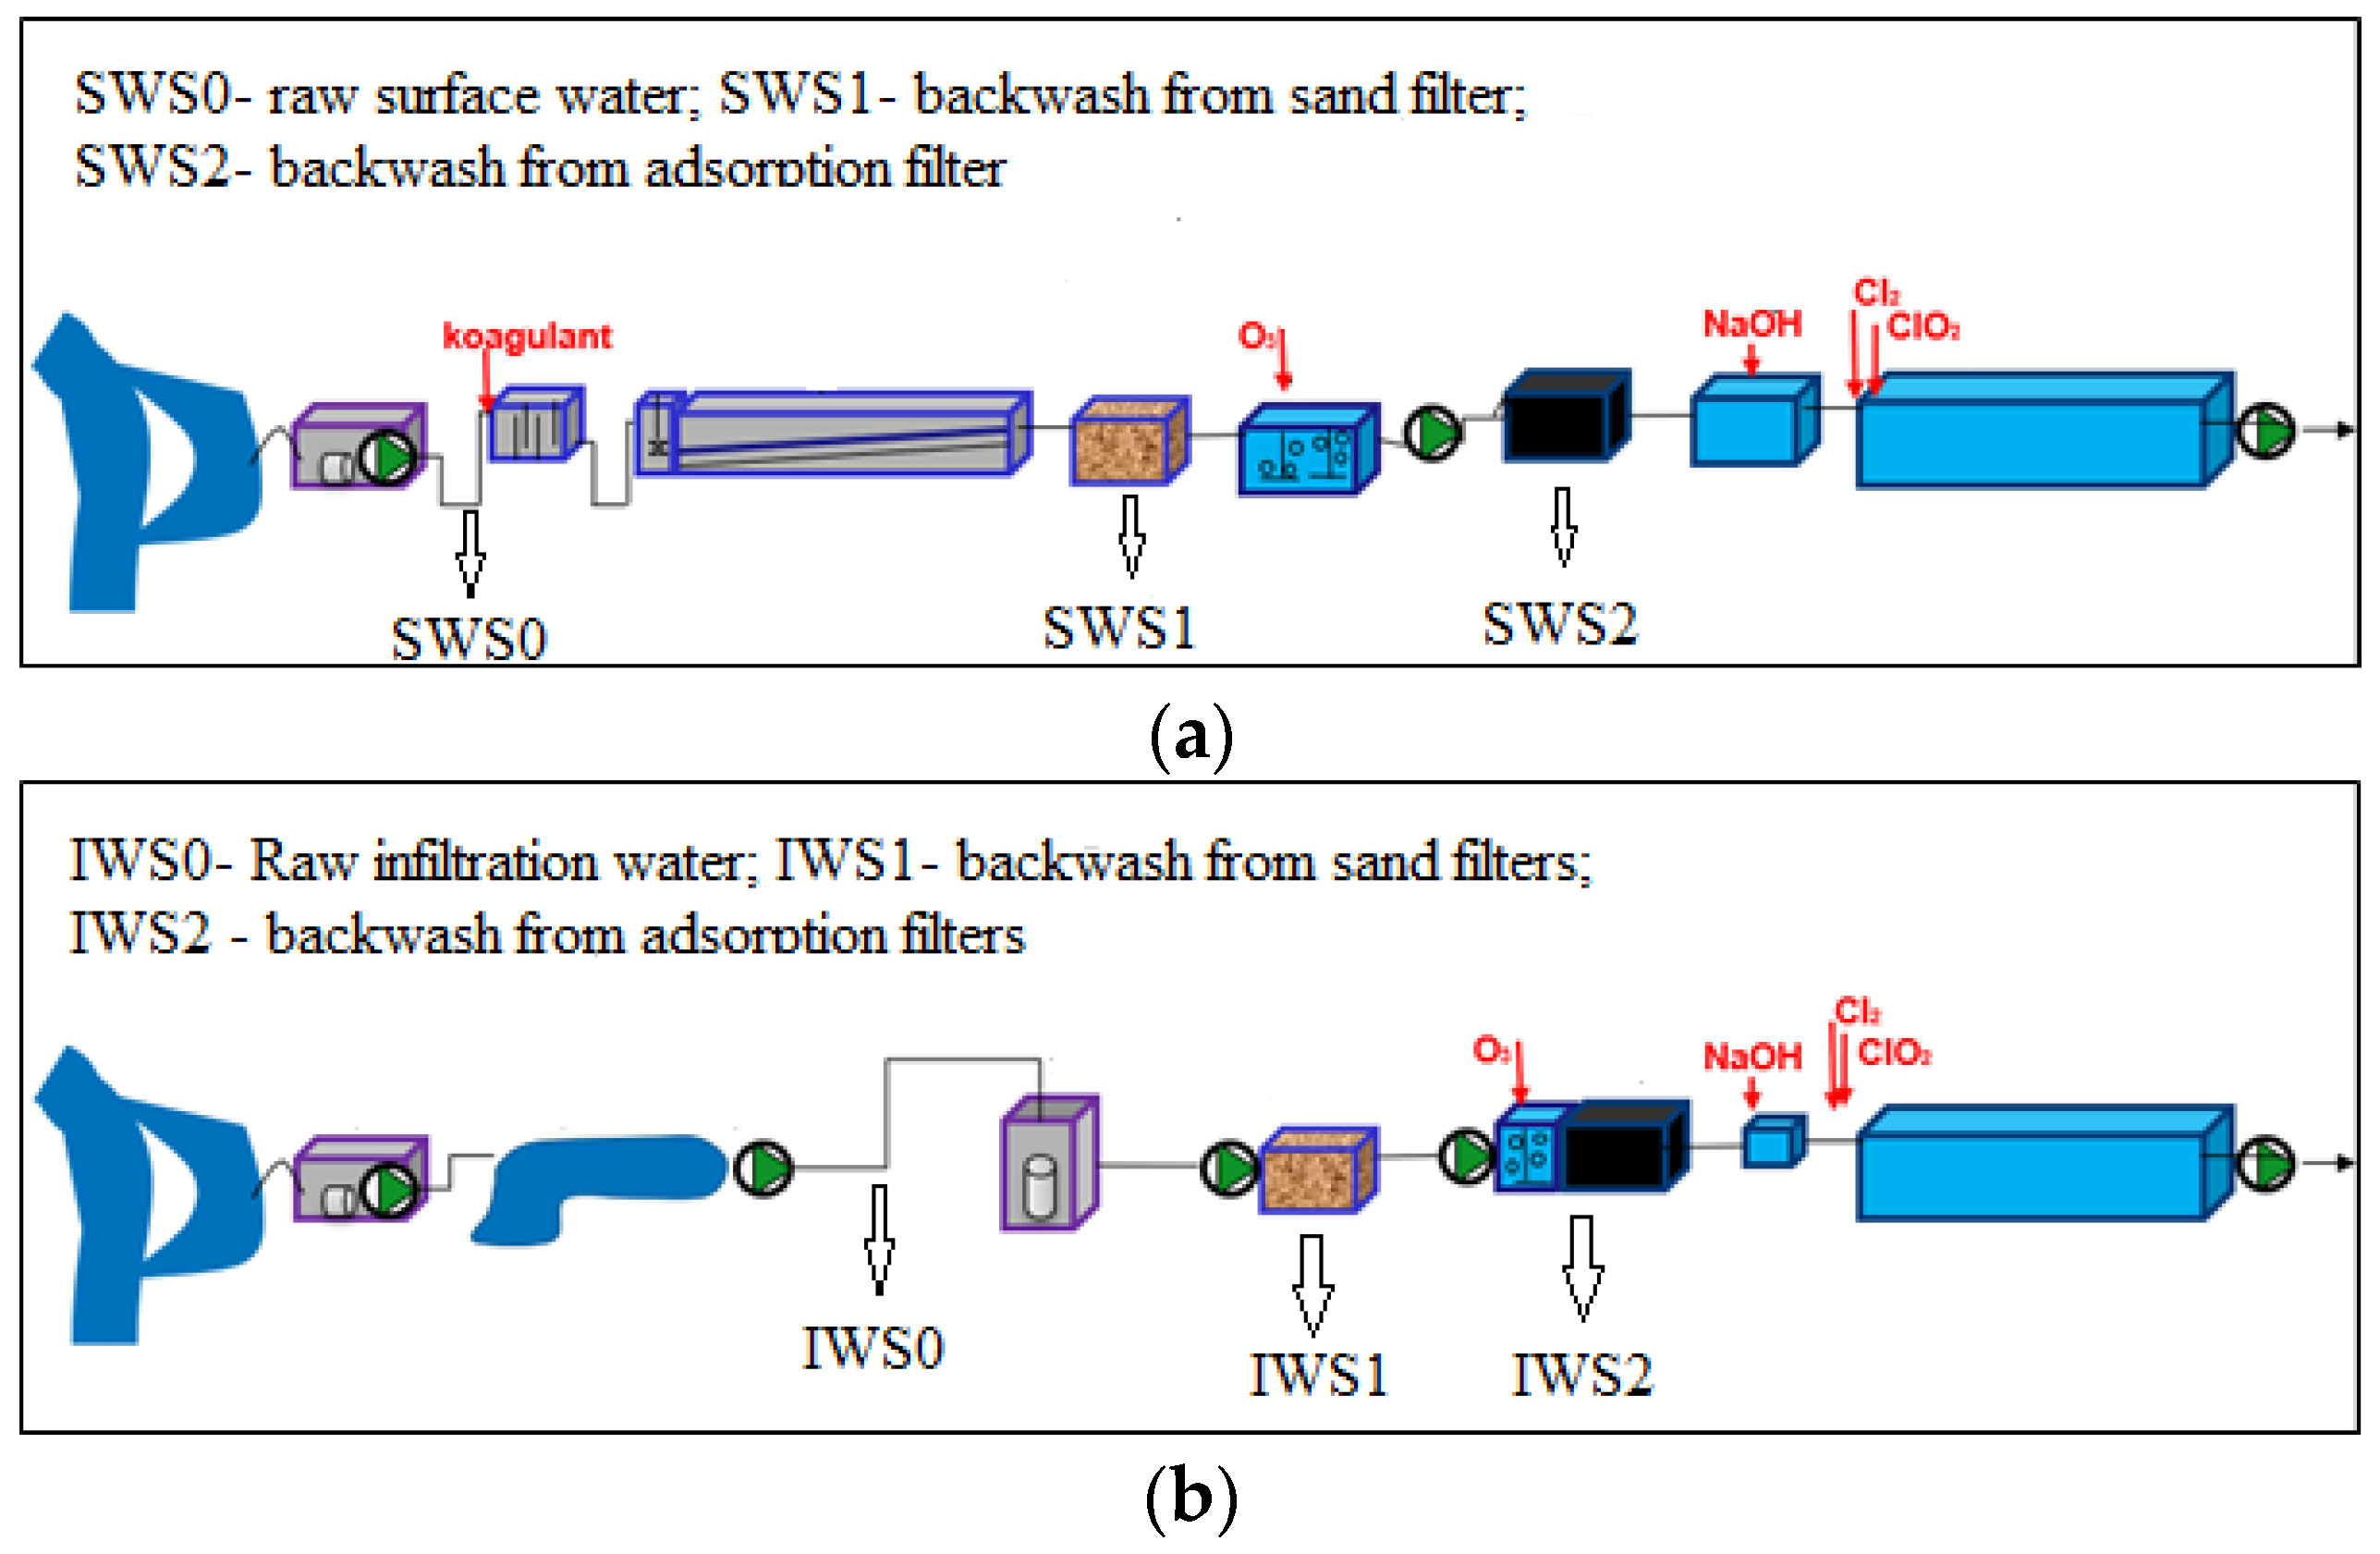
2. Methodology of Research

The research was conducted at two water treatment facilities, where the first intake of surface water and the second infiltration occurred. Both treated around 100,000 m3/d of water. Coagulation, sedimentation, sand filtration, ozonation, adsorption (filtered by granulated active carbon (GAC)), and disinfection with pH adjustment techniques are used to treat surface water (SWTP) (Figure 1a). Infiltration water (IWTP) is treated with aeration, sand filtration, ozonation, adsorption (poor filtration by GAC), and disinfection with pH correction (Figure 1b). In both cases, chlorine and chlorine dioxide were used for disinfection.
Samples of backwashing from GAC and sand filtration, as well as raw surface and infiltration water, were the focus of research between 2018 and 2020 (Figure 1a,b). The main objective of this research was to assess the possibility of returning the backwash to the system of treated water and define the pollution that must be removed before we can reuse the backwash.
Operating parameters for backwashing sand and granulated active carbon for the SWTP and IWTP, respectively, are shown in Table 1a,b. These materials were backwashed by air without being sterilized.
Between 2018 and 2020, samples of the backwashing water from the sand and GAC filters were taken monthly from each plant. Additionally, raw water samples were collected at the same time for examination in order to compare the composition of the backwashing with its quality criteria. It is reasonable to compare the quality of these two streams (raw water and washings) since recirculation of washings with a composition similar to the quality of the intake water does not interfere with the operation of the water treatment system and does not pose a health hazard.
The pH, conductivity, colour, turbidity, UV254 absorbance, total organic carbon, iron, manganese, ammonium ion, and the overall number of microorganisms between 22 °C and 37 °C, including Escherichia coli, Enterococci, and Clostridium perfingens, were all examined in all samples. Due to the use of aluminium coagulants in the coagulation process, all samples from the water surface treatment facility were examined with reference to their aluminium concentration. Following accepted procedures, every parameter was examined. Size exclusion chromatography and molecular weight distribution techniques were used to examine selected samples of raw water and backwashings.
Using a Hach multiparameter HQ440d, the potentiometric approach was used to measure conductivity and pH. While the UV254 absorbance and colour intensity were measured using a Shimadzu spectrophotometer 1800UV, the measurements of the iron, manganese, and ammonium ion concentrations were performed using the colorimetric method using a spectrophotometer. Turbidity was measured using a Hach turbidimeter 2100 N. Escherichia coli were evaluated using the Colilert test, and the total psychrophilic and mesophilic organism count analysis was carried out using culture methods in compliance with current Polish standards (PN-EN ISO 6222). The membrane filtration method was used to analyse Enterococci and Clostridium perfingens. A highly sensitive TOC analyser from Shimadzu was used to perform a combustion method analysis of the total organic carbon content. TOC-L
The molecular weight distribution was determined using chromatographic analysis using an UltiMate 3000 Dionex liquid chromatograph that has a DAD detector. In order to obtain the data, detection at 254 nm was used. A Shodex OHpak SB-G 6B, 10 m, 6 × 50 mm pre-column and a polymer column with a molecular size of 13 m and dimensions of 8 × 300 mm were employed. Based on variations in peak regions in chromatographs, quantities of molecules of a certain size were analysed. The PSS salts from the American Polymer Standards Corporation, with molecular masses of 891, 1600, 3420, 7420, 15,650, and 29,500 Da, were used for calibration.

3. Results and Discussion

The amount of backwash in the SWTP was analysed, and it was found to be between 3.4 and 6.6% of the water used, with the sand backwash system accounting for between 77.9 and 91.5% of all backwashes. Similar to this, the quantity of backwash from the infiltration treatment plant ranged from 4.9 to 6.1% of the water collected, with sand backwashing accounting for 90% of all backwashes in the highest reported result. Due to the high proportion of sand backwash and the uneven production of GAC backwash (operation frequency: several days; see Table 1a,b), combining the two types of backwashings prior to their pre-treatment is now required. Due to the share of washings from sand filters in the total amount of wastewater, the composition of these two washing streams is crucial in determining whether they can be mixed with raw water. Combining these two washing streams will guarantee a reduction in the daily variability of the amount of washing generated.
Backwashings can be returned to the start of the main water treatment system in both plants up to 100,000 m3 per month (Figure 2) if their composition does not pose a health risk or reduce the effectiveness of unit processes. Hunan et al. [17] showed that the impact of recycled washings on the water treatment system is influenced by the quantity of washings and particularly by the proportion of washings to the total stream of treated water (raw water and washings). Similar results were obtained by recycling 5–10% of the washings into the raw water at Bhagirathi WTP, which improved the removal efficiency of total and dissolved organic carbon [18].
According to their composition with raw surface or infiltration water quality, the necessary levels of pre-treatment of backwashes prior to their return to the water treatment system were evaluated. Table 2 displays the quality parameter ranges for raw and backwashed water.
According to an analysis of backwash from the surface of the water treatment plant, the level of organic pollution was similar to the TOC concentration in raw water. The sand backwash system and raw water both had quotient TOC concentrations in the range of 0.81–1.34, which was similar to the GAC backwash system (Figure 3). In conclusion, taking organic pollution into account, both types of backwash systems can be returned to the beginning of the water treatment system without pre-treatment. Other studies of the composition of washings from surface water treatment revealed a significantly higher level of organic contamination, which was probably related to the intake of water with a higher concentration of TOC [19].
The colour of both types of backwashes was at the same level as raw water; this is because of the effects of organic substances present in water and backwash. This justifies the co-relationship between TOC and colour. A similar result is shown by Huang et al. [20] state that the colour on the surface of the water is due to the presence of humic substances (organic compounds).
There was a significant amount of suspension in the washings, and their turbidity was even 25 times higher than that of the surface water that had been collected. These results are similar to the other analysis of sand filtration [21]. Except for turbidity, the presence of a large number of microorganisms was found, which was confirmed by studies of the composition of sand filter washings conducted worldwide [3,21,22]. Microorganisms, especially pathogenic or potentially pathogenic bacteria, can have a negative impact on consumers’ health. In the washings from the sand filters, the amount of psychrophilic and mesophilic bacteria was directly proportional to the amount in the intake water (Figure 4). This makes it difficult to return these washings to the water treatment system because the efficiency of their elimination from the washings should be greater in high pollution seasons. The variability of the number of microorganisms in washings depending on the season was also found by Wang et al. [23].
The number of microorganisms in GAC’s backwash was much higher than in intake water and sand backwash, and no correlation between them was found. Additionally, the amount of Clostridium perfingens in the sand backwash system was higher than in the raw water and the GAC’s backwash system (Table 2), demonstrating the necessity to disinfect the backwash system before returning to the water treatment trial as it could otherwise be a threat to human health [24]. According to research from many different plants, the key obstacle preventing the reuse of sand backwash systems is the presence of microorganisms in the backwash [25]. Around 100% efficiency was shown by Newcombe and Dixon [8] in the removal of microorganisms by physical and/or chemical disinfection. Additionally, the ultrafiltration process is defined as effective in water biostabilization [15].
In general, the composition of the sand backwash system correlated with the quality of the raw water; however, a similar correlation was not found in the GAC backwash system. Its composition was dependent on the microorganisms developing phase and the intensity of its flash away [26,27], which demonstrates variation in their number over the exploitation time (Figure 5).
It is unclear whether the aluminium coagulant used in coagulation processes, which is present in sand’s backwash, is effective in enhancing water treatment efficiently. Aluminium pollution can be removed through sedimentation or filtration processes and is not a limiting factor for backwash to return to the water treatment system. Redirecting the appropriate volume of washings through the water purification system has occasionally been shown to increase water purification efficiency [28].
In contrast, backwash produced in an infiltration treatment plant had a higher suspension content of iron and manganese compared to raw water (Table 2) and a similar amount of organic compounds (TOC and UV absorbance).
Raw, unfiltered water and the other two types of backwashes (Figure 6) have comparable molecular weight distributions. It provides evidence regarding the characteristics of pollutants and their susceptibility to similar treatment procedures. In conclusion, both plants’ coagulation and absorption procedures can remove the organic compounds from the backwash.
Suspension in the sand’s backwash was 26.7–242.7 times higher than in filtration water. In GAC’s backwash, the maximum value was 2.0. The permitted total number of psychrophilic and mesophilic microorganisms is generally significantly lower in the GAC’s backwash when all examined factors are taken into account (Figure 7).
It is worth emphasising that only a small number of samples from both types of backwashes contain the indicated microorganisms when raw water temperatures are high (summer season). This means that the health risk level is lower than in surface water. However, increased numbers of psychrophilic and mesophilic microorganisms can be dangerous for our health and decrease water treatment efficiency. Therefore, the backwash should be disinfected before reuse in the water treatment system.
Due to the fact that the presence of sparingly soluble iron compounds determined the turbidity of the backwashings, there was no correlation between turbidity and the quantity of microorganisms. This is confirmed by the correlation found between these parameters in both types of backwashings (Figure 8). The possibility of using sedimentation as a backwashing pre-treatment method to lower the values of both parameters is indicated by the presence of iron compounds in undissolved form.
Both types of backwashes contained some manganese compounds, whose concentration in the sand’s backwash was on average 7.2 times higher than in raw water and was directly proportional to the turbidity (Figure 9). In contrast, the manganese concentration in GAC’s backwash was lower than the recommended level for drinking water (0.02 g/m3). The presence of returned manganese in the backwash treatment system has caused a variety of problems with its removal in the treatment trial. As a result, manganese compounds need to be removed before returning to the backwash.
The composition of washings in both plants proves the need to pre-treat them before recirculating them through the technological system, especially in the processes of sedimentation and/or coagulation and disinfection. Such a solution requires research on the effectiveness of these processes and optimising the performance parameters of the purification processes used. As a result, it is impossible to determine the investment or operational expenses of washings pre-treatment, but it is possible to determine the amount of washings recycled and thus limit the amount of water taken up. For surface and infiltration WTP, respectively, the washing volume ranges from 54,874–110,564 m3/month and 97,224–130,954 m3/d. This means that it is possible to reduce the fees for water intake and sewage disposal, which were estimated at EUR 145,000/year and EUR 225,000/year, respectively, in the surface and infiltration water treatment plants depending on the amount of washings obtained. In addition, in the context of the growing water shortage in the world, the research results indicate the possibility of increasing water resources in the company.

4. Conclusions

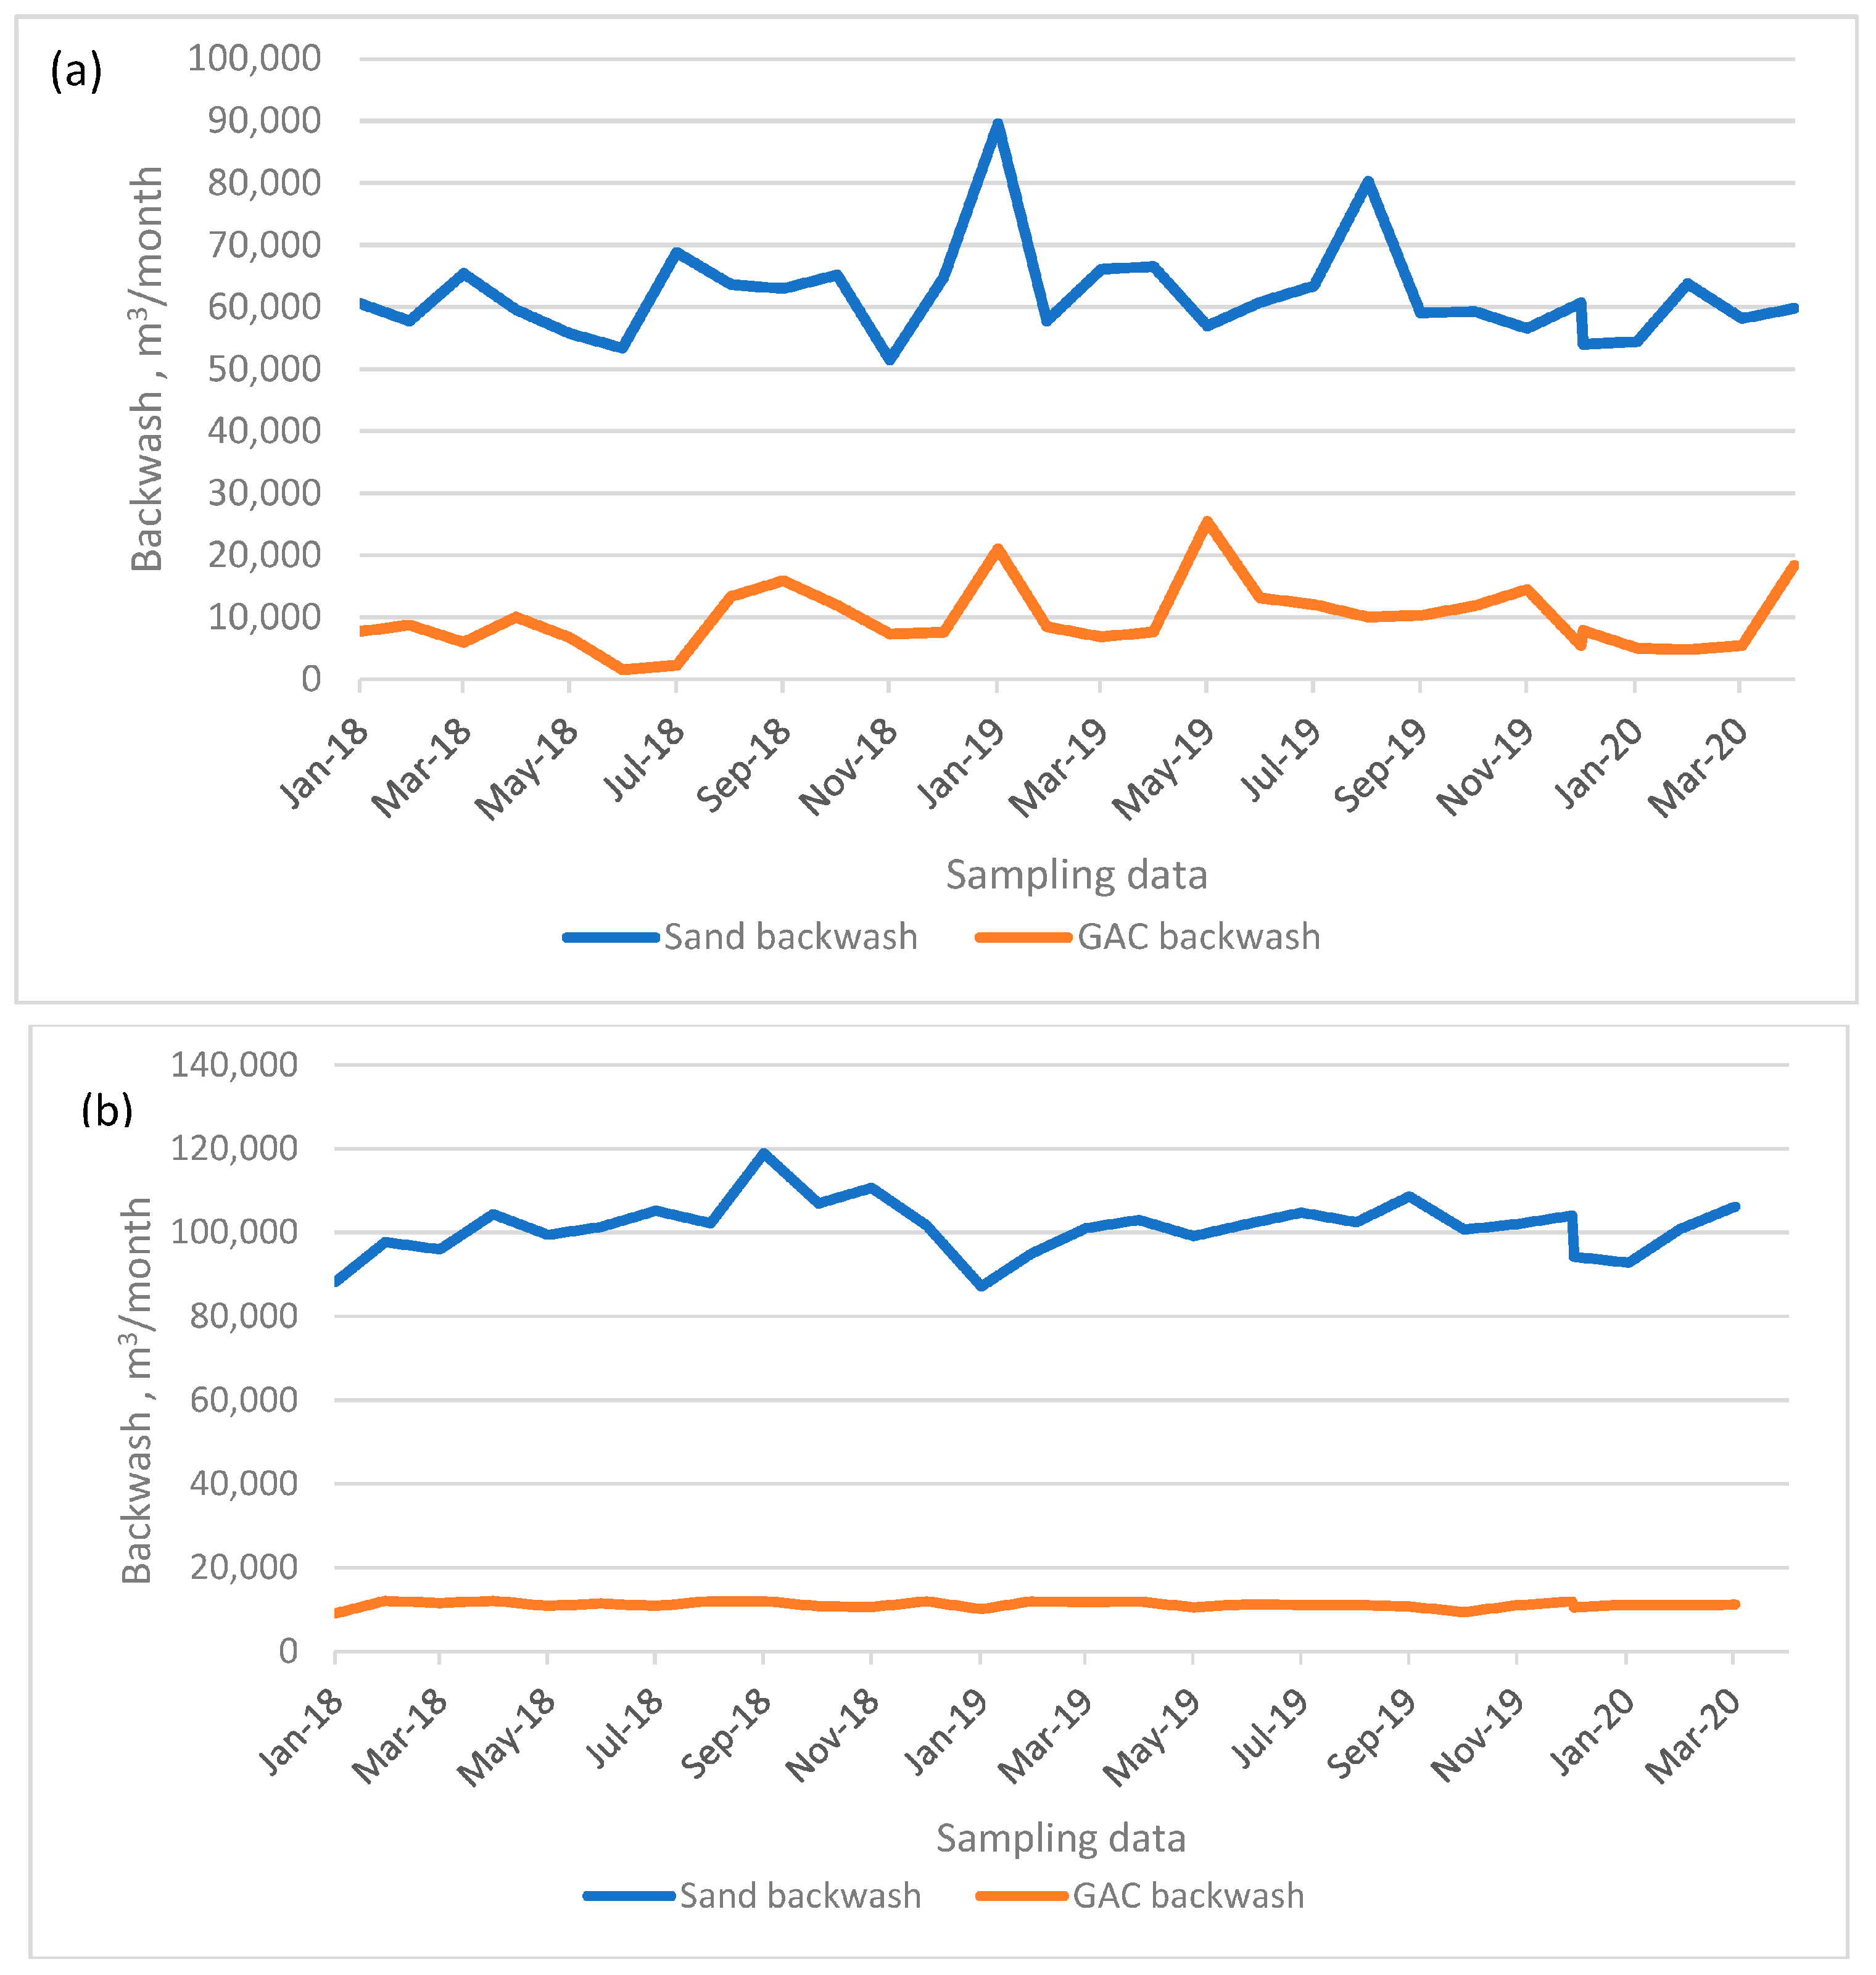
  • The amount of backwashed water, independent of the water type, is about 5% treated water.
  • Recirculating the sand backwash to the treatment system is reasonable, as it comprises 90% of all backwashings. GAC backwashing is reasonably used in combination with sand due to the variability in its amount and small share. Recirculation allows for reduced water intake and lower operating costs.
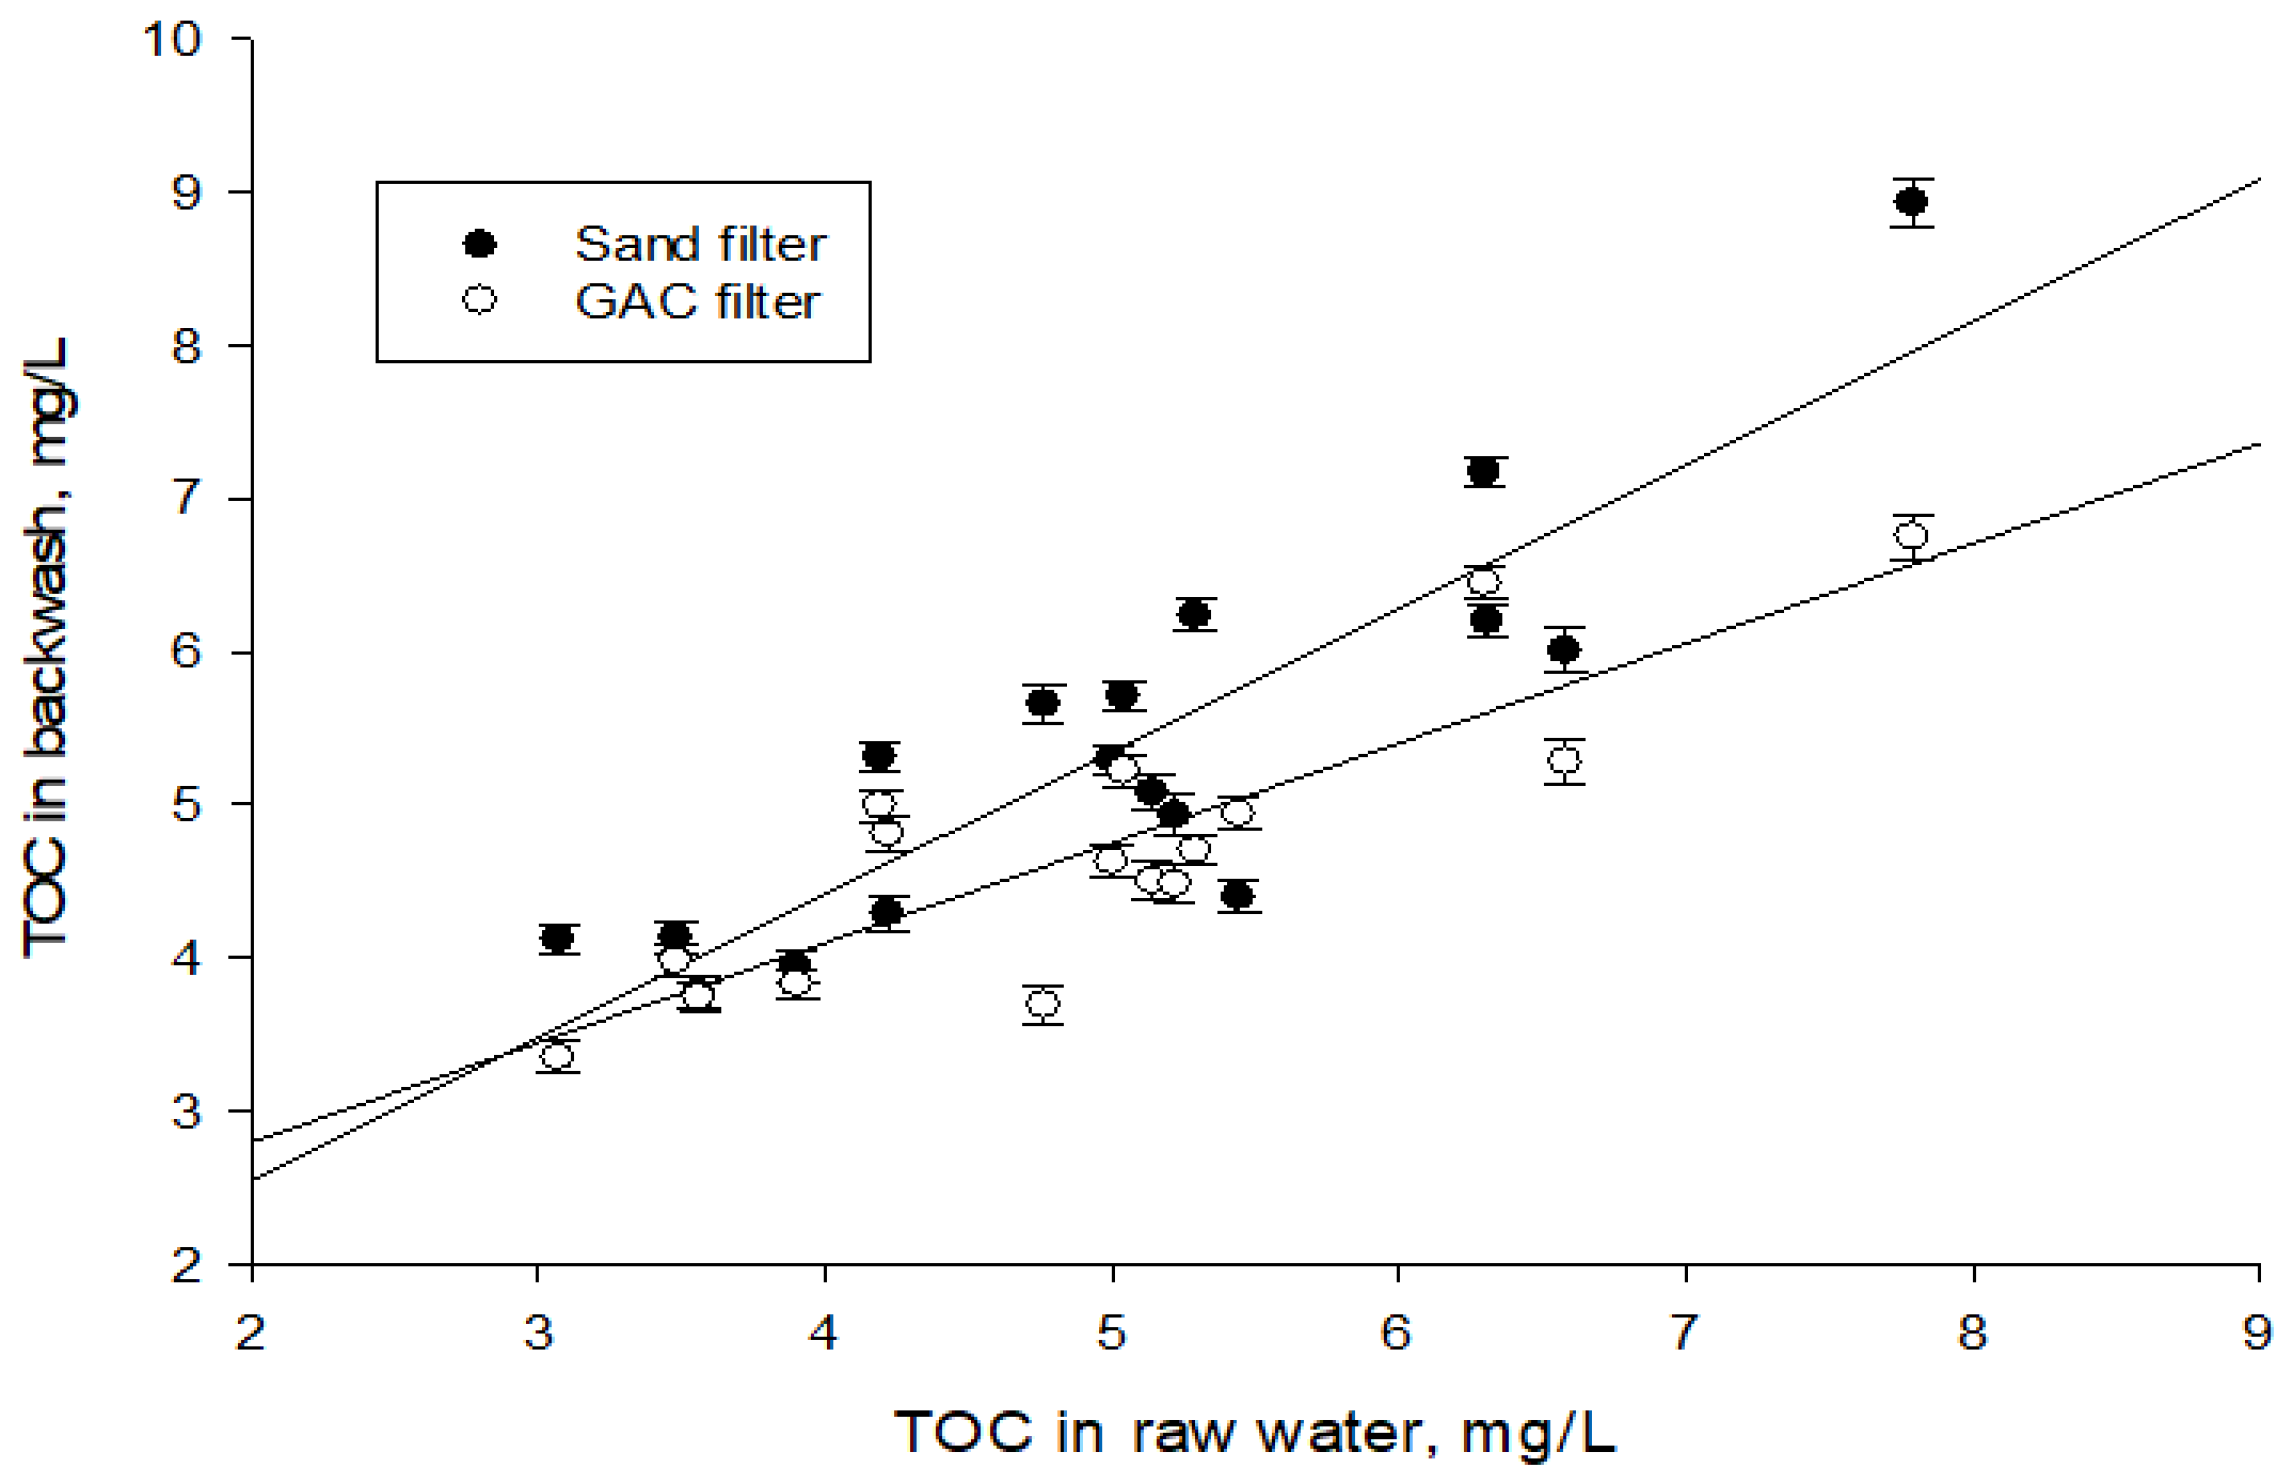
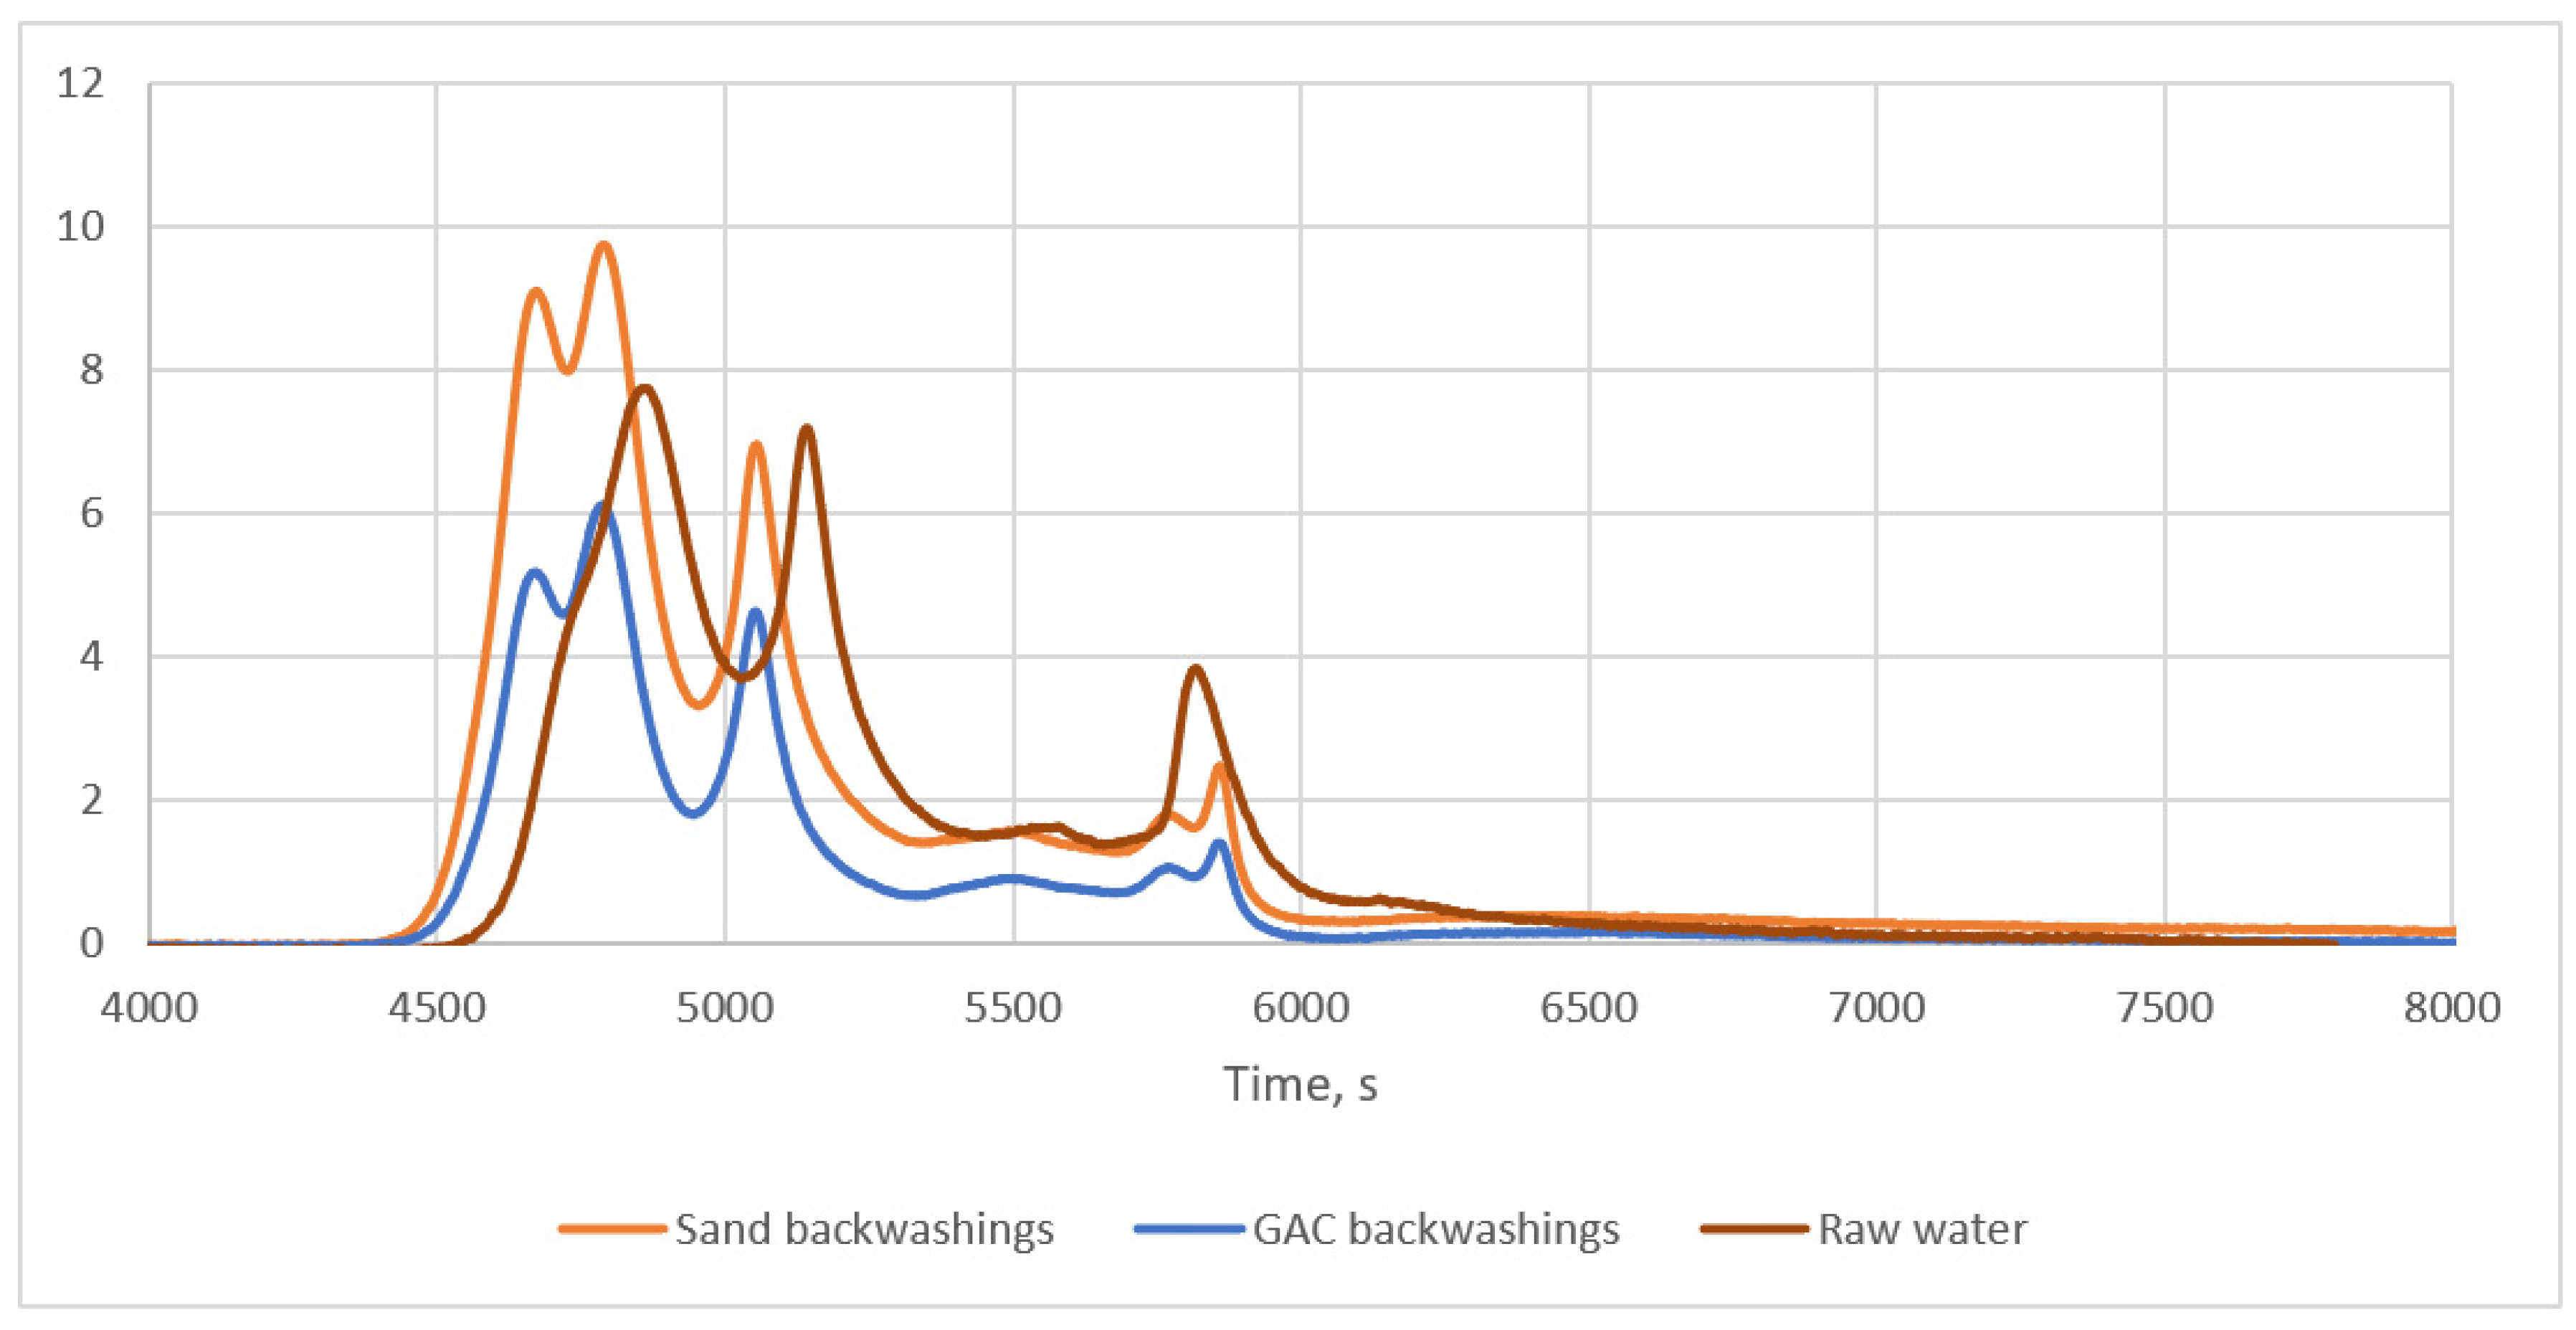
  • Organic contamination from backwashing in both plants was similar to that in the intake waters.
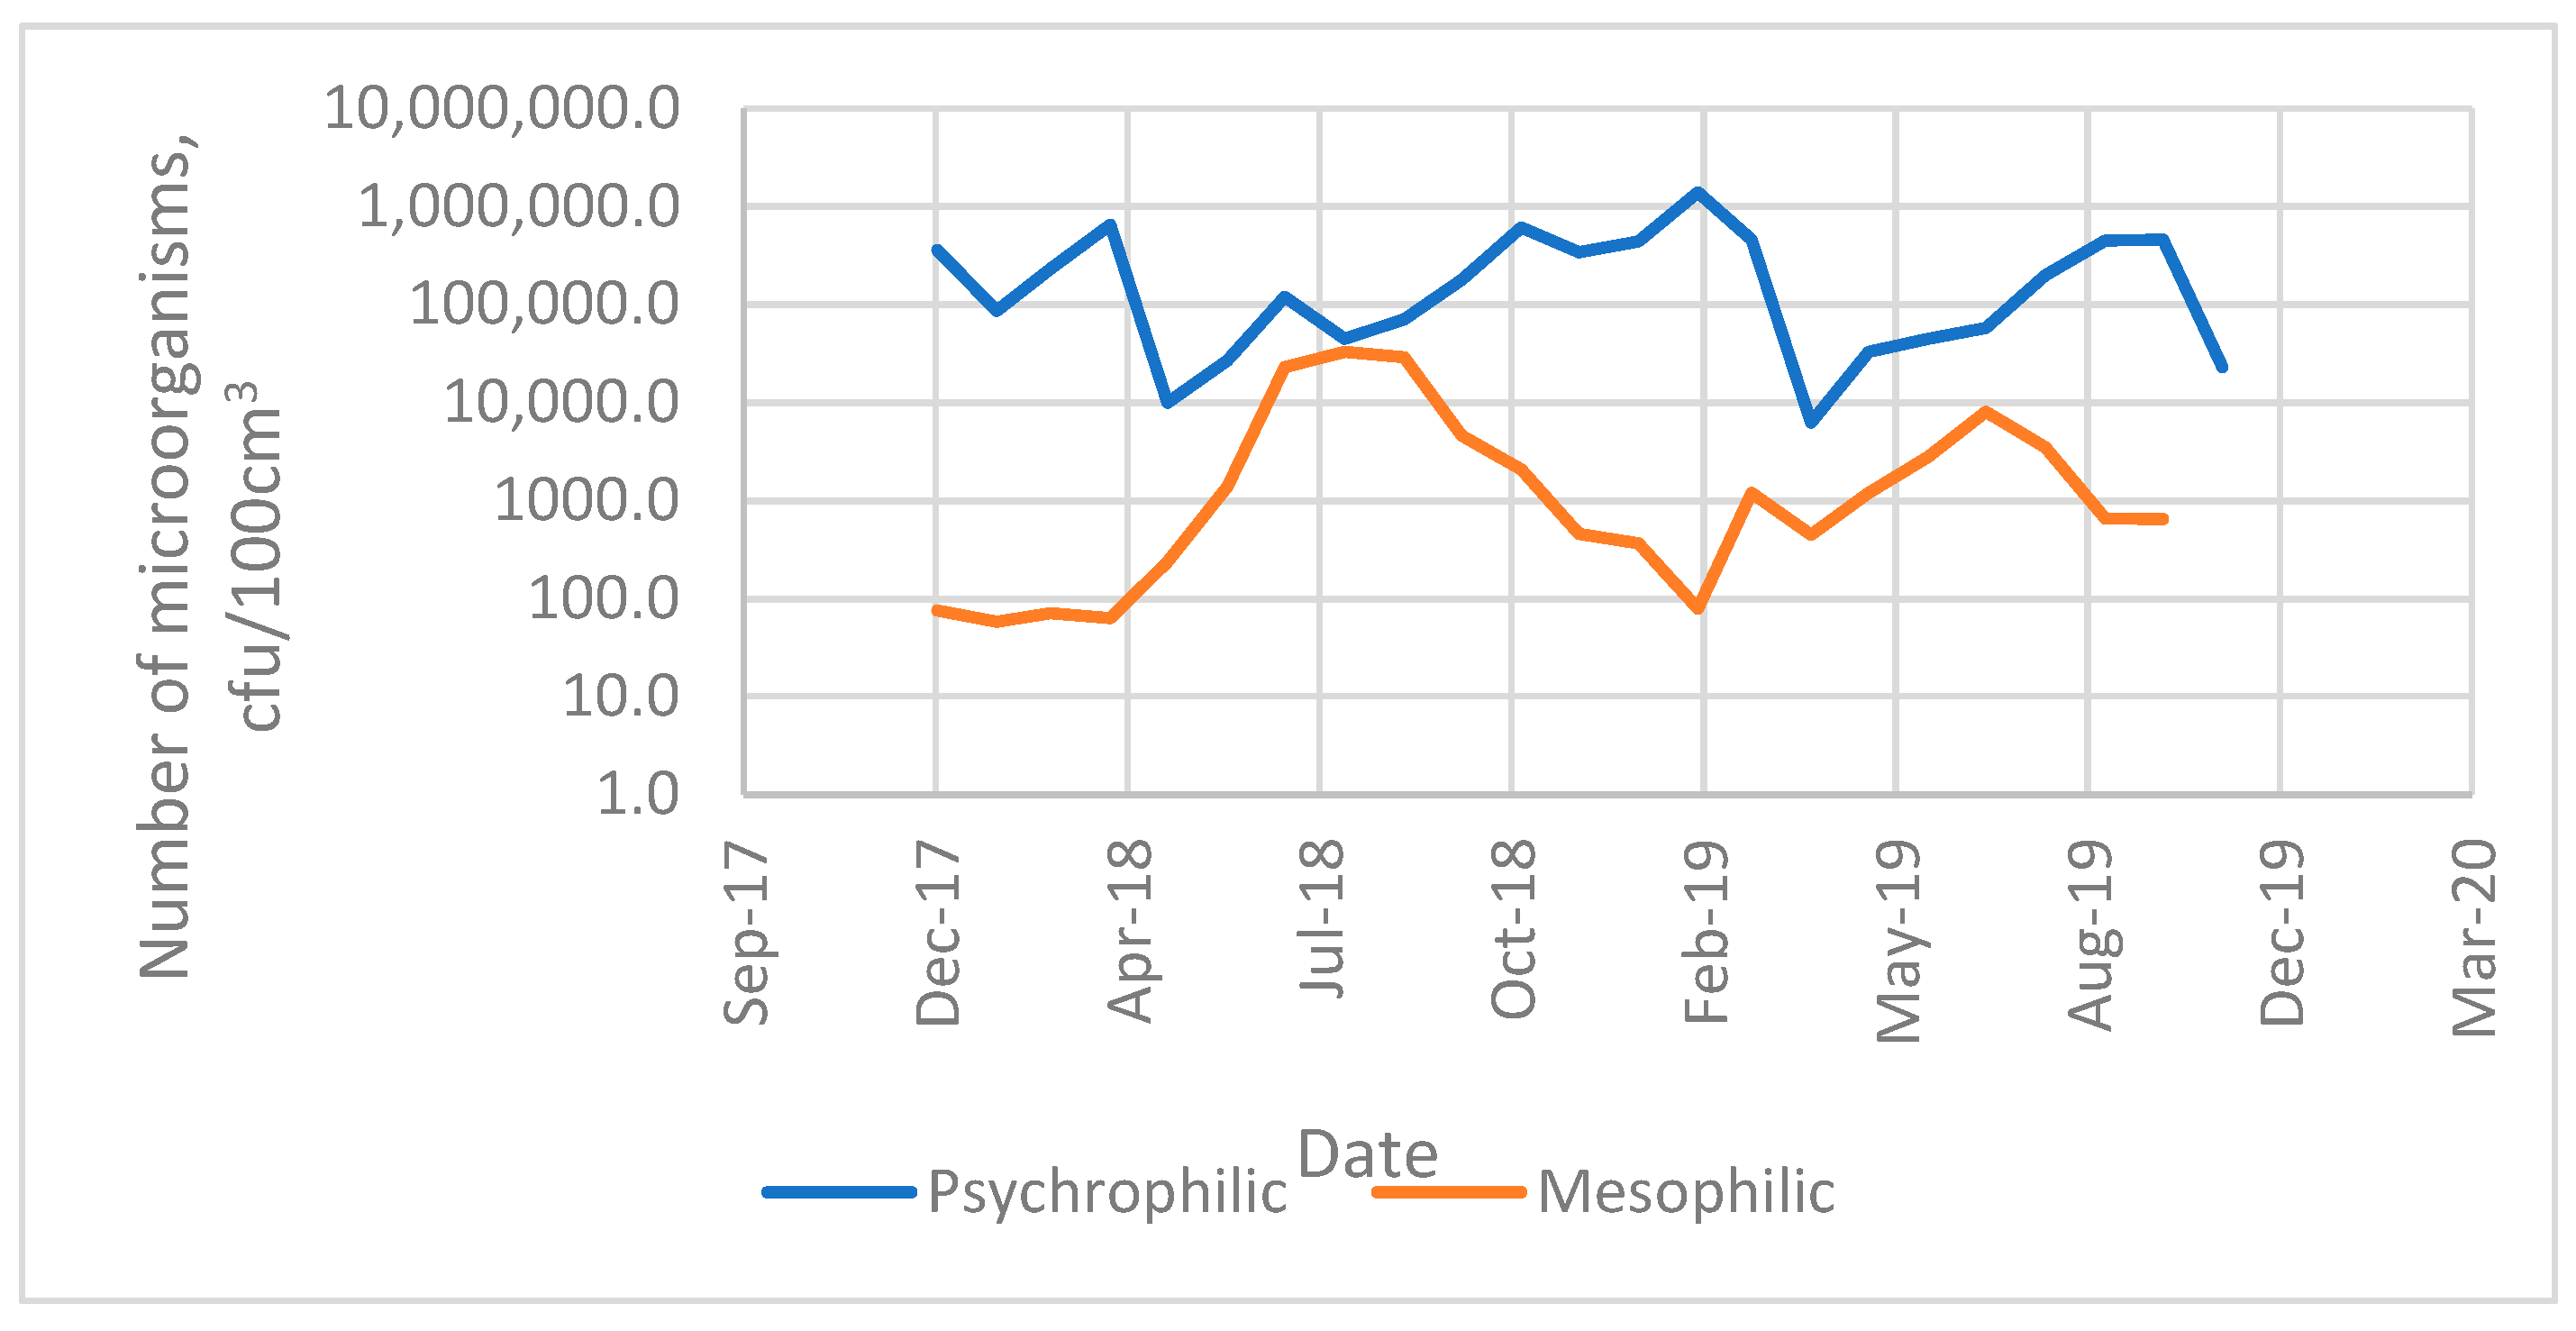
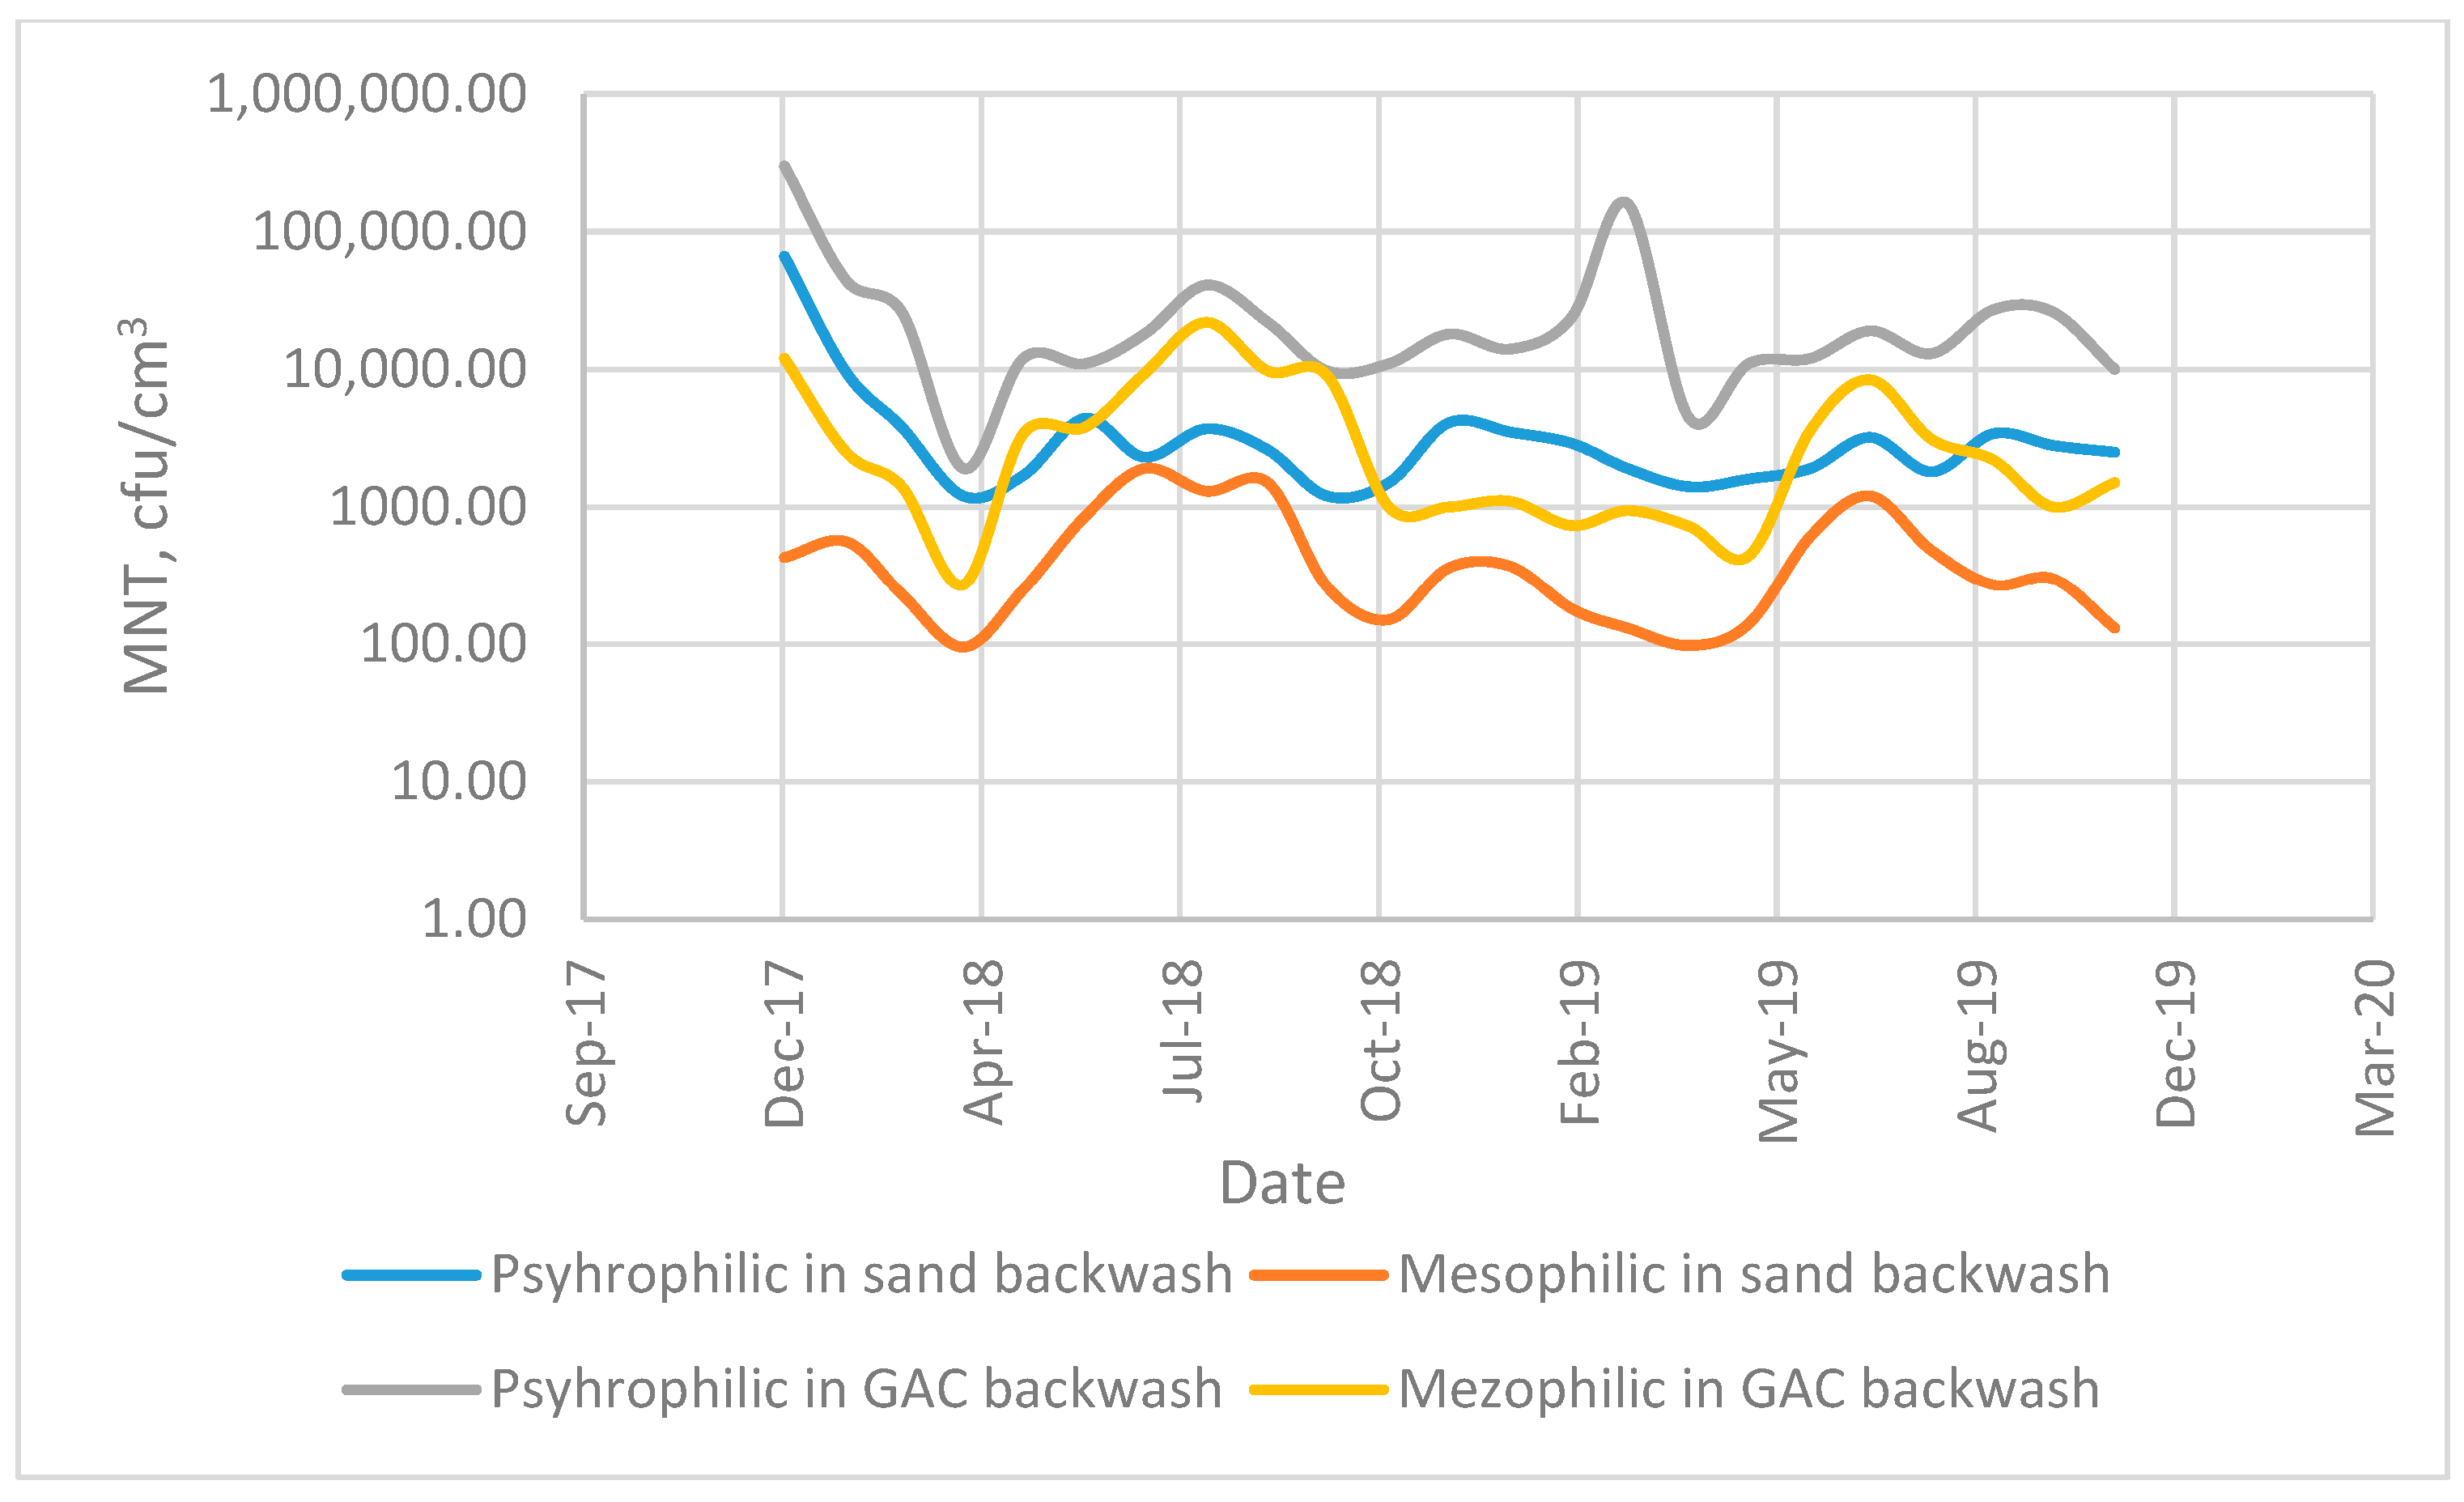
  • GAC backwashing, regardless of the type of treated water, is characterised by the presence of a greater microorganism content and therefore poses a greater potential health risk. GAC’s small share of the full amount of washings reduces this risk.
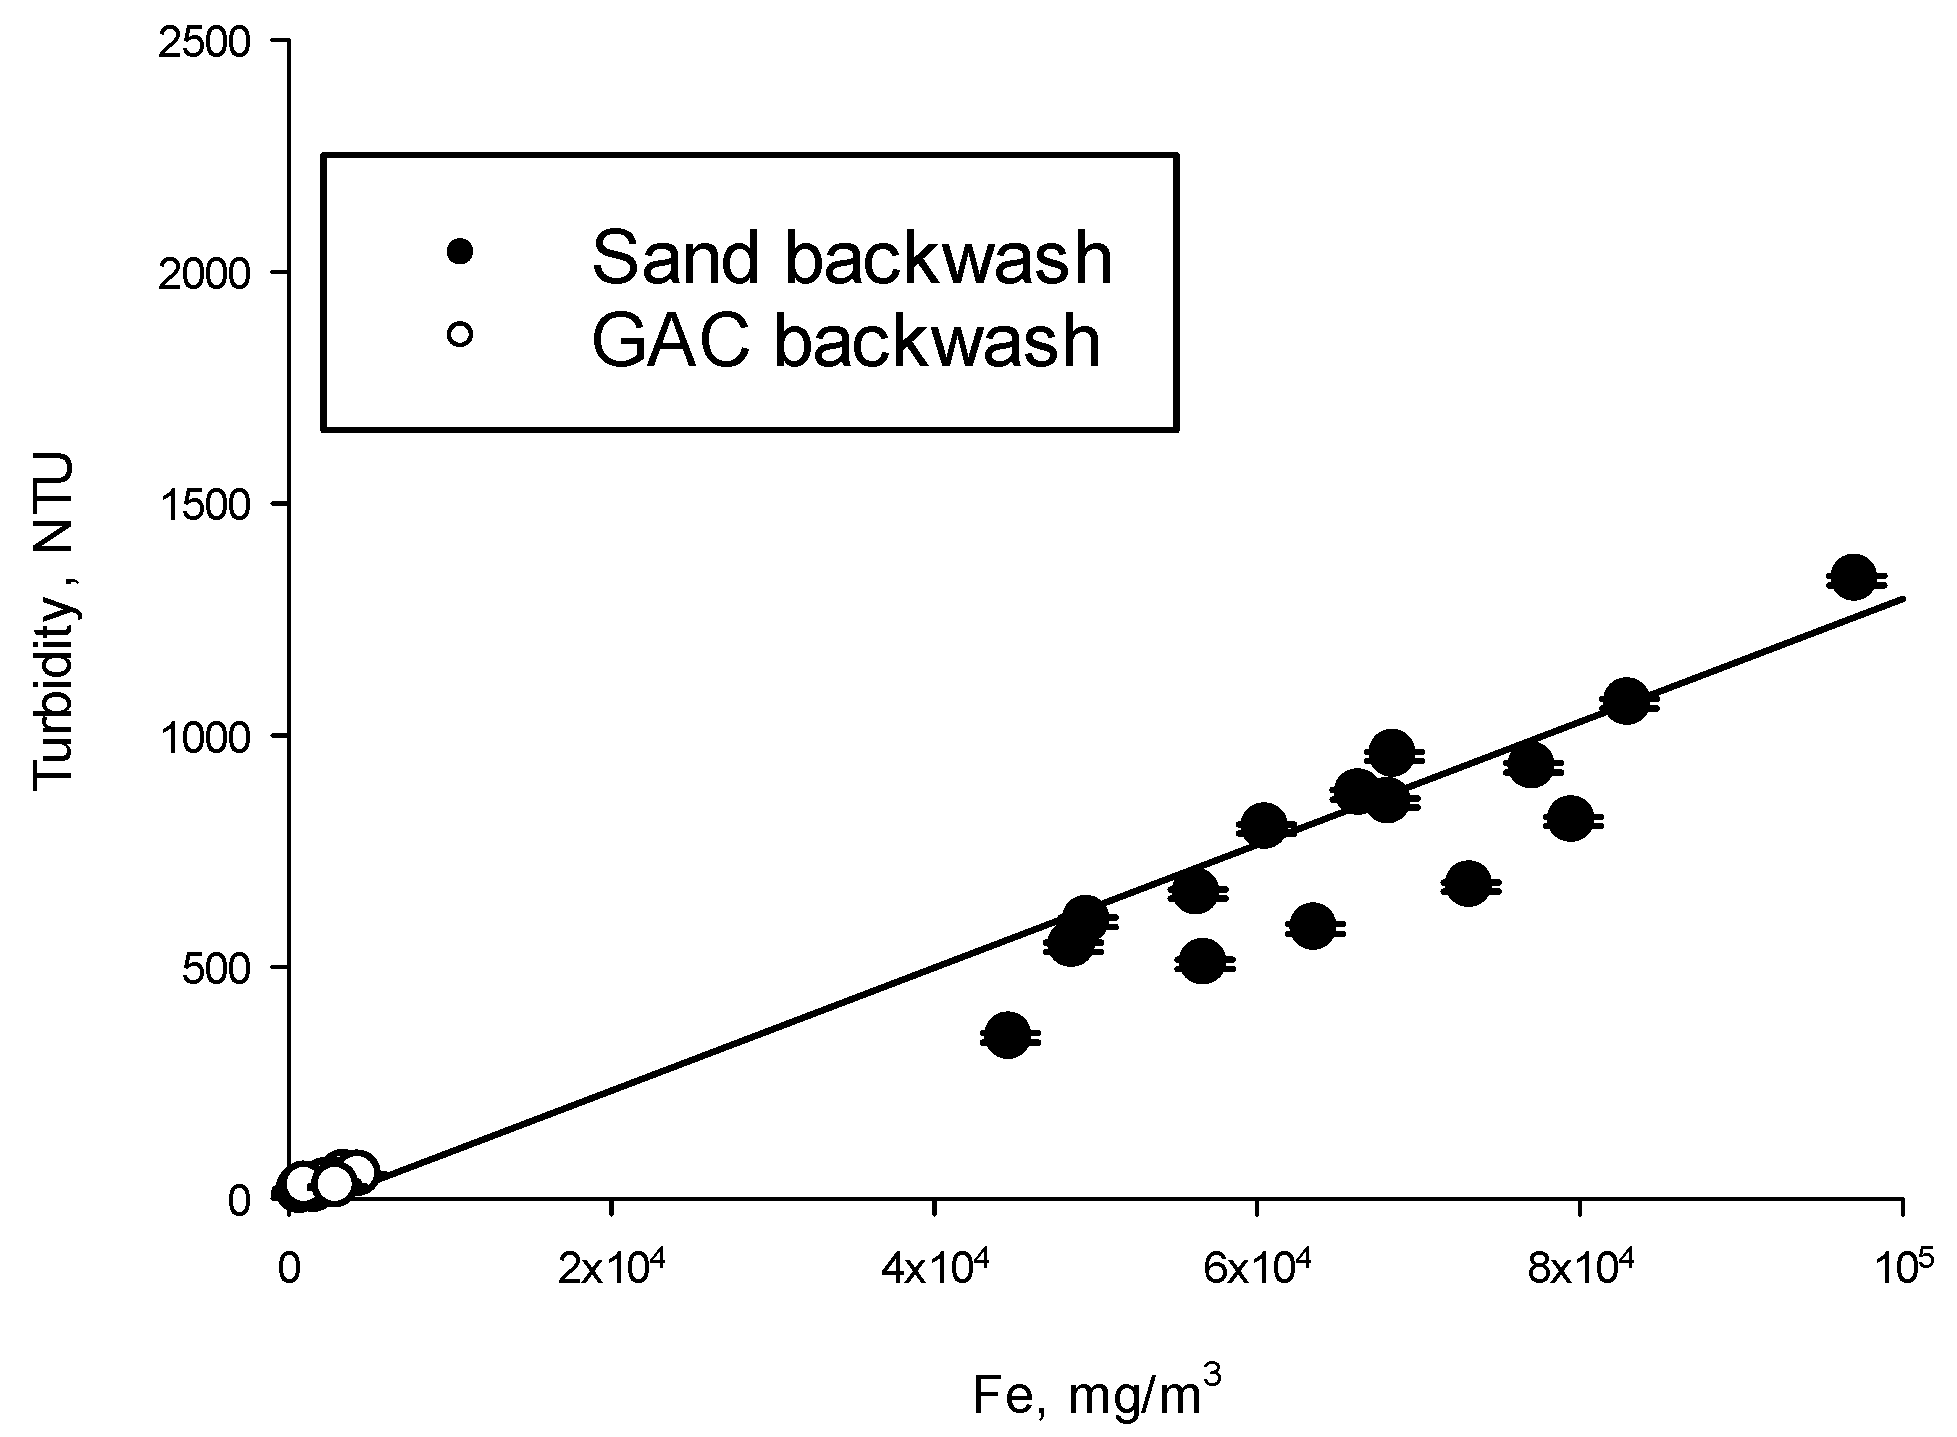
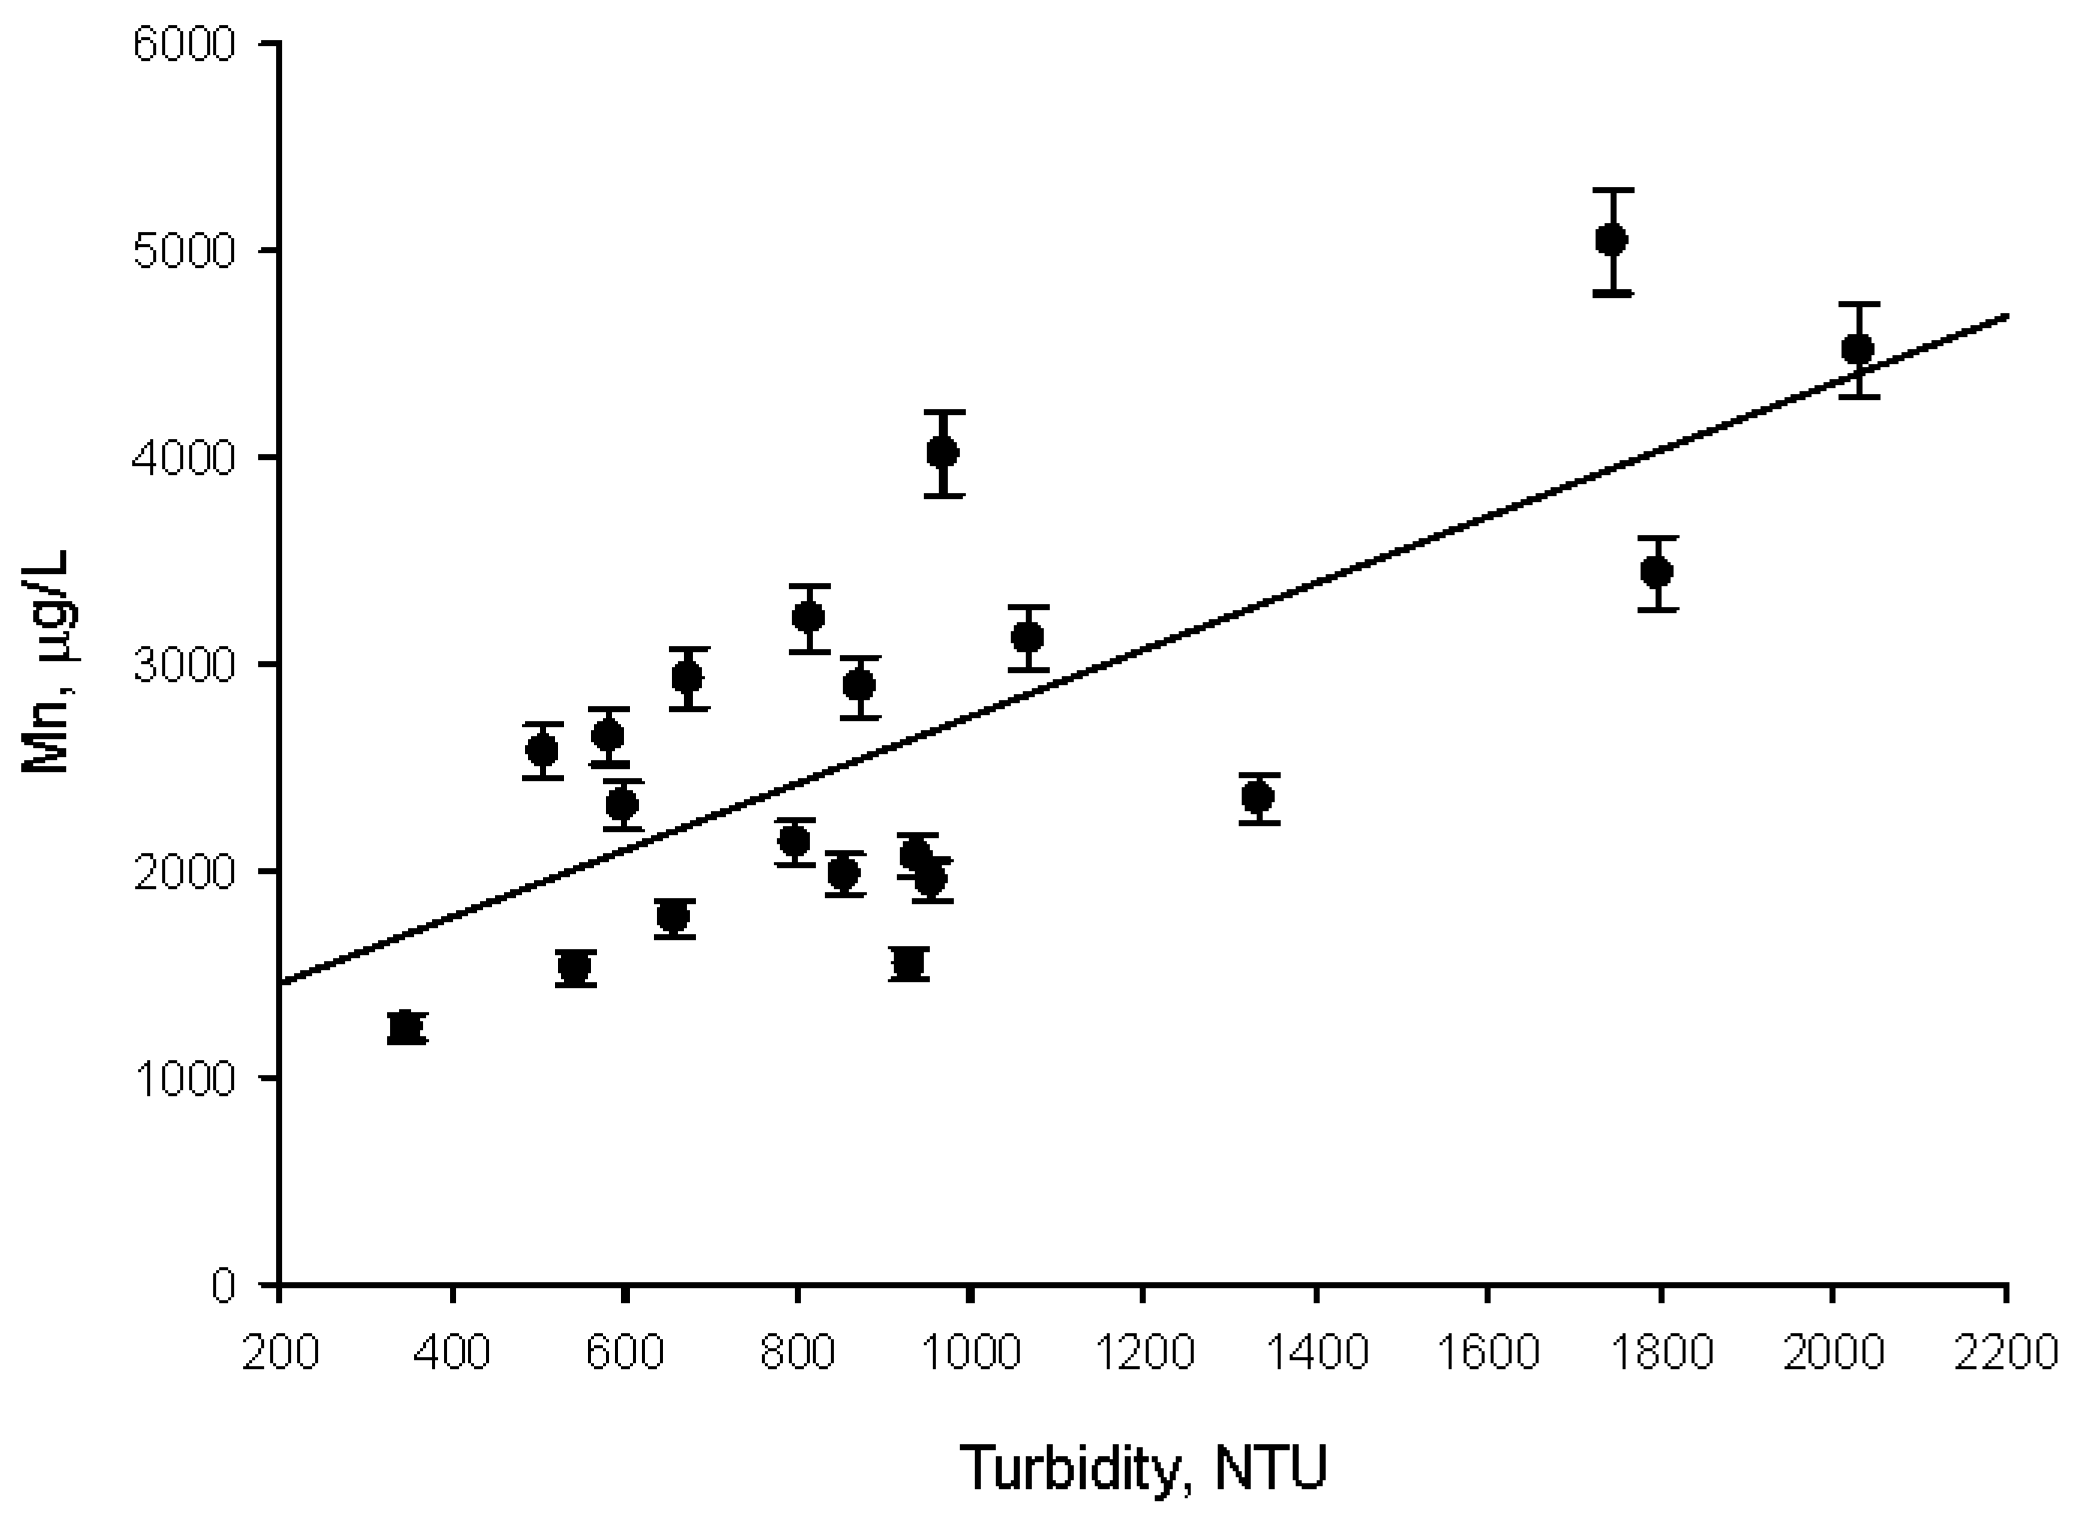
  • In the case of surface water treatment, the water quality parameters in need of removal of returned backwashings by the technological system are microorganisms and suspensions.
  • Iron and manganese compounds, suspensions, and occasionally microbes are the water quality criteria that need to be removed in the case of surface water treatment before using the backwashings again.
  • In the backwashings from IWTP, the presence of pathogenic microorganisms was found in a single sample, while in the washings from SWTP, they were present in all samples from the backwashings.
  • Backwashings from SWTP should be pre-treated in sedimentation or other suspension separation processes and disinfected before being returned to the system.
  • Backwashings from IWTP should be subjected to suspension separation, e.g., in sedimentation, filtration, or membrane separation processes, and periodically disinfected. The ultrafiltration process would ensure the elimination of all parameters limiting the return of backwash to the system.
  • On average, 870,000 m3 and 1,350,000 m3 per year in the surface and infiltration WTP, respectively, can be reused, but the amount of recycled water will depend on the applied pre-treatment processes and the number of losses during these processes.
  • Recycling of the washings will allow to reduce the fees for the use of the environment, even to EUR 150,000 and EUR 250,000 per year for surface and infiltration WTP, respectively.

Author Contributions

Methodology, M.W.; Formal analysis, M.W.; Investigation, H.U.-K.; Data curation, H.U.-K.; Writing—original draft, M.W. All authors have read and agreed to the published version of the manuscript.

Funding

This research was funded by Ministry od Education and Science in Poland, grant number 0019/DW/2017.

Data Availability Statement

The data presented in this study are available on request from the corresponding author. The data are not publicly available due to Company Politics.

Conflicts of Interest

The authors declare no conflict of interest.

References

  1. Thier, A.; Tyli, I.; Żmija, K.; Thier, A.; Tyli, I.; Żmija, K. Management of water resources and their consumption within the circular economy. In Restructuring Management: Models–Changes–Development’; Cracow University of Economics: Kraków, Poland, 2020; Chapter 16; pp. 203–226. ISBN 978-83-7285-942-6. [Google Scholar]
  2. Falkenmark, M.; Lindh, G. Water for a Starving World; Routledge: Abingdon, UK, 2019. [Google Scholar]
  3. EPA United States Environmental Protection Agency. Drinking Water Treatment Plant Residuals Management Technical Report, Summary of Residuals Generation, Treatment, and Disposal at Large Community Water Systems; EPA United States Environmental Protection Agency: Washington, DC, USA, 2011.
  4. Zielina, M.; Dąbrowski, W. Energy and Water Savings during Backwashing of Rapid Filter Plants. Energies 2021, 14, 3782. [Google Scholar] [CrossRef]
  5. Zimoch, I.; Lasocka-Gomułam, I. Możliwa skuteczność technologiczna recyrkulacji wód popłucznych w układzie oczyszczania wód podziemnych w stacji “Mosina” koło Poznania. Ochr. Sr. 2015, 37, Nr 3. [Google Scholar]
  6. EPA (The Environmental Protection Agency). Filter Backwash Recycling Rule, Technical Guidance Manual; EPA (The Environmental Protection Agency): Washington, DC, USA, 2002.
  7. Doménech-Sánchez, A.; Laso, E.; Berrocal, C.I. Water loss in swimming pool filter backwashing processes in the Balearic Islands (Spain). Water Policy 2021, 23, 1314–1328. [Google Scholar] [CrossRef]
  8. Newcombe, G.; Dixon, D. Interface Science in Drinking Water Treatment; Academic Press: Cambridge, MA, USA, 2006; p. 10. [Google Scholar]
  9. Regulation (EU) 2020/741 of the European Parliament and of the Council of 25 May 2020 on minimum requirements for water reuse. Available online: https://eur-lex.europa.eu/legal-content/EN/TXT/PDF/?uri=CELEX:32020R0741 (accessed on 2 February 2023).
  10. Dymaczewski, Z.; Krajewski, P. Technologie Obróbki Osadów z Uzdatniania Wody i Możliwości ich Wykorzystania. In Zaopatrzenie W Wodę, Jakość I Ochrona Wód; Publischer of Poznań University of Technology: Poznań, Poland, 2014. (In Polish) [Google Scholar]
  11. Gottfried, A.; Shepard, A.; Hardiman, K.; Walsh, M. Impact of recycling filter backwash water on organic removal in coagulation–sedimentation processes. Water Res. 2008, 42, 4683–4691. [Google Scholar] [CrossRef] [PubMed]
  12. Nowacka, A.; Włodarczyk-Makuła, M. Charakterystyka osadów powstających w procesach uzdatniania wody ze szczególnym uwzględnieniem osadów pokoagulacyjnych, Nauka i Technika, Zaopatrzenie w wodę. Technol. Wody 2014, 6, 34–39. (In Polish) [Google Scholar]
  13. Crittenden, J.C.; Trussell, R.R.; Hand, D.W.; Howe, K.J.; Tchobanoglous, G. MWH’s Water Treatment Principles and Design, 3rd ed.; John Wiley & Sons: Hoboken, NJ, USA, 2012. [Google Scholar]
  14. Kyncl, M.; Cihalova, S.; Jurokova, M.; Langarova, S. Unieszkodliwianie i zagospodarowanie osadów z uzdatniania wody. Miner. Eng. Soc. 2012, 13, 11–20. [Google Scholar]
  15. IWEC. Final Report 2011. Available online: http://www,iwec-water-reuse,eu/downloads,htm (accessed on 2 February 2023).
  16. Zimoch, I. Celowość zawracania popłuczyn z filtrów pospiesznych w układach oczyszczania wody powierzchniowej. Ochr. Sr. 2013, 35, 4. (In Polish) [Google Scholar]
  17. Hanan, A.; Rehab, M.; El-Hefny, M.; Mohamed, A. Reuse of Spent Filter Backwashwater. Int. J. Civ. Technol. (IJCIET) July–August 2016. Available online: http://www.iaeme.com/IJCIET/index.asp (accessed on 2 February 2023).
  18. Suman, S.; Singh, N.P.; Sulekh, C. Effect of filter backwash water when blends with raw water on total organic carbon and dissolve organic carbon removal. Res. J. Chem. Sci. 2012, 2, 38–42. [Google Scholar]
  19. Gibert, O.; Lefèvre, B.; Teuler, A.; Bernat, X.; Tobella, J. Distribution of dissolved organic matter fractions along several stages of a drinking water treatment plant. J. Water Process. Eng. 2015, 6, 64–71. [Google Scholar] [CrossRef]
  20. Huang, X.; Wan, Y.; Shi, B.; Shi, J. Effects of powdered activated carbon on the coagulation-flocculation process in humic acid and humic acid-kaolin water treatment. Chemosphere 2019, 238, 124637. [Google Scholar] [CrossRef] [PubMed]
  21. Li, W.; Liang, X.; Duan, J.; Beecham, S.; Mulcahy, D. Influence of spent filter backwash water recycling on pesticide removal in a conventional drinking water treatment process. Environ. Sci. Water Res. Technol. 2018, 4, 1057–1067. [Google Scholar] [CrossRef]
  22. Wyczarska-Kokot, J. Badania jakości popłuczyn ze stacji filtrów w obiekcie basenowym w aspekcie możliwości odprowadzenia ich do wód i do ziemi—Studium przypadku. Ochr. Sr. 2017, 39, 46–50. [Google Scholar]
  23. Wang, D.; Zhou, J.; Lin, H.; Chen, J.; Qi, J.; Bai, Y.; Qu, J. Impacts of backwashing on micropollutant removal and associated microbial assembly processes in sand filters. Front. Environ. Sci. Eng. 2022, 17, 34. [Google Scholar] [CrossRef]
  24. Al-Qadiri, H.M.; Smith, S.; Sielaff, A.C.; Govindan, B.N.; Ziyaina, M.; Al-Alami, N.; Rasco, B. Bactericidal activity of neutral electrolyzed water against Bacillus cereus and Clostridium perfringens in cell suspensions and artificially inoculated onto the surface of selected fresh produce and polypropylene cutting boards. Food Control 2018, 96, 212–218. [Google Scholar] [CrossRef]
  25. Boysen, B.; Cristóbal, J.; Hilbig, J.; Güldemund, A.; Schebek, L.; Rudolph, K.-U. Economic and environmental assessment of water reuse in industrial parks: Case study based on a Model Industrial Park. J. Water Reuse Desalination 2020, 10, 475–489. [Google Scholar] [CrossRef]
  26. Jibhakate, M.L.; Bhorkar, M.P.; Bhole, A.G.; Baitule, P.K. Reuse & Recirculation of Filter Backwash Water of Water Treatment Water. Int. J. Eng. Res. Appl. 2017, 7, 60–63. [Google Scholar]
  27. Wolska, M.; Sambor, A.; Pawłowska, M. The effect of the water pre-treatment method on the adsorption process in a surface water treatment system. Desalination Water Treat. 2020, 199, 234–240. [Google Scholar] [CrossRef]
  28. Animireddy, S.; Sharma, M.P. Automation of common effluent treatment plant. Int. J. Adv. Technol. Eng. Sci. 2015, 3, 2. [Google Scholar]
Figure 1. (a) Surface water treatment plant (SWTP) technology and location sampling points. (b) Infiltration water treatment plant (IWTP) technology and location sampling points.
Water 15 02452 g001
Figure 2. Variable quantity of backwashing from sand and GAC filters (a) SWTP (b) IWTP.
Water 15 02452 g002
Figure 3. Dependence between TOC concentration in raw water and backwash in surface WTP.
Water 15 02452 g003
Figure 4. Correlation between microorganisms’ total count in raw water and backwash.
Water 15 02452 g004
Figure 5. Variability of psychrophilic and mesophilic microorganisms’ count in GAC backwash.
Water 15 02452 g005
Figure 6. Organic compounds molecular weight distribution in raw water and backwash from IWTP—example chromatogram.
Water 15 02452 g006
Figure 7. Variable number of microorganisms in sand and GAC backwash.
Water 15 02452 g007
Figure 8. Relationship between turbidity and iron content in the backwash from IWTP.
Water 15 02452 g008
Figure 9. Correlation between turbidity and manganese content in sand backwash.
Water 15 02452 g009
Table 1. Backwashing operation parameters.
a. Backwashing operation parameters in SWTP.
ParametersUnitSand FilterGAC Filter
Frequency of backwashing 24–96 h7–21 d
Air backwashing timemin10–201–3
Intensity of air backwashingm3/m2h52.560
Time of air backwashingmin10–2010–20
Intensity of water backwashingm3/m2h29.836
Time of first filtrate removalmin1010
b. Backwashing operation parameters in IWTP.
ParametersUnitSand FilterGAC Filter
Frequency of backwashing 5 d7–21 d
Air backwashing timemin10–201–3
Intensity of air backwashingm3/m2h721.2
Time of air backwashingmin10–2010–20
Intensity of water backwashingm3/m2h4535
Time of first filtrate removalmin1010
Table 2. Ranges of quality parameters in backwashes and raw waters.
ParameterUnitSurface Water Treatment PlantInfiltration Water Treatment Plant
Raw WaterSand BackwashGAC BackwashRaw WaterSand BackwashGAC Backwash
minmaxminmaxminmaxminmaxminmaxminmax
pH-7.58.17.48.26.97.96.87.07.17.86.87.5
ConductivityµS/cm340688351706356691513689517658509670
ColourgPt/m37.019.06.011.02.09.06.012.06.011.02.05.0
TurbidityNTU2.614.07.892.06.384.07.418.0347.02328.012.051.0
TOCgC/m33.077.793.778.933.116.753.065.593.226.243.166.22
UV254m-16.4315.005.508.012.307.056.469.256.5410.83.615.33
FemgFe/m315636691185382416808299244,680142,1007654353
MnmgMn/m31923845144247213333545512405046574
NH4+gNH4+/m30.050.280.050.150.050.150.370.520.150.150.050.19
Al.mgAl/m30.000.000.100.540.050.100.120.120.000.000.000.00
TNM 22 °Ccfu/cm3120066,0001900300,00063001,400,000109059055009500220,000
TNM 36 °Ccfu/cm395330027022,0005933,00003962640014068,000
Colicfu/100 cm3243000022000601
E. colicfu/100 cm388040001000000
Enterococcicfu/100 cm30510230020301802
Clostridium perfringenscfu/100 cm31013008700200005401
Disclaimer/Publisher’s Note: The statements, opinions and data contained in all publications are solely those of the individual author(s) and contributor(s) and not of MDPI and/or the editor(s). MDPI and/or the editor(s) disclaim responsibility for any injury to people or property resulting from any ideas, methods, instructions or products referred to in the content.

