Article

Analysis of the Asymmetric Characteristic of Extreme Rainfall Erosivity in 8 Provinces of Southern China during 1961–2020

1
School of Karst Science, Guizhou Normal University, Guiyang 550001, China
2
State Engineering Technology Institute for Karst Desertification Control, Guiyang 550001, China
*
Author to whom correspondence should be addressed.
Water 2023, 15(13), 2408; https://doi.org/10.3390/w15132408
Submission received: 15 May 2023 / Revised: 24 June 2023 / Accepted: 27 June 2023 / Published: 29 June 2023
(This article belongs to the Special Issue Rainfall and Water Flow-Induced Soil Erosion-Volume 2.0)

Abstract

:
The roles of rainfall with various intensities in hydraulic erosion processes are obviously different. In-depth knowledge about the spatiotemporal variation in extreme rainfall erosivity is critical for soil erosion risk assessment and formulation of response measures. In the period of 1961–2020, more than 390,000 erosive rainfall data from 212 meteorological stations were collected to explore the erosion characteristics of different intensities of rainfall erosivity across southern China. The asymmetric characteristic of extreme rainfall erosion was analyzed and expressed by an asymmetric change index (ACI) defined in this study. Correlation analysis was applied to study the impact of global extreme climate events on the ACI. The results showed that different patterns of precipitation had evident asymmetric characteristics in rainfall erosivity, and fewer high-intensity precipitation events contributed to much higher total rainfall erosivity, particularly for rainstorms (≥100 mm). The ACI of the rainfall erosivity exhibited evident spatial heterogeneity; insignificant increasing trends were found in the ACIs for heavy rainfall, torrential, and rainstorm erosivities over the past 60 years. The change rate of ACI varied greatly on both monthly and interdecadal scales, and the ACI of rainstorms showed the maximum linear increasing trend on the long-time scale. There were significantly high correlations between the ACI and erosive rainfall days and the ACI and erosive rainfall (p < 0.01), and the correlation coefficients were relatively higher from May to October, where the precipitation was concentrated. Additionally, the El Niño-Southern Oscillation and tropical cyclones clearly influenced the spatiotemporal distribution of the ACI and rainfall erosivity but were limited to specific periods and regions. These results could provide a reference for extreme soil erosion event monitoring and control in southern China.

1. Introduction

Soil erosion is an important factor causing land degradation in many regions of the world [1,2], it is not only an ecological disaster, but also causes a series of economic problems. According to the differences in exogenous forces, soil erosion can be divided into various types, such as water erosion, wind erosion, and gravity erosion. The uppermost layer of soil is considered to be the most fertile layer; soil loss in the uppermost layer induced by water is usually the most extensive [3]. The general indicator applied to express the potential capacity of water erosion is rainfall erosivity, which is mainly affected by raindrop kinetic energy, rainfall intensity, duration time, and other factors [4].
Rainfall erosivity is well known as the key input parameter of the Universal Soil Loss Equation (USLE) and its revised version RUSLE [5,6], which is a dynamic index used to evaluate the soil separation and migration generated by rainfall [7]. In regard to the calculation approaches of rainfall erosivity, Brychta et al. (2022) [8] divided the computing method into two categories: high-resolution and low-resolution approaches. EI30 is a typical high-resolution algorithm for rainfall erosivity, but it cannot be widely used due to the minute-level precipitation data needed. According to previous studies, if the basic situation of rainfall erosivity in a region is well representative, at least 10–22 years of records are needed due to the cyclical patterns in rainfall data [5,6,9,10]. However, only a few areas can satisfy the requirements of high-resolution data at such a long time scale.
Consequently, alternative calculation approaches with low-resolution rainfall records have been successively developed, i.e., annual, monthly, and daily rainfall erosivity calculation models, as summarized in the reviews by Yin et al. (2017) [11] and Brychta et al. (2022). [8] There are evident differences in the regional applicability of each model owing to the difference of the algorithm and input parameters, whether in China or other parts of the world. In China, Xie et al. (2016) [12] applied three different models to validate the calculation accuracy of daily rainfall erosivity and found that the computed erosivity from daily rainfall data were generally sufficient for estimating yearly and monthly time scales. This result was supported by other studies, which proved that a calibrated rainfall erosivity model performs well in analyzing the variation changes in seasonal and interannual rainfall erosivity [13]. Moreover, to verify the best-fit model of rainfall erosivity in Southwest China, Zhu et al. (2021) [14] compared five typical daily and monthly models, the results showed that the mean error of the monthly rainfall erosivity models was generally larger than that of the daily models. Similar work was conducted in Yunnan Province located in Southwest China, and the maximum difference of the average rainfall erosivity calculated by five different models was approximately four times [15].
With the exception of erosion models, the intensity of rainfall is another principal factor leading to the diversity of rainfall erosivity worldwide. According to the existing literature, the current research on rainfall erosivity mainly focuses on the temporal and spatial characteristics and their changing trends and also involves partial attribution analysis [8,16,17,18,19,20,21,22]. The impact of rainfall intensity on erosivity is very important and varies significantly, but in-depth knowledge of the asymmetry effect is still insufficient. A few studies have conducted preliminary explorations, for example, some researchers have analyzed the relationship between rainfall intensity and rainfall erosivity and found that high annual precipitation did not equate to absolutely great erosivity; the lower number of heavy rainfall events could play a major role in the total rainfall erosivity [23,24]. Xu et al. (2019) [25] performed statistics on the contribution rate of different rainfall intensities to erosivity in the Huaihe River Basin of China, and the descending order was rainstorm, heavy rain, and moderate rain. Moreover, some scholars have studied the reverse relationship between rainstorms and monthly erosivity density [26]. In regard to regions with abundant precipitation and uneven distribution in a year, the harm of extreme rainfall erosion is generally larger and it is difficult to capture its development law. There is an urgent need to further study the heterogeneity phenomenon of extreme erosivity, particularly in complex mountainous regions with serious soil loss.
Southern China, including the southwest karst area, is an important ecological security barrier of China; but also a key area for national soil and water conservation. Although the soil loss in this region is mostly caused by water erosion, there are still some limitations in the content. The question of whether the impact of rainfall intensity on hydraulic erosion is uniform requires empirical research to answer. Therefore, the aims of this study are: (1) to analyze the asymmetric statistics of extreme rainfall erosivity; (2) to detect long-term trends of the asymmetric change index of rainfall erosivity at different time scales and rainfall patterns; and (3) to explore the relationship between the asymmetric change index and typical rainfall elements, El Niño-Southern Oscillation (ENSO), and tropical cyclones.

2. Materials and Methods

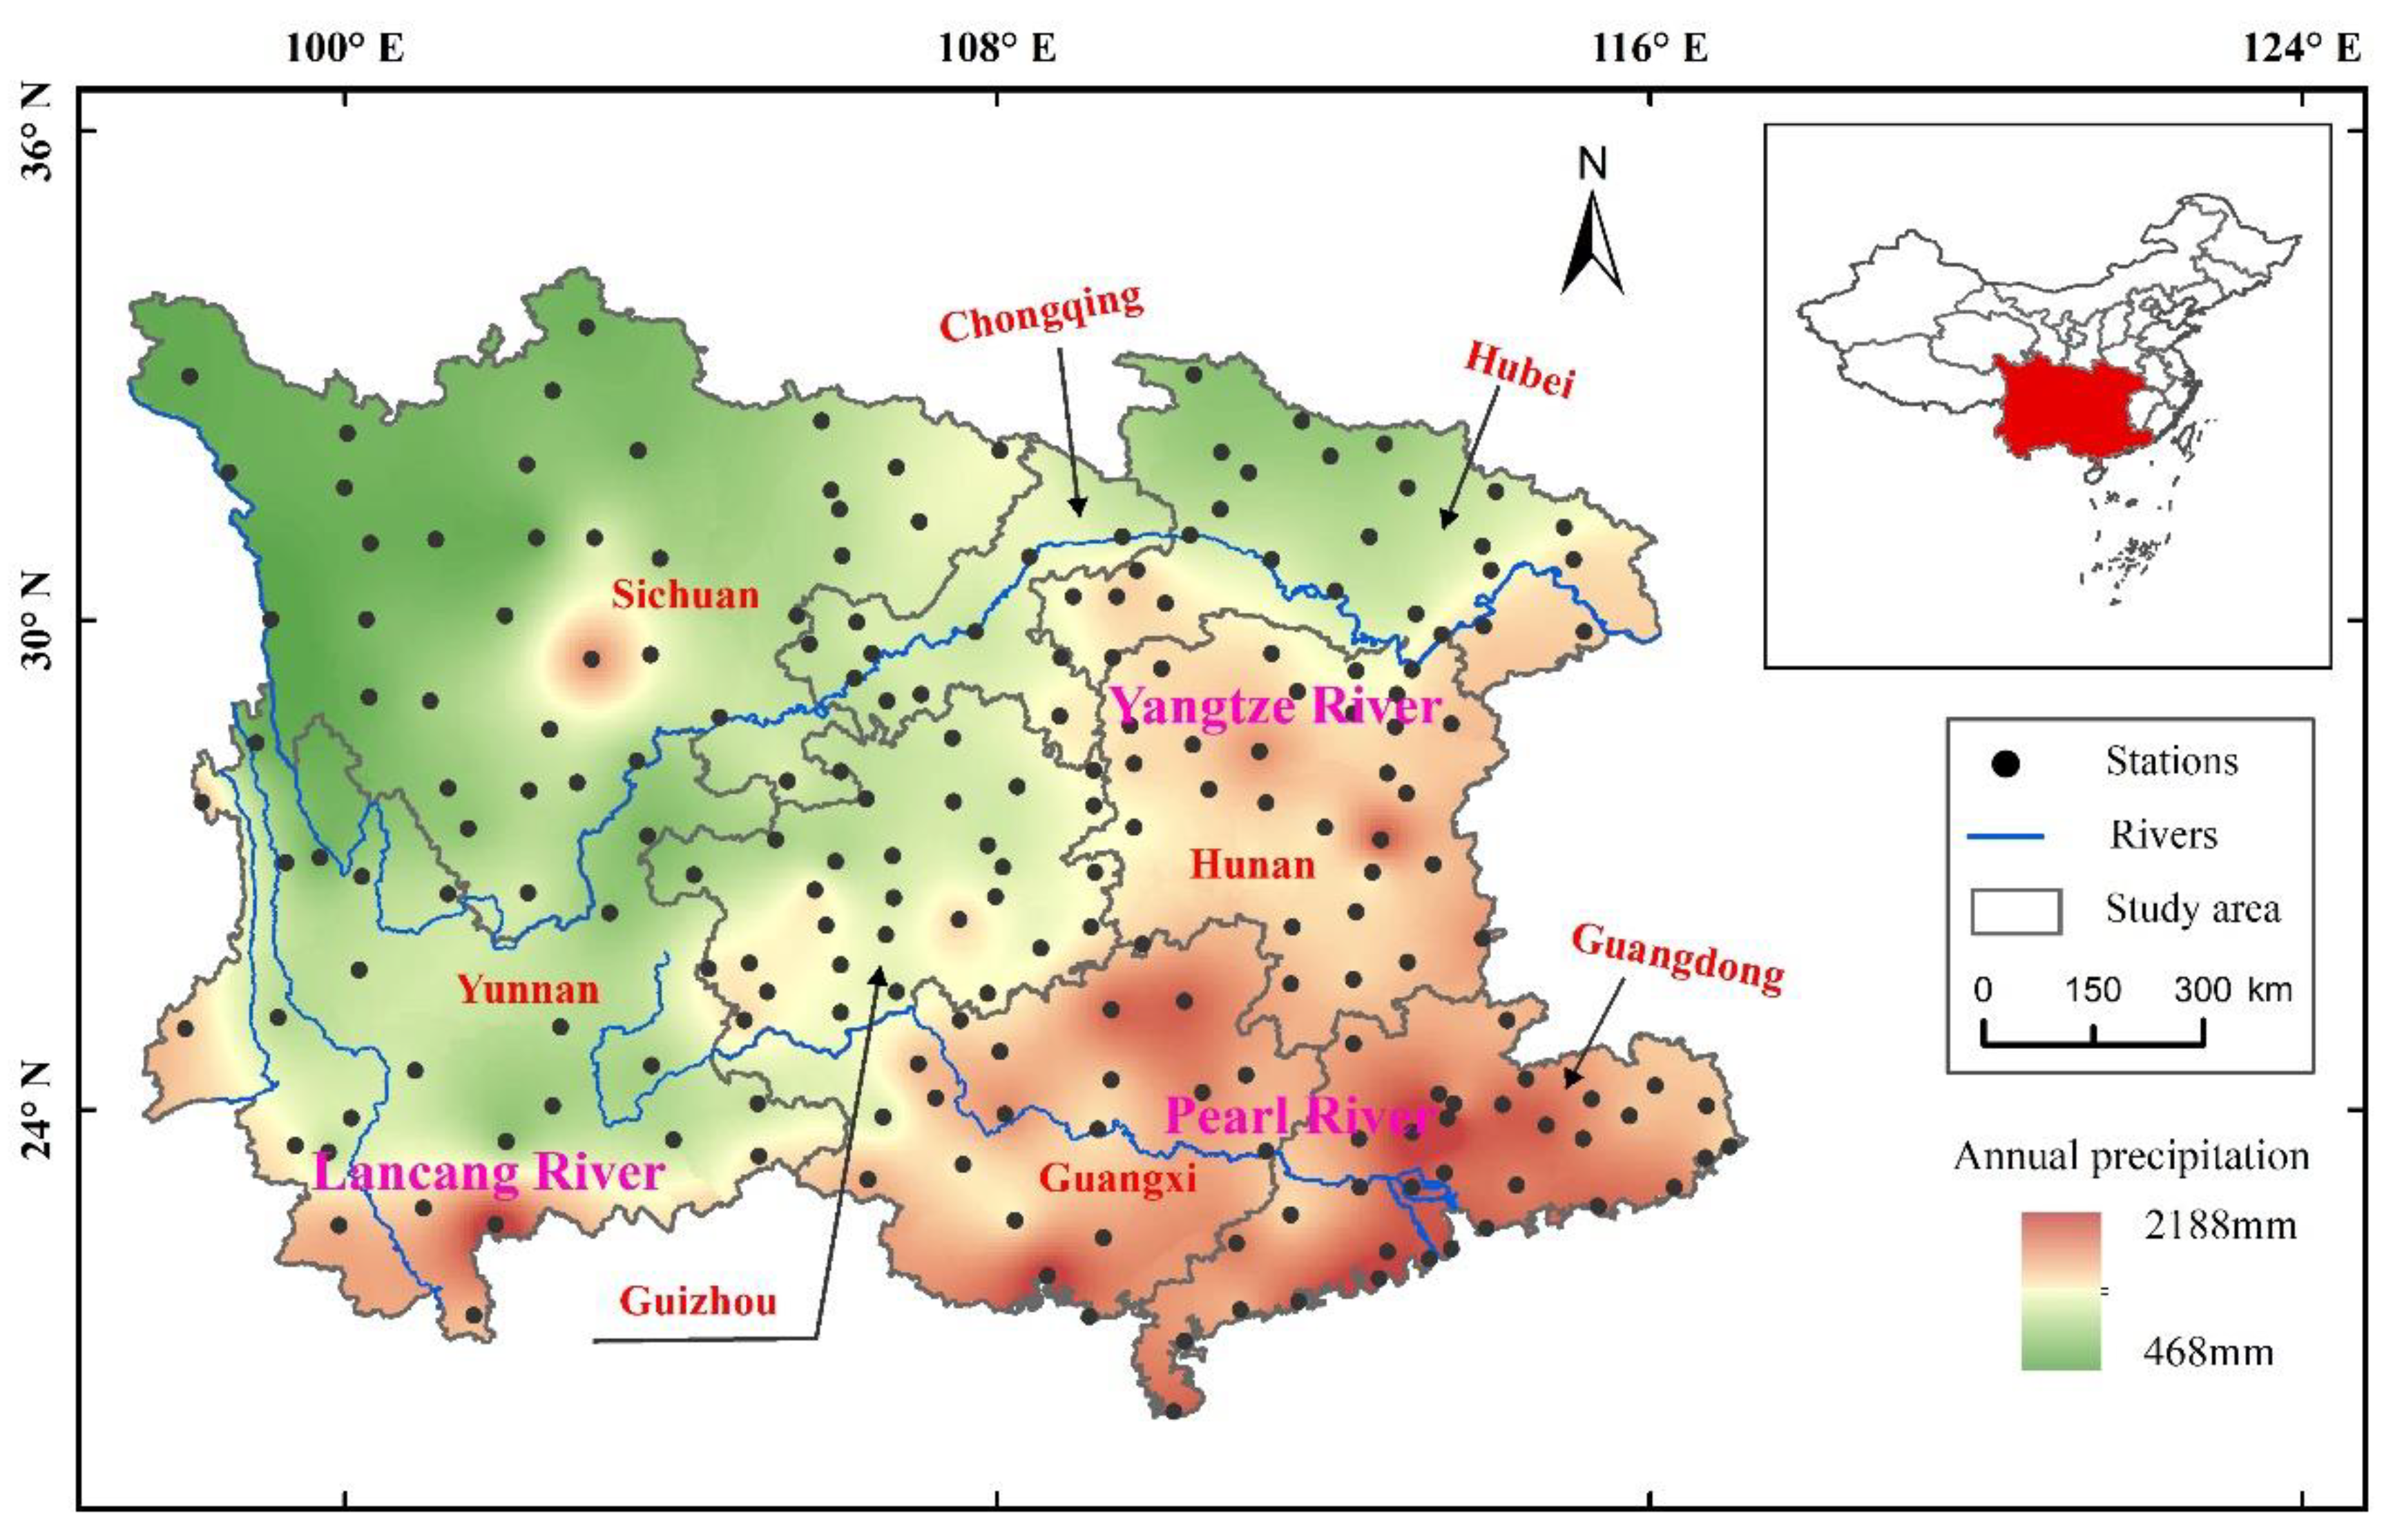
2.1. Study Area and Data Source

This study mainly focuses on the 8 provinces in southern China with widely distributed karst landforms, which cover the provinces of Yunnan (YN), Guizhou (GZ), Sichuan (SC), Chongqing (CQ), Hunan (HN), Hubei (HB), Guangdong (GD), and Guangxi (GX). It has a total area of 107.1 × 10⁴ km2 and is situated at 97°–117° E, 20°–35° N. The topography is high in the southwest and low in the northeast and crosses a plateau mountain and subtropical monsoon and tropical monsoon type areas, which are complex in terms of landform and climate conditions (Figure 1). The annual rainfall is unevenly distributed, and most rainfall events are concentrated in summer [14]. According to the China Water and Soil Conservation Bulletin in 2020, the water erosion of the study area is approximately 39.63 × 10⁴ km2 and accounts for 35.38% of the total water erosion area in China. In addition, 1/3 of Southern China consists of areas with medium and high risk of soil and water loss.
Daily precipitation data from 212 meteorological stations in southern China from 1961 to 2020, were derived from the Daily Data Set of Surface Climate Data in China (V3.0) of the National Meteorological Information Center of the China Meteorological Administration and Resource and Environment Science and Data Center of Chinese Academy of Science. When taking daily rainfall of 12 mm as the threshold, a total of 396,623 erosive rainfall data were extracted. On the basis of the instructions from the dataset production department, all data were subjected to a series of quality controls, such as climate limit value and extreme value inspection, consistency inspection, and manual verification and correction. The data quality was reliable, and the accuracy rate was close to 100%.
The Oceanic Niño Index (ONI) is NOAA’s primary indicator for monitoring El Niño and La Niña events. When the ONI is +0.5 or higher, El Niño conditions will occur, and when the ONI is −0.5 or lower, La Niña will occur. These two opposite phases of the climate pattern are collectively called the ENSO. The ONI index (5° N–5° S, 170° W–120° W) applied in this study from 1961 to 2020 was provided by the NOAA Climate Prediction Center.
Data on tropical cyclone daily precipitation and tropical cyclone precipitation impact index were obtained from the Tropical Cyclone Data Center of China Meteorological Administration. The details of tropical cyclone indexes are described by [27] and Lu et al. (2021) [28]. Since the time span of the data ranged from1949 to 2018, only tropical cyclone data from meteorological stations in the same location during 1961–2018 were selected and used.

2.2. Methodology

2.2.1. Rainfall Erosivity Model

In situations where the EI30 model cannot be used due to the lack of minute-level precipitation data, there are still many alternative models of rainfall erosivity calculation, but each model has different regional applicability as a result of the diverse climate conditions. As far as this study area is concerned, Zhu et al. (2021) [14] conducted a comparison of the rainfall erosivity model and erosion threshold and found that a revised daily rainfall erosivity model showed the optimal applicability. The model was based on the power law equation with sinusoidal relationship reflecting seasonal variations, the optimum erosive rainfall threshold is 12 mm. Therefore, this version of the model is selected to calculate rainfall erosivity for our study, and the formula is as follows [12,29]:
R d = 0.2686 [ 1 + 0.5412 cos ( π 6 j 7 π 6 ) ] P d 1.7265
where R d is the daily rainfall erosivity in month j (MJ·mm·ha−1·h−1), P d is the daily rainfall (mm), and j is the month from 1 to 12. Annual and monthly rainfall erosivity is summarized from daily rainfall erosivity.

2.2.2. Calculation of the Asymmetric Change Index in Rainfall Erosivity

In this paper, we call the performance that the contribution of rainfall with different intensities to total rainfall erosivity is inconsistent an asymmetric phenomenon, for example, a few rainstorm events produce a greater proportion of rainfall erosivity. To better express the asymmetric phenomenon of rainfall erosivity at different rainfall patterns, this study defines an asymmetric change index (ACI) of rainfall erosivity referring to the asymmetric warming index established by He et al. (2017) [30]. It is more convenient to observe the difference between the element value and the multi-year average level through the anomaly value. Specifically, the degree of asymmetry is quantitatively expressed by the absolute value of the difference between the rainfall erosivity anomaly and erosion rainfall anomaly in the same period. The larger difference value corresponds to a greater asymmetry. The formula is as follows:
ACI = | RE _ ano ER _ ano |
where ACI, a dimensionless parameter, is the asymmetric change index of rainfall erosivity for each erosive rainfall day. RE-ano is the anomaly value of rainfall erosivity (MJ·mm·ha−1·h−1), and ER-ano is the erosive rainfall anomaly (mm). The monthly and annual asymmetry change index of rainfall erosivity is calculated from the daily ACI of each meteorological station.
To compare the ACI of rainfall erosivity at different rainfall intensities, the rainfall was divided into four patterns according to the Chinese precipitation grade standard: moderate rainfall (12~25 mm), heavy rainfall (25~50 mm), torrential (50~100 mm) and rainstorm (≥100 mm). Since the threshold of erosive rainfall applied in this study is 12 mm, the initial value of moderate rainfall is slightly higher than the 10 mm national standard. Finally, the rainfall erosivity ACI of four patterns is summarized and used for subsequent analysis.

2.2.3. Trend and Correlation Analysis

The nonparametric Sen’s slope estimation method is a convenient and practical linear slope estimation method, that can intuitively detect the upward and downward trends of any data through slopes, and the estimator is insensitive to abnormal values [31,32]. Thus, it is commonly used for time series analysis of meteorology and hydrology [25,32,33]. The equation is as follows:
f ( t ) = Qt + B
where f(t) is the fitting value, Q is the magnitude of the trend, and B is a constant.
We used Pearson correlation analysis to explore the relationship between the asymmetric change index and typical rainfall elements, the ENSO index, and the tropical cyclone index. The correlation coefficient value is between −1 and 1, and the larger value corresponds to a stronger correlation [34]. This approximate correlation examination method is often used to analyze the factors affecting rainfall erosion [19,35]. The significance test in this paper is based on T-test.

3. Results

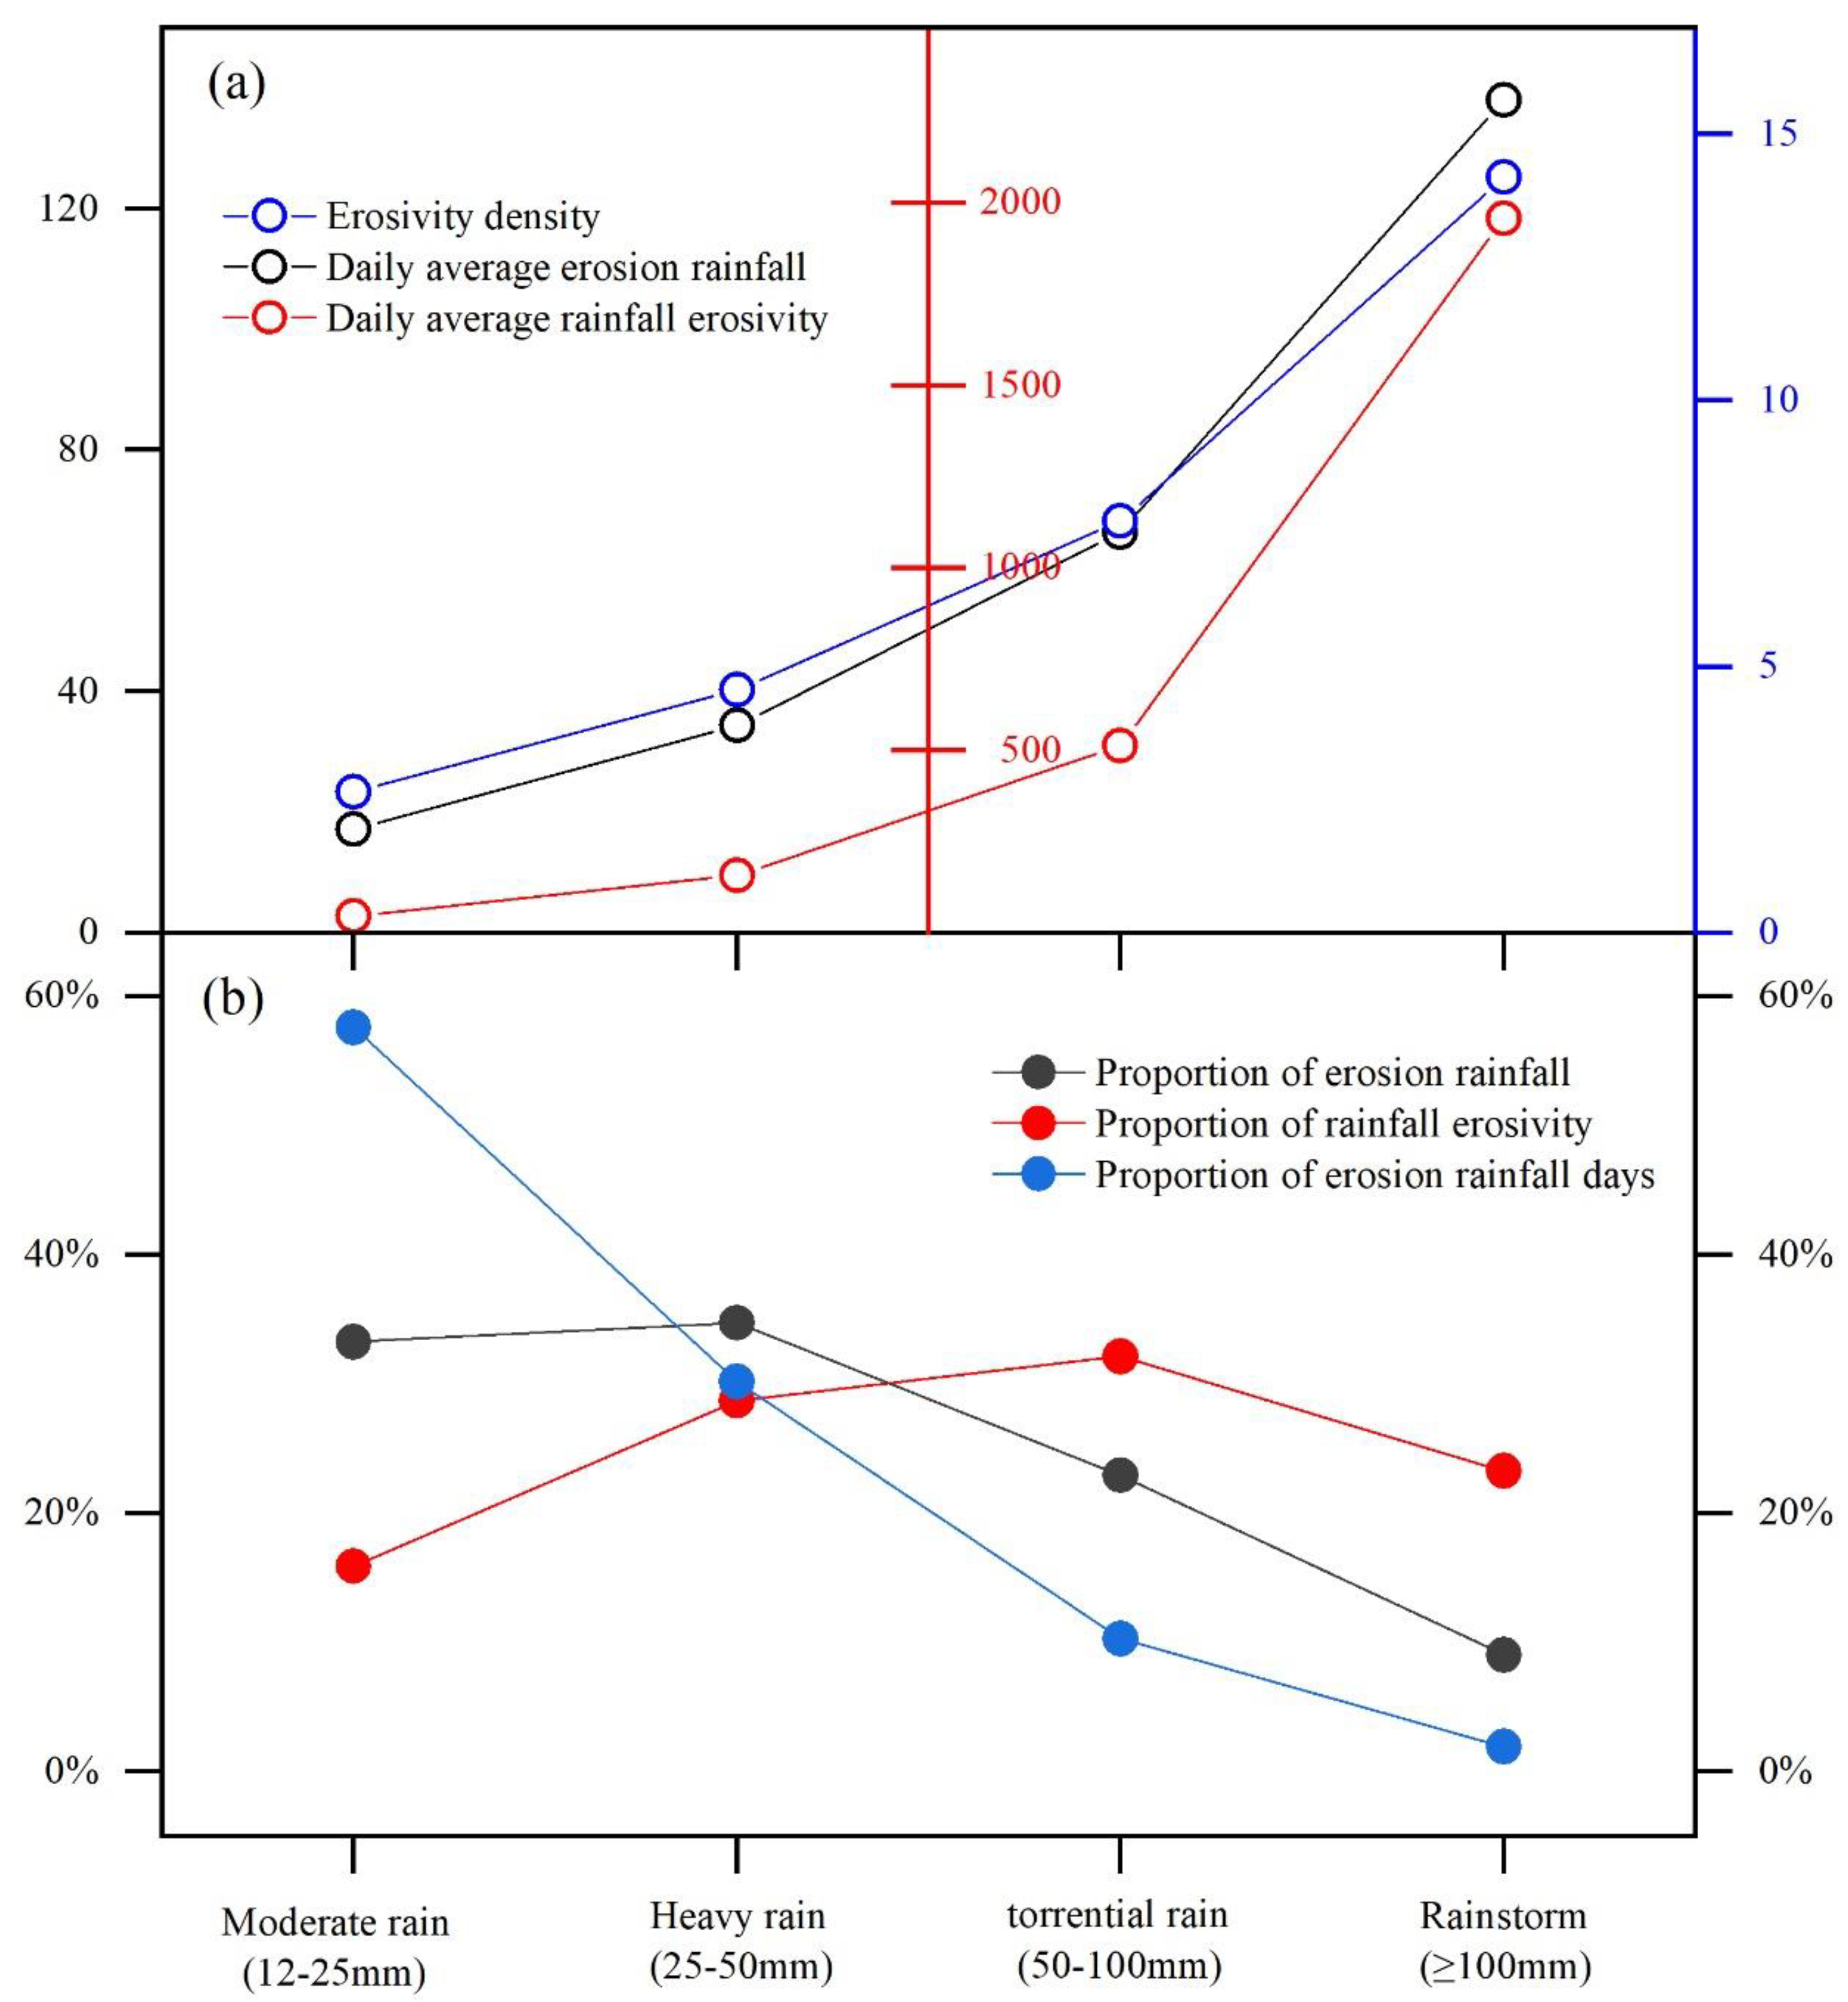
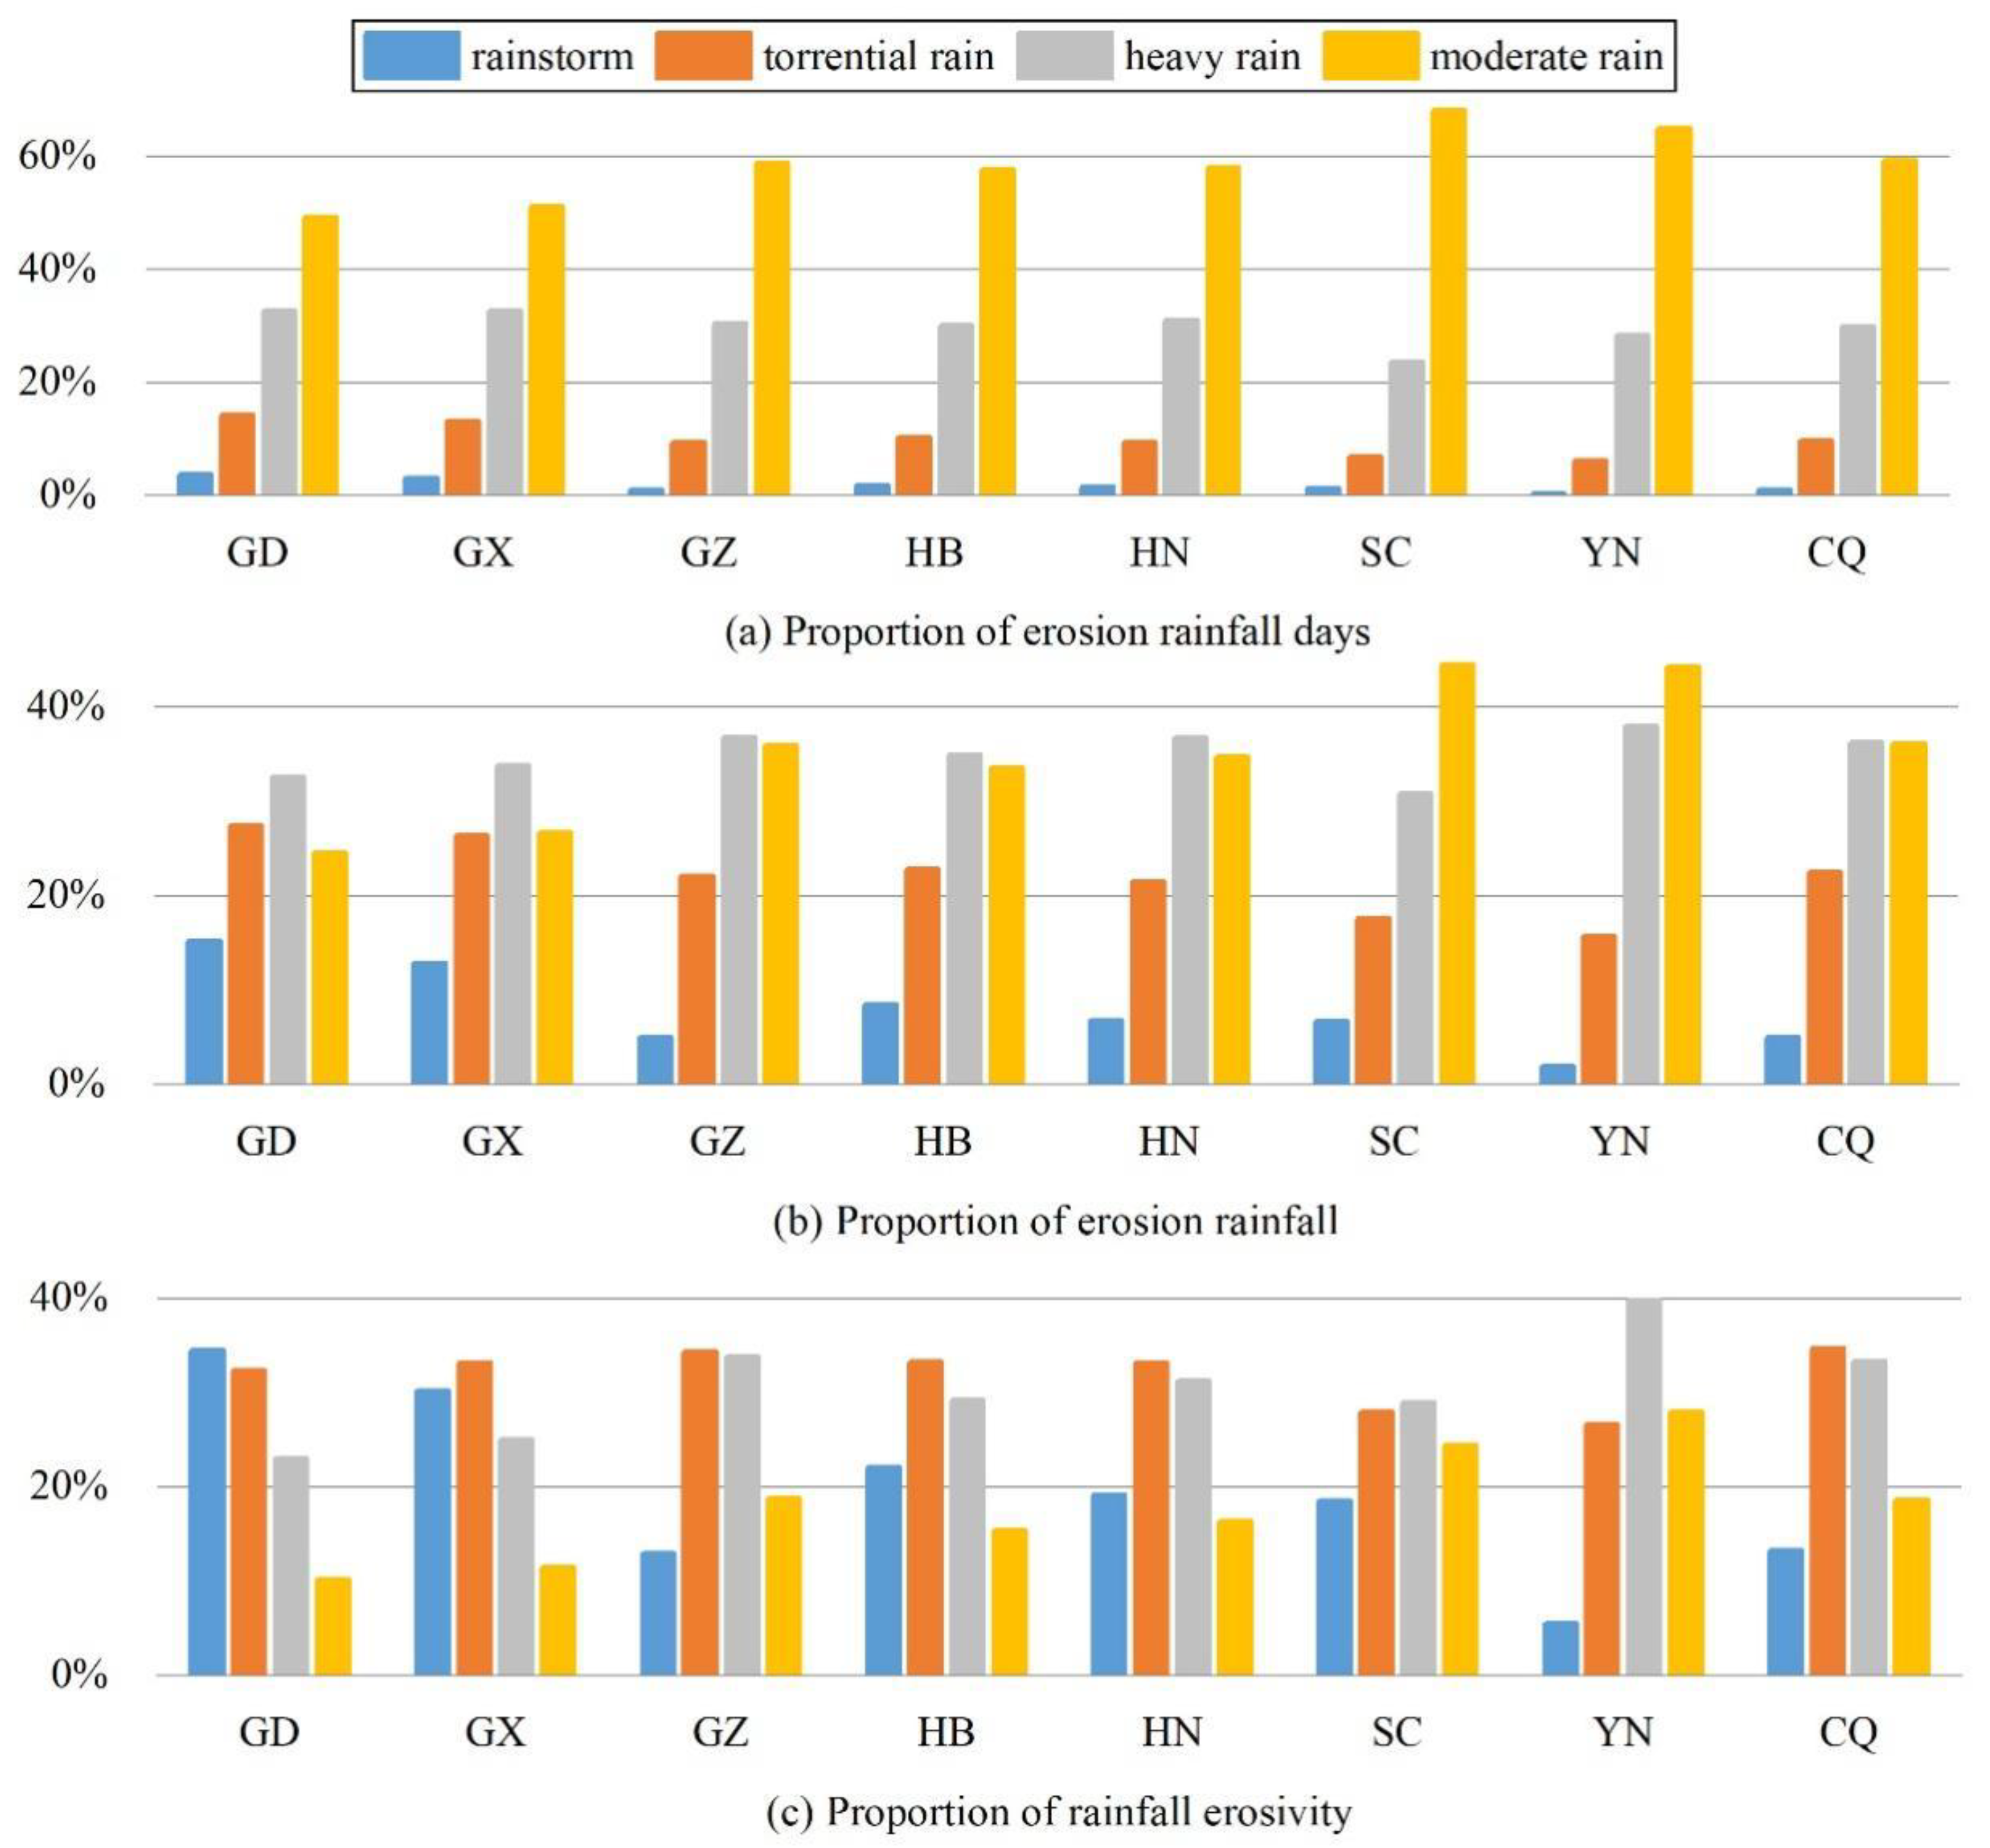
3.1. Asymmetric Statistics of Rainfall Erosivity

Figure 2 exhibited the general situation of rainfall erosivity under the different intensity rainfall in the study area from 1961 to 2020. A total of 396,623 erosion rainfall days were extracted for the 212 meteorological stations over the past 60 years, with an average daily erosion rainfall of 29.82 mm and an average daily rainfall erosivity of 164.54 MJ·mm·ha−1·h−1. For the type scale, the average daily erosion rainfall, daily rainfall erosivity, and erosivity density of the four types of rainfall intensities are 17.25–137.97 mm, 45.49–1957.54 MJ·mm·ha−1·h−1, and 2.64–14.19 MJ·ha−1·h−1, respectively. It can be seen from Figure 2a that when the daily rainfall is less than 50 mm, the rainfall and rainfall erosivity increase slowly and synchronously, when daily rainfall exceeded the threshold of 50 mm, reaching the level of torrential rain, the rising trend accelerated sharply, and the corresponding rainfall erosion capacity is also clearly enhanced. The results of statistical analysis indicated that the mean rainfall of rainstorm days is only 4.63 times the average daily rainfall, but the rainstorm erosivity is 11.90 times the mean rainfall erosivity, which shows a typical asymmetric characteristic.
According to Figure 2b, it can be found that the overall contribution rate of rainfall erosivity was ranked as follows: torrential rain > heavy rain > rainstorm > moderate rain. Torrential rain and rainstorms played an important role in triggering water erosion. Rainstorms accounted for only 2% of the erosive rainfall days but contributed to 9% of erosive rainfall and 23% of total rainfall erosivity. Moderate rain in the same period accounted for 58% of the total erosive rainfall days and 33% of the erosive rainfall, but the composition percentage of total rainfall erosivity was only 16%. In this regard, a notable phenomenon was found in Figure 2b: when the rainfall erosivity is higher than the heavy rain, the percentage of the three indicators has changed, that is, the proportion of rainfall erosivity exceeds the proportion of erosive rainfall and erosive rainfall days. The proportion heterogeneity of the three indicators was quite evident in the rainfall intensities over and under heavy rain.
In addition, a comparison of rainfall erosion among provinces was also performed (Figure 3). The general characteristics of the 8 provinces were basically analogous, with a small number of high-intensity precipitation events bringing greater erosion risk. Influenced by the regional precipitation features, the asymmetries of Guangdong and Guangxi were particularly prominent; the contribution ratio of torrential rain and rainstorm to rainfall erosivity exceeded 63%, whereas the corresponding proportions of rainy days were less than 18%. Among the eight provinces, Yunnan Province had fewer days of high-intensity rainfall, and the composition of total rainfall and rainfall erosivity mainly depended on heavy rain and moderate rain, with contribution proportions of 82.36% and 67.78% respectively; this was the opposite of Guangdong Province. In general, although water erosion was closely related to the number of rainy days, it was more controlled by a few high-intensity rainfall types, whether for the whole study area or among different provinces.

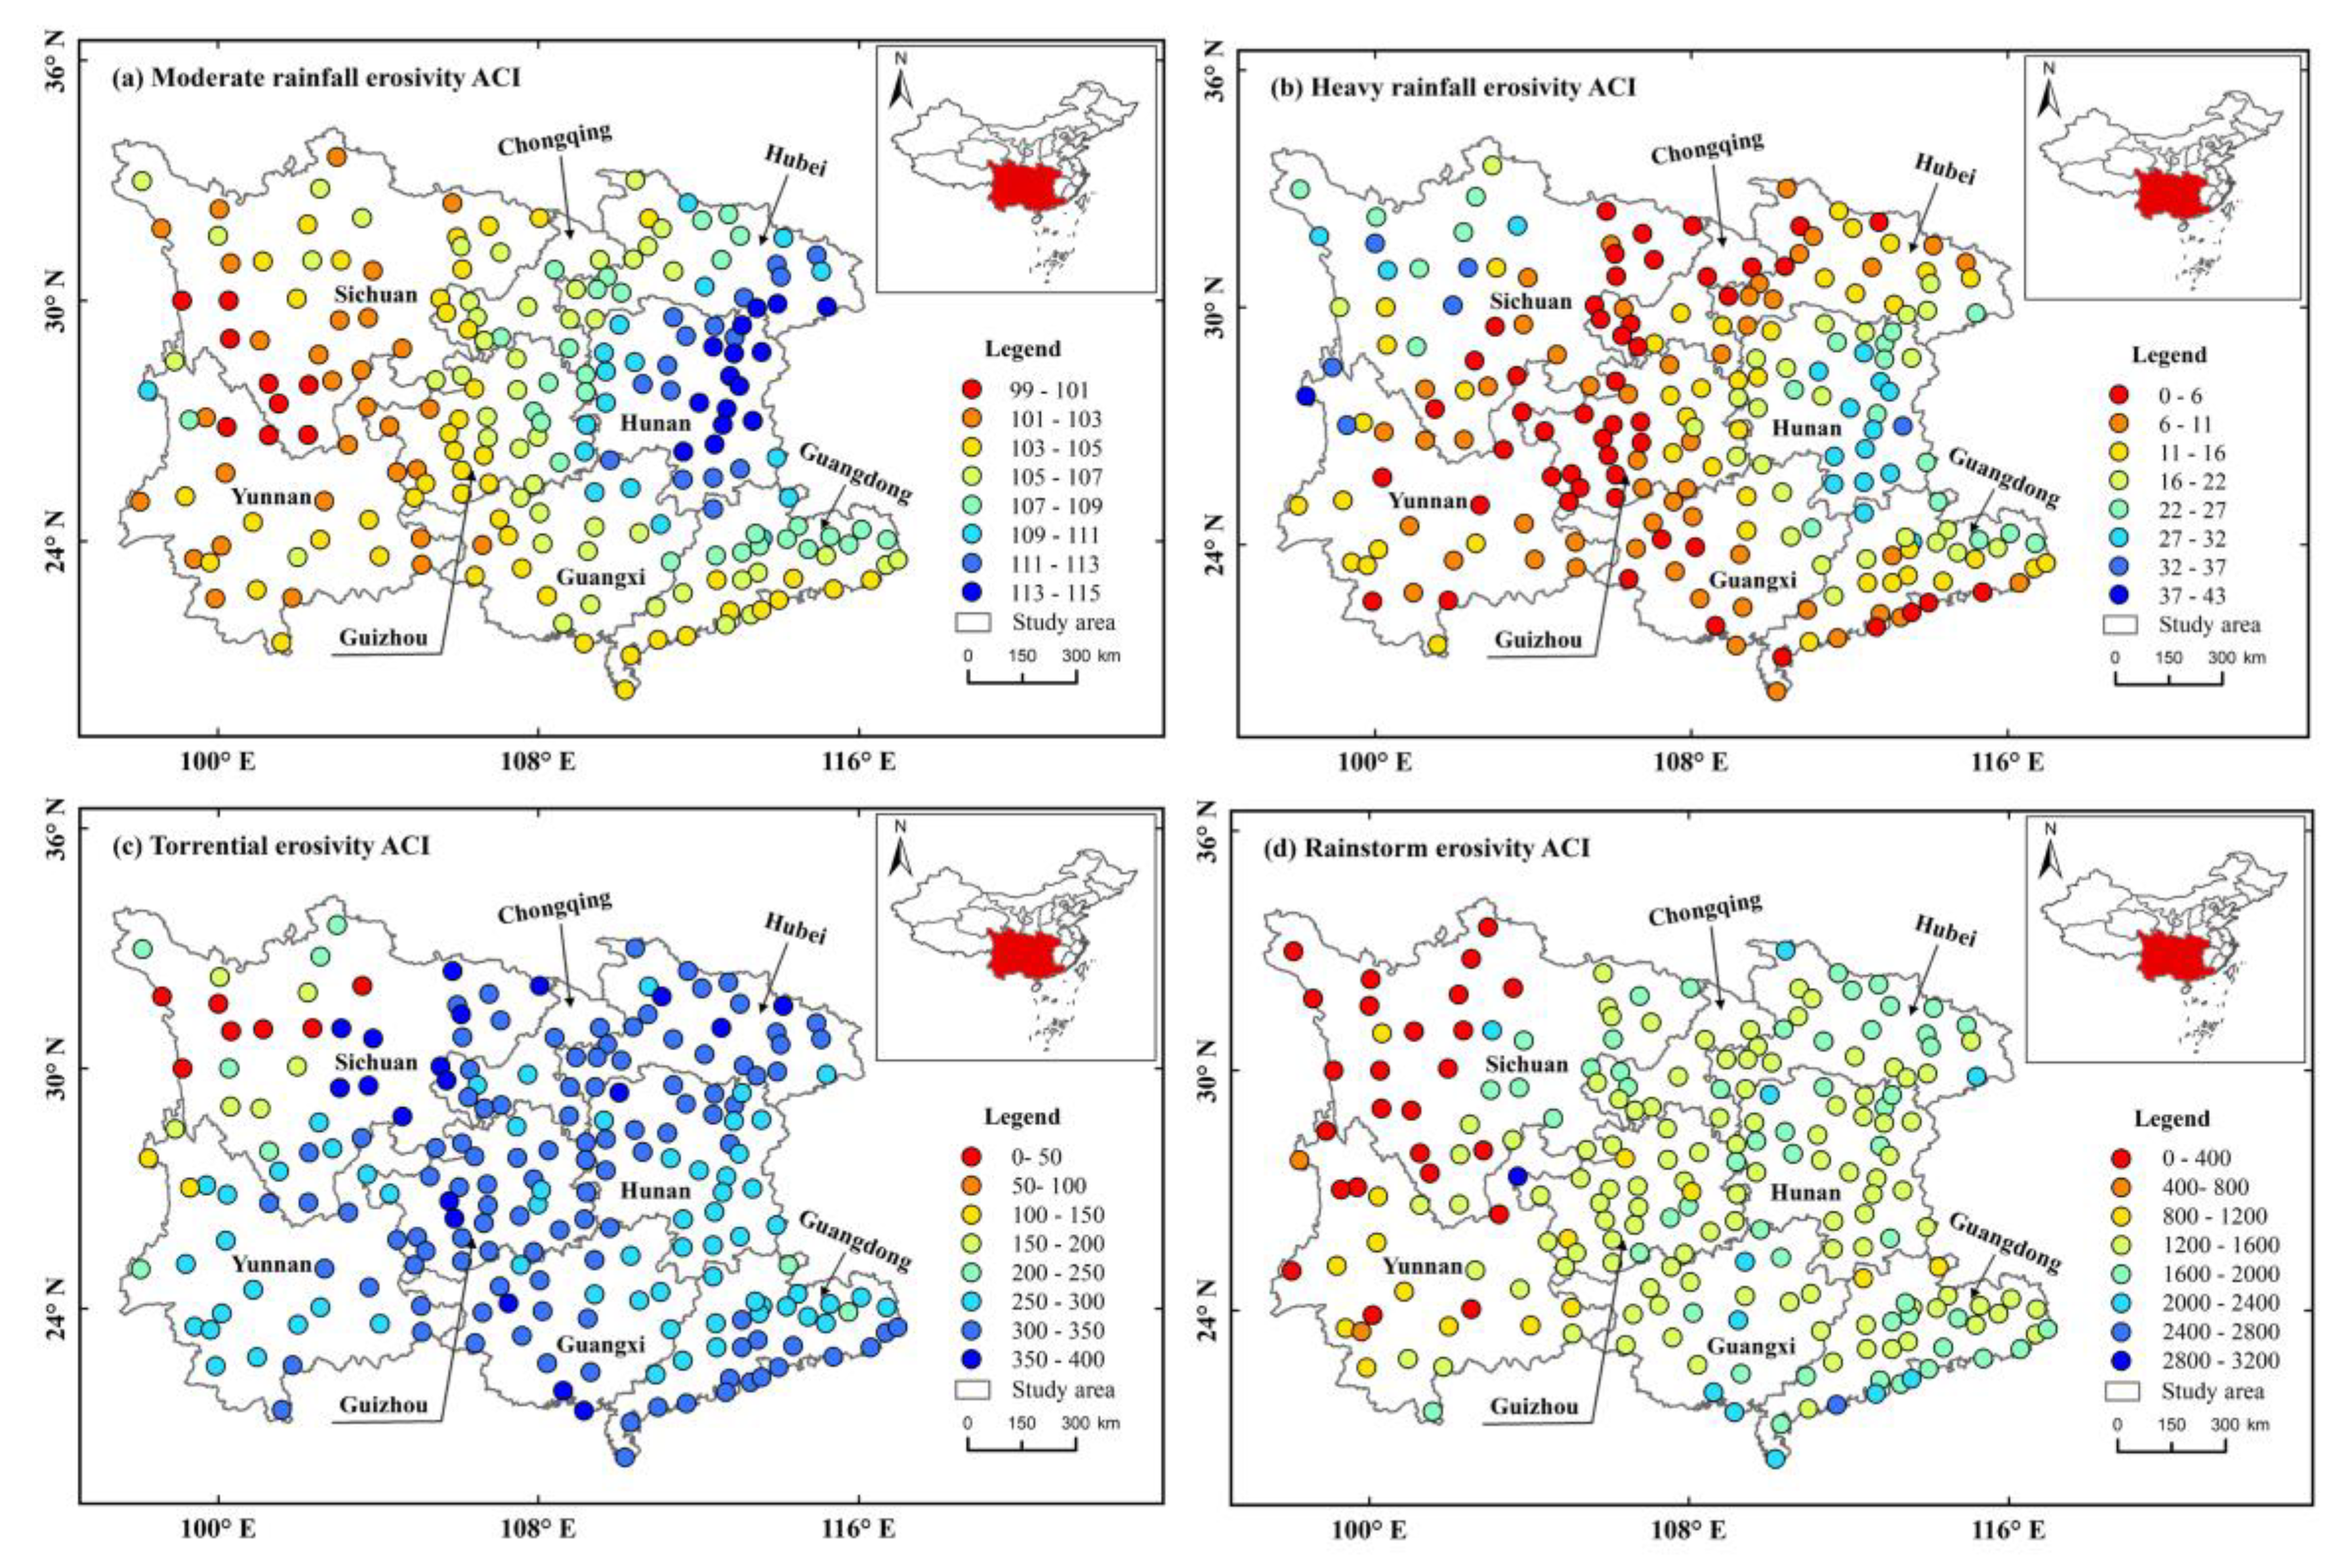
3.2. Spatial Characteristics of the Rainfall Erosivity Asymmetric Change Index

To further illustrate the asymmetric characteristics of rainfall erosivity, the spatial patterns of the asymmetric change index (ACI) are shown in Figure 4. The following information can be obtained: the ACI of rainfall erosivity exhibits a large difference in values, which ranges from 0.14 to 3186.65 with a mean value of 438.36. The average ACIs of moderate rain, heavy rain, torrential rain, and rainstorm are 106.17, 12.44, 294.71, and 1339.25, respectively, and a comparison between the maximum and the minimum values shows that the maximum value is 108 times the minimum value. Rainstorm shows the highest ACI, this reflects that the rainfall erosion in rainstorms has a stronger asymmetric effect. This phenomenon was also confirmed by [36], who determined that the inequality of rainfall erosion was mostly influenced by a small number of highly erosive events.
Through the ACI, the inequality features of rainfall erosivity can be intuitively captured. Comparing Figure 4a–d, the ACI of rainfall erosivity represents evident spatial heterogeneity, while no similar pattern of spatial distribution is observed according to the ACI of the four types. In terms of Figure 4a, the highest ACI values are mainly concentered in Hunan Province, and apart from Guangdong Province, the ACI gradually increases from west to east in the study area; this result is basically consistent with the precipitation characteristics of the study area. The spatial distribution of the heavy rain erosivity ACI is relatively complex and shows a pattern of low distribution in the middle area and high distribution on both sides; the opposite pattern appeared in the spatial distribution of the ACIs for the torrential and rainstorm erosivities, which are potentially affected by the intensity of precipitation at each meteorological station. Furthermore, the high ACI distributions of the torrential and rainstorm erosivity in the middle area occupy most of the study area, while the lowest ACI values are mainly distributed in the northwest area with less annual rainfall and extreme daily precipitation events.

3.3. Trend of the Rainfall Erosivity Asymmetric Change Index at Different Time Scales

3.3.1. Monthly Variation Trend of the Rainfall Erosivity ACI

The trend of monthly rainfall erosivity ACI in South China during the period of 1961—2020 is shown in Table 1. The linear change rate of the monthly rainfall erosivity ACI varies greatly, with the lowest value of −199.05 occurring in April and the highest value of 433.95 occurring in June. In general, the proportion of the increasing and decreasing trends of the rainfall erosivity ACI is approximately half and half, respectively, and only 1/6 of the total 48 trend coefficients reached a sufficient significance level (p < 0.05).
The trend coefficients of the moderate rainfall erosivity ACI ranged from −199.05/yr to 126.50/yr, and most months exhibited an insignificant decreasing trend. Nevertheless, the trends of the torrential and rainstorm erosivity ACIs in the corresponding period showed the opposite variation characteristics in a year, with 8 out of 12 months showing an increasing trend. Notably, the maximum change trends of the moderate and heavy rainfall erosivity ACIs mainly appeared from January to April during the dry season, while the maximum change trends of torrential and rainstorm erosivity ACIs were mainly found from May to October during the rainy season. To some extent, this was consistent with the rainfall characteristics under the subtropical monsoon climate of the study area, and strong rainfall events generally appeared in the rainy season. Additionally, local climate, location of land and sea, etc., may also be potential impact factors, which need to be further researched in the future.

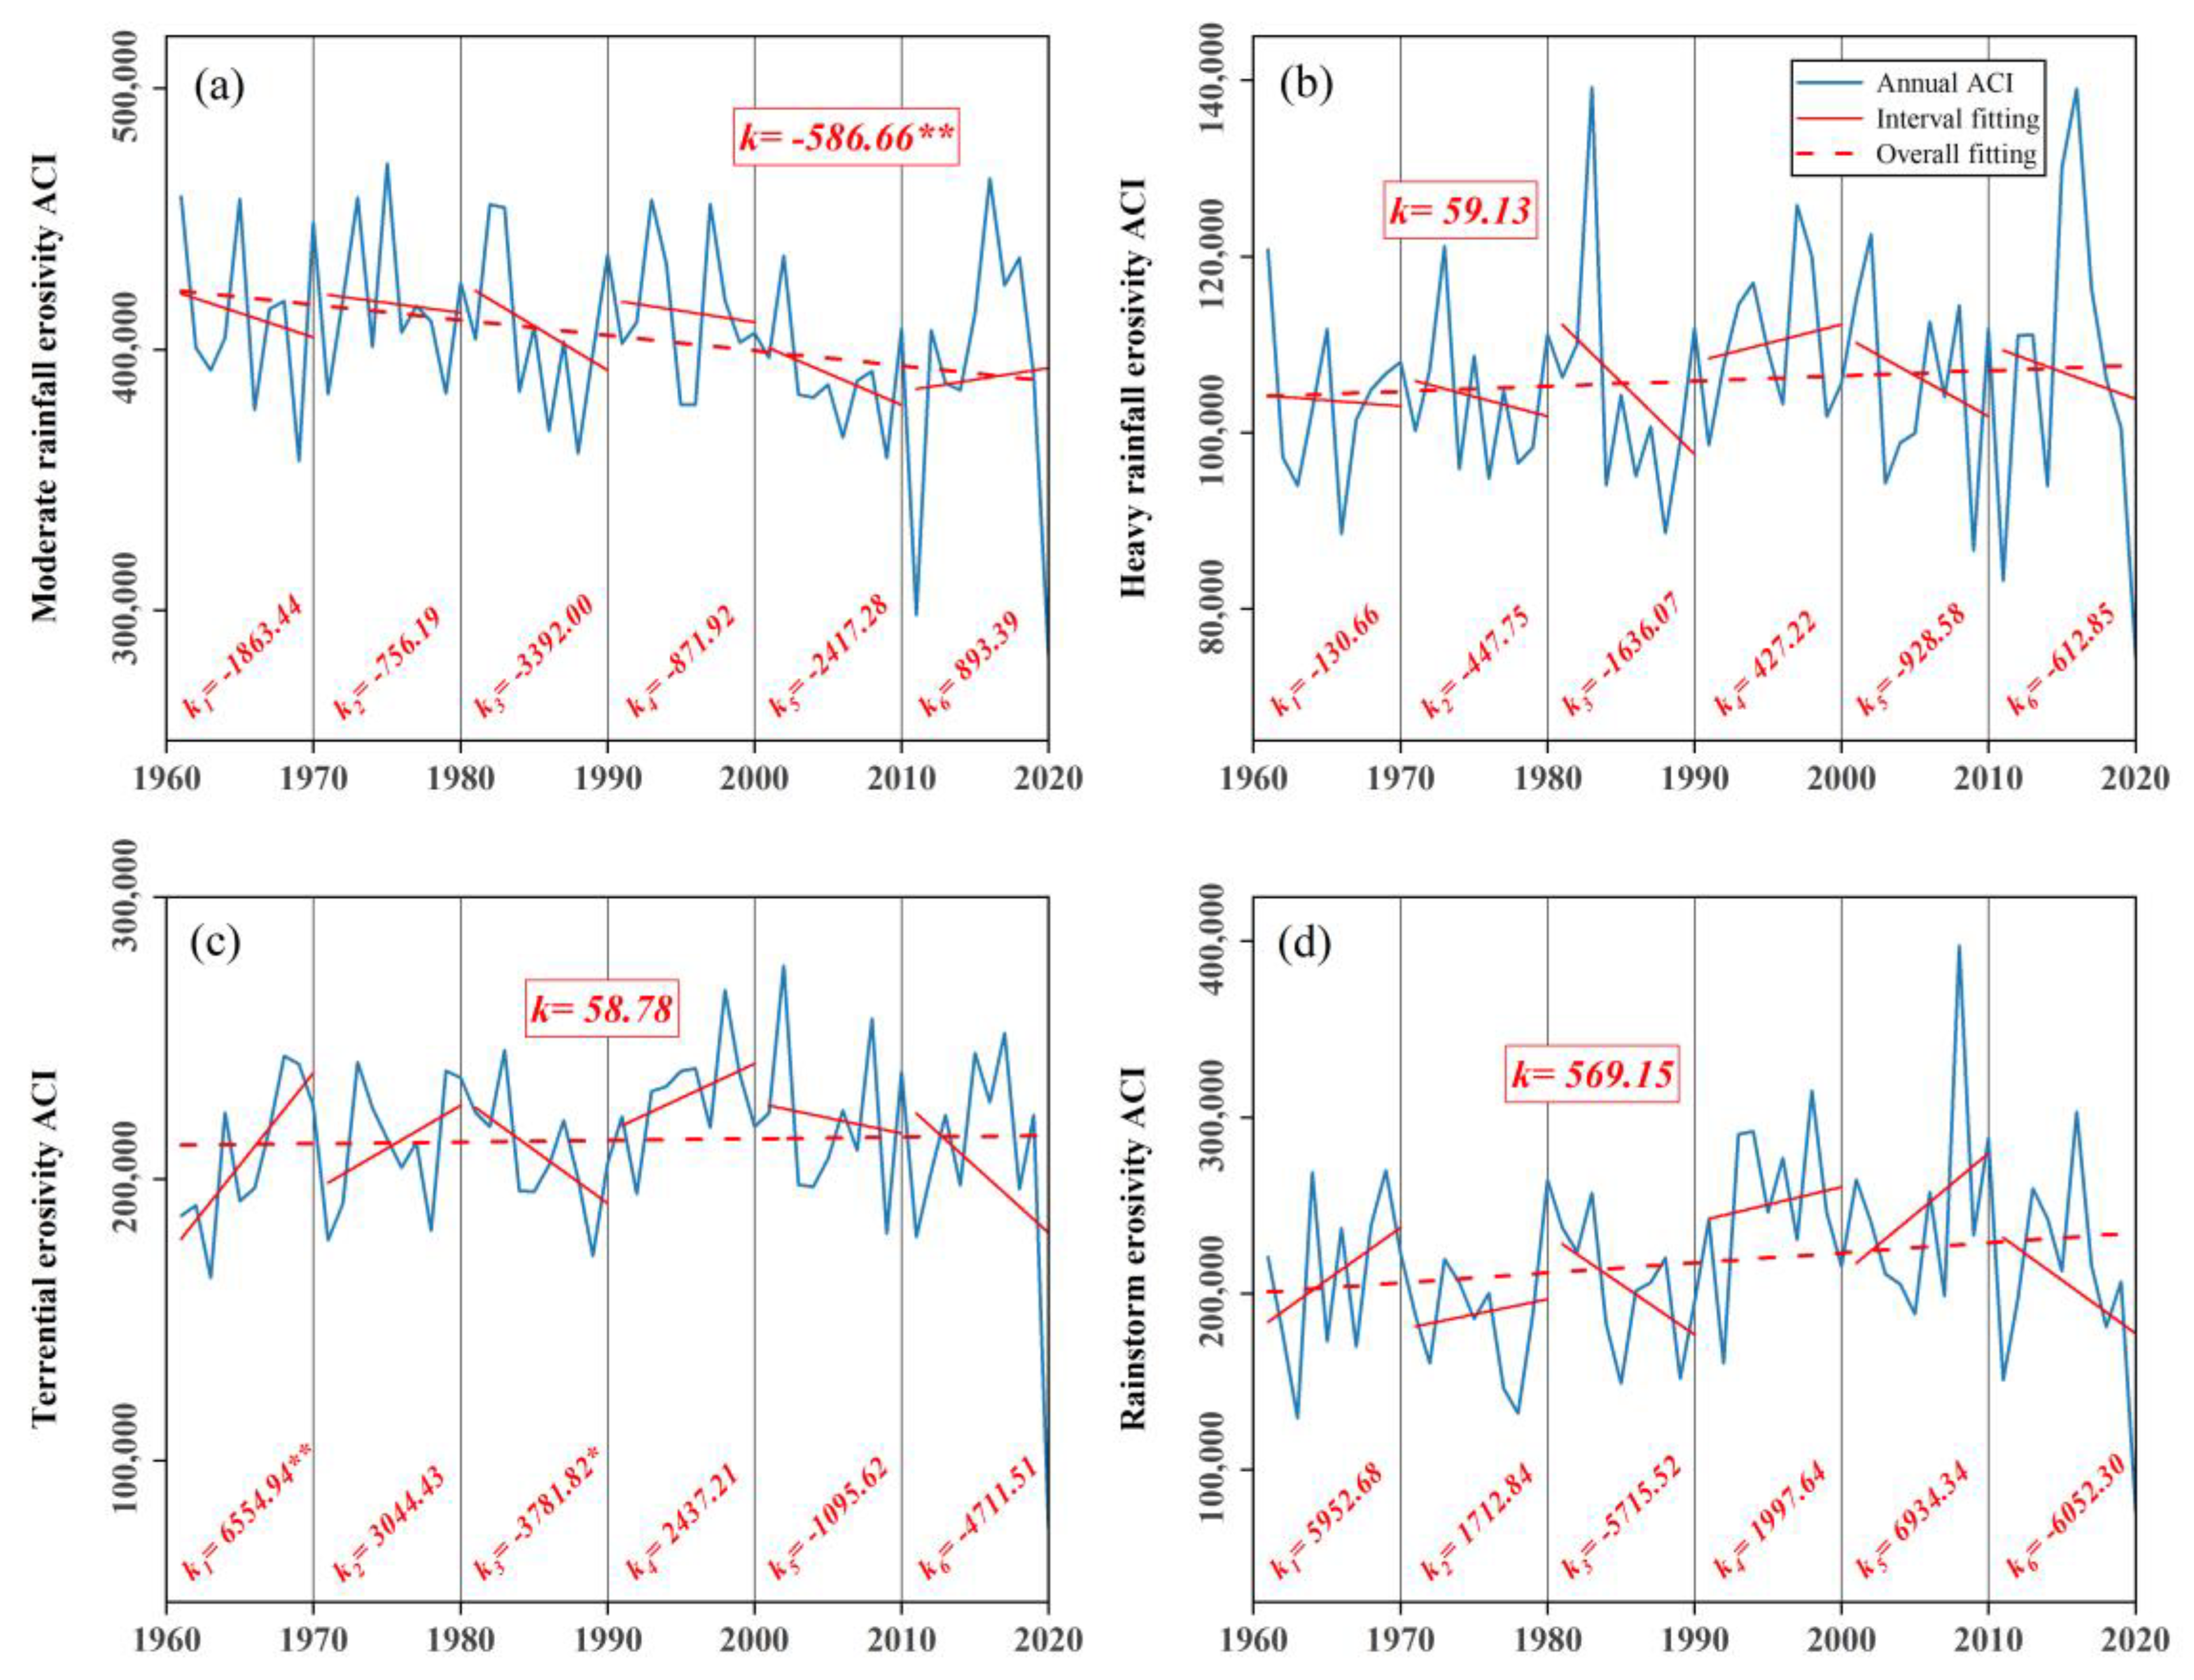
3.3.2. Annual Variation Trend of the Rainfall Erosivity ACI

Insignificant increasing trends were found in the heavy rainfall erosivity ACI, torrential erosivity ACI, and rainstorm erosivity ACI of the whole study area during the past 60 years (Figure 5). The moderate rainfall erosivity ACI showed a significant decreasing trend at a rate of −586.66/yr (p < 0.05). From the perspective of these trends, the ACIs of the torrential and rainstorm erosivity were generally consistent with the interannual change, while the remaining two were comparatively different. Compared to the linear change rate of the four types of ACI, the increase in the rainstorm erosivity ACI was obviously the largest, indicating that the risk of asymmetric erosion would continue to rise quickly over time.
Since the interdecadal scale would be conducive to exploring more detailed change characteristics, the trend of interdecadal rainfall erosivity ACI was also identified using the linear regression method (Figure 5). Regarding the interdecadal ACI, only the torrential erosivity showed a significant change trend in the 1960s (p < 0.05) and 1980s (p < 0.1), and the rest did not pass the significance test. Compared with the whole trend coefficients during 1961–2020, the interdecadal trend coefficients were generally higher, especially the rainstorm erosivity ACI. The moderate rainfall erosivity ACI not only had the largest downward trend of the whole period but also exhibited a continuous decrease for 5 interdecadal intervals from the 1960s to 2000s (Figure 5a). Although the overall trend of the heavy rainfall erosivity ACI was upward in the past 60 years, 5 of the 6 interdecadal periods exhibited an increasing trend (Figure 5b). There were interesting parallels between torrential erosivity and rainstorm erosivity; the ACI experienced a consistent trend from the 1960s to the 1990s, and then declined quickly after entering the 2010s (Figure 5c,d). Furthermore, in combination with the monthly trends for the rainstorm erosivity ACI occurring within southern China, it was clear that the asymmetric effect of rainstorm erosivity was most evident, with a greater peak erosion intensity and linear changer rate (Table 1, Figure 5d).

3.3.3. Trend Analysis of the ACIs in Provinces

Table 2 shows the long-term trend of the rainfall erosivity ACIs from 1961 to 2020 in the 8 provinces of the whole study area. A comparison of the results excluding the value of the change rate indicated that the trend directions of the four rainfall erosivity ACI values in GZ, SC, CQ, and YN provinces were identical, and all showed a decreasing trend except for the rainstorm erosivity ACI, which showed an increase. Notably, these four provinces are located in the high altitude area of Southwest China. Moreover, similar trends of rainfall erosivity ACI were also observed in GX and HN provinces. In terms of the moderate rainfall erosivity ACI, most provinces exhibited a decreasing trend, and the province of GZ reached the maximum rate at a value of −196.52/yr (p < 0.05). The rainstorm erosivity ACIs of all 8 provinces showed an increasing trend over the past 60 years, which was consistent with the linear change trend of the whole study area (Figure 5d). To summarize, the rainstorm erosivity ACI tended to increase, while the moderate rainfall erosivity ACI tend to normally decrease, these trends indicated that rainstorms played an important role in hydraulic erosion during the study period (Table 1 and Table 2, Figure 5).

3.4. Correlation Analysis of the ACI

3.4.1. Correlation Analysis between the ACI and Associate Elements

The correlation coefficients between the ACI and erosive rainfall days, erosive rainfall, and rainfall erosivity are shown in Table 3. All correlation coefficients are distributed between 0.15 and 0.96, with a large span. Although the intensity of rainfall is different, there are obvious impacts of erosive rainfall on the ACI, the four patterns of the ACIs all exhibited a significantly high correlation with erosional rainfall. The correlations between the torrential erosivity ACI, rainstorm erosivity ACI, and rainfall erosivity are particularly strong, with Pearson correlation coefficients of 0.93 and 0.87 (p < 0.01), respectively. The corresponding correlation coefficient between the moderate rainfall erosivity ACI and rainfall erosivity is relatively small, but more than 50% of the change in rainfall erosivity can also be explained by the ACI.
Based on the correlation coefficients, a lower correlation coefficient between the ACI and erosive rainfall days corresponded to a higher correlation between the ACI and rainfall erosivity. For example, the torrential erosivity ACI only showed a significantly low correlation to the erosive rainfall days with a correlation coefficient of 0.15 (p < 0.01) but explained 93% of the change in rainfall erosivity. Moreover, there were also significant correlations among the four ACI patterns, and the maximum correlation between the moderate rainfall erosivity ACI and heavy rainfall erosivity ACI was 0.74 (p < 0.01). These results confirmed that the ACI could better reflect the characteristics of rainfall erosivity to some extent.

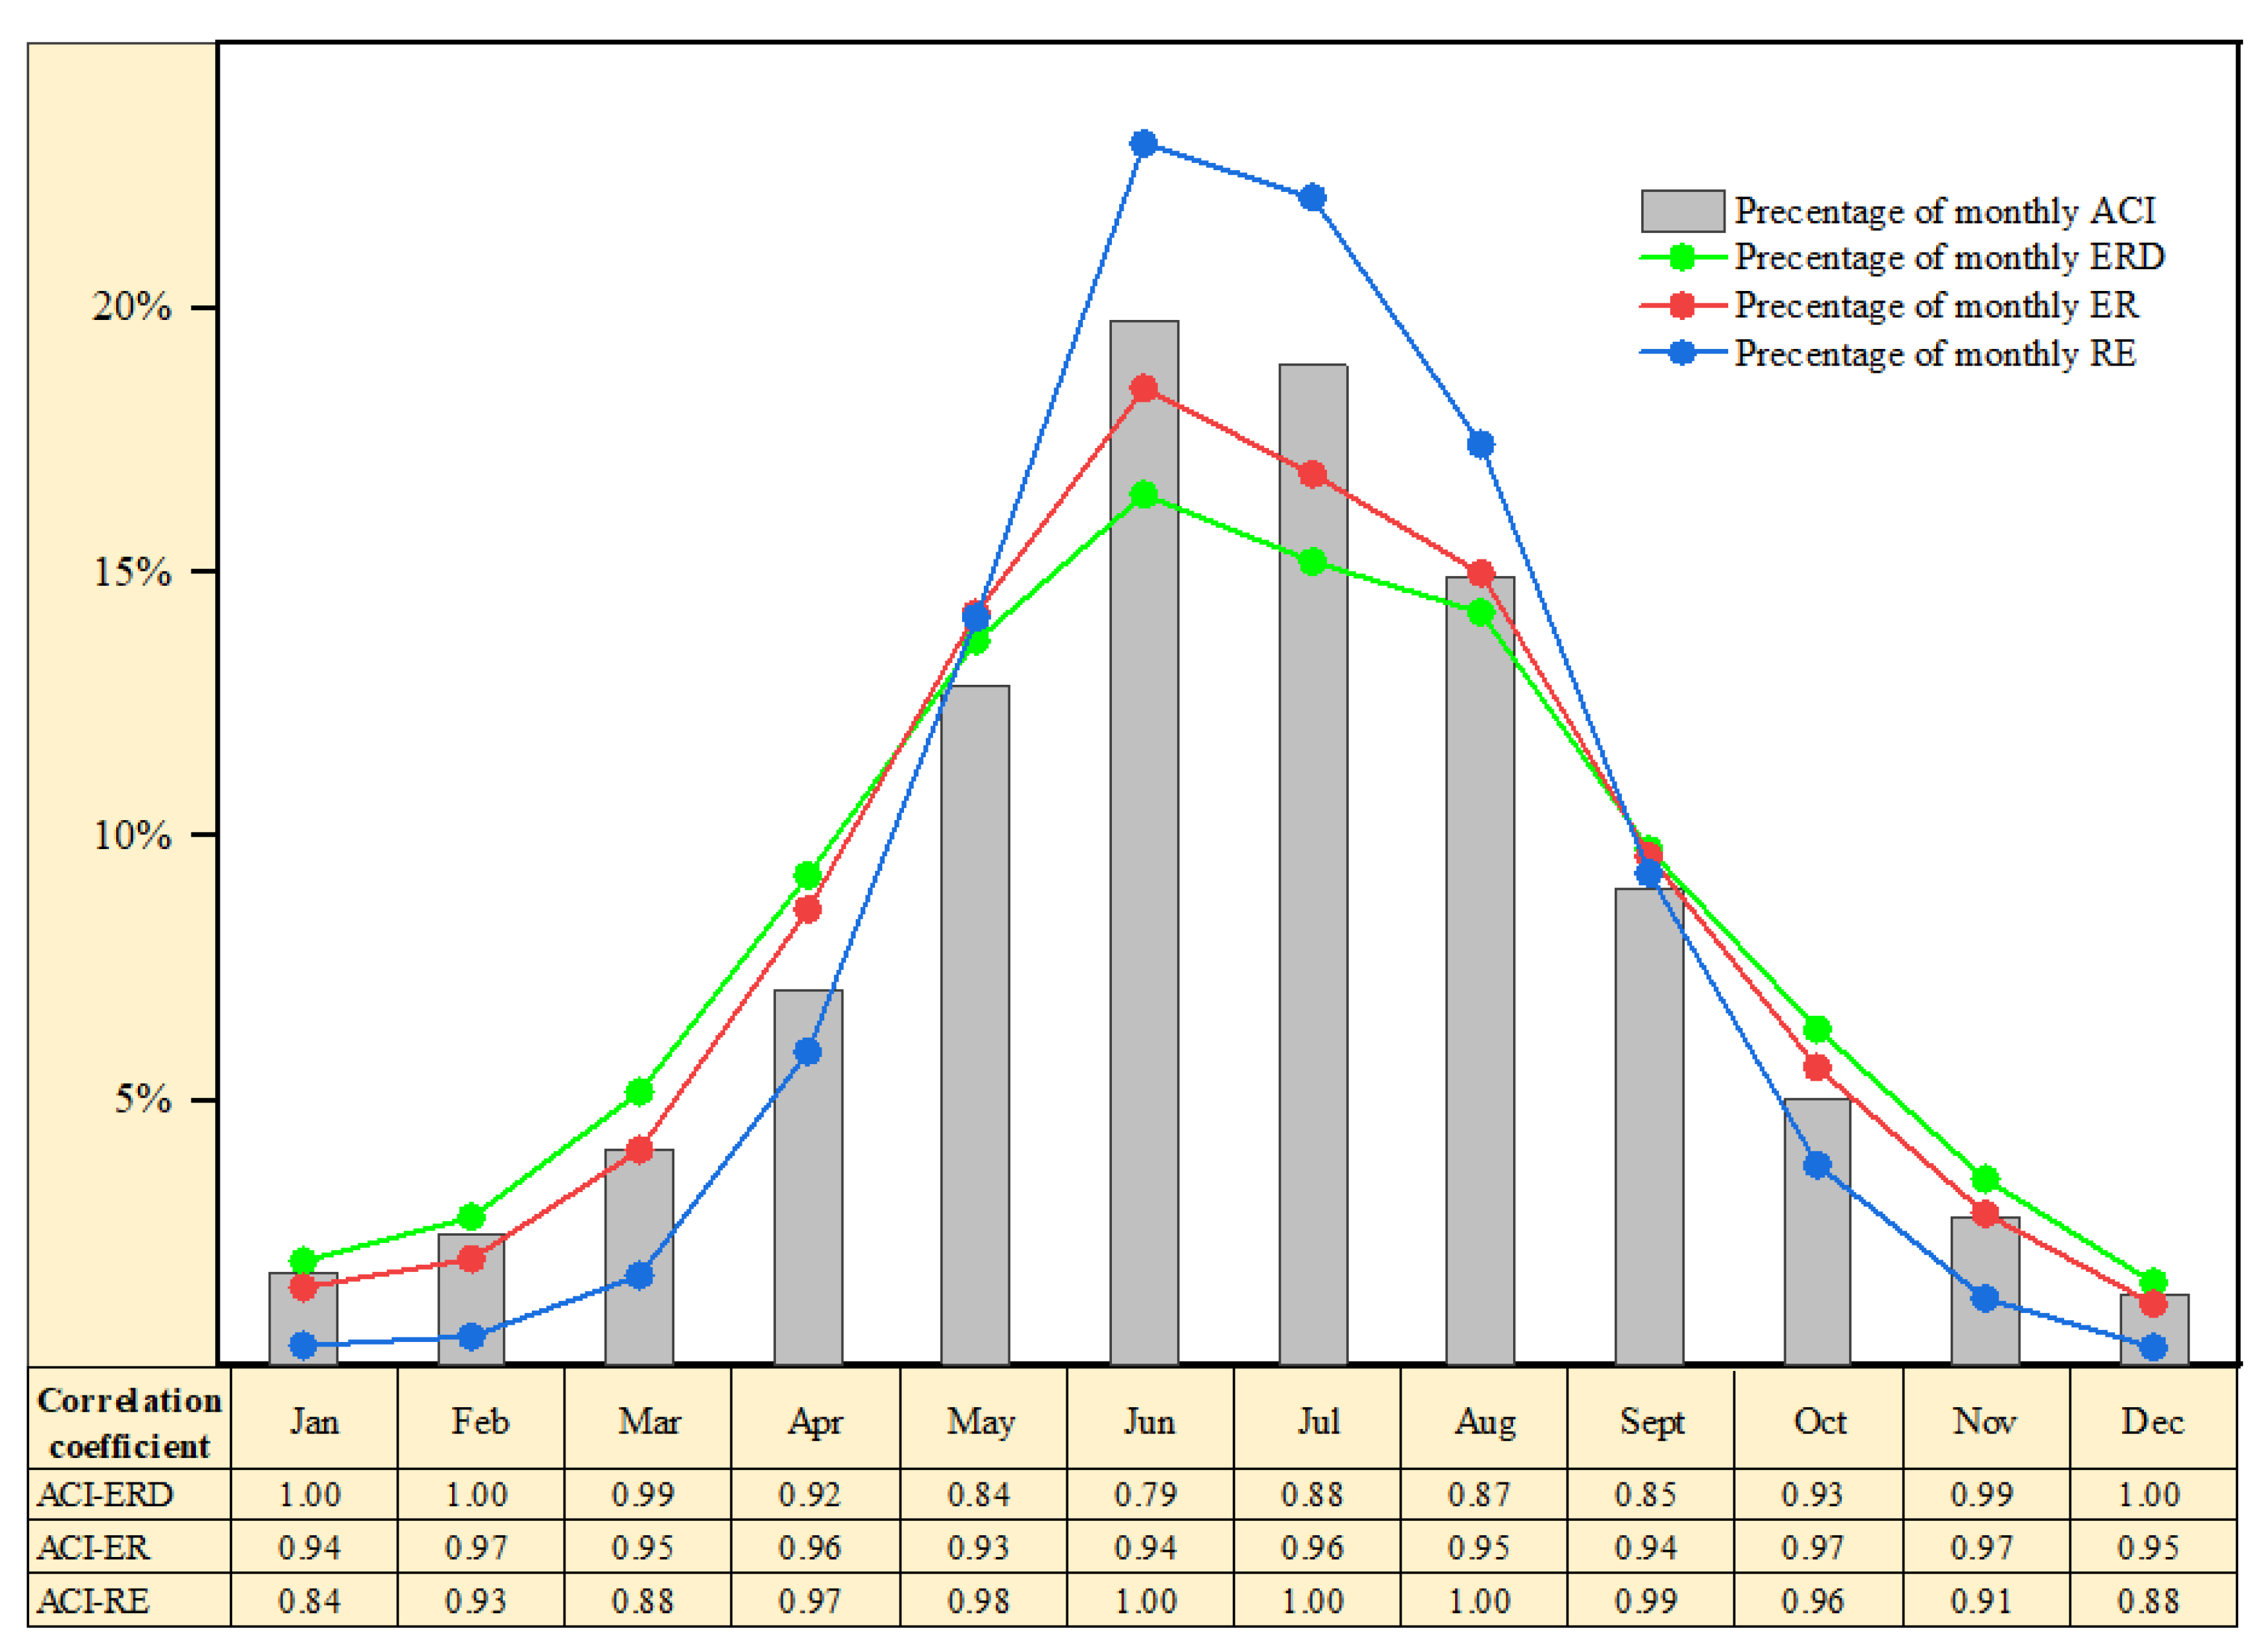
3.4.2. Correlation Analysis of the Monthly ACI Value

In general, the asymmetry effect of the study area experienced a clear annual distribution, roughly corresponding to the seasonal distribution of precipitation (Figure 6). The ACI showed a very high correlation with erosive rainfall days, erosive rainfall, and rainfall erosivity on the monthly scale, and all correlation coefficients reached the 99% confidence level. From May to October, the influence of rainfall erosivity on ACI was higher than that of erosive rainfall days, accompanied by larger correlation coefficients, and this period is also the concentrated period of rainfall in the study area. Additionally, the months with less precipitation were reversed (Figure 6). Table 4 shows the monthly correlation analysis results of different types. The correlation was commonly consistent among different types, with high values and high significance in correlation coefficients (p < 0.01). However, there were still slight differences between the rainstorm erosivity ACI and the other three types, and the correlation coefficient was slightly lower, such as in May and November. Rainstorms are unconventional extreme climate events, and the randomness of their occurrence could be the reason for this difference.

4. Discussion

4.1. Comparison of the Influences of Extreme Rainfall Erosion

In this study, the main work is to analyze the characteristics of erosivity under different rainfall intensities in the long-time scales. There are many factors affecting rainfall erosivity, such as the calculation model, erosivity threshold, and raindrop kinetic energy [4,8], and the amount of precipitation in a short time may be the most direct factor, which is the source of erosion power. Previous studies have found that extreme rainfall greatly contributes to the process of hydraulic erosion more than conventional rainfall [37], and a few extreme rainfall events usually induce a large amount of soil erosion [38], which is also well confirmed in this paper. According to the statistical results of this study, rainstorms accounted for only 2% of the average erosive rainfall days, but contributed to 23% of the total rainfall erosivity, expanding 11.5 times in proportion. This basically agrees with the results from Bezak et al. (2021) [36], who found that 11% of all rainfall erosive events supplied 50% of the total erosivity in Europe. Therefore, empirical analysis of data proves that the impact of rainfall erosivity on hydraulic erosion is non-uniform, the research should be more attention to extreme rainfall events with low total incidence but high energy density.
Although the asymmetric effect of extreme rainfall is crucial to hydraulic erosion, the changing trend cannot be disregarded. In this study, the annual ACI of rainstorm erosivity showed the maximum linear increasing trend with a rate of 569.15/yr, while the moderate rainfall erosivity exhibited the largest decreasing trend at the rate of −586.66/yr (Figure 5a,d); this increase and decrease showed a fact that the risk of extreme erosion would be further intensified. Although there are few documents on extreme erosivity that could be applied for direct comparison with our study in China. Though, Wang et al. (2022) [33] obtained similar results in the Yellow River basin, extreme erosivity storms appeared much more frequently and showed a significant trend based on hourly precipitation data. Additionally, we also found that the erosivity ACI above torrential increased rapidly in June and July, which was exactly the time frame when extreme precipitation events were most likely to occur during a year (Table 1). A mere counting of the erosive events could not completely reflect the actual annual rainfall erosivity [2,36,39], and the increasing trend of extreme rainfall events should continue and in-depth research, especially since global extreme events could be enhanced [40].

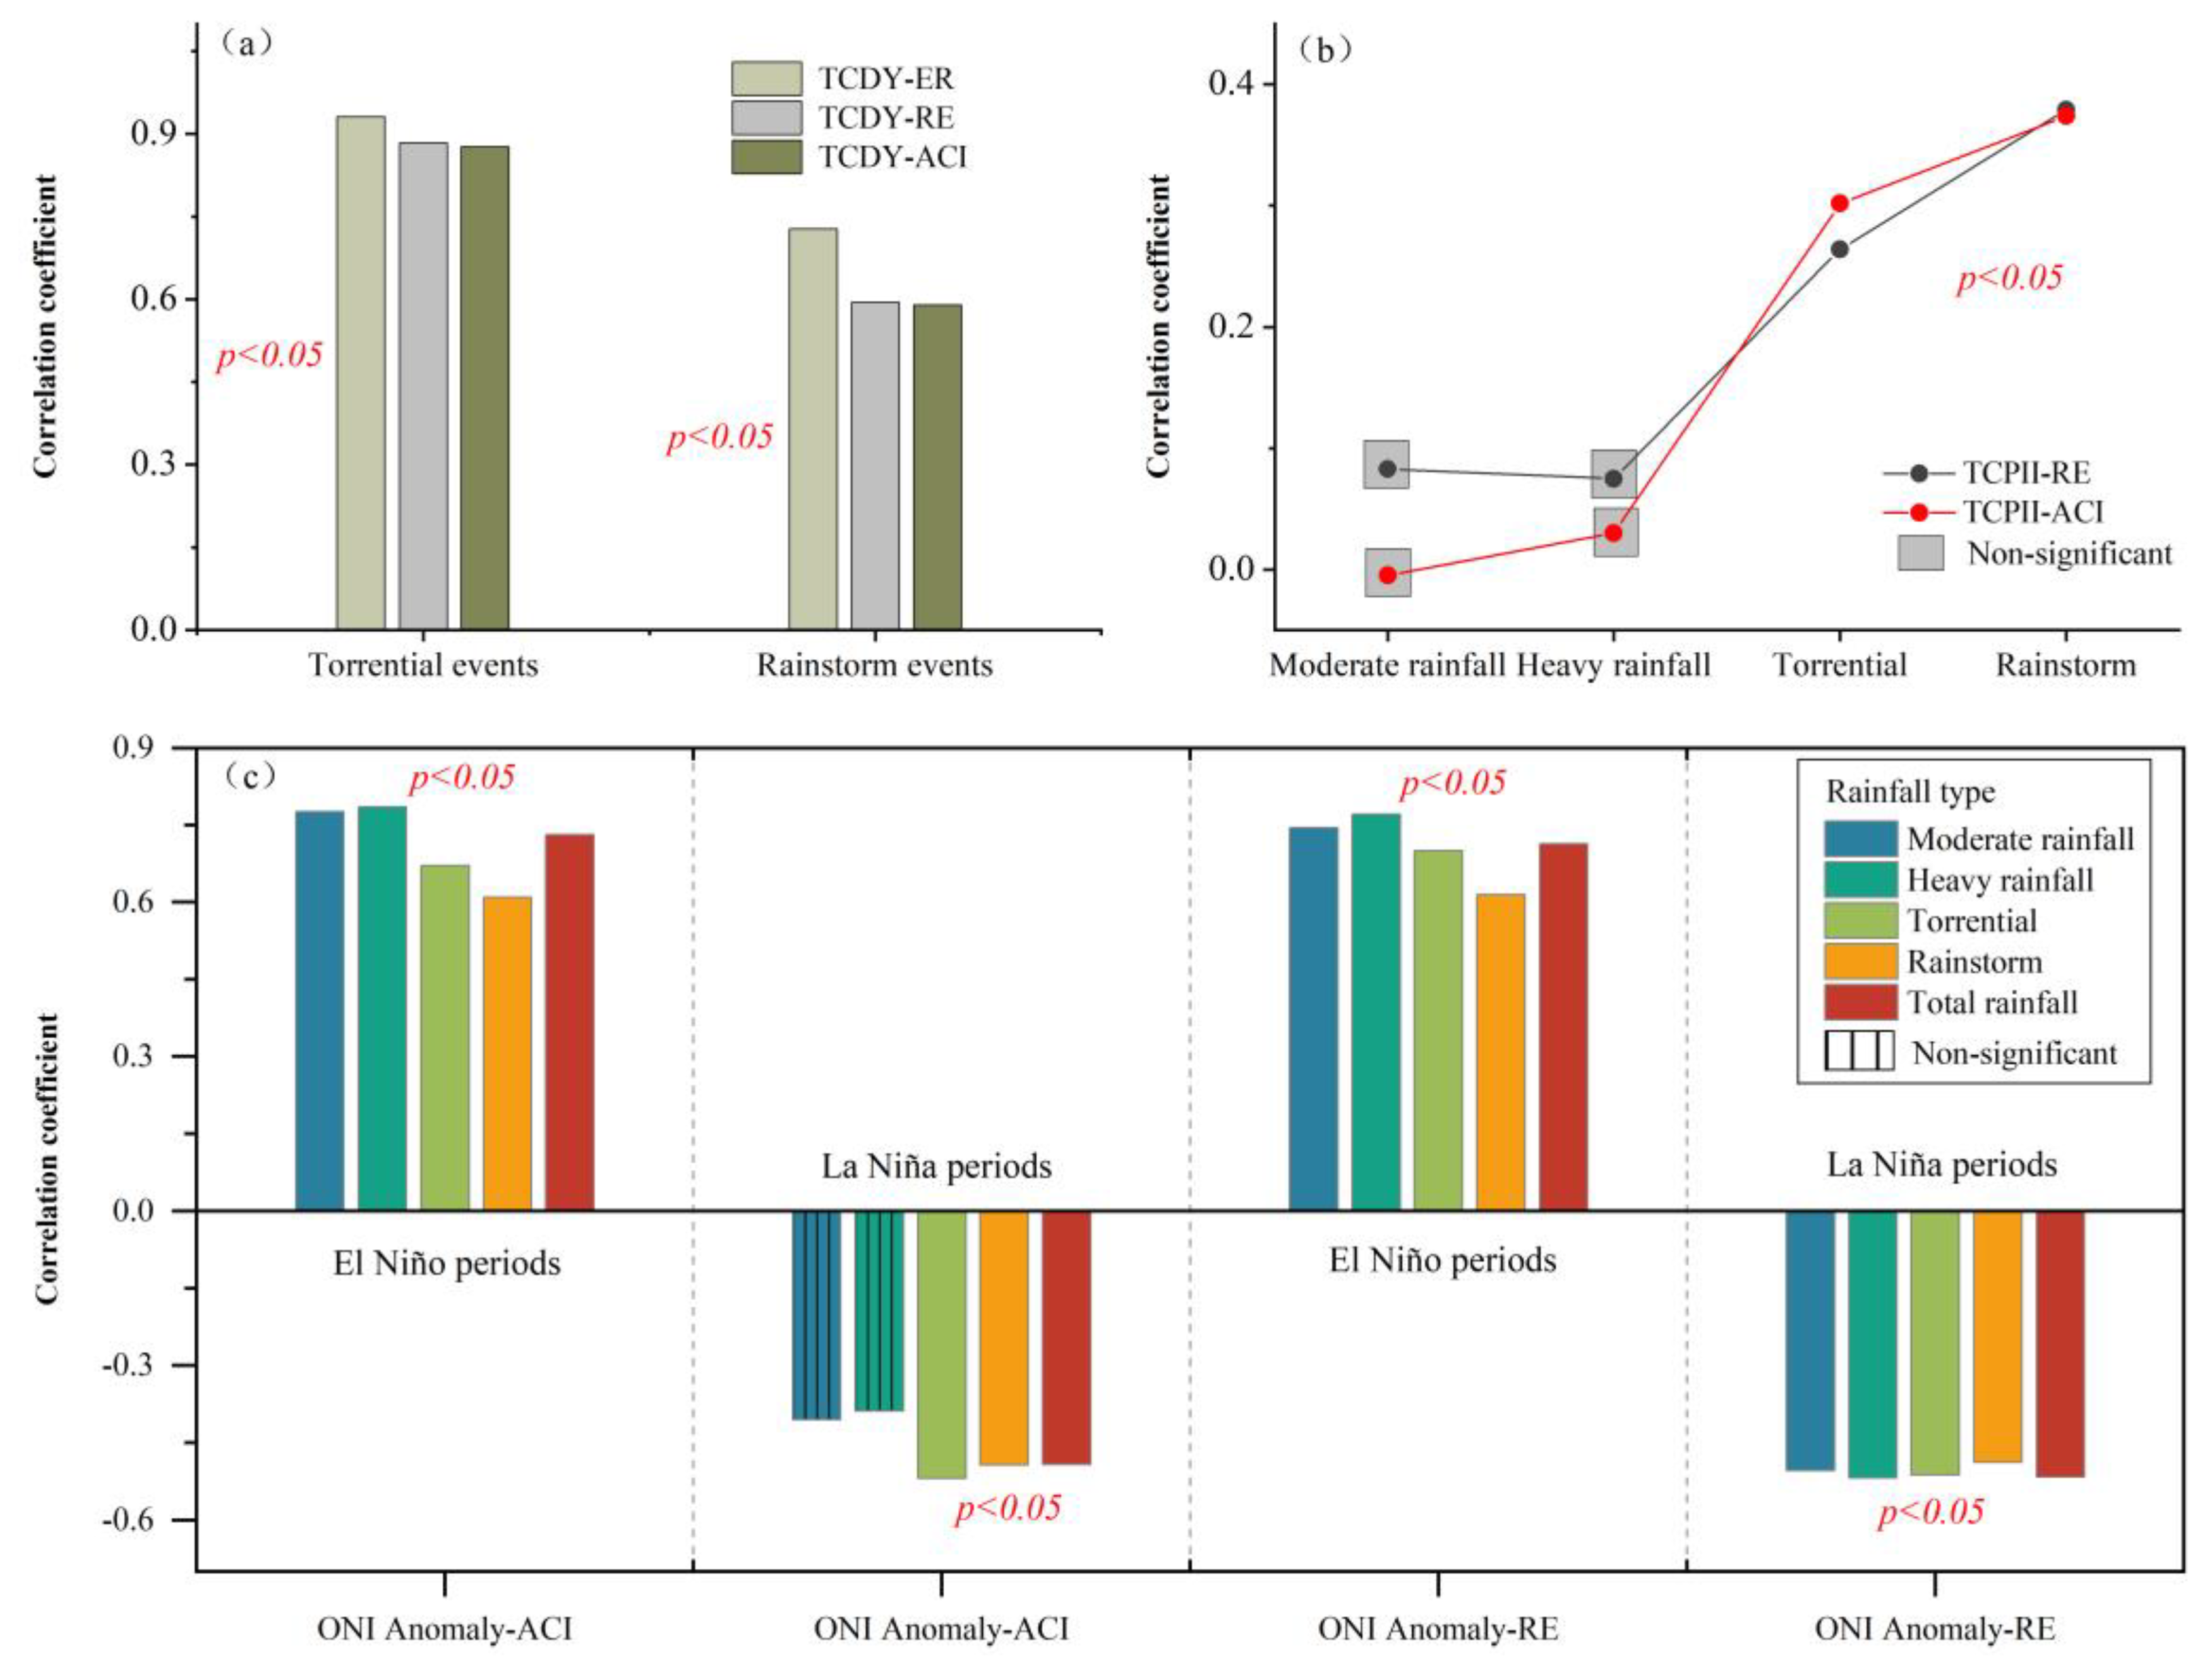
4.2. Possible Influence of ENSO and Tropical Cyclones on Extreme Rainfall Erosion

Regarding the factors affecting rainfall erosivity, some studies have been conducted, and the relatively consistent conclusion is that rainfall erosivity is closely related to rainfall amount and rainfall intensity, especially extreme precipitation [25,35,36]. The results in this study were generally similar to those of previous studies, and the ACIs of torrential and rainstorm erosivities showed highly significant correlations with erosion rainfall, rainfall erosivity, and erosion rainfall days (Table 3). Although ENSOs occur in the middle and eastern equatorial Pacific, they have a global impact on extreme climate events such as floods and droughts [41,42,43]. Additionally, the relationship between the ENSO and rainfall erosivity has been found in many regions of China, such as the northwest Loess Plateau region, the central Huaihe River basin, and the southeast coastal moist region [25,44,45].
El Niño and La Niña together are called ENSO. Figure 7c shows the correlation coefficient between the main indicator ONI of ENSO and the different types of rainfall erosivity and ACIs. During the ENSO, almost all rainfall erosivity and ACIs exhibited a significantly high correlation with the ONI anomaly (p < 0.05), except for the ACIs of moderate and heavy rainfall erosivity in the period of La Niña. However, we did not detect a significant correlation in the entire period (1961–2020), indicating that the impact of ENSO on rainfall erosion in the study area was different between the ENSO period and the non-ENAO period. The results generally agreed with those of previous studies [25,46]. Some studies, of course, obtained inconsistent conclusions. Chen and Zha (2018) [44] found that ENSO and rainfall erosivity maintained a significant correlation throughout the whole study period, while Li et al. (2022) [7] indicated that there were no evident patterns in rainfall erosivity during ENSO events. These differences could be caused by ENSO’s inherent features and geographical locations. The degree, mode, and stability of ENSO’s impact on different regions in China exhibited an obvious distinction due to its developmental stage, occurrence intensity, and duration [47].
Tropical cyclones have distinct rainstorm characteristics, which is an important factor in inducing extreme rainfall erosion in coastal areas [48]. Guangdong Province, located in the southeast of the study area, is the region where tropical cyclones often land in China. Hence, the possible influence of tropical cyclones on extreme rainfall erosivity is further explored through Guangdong. The tropical cyclone daily precipitation (TCDY) and tropical cyclone precipitation impact index (TCPII) are important indicators to measure typhoon precipitation features. Figure 7a shows that in the case of torrential and rainstorm events, the tropical cyclone daily precipitation exhibited a good correlation with daily erosion rainfall, daily rainfall erosivity, and ACI (p < 0.05). The corresponding tropical cyclone precipitation impact index also showed a significant correlation with the erosivity and ACI of torrential and rainstorm (p < 0.05), but a weak correlation was observed in the pattern of moderate and heavy rainfall and did not pass the test at the 95% significance level (Figure 7b). Furthermore, previous research on Guangdong Province found that the moving path of typhoons determined the magnitude of rainfall erosivity, and typhoons are a special manifestation of the strong development of tropical cyclones [49]. For this reason, tropical cyclones had a crucial impact on extreme rainfall erosion within the coverage of core influence.
Even if the facts have proved that extreme rainfall has an extraordinary erosion effect, its occurrence and development are much more difficult to capture than those in the conventional climate. In this study, we found that rainstorms accounted for only 9% of the total erosive rainfall amount but contributed to 23% of the total rainfall erosivity, and the asymmetry index of rainstorm erosivity is generally increasing. The increase in rainstorm erosivity will inevitably directly affect soil anti-erodibility, and aggravate water and soil loss, which will lead to the increase of turbidity and sedimentation downstream, and threaten regional ecological security. Over the past few decades, the Chinese government has carried out many ecological restoration engineering projects, and the ecosystem service function has been noticeably improved in southern China, especially the karst region [50], it reduces the dynamic action of extreme rainfall erosion to some extent. However, soil erosion resistance may exhibit new characteristics with plants recovery and water level change [51], more attention should be paid to the study of extreme rainfall erosion under complex ecological environment conditions in the future, so as to provide theoretical support for risk assessment of sediment deposition in lakes and dams in the middle and lower reaches of the Yangtze River and the Pearl River.

5. Conclusions

This study investigated the spatiotemporal characteristics of rainfall erosivity with different intensities in southern China using the asymmetric change index and discussed the relationship with typical extreme climate events. Different intensities of precipitation have evident asymmetric characteristics in terms of rainfall erosivity, and rainstorms have a strong effect on rainfall erosivity. The situations of eight provinces in the study area are basically analogous, and few high-intensity precipitation events cause greater rainfall erosivity, particularly for Guangdong and Guangxi Provinces.
The ACI of rainfall erosivity exhibited an obvious spatial heterogeneity. An insignificant increasing trend was found in the ACIs of heavy rainfall erosivity, torrential erosivity, and rainstorm erosivity over the past 60 years, while the moderate rainfall erosivity ACI showed a significant decreasing trend. The asymmetric effect of rainstorm erosivity was most evident and exhibited a greater peak erosion intensity and trend coefficient value. As a whole, the ACI showed a high correlation with erosive rainfall days, erosive rainfall, and rainfall erosivity on a monthly scale. Moreover, the impact of ENSO and tropical on the ACI was more pronounced during the special periods and regions. These results provide an understanding of the effect of extreme rainfall erosion and are useful for local soil and water conservation and predictions.

Author Contributions

Conceptualization, D.Z.; methodology, D.Z. and Z.C.; formal analysis, H.X.; data curation, Y.Z., H.C. and Q.Y.; writing—original draft preparation, D.Z. All authors have read and agreed to the published version of the manuscript.

Funding

This work was supported by the National Natural Science Foundation of China (No.41907042); the special project of Guizhou Normal University on Academic Seedling Cultivation and Innovation Exploration (Grant No.2019).

Data Availability Statement

The processed data required to reproduce these findings cannot be shared at this time as the data also forms part of an ongoing study.

Acknowledgments

We want to thank the China Meteorological Administration (http://data.cma.cn), US National Oceanic and Atmospheric Administration (NOAA), and Tropical Cyclone Data Center of China Meteorological Administration for providing daily erosive precipitation, ENSO and tropical cyclones data respectively.

Conflicts of Interest

The authors declare no conflict of interest.

References

  1. Pennock, D. Soil Erosion: The Greatest Challenge to Sustainable Soil Management; Food and Agriculture Organization of the United Nations: Rome, Italy, 2019; p. 100. [Google Scholar]
  2. Pablo, A.; Garcia-Chevesich, P.H.D. Erosion Control and Land Restoration; Outskirts Press: Parker, CO, USA, 2016. [Google Scholar]
  3. Lukić, T.; Lukić, A.; Basarin, B.; Ponjiger, T.M.; Blagojević, D.; Mesaroš, M.; Milanović, M.; Gavrilov, M.; Pavić, D.; Zorn, M.; et al. Rainfall erosivity and extreme precipitation in the Pannonian basin. Open Geosci. 2019, 11, 664–681. [Google Scholar] [CrossRef]
  4. Goebes, P.; Seitz, S.; Geißler, C.; Lassu, T.; Peters, P.; Seeger, M.; Nadrowski, K.; Scholten, T. Momentum or kinetic energy—How do substrate properties influence the calculation of rainfall erosivity? J. Hydrol. 2014, 517, 310–316. [Google Scholar] [CrossRef]
  5. Wischmeier, W.H.; Smith, D.D. Rainfall energy and its relationship to soil loss. Trans. Am. Geophys. Union 1958, 39, 285–291. [Google Scholar] [CrossRef]
  6. Renard, K.G.; Foster, G.R.; Weesies, G.A.; Mccool, D.K.; Yoder, D.C. Predicting Soil Erosion by Water: A Guide to Conservation Planning with the Revised Universal Soil Loss Equation (RUSLE); USDA: Washington, DC, USA, 1997. [Google Scholar]
  7. Li, Y.L.; He, Y.; Zhang, Y.R.; Jia, L.P. Spatiotemporal evolutionary analysis of rainfall erosivity during 1901–2017 in Beijing, China. Environ. Sci. Pollut. Res. 2022, 29, 2510–2522. [Google Scholar] [CrossRef] [PubMed]
  8. Brychta, J.; Podhrázská, J.; Šťastná, M. Review of methods of spatio-temporal evaluation of rainfall erosivity and their correct application. Catena 2022, 217, 106454. [Google Scholar] [CrossRef]
  9. Verstraeten, G.; Poesen, J.; Demarée, G.; Salles, C. Long-term (105 years) variability in rain erosivity as derived from 10-min rainfall depth data for Ukkel (Brussels, Belgium): Implications for assessing soil erosion rates. J. Geophys. Res. 2006, 111, D22109. [Google Scholar] [CrossRef]
  10. Hanel, M.; Máca, P.; Bašta, P.; Vlnas, R.; Pech, P. The rainfall erosivity factor in the Czech Republic and its uncertainty. Hydrol. Earth Syst. Sci. 2016, 20, 4307–4322. [Google Scholar] [CrossRef] [Green Version]
  11. Yin, S.Q.; Nearing, M.A.; Borrelli, P.; Xue, X.C. Rainfall Erosivity: An Overview of Methodologies and Applications. Vadose Zone J. 2017, 16, 1–16. [Google Scholar] [CrossRef] [Green Version]
  12. Xie, Y.; Yin, S.Q.; Liu, B.Y.; Nearing, M.A.; Zhao, Y. Models for estimating daily rainfall erosivity in China. J. Hydrol. 2016, 535, 547–558. [Google Scholar] [CrossRef] [Green Version]
  13. Zhu, Z.; Yu, B. Validation of Rainfall Erosivity Estimators for Mainland China. Trans. ASABE 2015, 58, 61–71. [Google Scholar] [CrossRef]
  14. Zhu, D.Y.; Xiong, K.N.; Xiao, H. Multi-time scale variability of rainfall erosivity and erosivity density in the karst region of southern China, 1960–2017. Catena 2021, 197, 104977. [Google Scholar] [CrossRef]
  15. Chen, Z.F.; Shi, D.M.; He, W.; Xia, J.R.; Jin, H.F.; Lou, Y.B. Spatial-temporal Distribution and Trend of rainfall Erosivity in Yunnan Province. Trans. CSAM 2017, 48, 209–219. [Google Scholar]
  16. Oliveira, P.T.S.; Wendland, E.; Nearing, M.A. Rainfall erosivity in Brazil: A review. Catena 2013, 100, 139–147. [Google Scholar] [CrossRef]
  17. Qin, W.; Guo, Q.K.; Zuo, C.Q.; Shan, Z.J.; Ma, L.; Sun, G. Spatial distribution and temporal trends of rainfall erosivity in mainland China for 1951–2010. Catena 2016, 147, 177–186. [Google Scholar] [CrossRef]
  18. Ballabio, C.; Borrelli, P.; Spinoni, J.; Meusburger, K.; Michaelides, S.; Beguería, S.; Klik, A.; Petan, S.; Janeček, M.; Olsen, P.; et al. Mapping monthly rainfall erosivity in Europe. Sci. Total Environ. 2017, 579, 1298–1315. [Google Scholar] [CrossRef] [Green Version]
  19. Shin, J.Y.; Kim, T.; Heo, J.H.; Lee, J.H. Spatial and temporal variations in rainfall erosivity and erosivity density in South Korea. Catena 2019, 176, 125–144. [Google Scholar] [CrossRef]
  20. de Mello, C.R.; Alves, G.J.; Beskow, S.; Norton, L.D. Daily rainfall erosivity as an indicator for natural disasters: Assessment in mountainous regions of southeastern Brazil. Nat. Hazards 2020, 103, 947–966. [Google Scholar] [CrossRef]
  21. Riquetti, N.B.; Mello, C.R.; Beskow, S.; Viola, M.R. Rainfall erosivity in South America: Current patterns and future perspectives. Sci. Total Environ. 2020, 724, 138315. [Google Scholar] [CrossRef] [PubMed]
  22. Yue, T.Y.; Yin, S.Q.; Xie, Y.; Yu, B.F.; Liu, B.Y. Rainfall erosivity mapping over mainland China based on high-density hourly rainfall records. Earth Syst. Sci. Data 2022, 14, 665–682. [Google Scholar] [CrossRef]
  23. Yang, F.B.; Lu, C.H. Spatiotemporal variation and trends in rainfall erosivity in China’s dryland region during 1961–2012. Catena 2015, 133, 362–372. [Google Scholar] [CrossRef]
  24. Gao, G.; Yin, S.Q.; Chen, T.; Huang, D.P.; Wang, W.T. Spatiotemporal variation and cause analysis of rainfall erosivity in the Yangtze River Basin of China. Trans. CSAE 2022, 38, 84–92. [Google Scholar]
  25. Xu, Z.H.; Pan, B.; Han, M.; Zhu, J.Q.; Tian, L.X. Spatial–temporal distribution of rainfall erosivity, erosivity density and correlation with El Niño–Southern Oscillation in the Huaihe River Basin, China. Ecol. Inform. 2019, 52, 14–25. [Google Scholar] [CrossRef]
  26. Panagos, P.; Ballabio, C.; Borrelli, P.; Meusburger, K. Spatio-temporal analysis of rainfall erosivity and erosivity density in Greece. Catena 2016, 137, 161–172. [Google Scholar] [CrossRef]
  27. Chen, S.F.; Tian, G.Z.; Li, H.F.; Zhang, Q.J.; Bai, Y.H.; Wang, L.Y. Impacts of TyphoonMangosteenNo.1822 on Rainfall Erosivity in Guangdong Province. J. Soil Water Conserv. 2019, 39, 231–236. [Google Scholar] [CrossRef]
  28. Lu, X.Q.; Yu, H.; Ying, M.; Zhao, B.K.; Zhang, S.; Lin, L.M.; Bai, L.N.; Wan, R.J. Western North Pacific Tropical Cyclone Database Created by the China Meteorological Administration. Adv. Atmos. Sci. 2021, 38, 690–699. [Google Scholar] [CrossRef]
  29. Yu, B.; Rosewell, C.J. A Robust Estimate of the R-Factor for the Universal Soil Loss Equation. Trans. ASABE 1996, 39, 559–561. [Google Scholar] [CrossRef]
  30. He, Y.L. The Mechanism of the Seasonal Asymmetric Warming over Mid-High Latitude of Northern Hemisphere. Master’s Thesis, Lanzhou University, Lanzhou, China, 2017. [Google Scholar]
  31. Sen, P.K. Estimates of the Regression Coefficient Based on Kendall’s Tau. J. Am. Stat. Assoc. 1968, 63, 1379–1389. [Google Scholar] [CrossRef]
  32. Xu, X.M.; Lyu, D.; Lei, X.J.; Huang, T.; Li, Y.L.; Yi, H.J.; Guo, J.W.; He, L.; He, J.; Yang, X.H.; et al. Variability of extreme precipitation and rainfall erosivity and their attenuated effects on sediment delivery from 1957 to 2018 on the Chinese Loess Plateau. J. Soils Sediments 2021, 21, 3933–3947. [Google Scholar] [CrossRef]
  33. Wang, W.; Yin, S.; Gao, G.; Papalexiou, S.M.; Wang, Z. Increasing trends in rainfall erosivity in the Yellow River basin from 1971 to 2020. J. Hydrol. 2022, 610, 127851. [Google Scholar] [CrossRef]
  34. Manders, E.M.M.; Verbeek, F.J.; Aten, J.A. Measurement of co-localization of objects in dual-colour confocal images. J. Microsc. 1993, 169, 375–382. [Google Scholar] [CrossRef]
  35. Chang, Y.M.; Lei, H.M.; Zhou, F.; Yang, D.W. Spatial and temporal variations of rainfall erosivity in the middle Yellow River Basin based on hourly rainfall data. Catena 2022, 216, 106406. [Google Scholar] [CrossRef]
  36. Bezak, N.; Mikoš, M.; Borrelli, P.; Liakos, L.; Panagos, P. An in-depth statistical analysis of the rainstorms erosivity in Europe. Catena 2021, 206, 105577. [Google Scholar] [CrossRef]
  37. Martínez-Casasnovas, J.A.; Ramos, M.C.; Ribes-Dasi, M. Soil erosion caused by extreme rainfall events: Mapping and quantification in agricultural plots from very detailed digital elevation models. Geoderma 2002, 105, 125–140. [Google Scholar] [CrossRef]
  38. Cerdà, A.; Keesstra, S.D.; Rodrigo-Comino, J.; Novara, A.; Pereira, P.; Brevik, E.; Giménez-Morera, A.; Fernández-Raga, M.; Pulido, M.; di Prima, S.; et al. Runoff initiation, soil detachment and connectivity are enhanced as a consequence of vineyards plantations. J. Environ. Manag. 2017, 202, 268–275. [Google Scholar] [CrossRef] [PubMed] [Green Version]
  39. Borrelli, P.; Robinson, D.A.; Panagos, P.; Lugato, E.; Yang, J.E.; Alewell, C.; Wuepper, D.; Montanarella, L.; Ballabio, C. Land use and climate change impacts on global soil erosion by water (2015–2070). Proc. Natl. Acad. Sci. USA 2020, 117, 21994–22001. [Google Scholar] [CrossRef] [PubMed]
  40. IPCC. Working Group I Contribution to the Sixth Assessment Report (AR6), Climate Change 2021: The Physical Science Basis; IPCC: Geneva, Switzerland, 2021. [Google Scholar]
  41. Zhang, Q.; Li, J.F.; Singh, V.P.; Xu, C.Y.; Deng, J.Y. Influence of ENSO on precipitation in the East River basin, south China. J. Geophys. Res. Atmos. 2013, 118, 2207–2219. [Google Scholar] [CrossRef]
  42. Kundzewicz, Z.W.; Szwed, M.; Pińskwar, I. Climate Variability and Floods—A Global Review. Water 2019, 11, 1399. [Google Scholar] [CrossRef] [Green Version]
  43. Cai, W.; Mcphaden, M.J.; Grimm, A.M.; Rodrigues, R.R.; Taschetto, A.S.; Garreaud, R.D.; Dewitte, B.; Poveda, G.; Ham, Y.G.; Santoso, A.; et al. Climate impacts of the El Niño–Southern Oscillation on South America. Nat. Rev. Earth Environ. 2020, 1, 215–231. [Google Scholar] [CrossRef]
  44. Chen, S.F.; Zha, X. Effects of the ENSO on rainfall erosivity in the Fujian Province of southeast China. Sci. Total Environ. 2018, 621, 1378–1388. [Google Scholar] [CrossRef]
  45. Liu, S.Y.; Huang, S.Z.; Xie, Y.Y.; Leng, G.Y.; Huang, Q.; Wang, L.; Xue, Q. Spatial-temporal changes of rainfall erosivity in the loess plateau, China: Changing patterns, causes and implications. Catena 2018, 166, 279–289. [Google Scholar] [CrossRef]
  46. Zhu, D.Y.; Xiong, K.N.; Xiao, H.; Gu, X.P. Variation characteristics of rainfall erosivity in Guizhou Province and the correlation with the El Niño Southern Oscillation. Sci. Total Environ. 2019, 691, 835–847. [Google Scholar] [CrossRef] [PubMed]
  47. Xu, W.C.; Ma, J.S.; Wang, W. A review of studies on the influence of ENSO events on the climate in China. Sci. Agric. Sin. 2005, 25, 212–220. [Google Scholar]
  48. Nanko, K.; Moskalski, S.M.; Torres, R. Rainfall erosivity–intensity relationships for normal rainfall events an a tropical cyclone on the US southeast coast. J. Hydrol. 2016, 534, 440–450. [Google Scholar] [CrossRef] [Green Version]
  49. Chen, P.Y.; Yu, H.; Ming, X.; Lei, X.T.; Zeng, F. A simplified index to assess the combined impact of tropical cyclone precipitation and wind on China. Front. Earth Sci. 2019, 13, 672–681. [Google Scholar] [CrossRef]
  50. Tong, X.W.; Brandt, M.; Yue, Y.M.; Horion, S.; Wang, K.L.; Keersmaecker, W.D.; Tian, F.; Schurgers, G.; Xiao, X.M.; Luo, Y.Q.; et al. Increased vegetation growth and carbon stock in China karst via ecological engineering. Nat. Sustain. 2018, 1, 44–50. [Google Scholar] [CrossRef]
  51. Xiao, H.; Guo, P.; Zhang, Q.H.; Hu, H.; Hong, H.; Zhang, L.; Yang, Y.S.; Xia, Z.Y.; Li, M.Y.; Kang, H.L.; et al. Variation in soil properties and its influence on the dynamic change of soil. Catena 2022, 213, 106141. [Google Scholar] [CrossRef]
Figure 1. The distribution of 212 stations in the study area.
Water 15 02408 g001
Figure 2. Statistics of the overall (a) and proportion (b) characteristics of rainfall erosion at different levels.
Water 15 02408 g002
Figure 3. Statistics of overall characteristics of rainfall erosion in different provinces.
Water 15 02408 g003
Figure 4. Spatial distribution of the rainfall erosivity asymmetric change index (ACI).
Water 15 02408 g004
Figure 5. Interdecadal trends of moderate rainfall erosivity ACI (a), heavy rainfall erosivity ACI (b), torrential erosivity ACI (c) and rainstorm erosivity ACI (d) (* one asterisk represents p < 0.1, ** two asterisks represent p < 0.05).
Water 15 02408 g005
Figure 6. Monthly distribution of the ACIs, erosive rainfall days (ERD), erosive rainfall (ER), rainfall erosivity (RE), and their correlation coefficients (p < 0.01).
Water 15 02408 g006
Figure 7. (a) Pearson correlation coefficient between the typical tropical cyclone daily precipitation (TCDY) and erosive rainfall (ER), rainfall erosivity (RE) and ACI, (b) relationship between the tropical cyclone precipitation impact index(TCPII) and RE, ACI of Guangdong Province, (c) relationship between the Oceanic Niño Index (ONI) anomaly and RE, ACI during the period of ENSO.
Water 15 02408 g007
Table 1. The monthly variation trend of rainfall erosivity ACI.
MonthModerate Rainfall Erosivity ACIHeavy Rainfall
Erosivity ACI
Torrential
Erosivity ACI
Rainstorm
Erosivity ACI
Jan126.50 **66.04 **7.66 **4.71
Feb−30.3623.521.22−0.05
Mar116.62 **56.02 **13.63 *15.99 **
Apr−199.05 **−41.67 *−15.38−56.06
May−84.41−8.82−18.5141.25
Jun−34.5116.2687.01433.95 **
Jul−9.4211.3465.81226.15
Aug−150.59 **−24.48−81.948.35
Sept−109.13 *−6.1711.44−87.61
Oct−134.11 *−33.60 *−24.65−29.17
Nov−59.57−4.378.799.86
Dec−18.635.073.691.77
Note: * one asterisk represents p < 0.1, ** two asterisk represents p < 0.05.
Table 2. The trend of annual rainfall erosivity ACI in different provinces.
ProvincesModerate Rainfall
Erosivity ACI
Heavy Rainfall Erosivity ACITorrential Erosivity ACIRainstorm Erosivity ACI
GD17.4648.4749.8591.01
GX−59.1822.6219.0860.63
GZ−196.52 **−25.54−6.61 *67.90
HB−85.193.74−24.6677.03
HN−78.4023.5069.08230.06 **
SC−34.65−8.70−14.7630.14
YN−125.38 **−0.80−9.822.80
CQ−24.83−4.15−23.389.59
Note: * one asterisk represents p < 0.1, ** two asterisks represent p < 0.05.
Table 3. Correlation coefficients between ACI and typical rainfall elements.
Heavy Rainfall Erosivity ACITorrential
Erosivity ACI
Rainstorm Erosivity ACIErosive RainfallRainfall
Erosivity
Erosive
Rainfall Days
Moderate rainfall erosivity ACI0.74 ***0.46 ***0.24 *0.78 ***0.56 ***0.92 ***
Heavy rainfall erosivity ACI 0.64 ***0.51 ***0.89 ***0.75 ***0.88 ***
Torrential erosivity ACI 0.73 ***0.85 ***0.93 ***0.15 ***
Rainstorm erosivity ACI 0.67 ***0.87 ***0.48 ***
Erosive rainfall 0.93 ***0.96 ***
Rainfall erosivity 0.80 ***
Notes: * one asterisk represents p < 0.1, *** three asterisks represent p < 0.01.
Table 4. Monthly correlation coefficients between the ACIs and typical rainfall elements.
JanFebMarAprMayJunJulAugSeptOctNovDec
Moderate rainfall erosivity ACIErosive rainfall days1.001.001.001.001.001.001.001.001.001.001.001.00
Erosive rainfall1.001.001.001.001.000.990.991.000.991.001.001.00
Rainfall erosivity0.991.000.990.990.990.980.990.990.990.991.000.99
Heavy rainfall erosivity ACIErosive rainfall days1.001.001.000.990.980.980.980.990.990.991.001.00
Erosive rainfall1.001.000.990.980.980.990.990.990.990.981.001.00
Rainfall erosivity0.990.990.980.980.980.990.990.990.980.970.990.99
Torrential erosivity ACIErosive rainfall days0.990.990.950.970.980.980.980.980.970.970.960.97
Erosive rainfall0.980.990.960.990.990.990.990.990.990.990.970.98
Rainfall erosivity0.970.990.980.991.001.001.001.001.001.000.980.99
Rainstorm erosivity ACIErosive rainfall days0.981.000.980.900.880.940.950.960.960.960.830.99
Erosive rainfall0.991.000.990.960.960.980.980.990.990.990.940.99
Rainfall erosivity1.001.001.001.001.001.001.001.001.001.000.991.00
Note: All correlation coefficients reached the significance level of p < 0.01.
Disclaimer/Publisher’s Note: The statements, opinions and data contained in all publications are solely those of the individual author(s) and contributor(s) and not of MDPI and/or the editor(s). MDPI and/or the editor(s) disclaim responsibility for any injury to people or property resulting from any ideas, methods, instructions or products referred to in the content.

