Article

Activity of Ammonium-Oxidizing Bacteria—An Essential Parameter for Model-Based N2O Mitigation Control Strategies for Biofilms

Institute of Sanitary Engineering and Waste Management (ISAH), Leibniz University Hannover, Welfengarten 1, 30167 Hannover, Germany
*
Author to whom correspondence should be addressed.
Water 2023, 15(13), 2389; https://doi.org/10.3390/w15132389
Submission received: 30 May 2023 / Revised: 19 June 2023 / Accepted: 26 June 2023 / Published: 28 June 2023
(This article belongs to the Special Issue Advanced Biofilm Processes for Removal and Resource Recovery)

Abstract

:
The reduction in N2O emissions is an important task in the control of wastewater treatment plants. Since local operating conditions, especially inside biofilms, are usually not known, models are an important tool in the development and implementation of control strategies. For a pilot-scale nitrifying biofilm reactor and an SBR, different operational strategies to reduce autotrophic nitrous oxide (N2O) formation were developed and tested by applying a combination of modeling and measurement. Both approaches highlighted the relevance of addressing the actual AOB activity as a sensitive control variable. The investigated strategies, therefore, focused on decreasing the AOB-related NH4 conversion rate, as autotrophic N2O formation is directly linked to AOB activity. The results showed that the biofilm system was more advantageous compared with suspended sludge systems. A higher AOB content resulted in a decrease in AOB activity, leading to fewer N2O emissions at the same reactor performance. The highest reduction in autotrophic N2O formation (SBR: 25%; Biofilm: 27%) was obtained by maximizing the aerated time per day and minimizing the number of aeration cycles (the suppression of nitrite-oxidizing bacteria still needed to be ensured). A higher biofilm thickness or a higher sludge mass in the SBR, however, did not have a noteworthy positive effect since no additional biomass could be kept in the system in the long term due to limited substrate availability. Besides nitritation, denitrification was also identified as a relevant source of N2O in both systems (biofilm: main source) due to the inhibition of N2O reduction by nitrous acid (elevated nitrite concentrations in combination with pH values < 7).

1. Introduction

The changes currently taking place in the global climate require the wastewater sector to increase its efforts in minimizing the emission of greenhouse gases (GHGs). Besides reducing methane emissions during sludge treatment, a special focus must be placed on biological wastewater treatment. Substantial amounts of the GHG nitrous oxide (N2O) can be formed and emitted during the nitrification/denitrification process if the operating conditions are not adjusted with regard to minimized greenhouse gas formation. Due to high N2O emission factors—up to 20% of the influent nitrogen (e.g., [1])—and the high global warming potential of 265 g CO2e/g N2O [2], the direct N2O emissions often exceed the indirect CO2e emissions caused by energy consumption (e.g., [3]). However, several investigations on large-scale plants have also shown that N2O emissions close to zero are achievable for low-load systems (e.g., [4,5]). In high-load systems (e.g., reject water treatment), emission factors of <0.5% of the influent ammonium can be achieved through optimized operation (e.g., [6]).
N2O is formed by ammonium-oxidizing bacteria (AOB) as a by-product of nitritation and by heterotrophic bacteria (HET) as an intermediate of heterotrophic denitrification. For AOB, a strong correlation between N2O formation and the ammonium (NH4) conversion rate has been reported [7,8,9]. Moreover, autotrophic N2O formation is favored at high nitrite (NO2) concentrations [8,10]; the critical NO2 concentration is influenced by adaptation processes (e.g., >20 mg/L for a high-load nitritation system [8] and >3 mg/L for a mainstream nitrification/denitrification system [11]). Above a site-specific limit concentration, no further increase in N2O formation was detected (e.g., [8]). Oxygen (O2) availability was also identified as a main influencing factor; O2 concentrations of <0.5 mg/L are considered critical ([12,13,14]). In addition, the O2 concentration influences the activity of HET. Denitrification can act as both an N2O source and an N2O sink (e.g., [15,16]) depending strongly on the nitrous acid (HNO2) concentration [16,17]. For this reason, denitrification is a key process in terms of mitigating N2O emissions.
Currently, activated sludge systems with suspended biomass are predominant, but biofilm systems are also used in wastewater treatment due to their process stability and the potential to use small reactor volumes and a high sludge age at the same time. In biofilms, the O2 concentration varies with depth, allowing different processes to take place simultaneously. Regarding the minimization of N2O emissions, there is potential for simultaneous denitrification of formed N2O in the anoxic zones (e.g., [18,19,20,21]); however, unavoidable areas with low O2 concentrations inside the biofilm can also favor autotrophic N2O formation, e.g., [18].
Over the past years, different control strategies and, in some cases, control algorithms for the minimization of N2O emissions have been published (e.g., [16,22,23]). However, the high number of influencing factors and the variability of local boundary conditions, especially in biofilms, make it difficult to directly transfer control strategies between plants, and site-specific development of control strategies based on measurements is time-consuming and expensive. In this context, the authors propose employing validated mathematical models that can be calibrated with data usually available in practice in combination with short measurement campaigns [23]. Using the models, the different processes of N2O formation, conversion, and emission can be separated and individually investigated. Subsequently, targeted measures aiming for a balance between maximized reactor performance and minimized greenhouse gas emissions can be developed.
The authors expect that in the future, the use of self-learning artificial intelligence (AI) will also gain importance in the development of operational strategies and plant control. However, in most cases, there are not enough data sets available for AI training, so deterministic models will continue to be needed. By linking deterministic models with methods of AI, existing knowledge can be combined with the strong data analysis capabilities of AI. A major challenge is, however, the automatic evaluation of the quality of the model output, e.g., evaluation based on a statistical evaluation of the specific input data as well as the training data.
In this work, the combined measurement and modeling approach was applied to a sequencing batch reactor (SBR) and a fixed bed biofilm reactor, aiming to minimize autotrophic N2O formation by reducing the AOB-related NH4 conversion rate. For this purpose, the employed ASM model [23,24] was extended to include the active AOB biomass in the calculation of the N2O formation factor. The effect of the tested measures on heterotrophic N2O formation/conversion was also investigated, although improved reduction of formed N2O by denitrification was not considered, as this topic was already addressed in [20].
In this publication, aerobic conditions were defined as an environment with an oxygen concentration of >0.1 mg/L, and anoxic conditions were defined as an environment with an oxygen concentration of <0.1 mg/L (see Section 2.1).

2. Materials and Methods

2.1. Definitions

In this publication, the following expressions are used to describe the aeration regime of the pilot plant (intermittent aeration):
  • Aeration cycle: summed duration of one aerated phase and one unaerated phase of intermittent aeration (indicated as “time on/time off” in minutes);
  • Aerated/unaerated phase: time of one aeration cycle during which the aeration was switched on/off;
  • Aerobic/anoxic phase: time of one aeration cycle during which the O2 concentration was >/<0.1 mg/L;
  • Aerated/unaerated time per day: summed time per day during which the aeration was switched on/off [h/d];
  • Aerobic/anoxic time per day: summed time per day during which the O2 concentration was >/<0.1 mg/L [h/d].

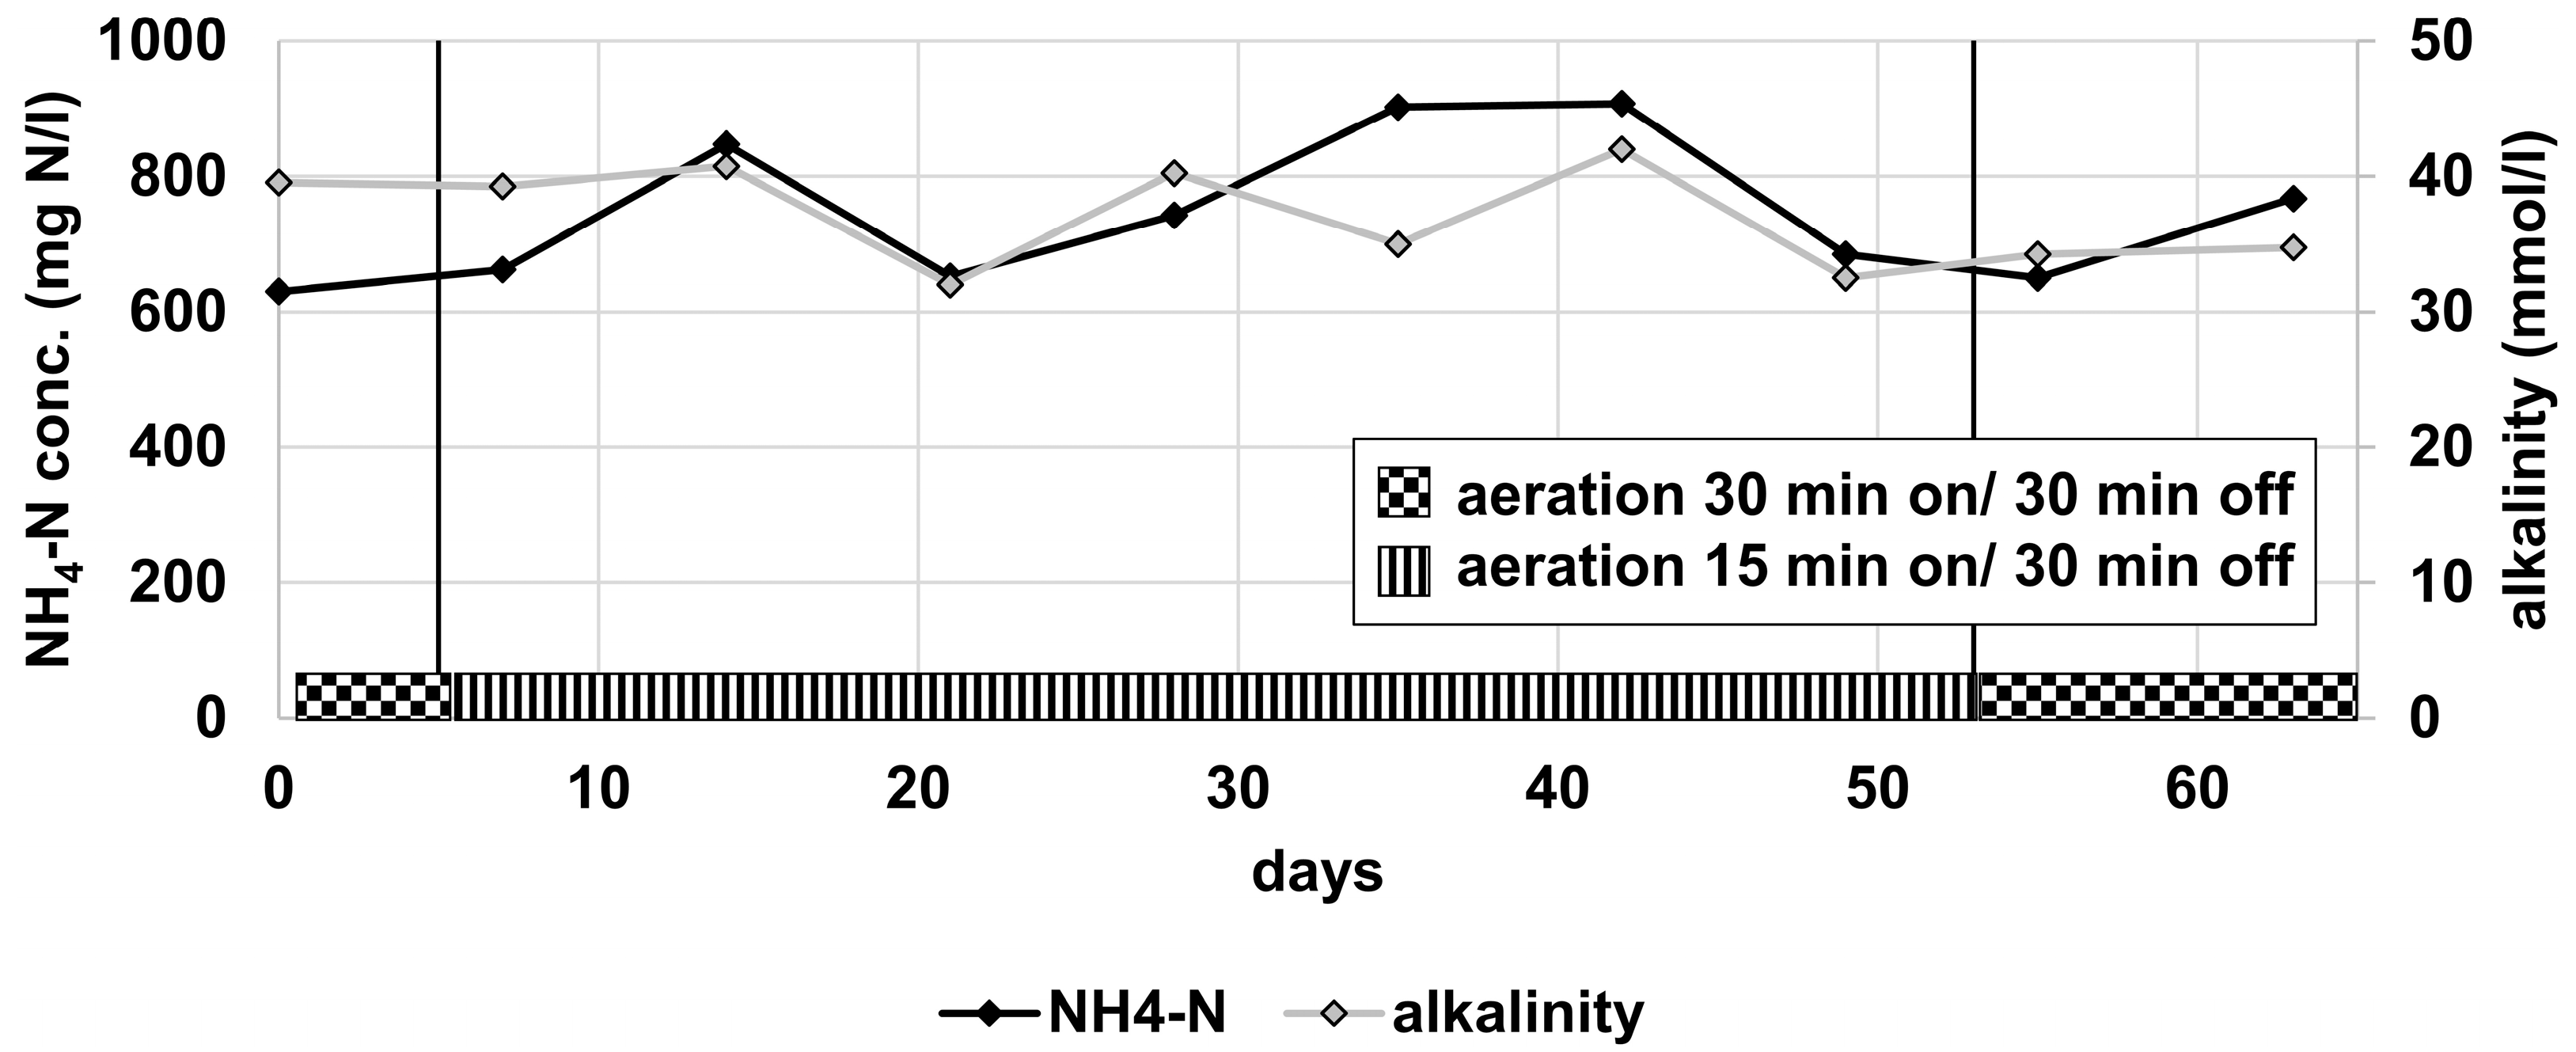
2.2. Pilot Plant Description and Measurement

For this modeling study, the measurement data of a pilot plant were employed. The main characteristics are summarized below:
  • Two-step deammonification in two covered biofilm reactors arranged in a series (the biomass content of the bulk phase was negligible);
  • Volume per reactor: 220 L working volume, 10 L headspace;
  • Textile biofilm carriers (Cleartec® BioCurlz, Jäger, Hannover, Germany) providing a theoretical surface for biofilm growth of 141 m² per reactor;
  • Intermittent aeration in the nitritation reactor (constant air volume flow, O2 concentration in the bulk phase > 4 mg/L during the aerated phase) to suppress the activity of nitrite-oxidizing bacteria (NOB); no aeration in the second reactor (Anammox).
In this study, only data from the nitritation reactor were considered since the focus was on investigating the influence of different aeration strategies on N2O emissions. For comparison, an additional nitritation reactor (220 L working volume) was operated as an SBR with intermittent aeration and suspended biomass. The SBR was continuously fed for 10 h (50 L/operation cycle and 100 L/d) with the same wastewater as the biofilm reactor. The filling phase was followed by a settling phase (1 h) and a decanting phase (1 h).
Both reactors were equipped with online temperature sensors (Endress–Hauser AG, Reinach, Switzerland), online pH sensors (Sensortechnik Meinsberg, Waldheim, Germany), and online O2 sensors (Hamilton, Reno, NV, USA). NH4-N, NO2-N, nitrate–nitrogen (NO3-N), alkalinity, total chemical oxygen demand (COD), and filtered chemical oxygen demand (CODfiltered) were determined weekly with cuvette tests (Hach Lange GmbH, Düsseldorf, Germany). N2O concentrations in the reactor (liquid phase) and the off-gas (gas phase) were measured with N2O microsensors (Unisense A/S, Aarhus, Denmark) several times over periods of multiple days.
For the comparison of the technologies presented here, the operational data of the SBR over a period of 65 days were used as the baseline scenario (see Figure 1). This period was selected because several boundary conditions were fulfilled, allowing the reliable calculation of nitrogen conversion rates and N2O formation and emission rates:
  • Stable nitritation;
  • No operational disturbances;
  • Long N2O measurement campaign.
The baseline SBR scenario was characterized by an average NH4-N conversion of 25.5 g/d or 34% of inflowing NH4-N, limited by alkalinity. The converted NH4 was almost completely transformed into NO2 (>99%).

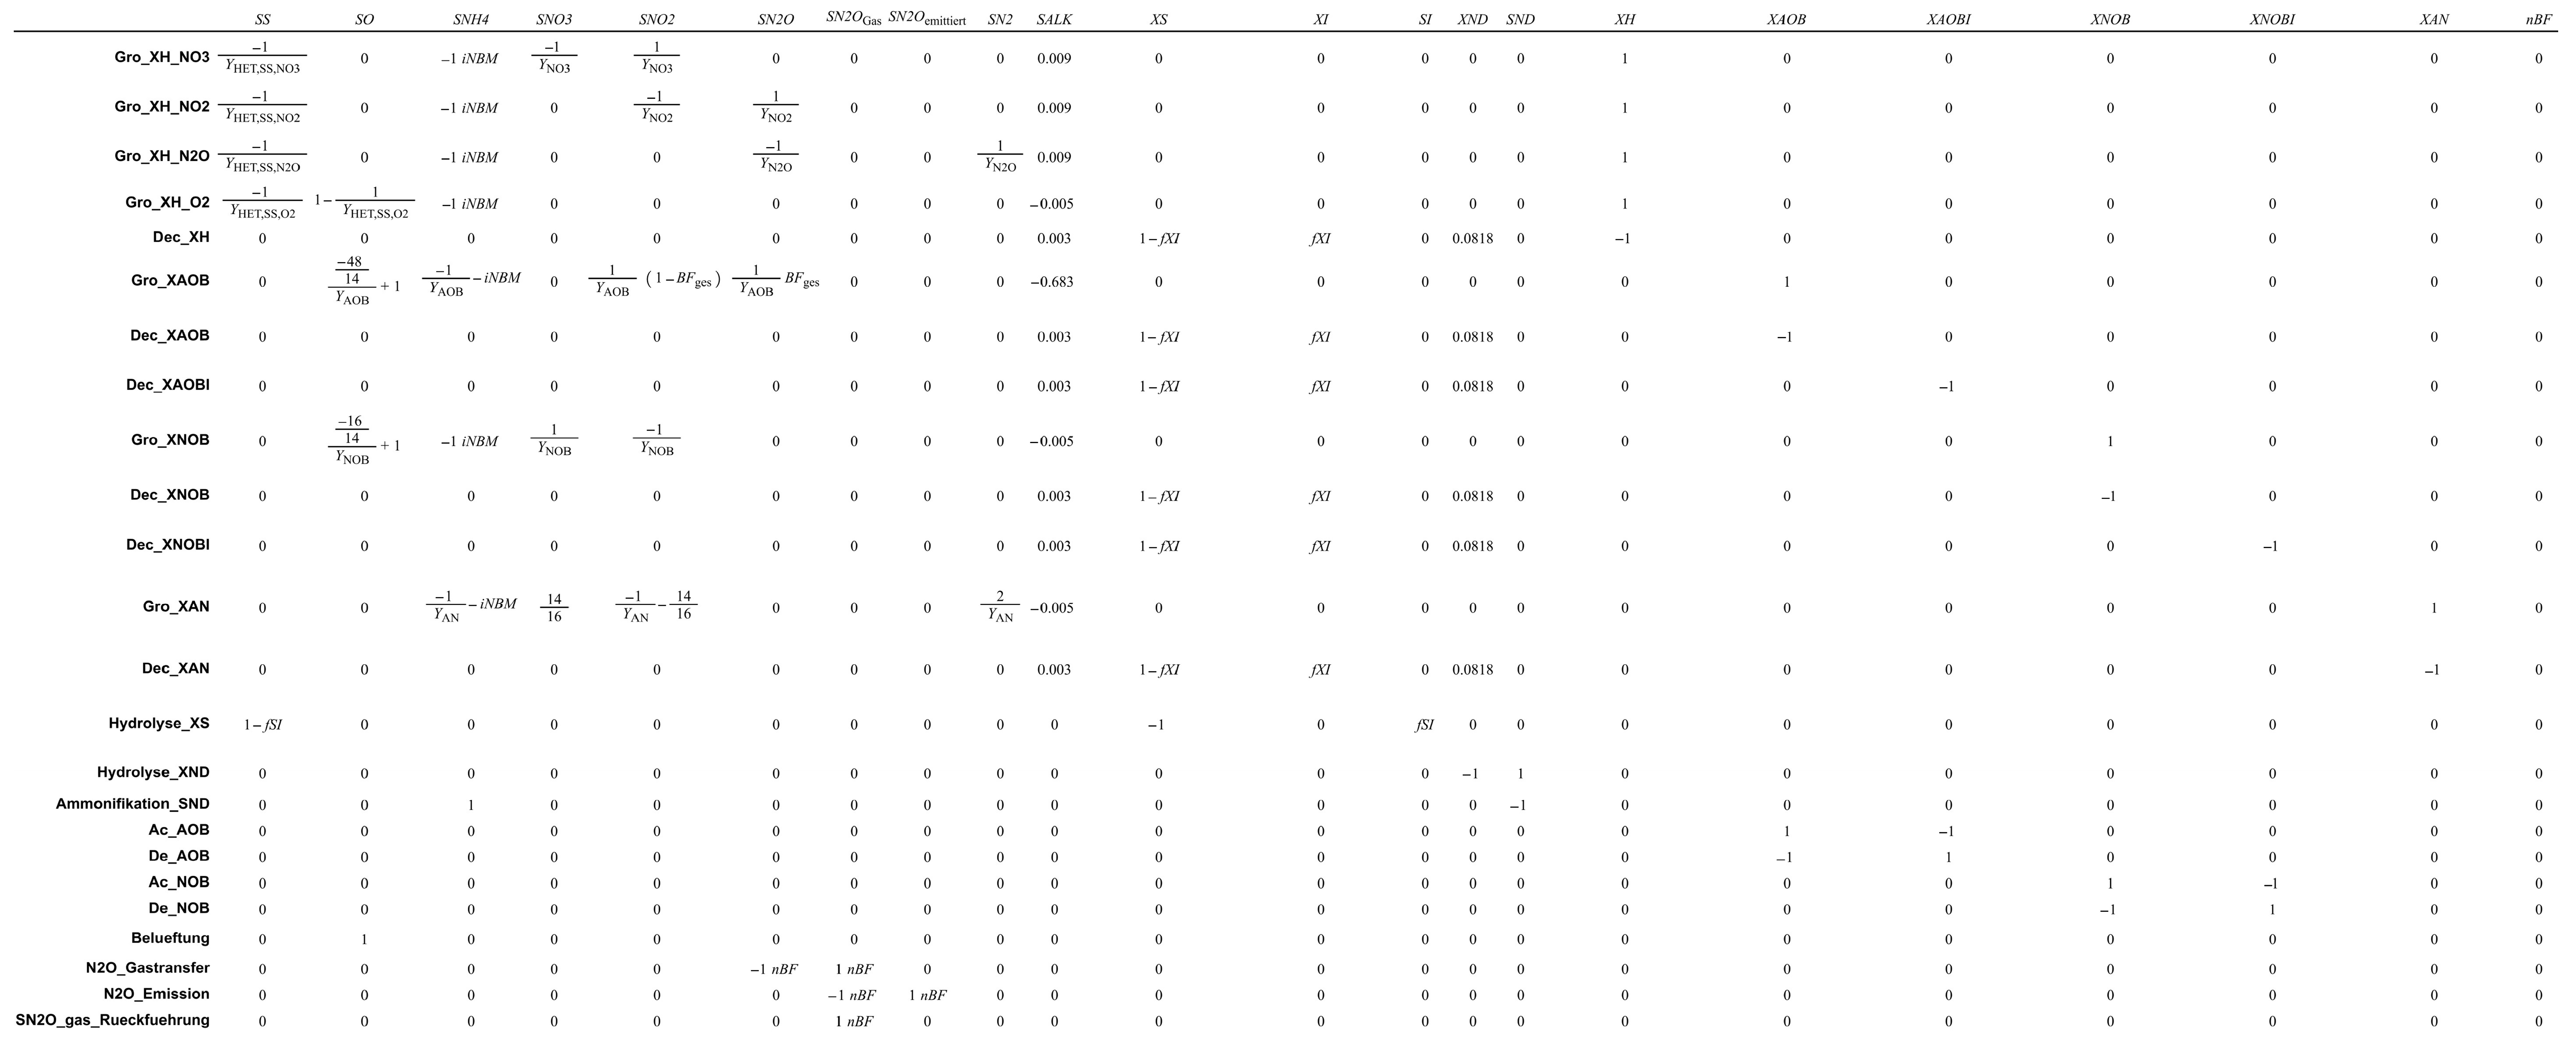
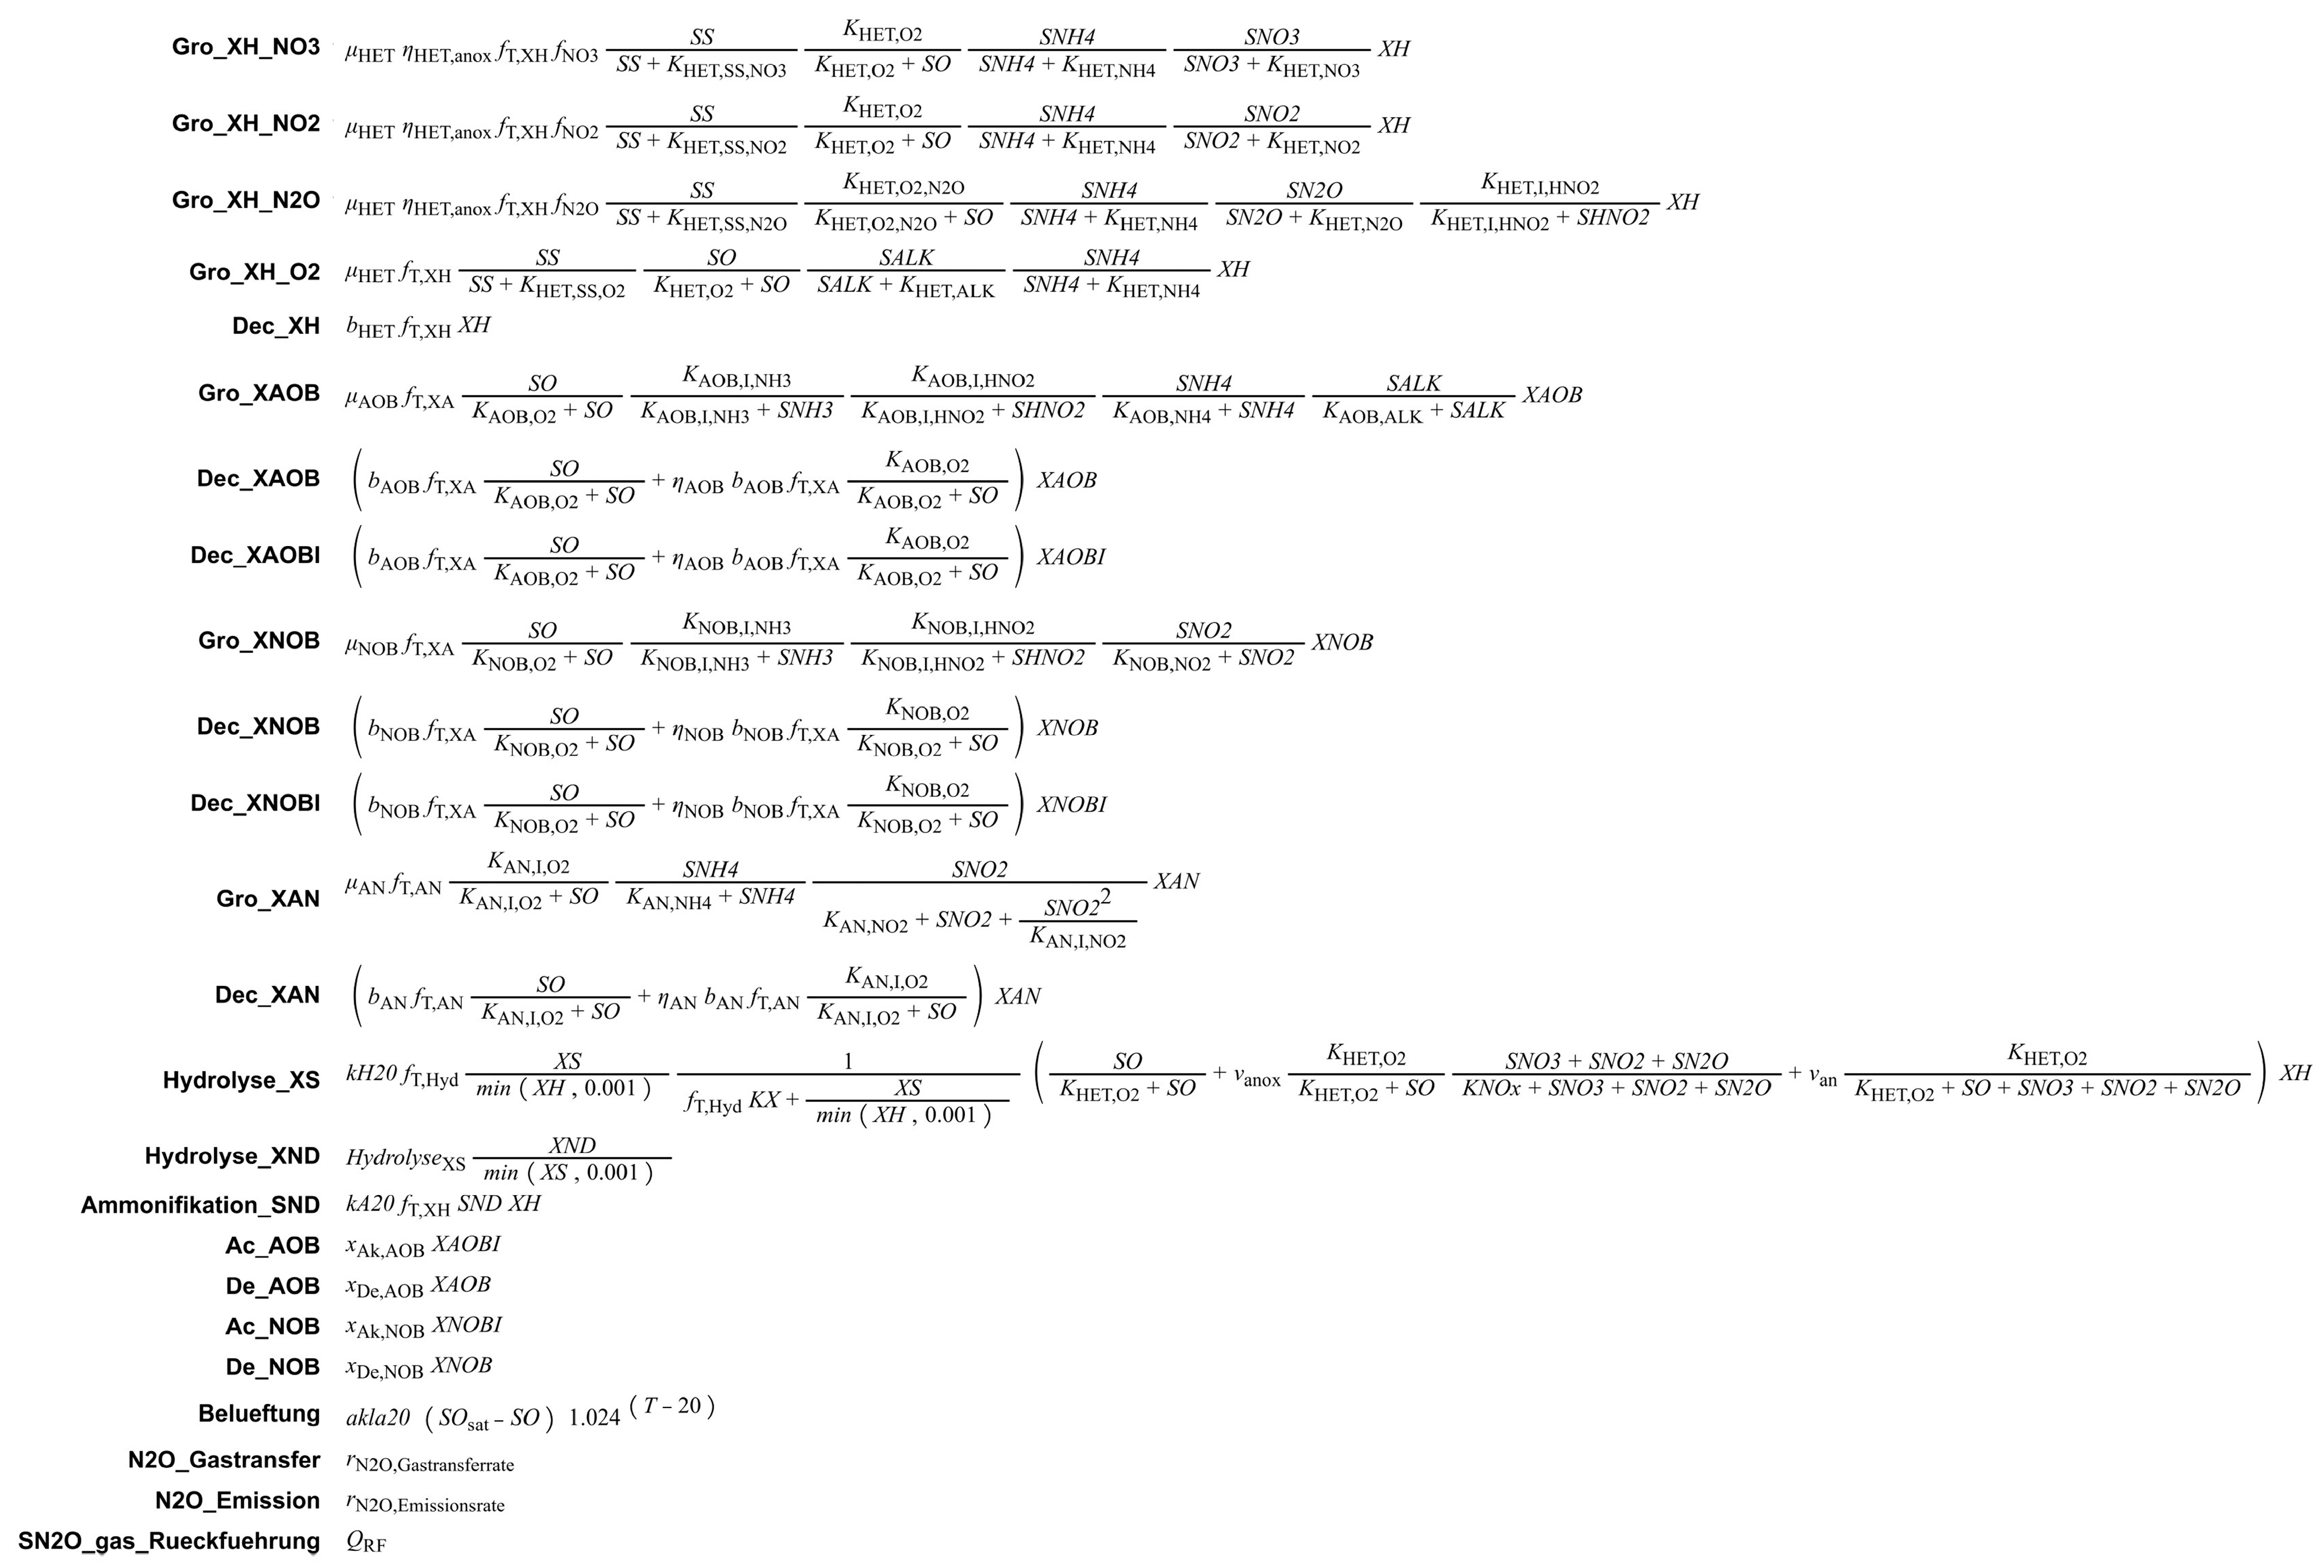
2.3. ASM and Biofilm Model

An extended ASM model developed by [23] and adapted for biofilm modeling by [20] was applied (provided here: [24]). The ASM model includes the following biological and physical processes (see Appendix A):
  • Aerobic carbon conversion;
  • Two-step nitrification (NH4-N → NO2-N → NO3-N);
  • Autotrophic N2O formation based on N2O formation factors calculated for each time step depending on the NH4-N conversion rate as well as the concentrations of O2 and NO2-N;
  • Three-step denitrification (NO3-N → NO2-N → N2O-N → N2-N);
  • Anaerobic ammonium oxidation;
  • Hydrolysis and ammonification;
  • Growth and decay of AOB, NOB, HET, and AMX;
  • Aeration, described by O2 transfer rate (g/m³N/m) and air volume flow (m³/h);
  • Activation and deactivation of AOB and NOB depending on alternating aerobic and anoxic phases;
  • N2O gas transfer and emission.
For biofilm modeling, a one-dimensional approach was selected (the biofilm thickness was calculated dynamically for each simulation step depending on the biomass growth as well as the attachment and detachment rates). The biofilm was divided into four completely mixed layers that interacted with each other through diffusion processes.
During the pilot plant operation, anammox microorganisms started to establish in the biofilm nitritation reactor with ongoing operation, as described in [20]. In this study, however, the anammox activity was set to zero in the simulations to ensure the comparability of both reactors. Otherwise, the NO2 concentration in the biofilm reactor would diminish over time, resulting in lower N2O formation factors and less inhibition of N2O denitrification by HNO2.

2.4. Calibration and Investigated Scenarios

The models were calibrated (target parameters: N2O concentration in the bulk phase, N2O emissions, NH4 conversion) using measurement data from the pilot plant operation. For the SBR, data from the investigated 65-day period were employed. The calibration of the biofilm model was described in [20]. Both reactor models were initially simulated with continuous aeration until a steady state (constant biomass concentration) was achieved. Starting from this steady state, the aeration was switched to intermittent (“30/30”), and simulations were performed until a stable ratio between active and inactive autotrophic biomass was established. These states served as the starting point for dynamic modeling.
In the baseline scenarios, the dynamic influent data and operational settings of the investigated 65-day period were applied to both calibrated models to ensure that both reactors were exposed to exactly the same operating conditions, allowing the direct comparison of the N2O formation and emission processes.
Subsequently, different scenarios were investigated to determine how the specific AOB activity could be reduced while maintaining the same reactor performance (N conversion) in order to diminish N2O formation by AOB. Considering the unit of the AOB activity (mg N/mg XAOB/d), the following approaches were identified:
  • An increase in the time available for aerobic N conversion by adapting the aeration cycle;
  • An increase in the AOB biomass in the reactor by increasing the biofilm volume or the TSS concentration.
  • A reduction in the N conversion peaks by equalizing the inflow (additional storage tank).
Following these approaches, the scenarios in Table 1 were investigated. In each step, the preferred settings determined in the previous step were used for the unchanged parameters (stepwise optimization).

3. Extension and Adaptation of the Basic Model

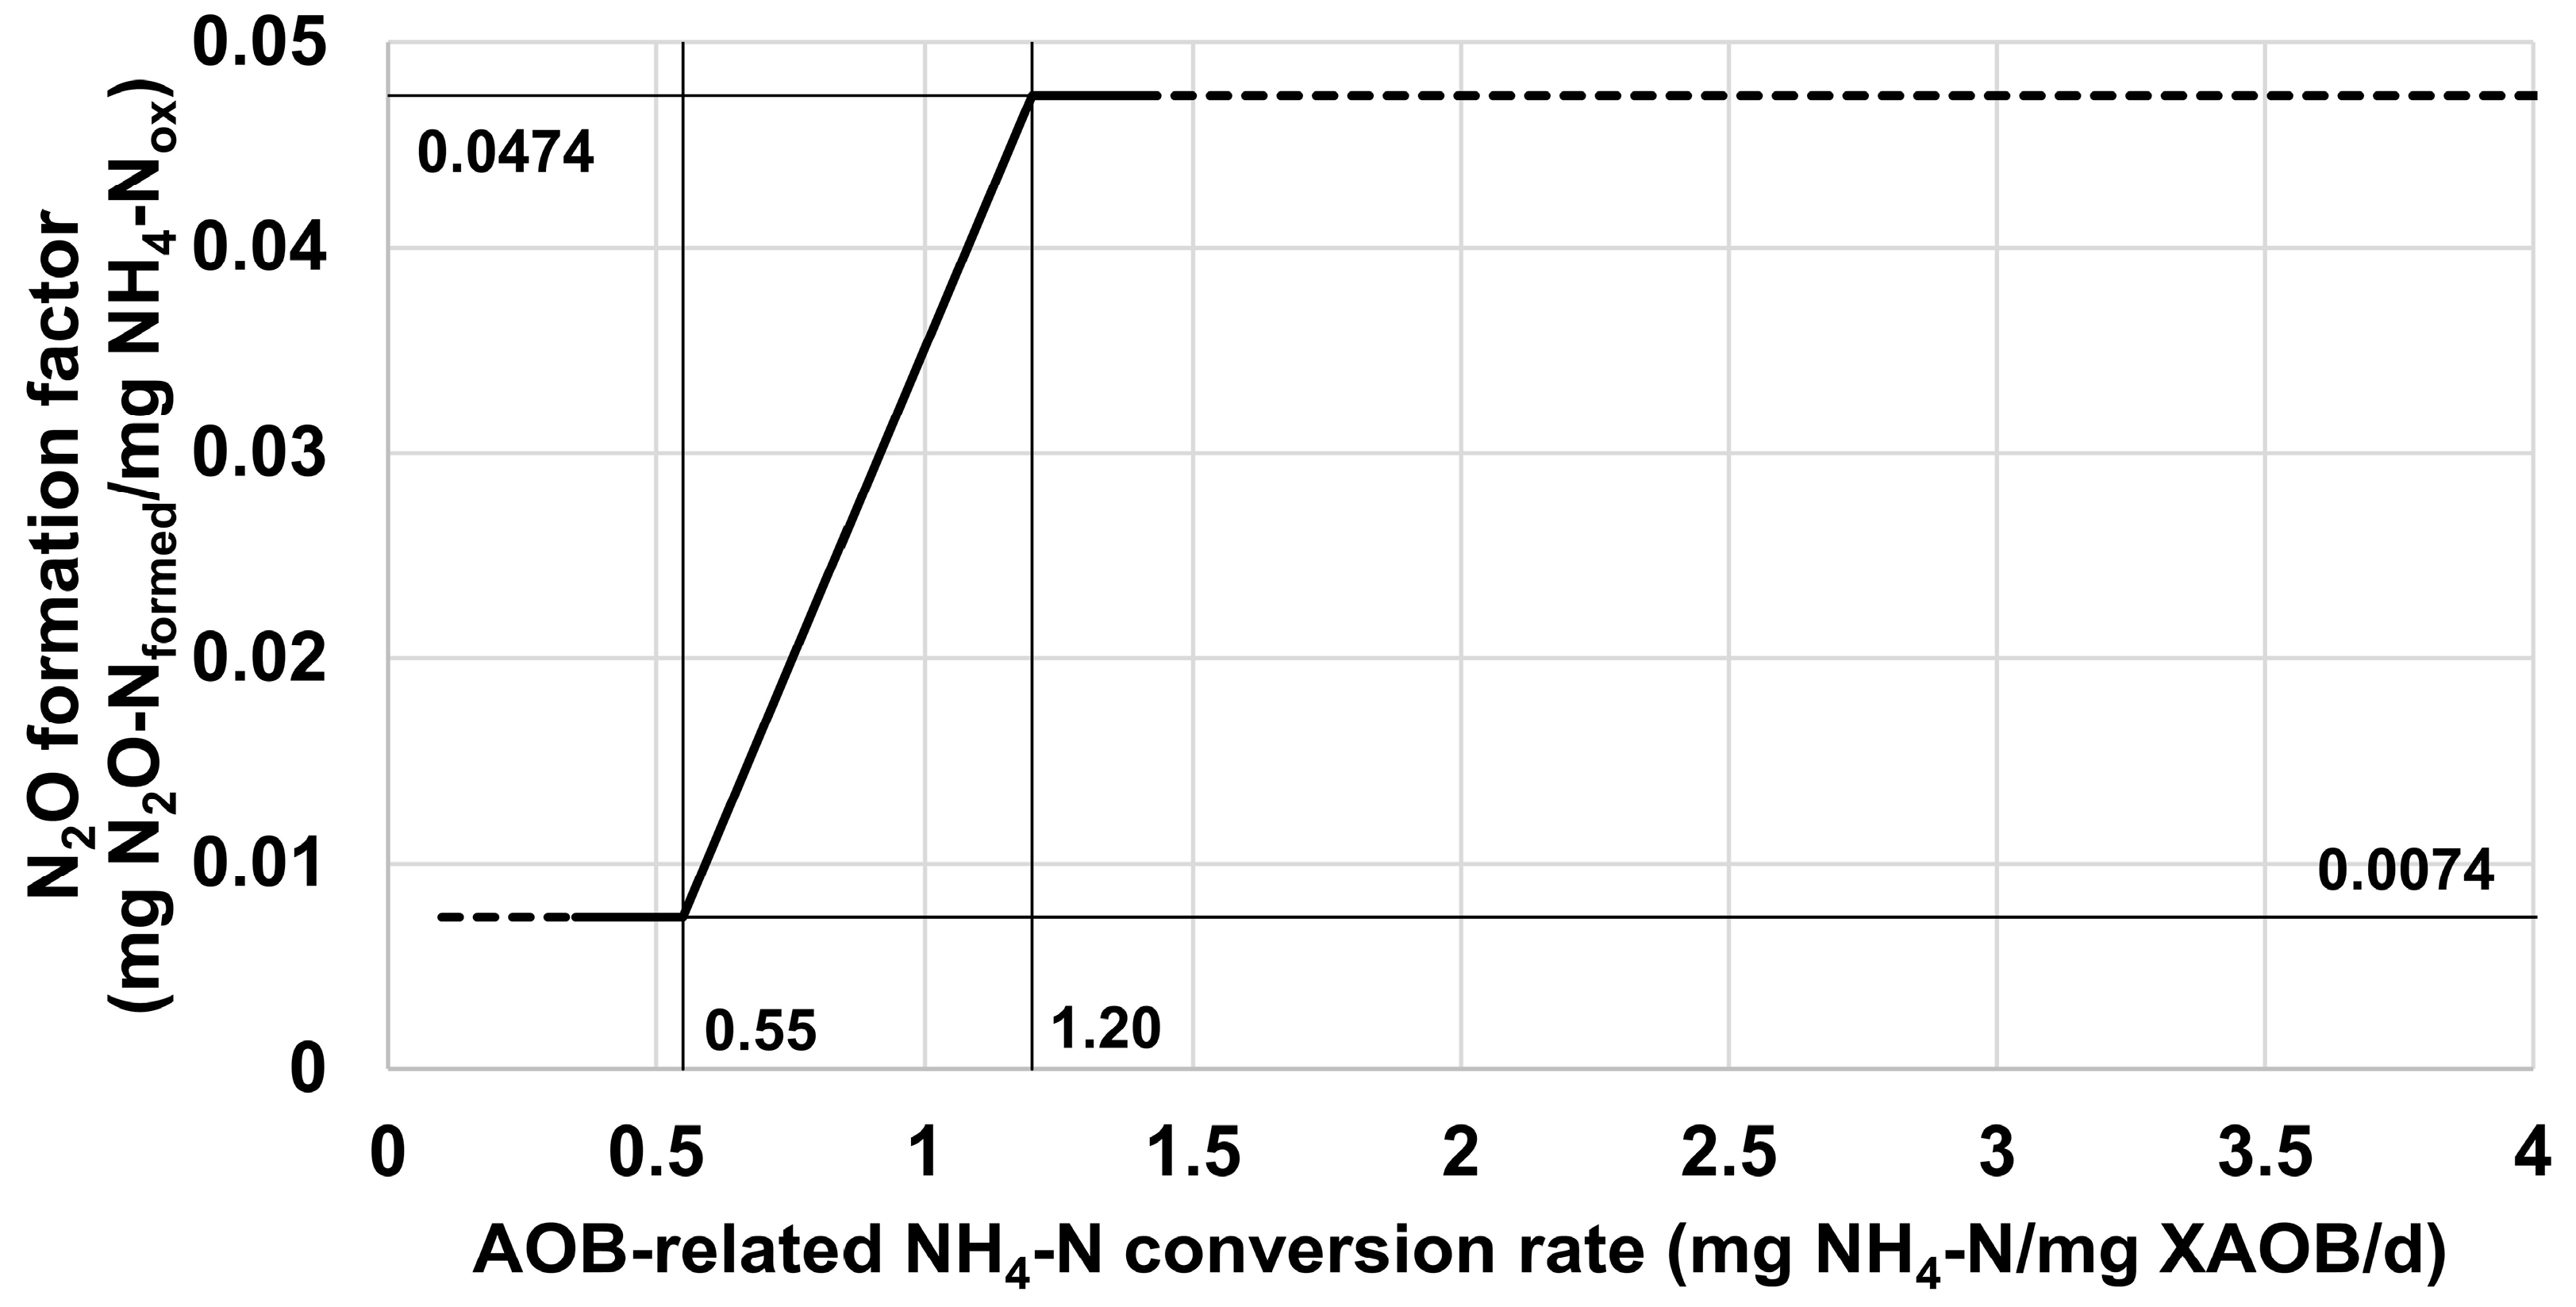
3.1. Approach for Calculating an N2O Formation Factor as a Function of AOB Activity

According to [23], N2O formation by AOB can be dynamically computed as a fraction of converted NH4, relying on N2O formation factors calculated by summing the influences of the volumetric NH4-N conversion rate (g N/m³/d) and the concentrations of NO2-N and O2. The volumetric NH4-N conversion rate is used as an indicator of the AOB activity. However, since the specific AOB activity does not depend on the reactor volume but rather the ratio of nitrogen load and converting biomass (g NH4-N/g AOBactive), the absolute mass of active AOB in the reactor or the biofilm section evaluated must be considered (e.g., [7,8]). It was decided not to select a VSS-related conversion rate because this parameter is mainly influenced by the growth of heterotrophic microorganisms. Instead, a new N2O formation factor considering the specific AOB activity was introduced to the model on the basis of the following assumptions:
  • At an upper threshold for the AOB-related NH4 conversion rate (g NH4-N/g XAOB/d), an N2O formation factor of 4.74% (determined for high-loaded systems by [16] was applied.
  • At a lower threshold for the AOB-related NH4 conversion rate (g NH4-N/g XAOB/d), an N2O formation factor of 0.74% (determined for low-loaded systems by [16] was applied.
  • Between these thresholds, the formation factor was calculated by linear interpolation. In addition, [7] and [8] determined a linear relationship between N2O formation and bacterial activity for common conversion rates in wastewater treatment.
The N2O formation factors related to the concentrations of NO2 and O2 do not need to be changed since these parameters are neither variable over the biofilm depth nor dependent on the load situation. The new approach can be used to simulate the effects of a variable AOB activity on N2O formation and to implement model-based control algorithms to minimize N2O emissions.

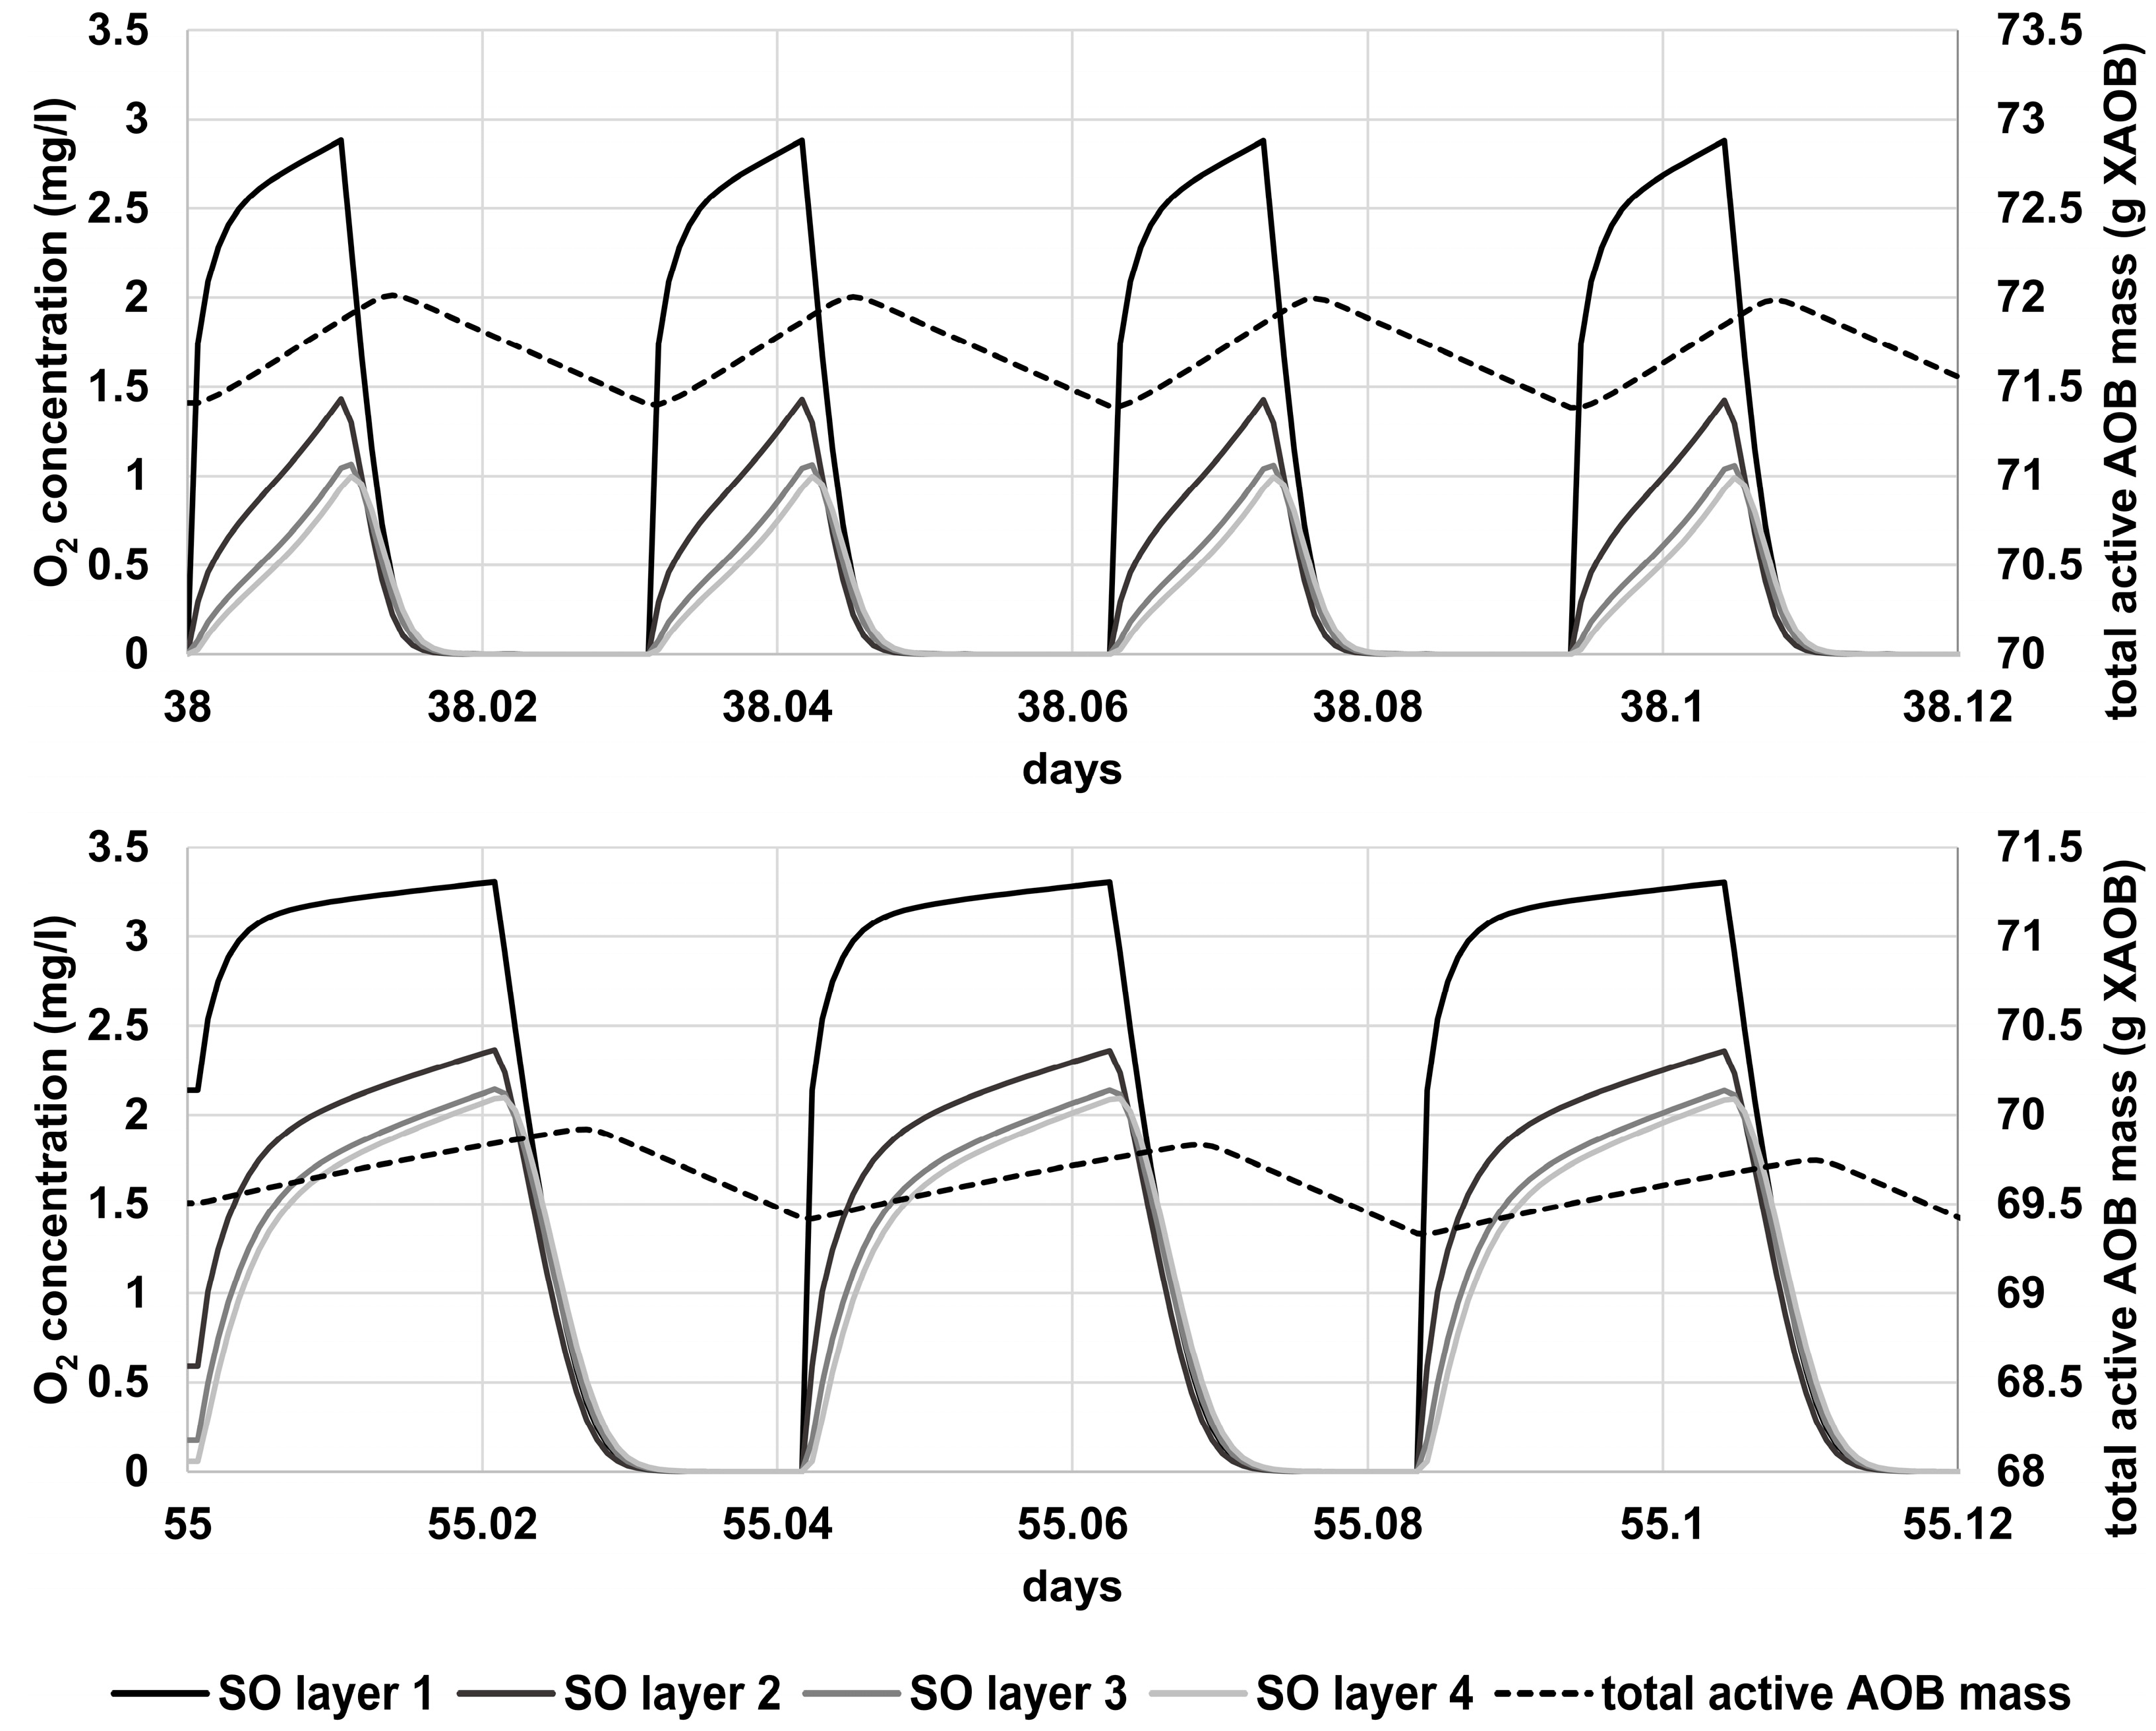
3.2. Model-Based Determination of the Thresholds for the AOB-Related NH4 Conversion Rate

Since the thresholds for the AOB-related NH4 conversion rate are difficult to determine by measurement (the AOB mass in the system must be known), an approximation was made by a simplified ASM model for autotrophic metabolism instead.
For the upper threshold, the maximum achievable NH4 conversion rate under the expected site-specific mean boundary conditions (availability of NH4, O2, and alkalinity; inhibition by NH3 and HNO2; and temperature) was applied. This rate was calculated by decreasing the AOB content of the reactor until the minimum AOB biomass required for the desired N conversion was reached. The lower threshold corresponded to the NH4 conversion rate that occurs under standard mainstream wastewater treatment conditions.
According to these results, the relationship depicted in Figure 2 was derived.
As shown in the next section, the developed approach can be applied to depict the N2O formation of the investigated pilot plant. For other applications, a site-specific adjustment of at least the upper threshold for the AOB-related NH4 conversion rate is necessary.
The implementation of the formation function in combination with the currently calculated active AOB biomass allows a dynamic description of N2O formation, e.g., under changing oxygen penetration depths in biofilms. This model extension is a key tool for the design of aeration control in biofilm systems, as investigated in the following section, since the AOB activity directly depends on the local O2 concentration, and increasing or decreasing conversion rates influence the N2O formation.

4. Scenario Analysis and Discussion of the Results Regarding the Optimal Control Strategy

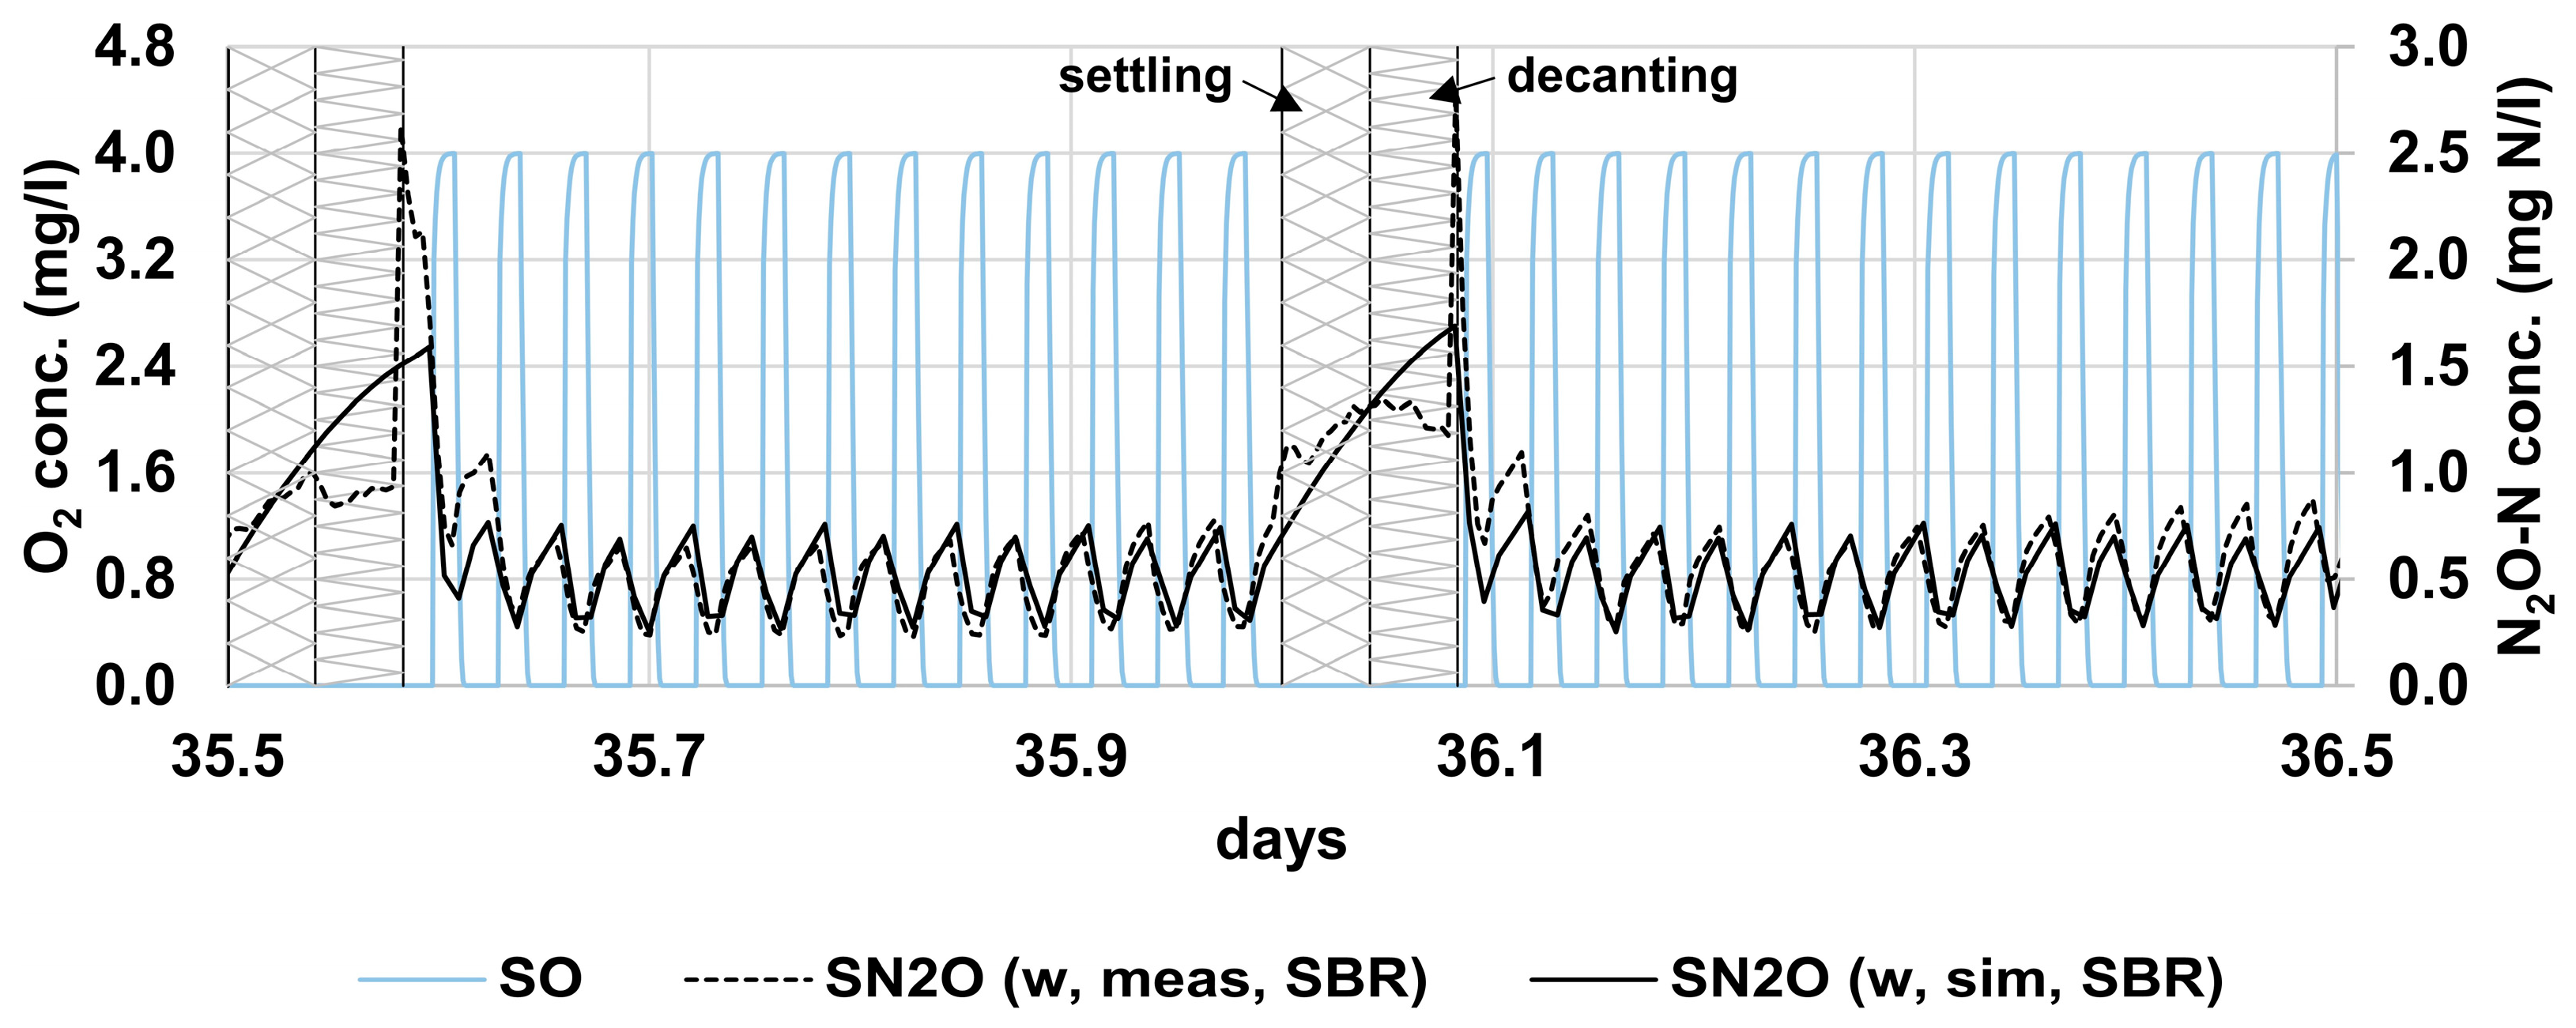
4.1. Baseline Scenario SBR

Figure 3 shows the measured and simulated N2O concentrations in the liquid phase. Due to stripping, a strong decrease in the N2O concentration was observed in the aerated phase (measurement and simulation), indicating that the stripping rate was higher than the net N2O formation rate. During the aerated phase, a relatively constant (over the period analyzed) N2O formation factor of approximately 6.7% of converted NH4 was calculated. A significant reduction in the formation factor (formation factor = 3.3% at the end of the working phase, when the concentration of active AOB biomass was at its highest) could only be observed between day 53 and day 60. In this period, a longer aerated time per day (10 h/d) coincided with a low influent load, resulting in a lower AOB-specific NH4-N conversion rate (see Figure 4) and thus a lower formation factor (see Figure 2).
In the unaerated phase, N2O was initially formed by AOB as long as sufficient O2 was still present (for approximately 5–8 min). At the end of this period, very high formation factors of close to 100% of converted NH4-N were observed due to O2 deficiency. Subsequently, a change in the slope (Figure 3) marked the point in time at which the residual O2 was completely consumed (no remaining AOB activity), and N2O formation was attributed to the activity of HET using the carbon contained in the influent as well as the carbon released during the decay of the biomass. Since N2O reduction was almost completely inhibited due to the high HNO2 concentrations caused by the high NO2 concentrations and low pH, the denitrified NO2 was only reduced to N2O, but not to N2. Altogether, incomplete denitrification contributed 39.6% to the total N2O emissions (see Table 2).
During the settling and decanting phases, high N2O concentrations could also be traced back to incomplete NO2 denitrification. However, Figure 3 shows some differences between the measured and simulated concentrations. This could be attributed to the formation of a vertical N2O concentration profile after the stirrer was switched off due to the sinking of the biomass into the lower part of the reactor (N2O was measured in the upper part of the reactor). When the aeration and stirring were switched on, complete mixing was achieved again, and the N2O formed was evenly distributed in the reactor (confirmed by measurements). This effect is not represented in the model (CSTR), so a higher N2O concentration was computed.
The total emitted load was calculated on the basis of the off-gas measurements (Figure 4). Here, very similar results were obtained via measurement and simulation. In total, 253.9 g of N2O-N was emitted during the investigated period of 65 days (N2O measurement period: measured 39.3 g of N2O-N/8.94 d, simulated 39.6 g of N2O-N/8.94 d), resulting in an emission factor of 15.3% of converted NH4-N (see Table 2). Altogether, the results confirm that the digital model can adequately simulate the processes of N2O formation and emission as well as the nitrogen conversion of the investigated plant.

4.2. Baseline Scenario Biofilm Reactor

The dynamic influent data and operational settings of the investigated 65-day period were applied to the calibrated biofilm model. The modeling outcomes showed that due to high O2 concentrations in the bulk phase and alkalinity-limited NH4 conversion, aerobic conditions were established in all biofilm layers during the aerated phase (average biofilm thickness = 1.2 mm). The O2 concentrations reached in the different biofilm layers (2.6–3.3 mg/L in the outermost biofilm layer, 0.3–2.6 mg/L in the innermost biofilm layer) depended on the load situation and the duration of the aerated phase (15 or 30 min, see Figure 5). Nevertheless, the AOB were mainly active in the first and second layers (together > 90% of the total AOB activity).
The different O2 concentrations resulted in varying N2O formation factors over the biofilm layers; the lowest formation factors were achieved in the outermost biofilm layer. Here, a basic formation factor of approximately 7% was determined during the aerated phase, similar to that in the SBR. However, lower formation factors (2.8–7%) were achieved between days 0 and 5, 15 and 28, and 42 and 65 mainly due to a reduction in the AOB-specific NH4-N conversion rate (see Figure 4). In the second biofilm layer, formation factors varied between 2.8 and 9.7%. In total, the N2O load formed by AOB was about 40% lower than that in the SBR (see Table 2).
HET are responsible for 59.5% of total N2O emissions (see Table 2), implying that incomplete denitrification is the main N2O source. This is due to more heterotrophic biomass in the system compared with the SBR.
The total emissions were slightly (10%) lower in the biofilm system (227.3 g of N2O-N were emitted during the investigated period of 65 days, resulting in an emission factor of 13.5% of converted NH4-N). A significant decrease in N2O emissions was achieved between day 53 and day 65 due to the longer aeration interval (12 h/d) and the low influent load (see Figure 4).
As reported by [20], significantly higher N2O concentrations were observed in the biofilm than in the bulk phase when aeration was switched on. However, since there was no denitrification capacity, a reduction in N2O emissions could not be achieved. Instead, the N2O diffused into the bulk phase during the unaerated phase and was subsequently stripped at the beginning of the aerated phase.
In summary, N2O was formed not only by AOB but also by HET. In the biofilm reactor, denitrification was the main source. This implies that the impact on HET must also be considered when evaluating the measures investigated in the following scenarios. For the same N conversion, N2O formation by AOB was significantly lower in the biofilm system due to lower specific AOB activity.

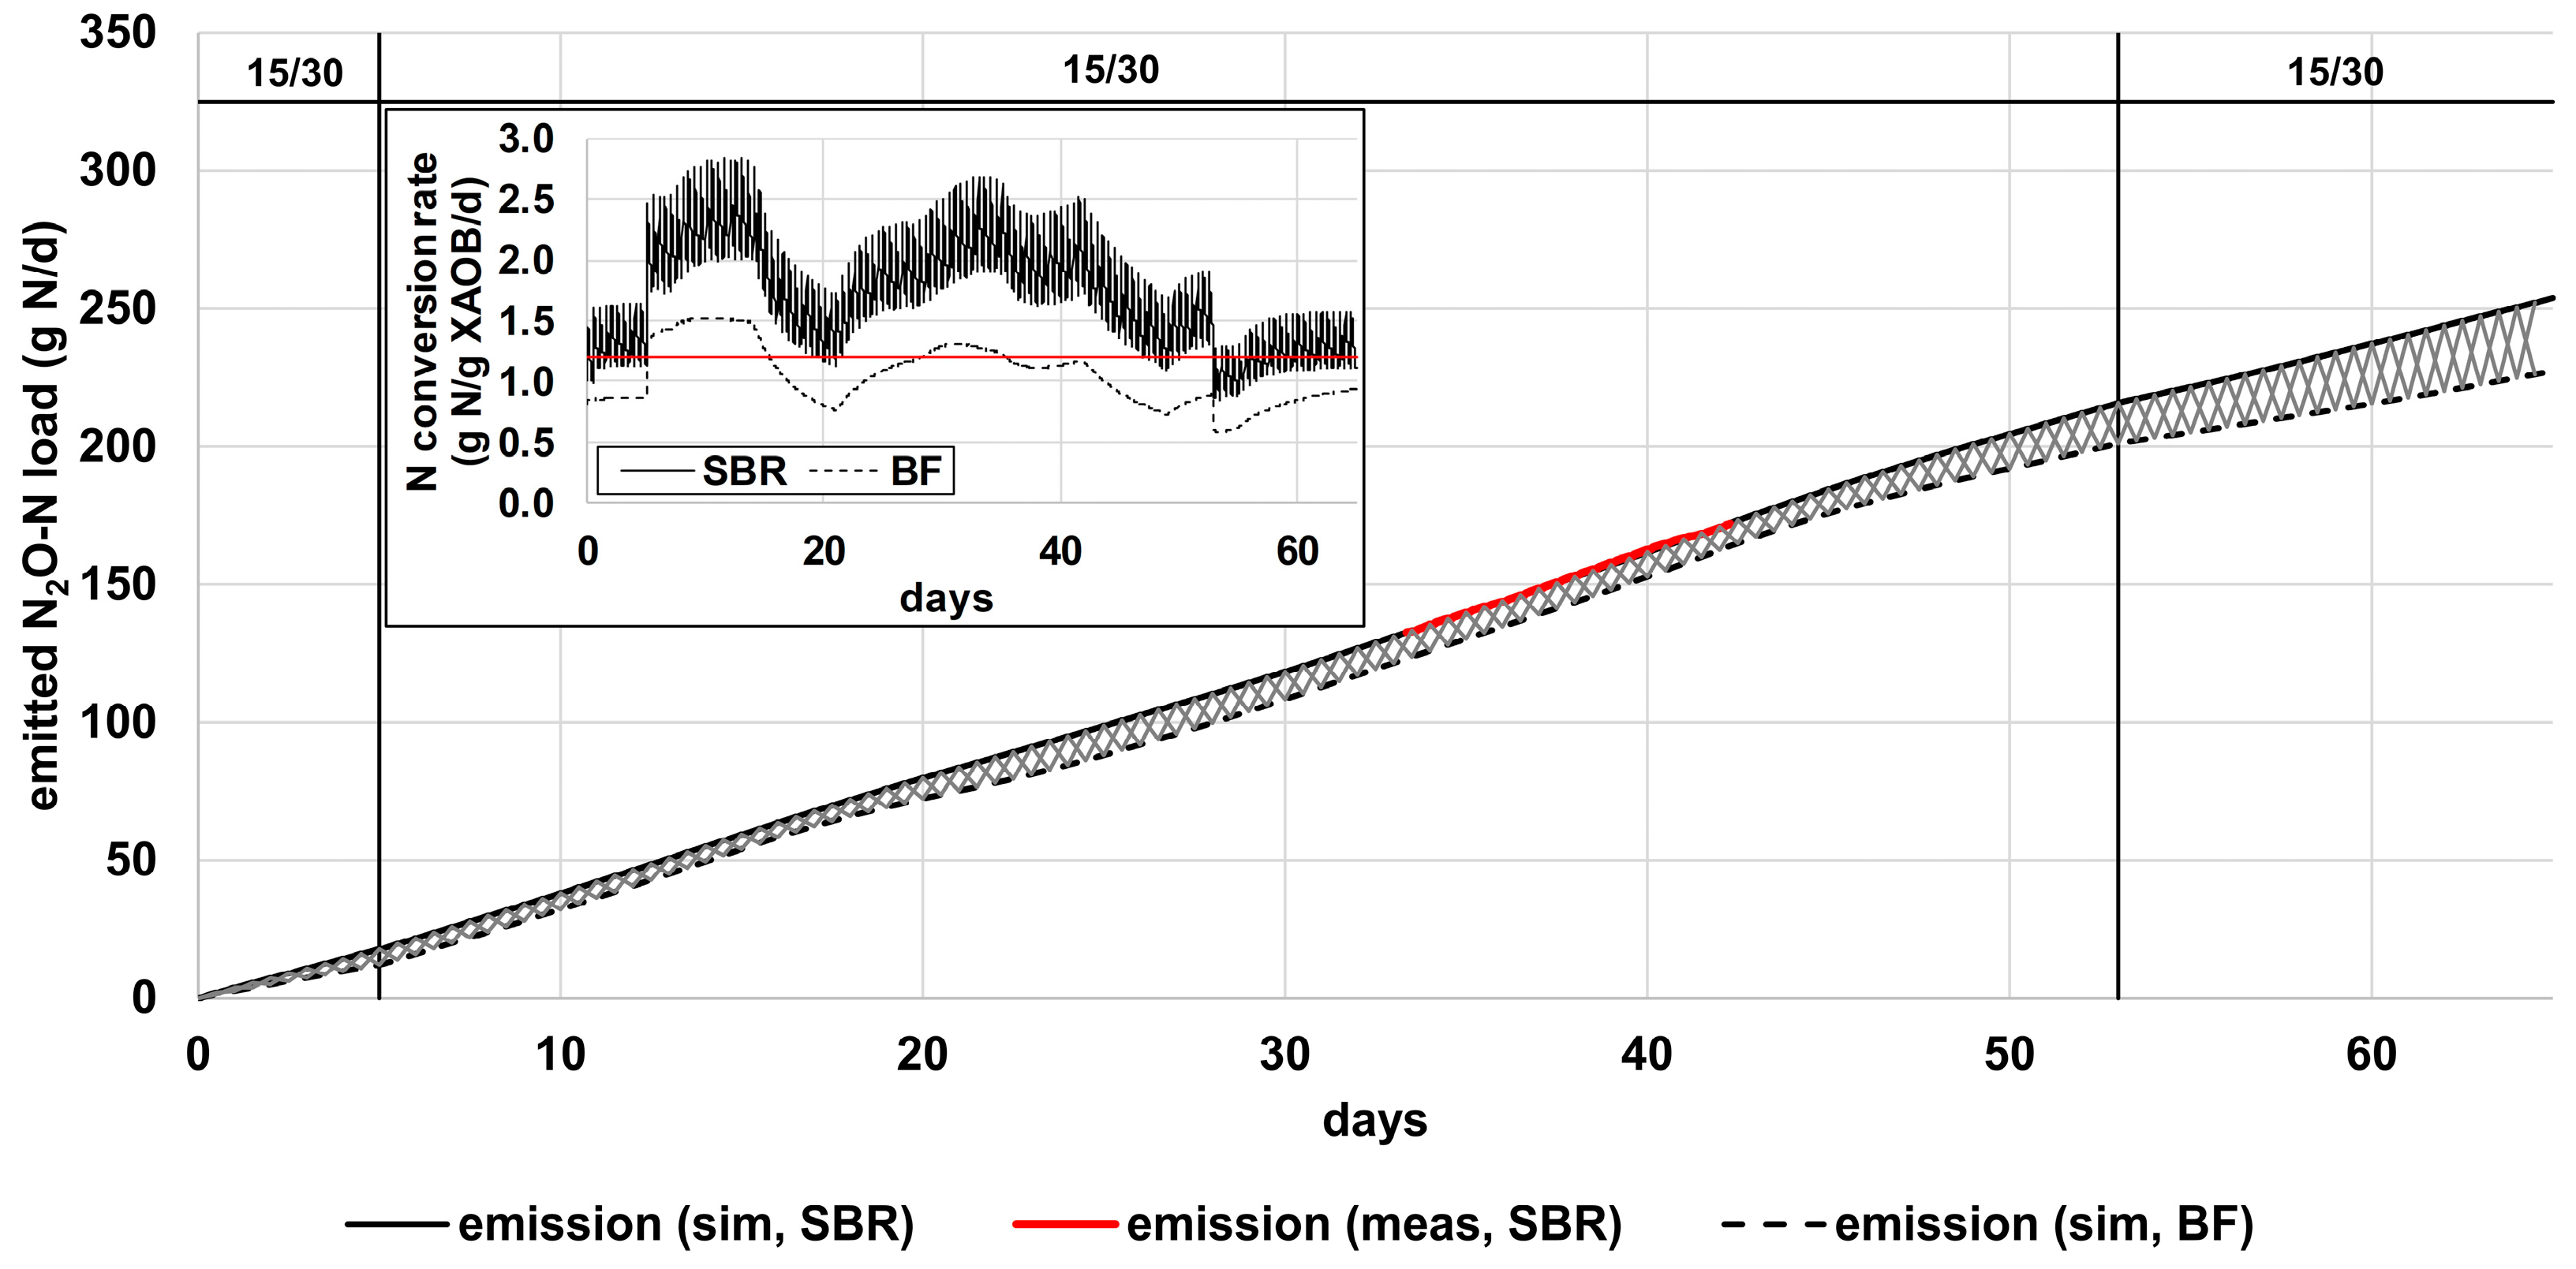
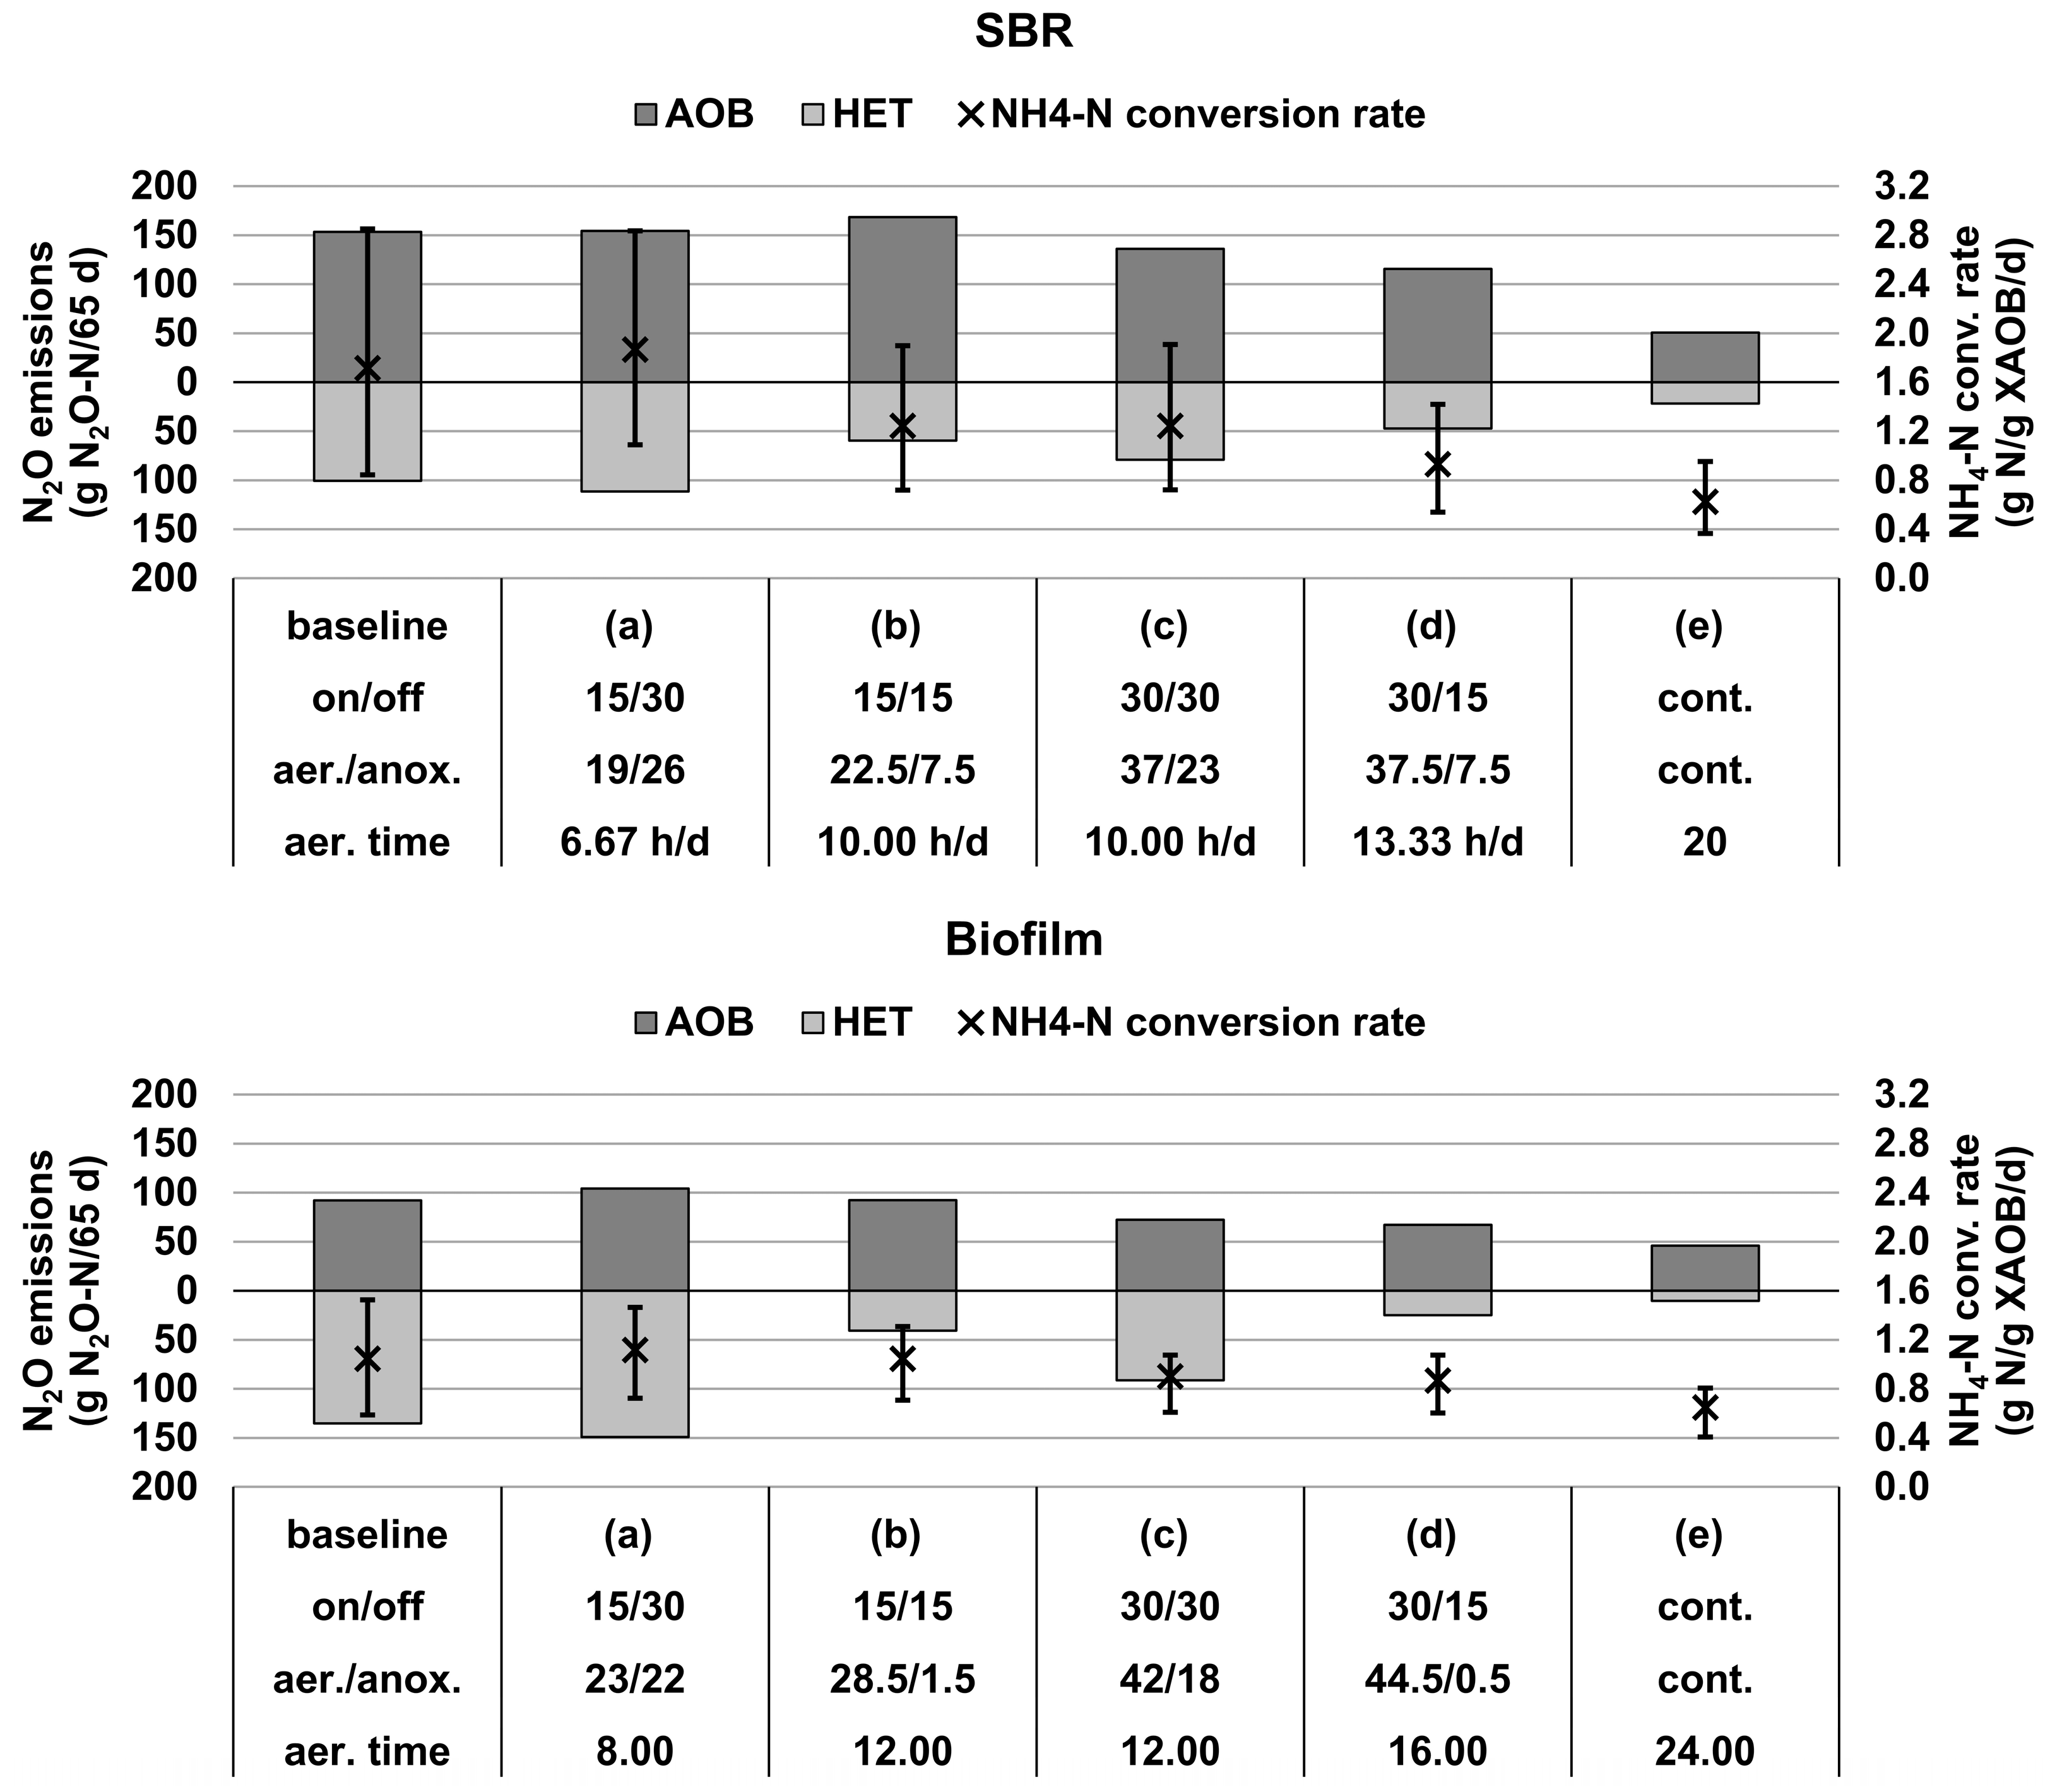
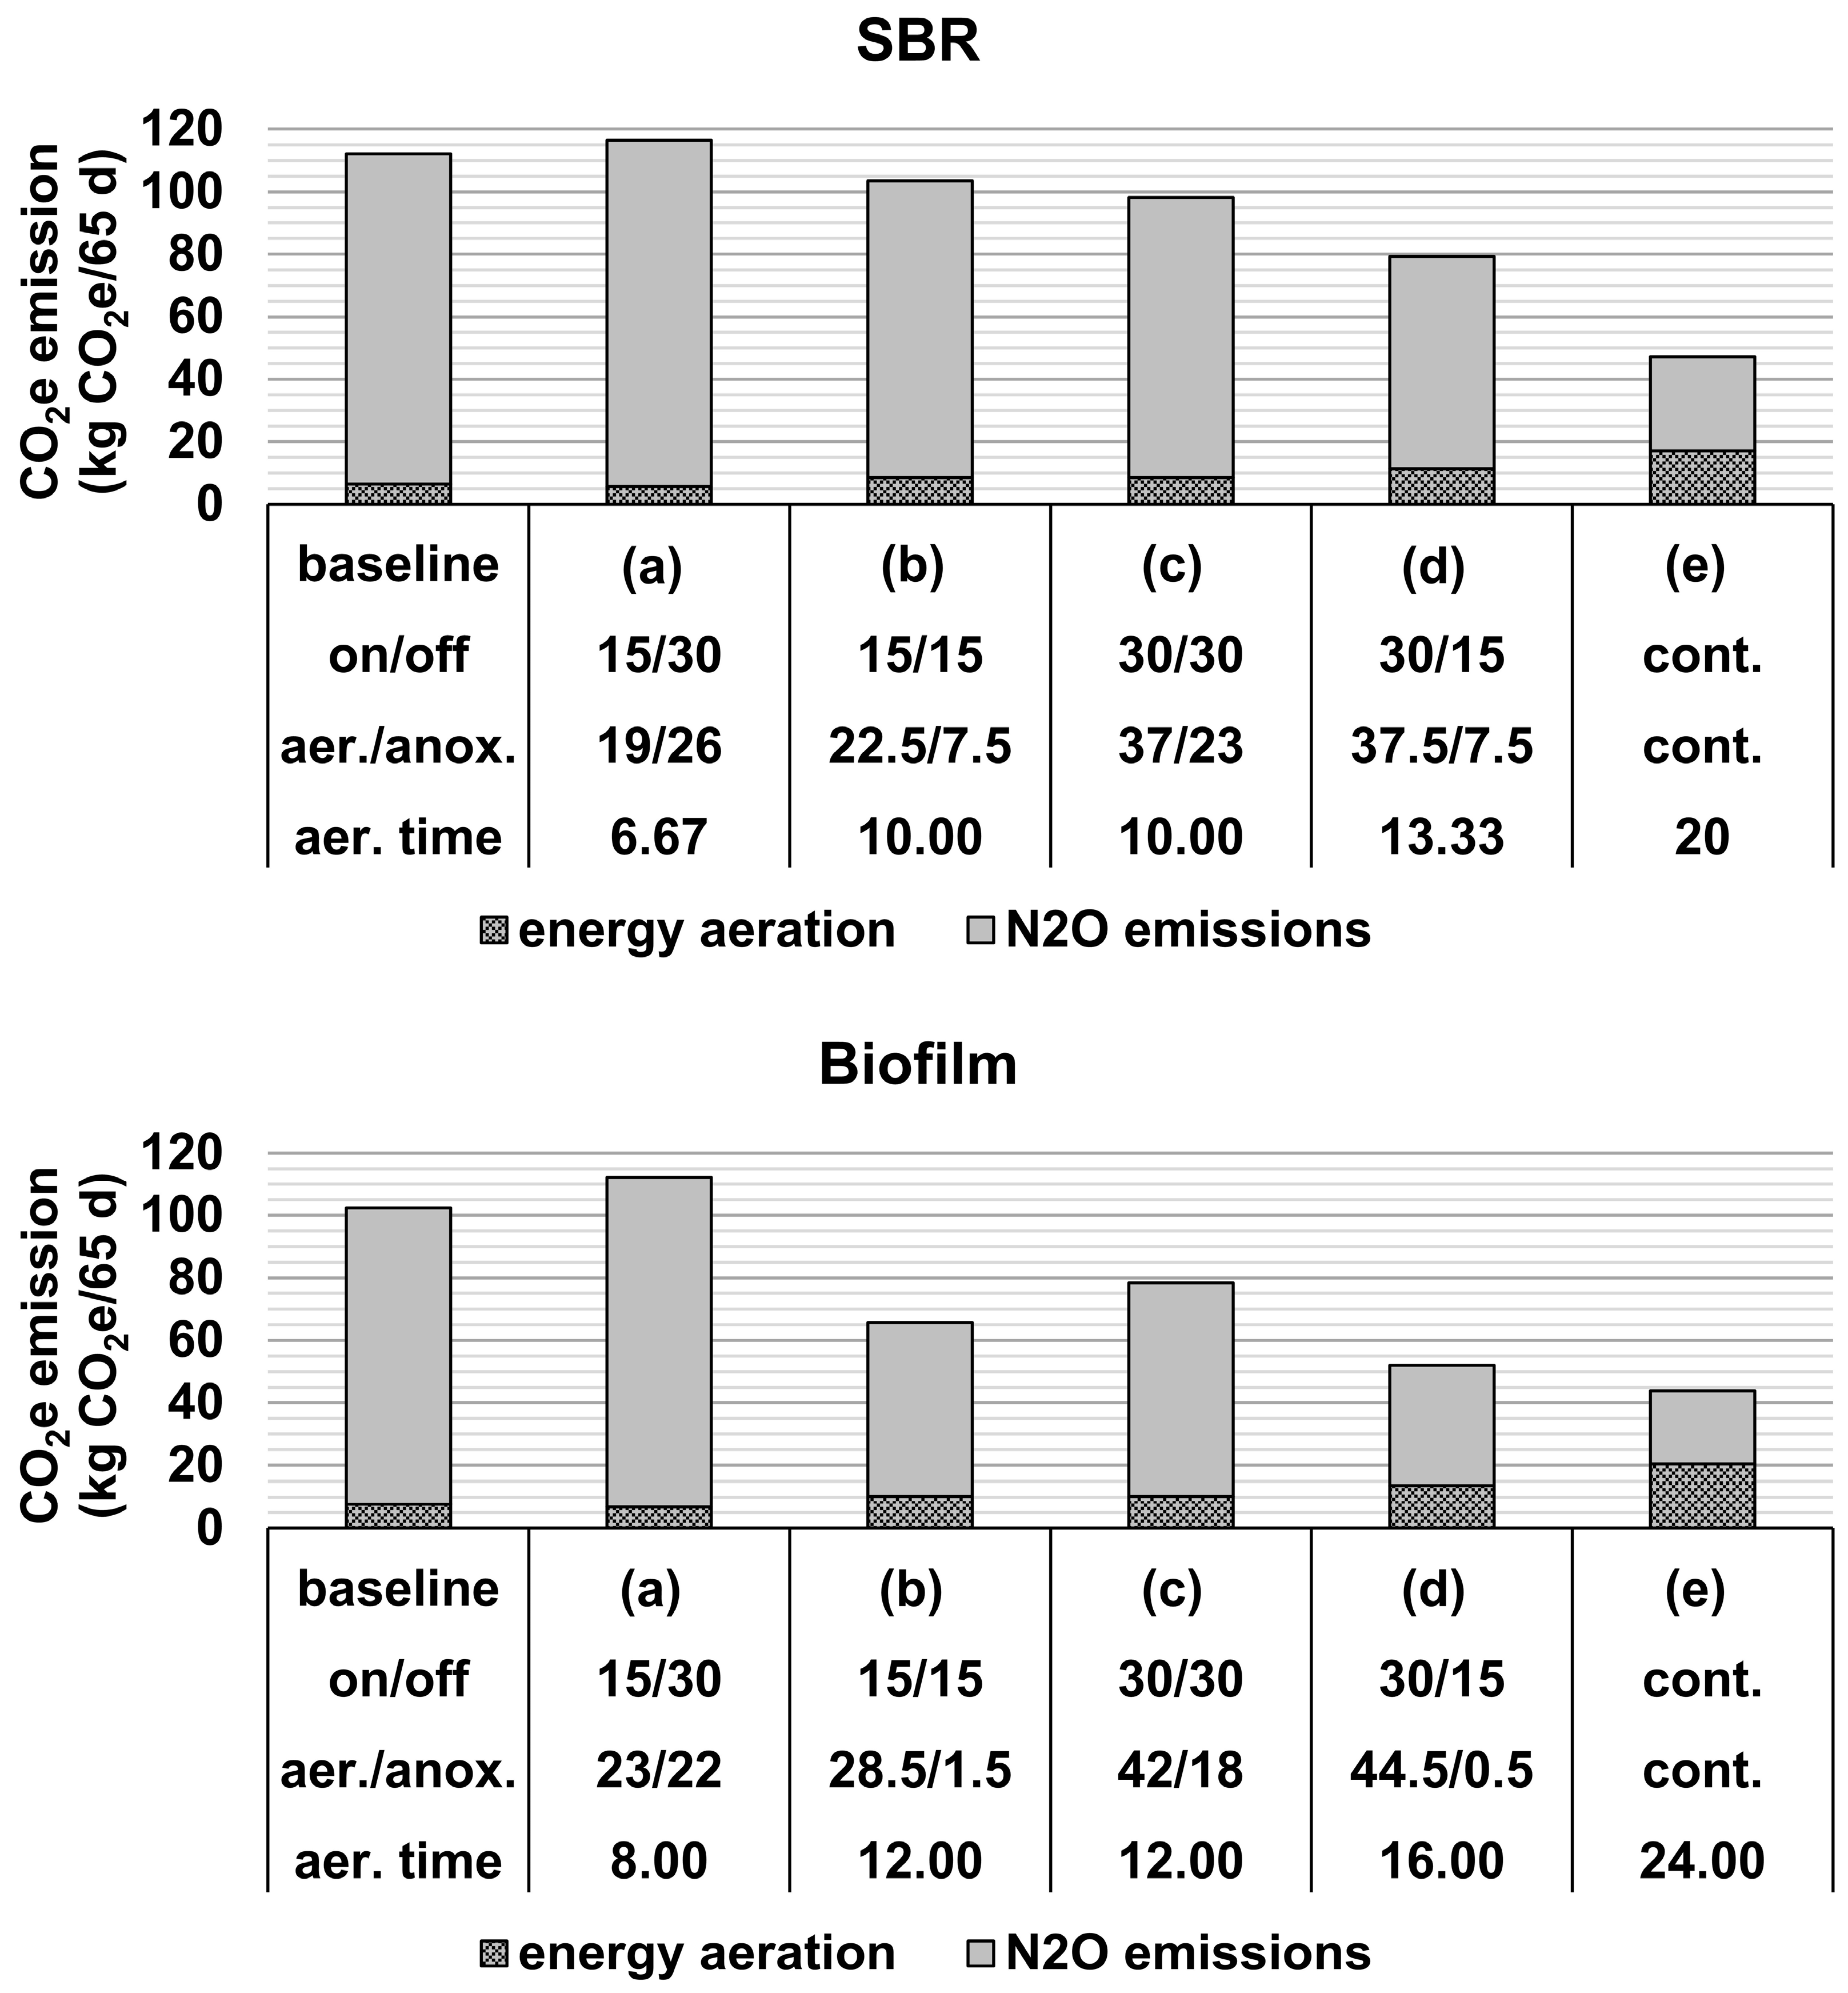
4.3. S1: Effect of Different Aeration Cycles

Figure 6 shows the emissions caused by AOB and HET over the investigated 65-day period (baseline) as well as the average AOB-related NH4-N conversion rate calculated for different aeration cycles. Moreover, the aerated time per day (h/d) is given. Due to the settling and decanting phases, a shorter aerated time per day resulted for the SBR reactor when the same aeration cycle was chosen.
Additionally, continuous aeration was tested. Since NOB suppression, in this case, could no longer be accomplished by alternating aerobic and anoxic intervals, NOB activity was manually set to zero to ensure comparable boundary conditions.
The results confirmed that the higher the aerated time per day, the lower the AOB-related NH4-N conversion rate. Accordingly, since N2O formation is coupled with the AOB-related NH4-N conversion rate, a strong decrease in N2O emissions caused by AOB could be observed for a longer aerated time per day (exception: “15/15” in SBR). Furthermore, as increased N2O formation by AOB was observed at the beginning of the anoxic phase, a low number of aeration cycles also has a positive effect (see aeration cycles “15/15” and “30/30” in Figure 6).
Higher fluctuations of the NH4-N conversion rate were found in the SBR. This was related to a lower fluctuation of the total active biomass in the system. In the SBR reactor, the biomass was directly coupled to the influent (the influent contained microorganisms); in addition, biomass was withdrawn during the decanting phase. Both effects influenced the steady-state biomass concentration. As a consequence, the AOB-related NH4-N conversion rate was mainly influenced by the aerated time per day (the converted NH4-load and biomass concentration were constant). In the biofilm reactor, the fluctuations in the AOB-related NH4-N conversion rate were much less pronounced and generally much lower than those in the SBR. Already in the baseline scenario, the conversion rates below the upper threshold for the determination of the N2O emission factor were calculated. This was due to the possibility of maintaining a higher AOB mass, especially in high-load/stress situations (e.g., aeration cycle “15/30”: 49.5 g of AOB in the SBR and 69.9 g of AOB in the biofilm reactor) for a short period. With an increased aerated time per day, the AOB mass declined (e.g., aeration cycle “30/15”: 40 g of AOB in the biofilm reactor) because lower specific conversion rates were already sufficient for reaching the maximum NH4-N conversion achievable under the given boundary conditions. A high AOB mass can only be maintained long-term if repeating high-load situations occur.
As expected, HET contributed more to N2O emissions as the length of the anoxic phase increased. Since aerobic conditions still prevailed at the beginning of the unaerated phase, longer unaerated phases were associated with longer anoxic phases and higher levels of N2O formation. Thus, higher levels of N2O formation were observed in the two scenarios with a 30 min unaerated phase. Moreover, a lower number of aeration cycles was associated with increased N2O formation by HET, compensating for the decreased N2O formation by AOB in the biofilm reactor.
Summarizing the results described, the selection of the aeration cycle had different effects regarding N2O formation:
  • For a constant converted NH4-N load, longer aerobic phases resulted in a reduced specific AOB activity because there was more time for aerobic metabolism.
  • High N2O formation factors were calculated at the beginning of the unaerated phase due to low O2 concentrations. For that reason, a smaller number of aeration cycles diminished N2O formation (AOB were less frequently exposed to low O2 concentrations).
  • A smaller number of aeration cycles increased the N2O formation by HET due to prolonged anoxic phases.
Overall, therefore, an optimum must be found between longer aeration intervals to activate additional AOB biomass, shorter anoxic phases to avoid N2O formation by HET, and a minimized number of aeration cycles to avoid environments with low O2 concentrations. In addition, NOB suppression must continue to be ensured. In all scenarios, comparable N conversion was achieved because NH4 conversion was limited by the alkalinity.
Since the focus of the practical application is on minimizing the total direct and indirect CO2e emissions, the total emitted CO2e load (not only the emitted N2O load) is the target parameter for plant control. For this reason, Figure 7 summarizes the estimated CO2e emissions resulting from the release of N2O and the consumption of energy for aeration (other energy consumers are neglected since only the aeration settings were changed in this scenario). For the calculation of the CO2e emissions from energy consumption, the recent emission factor of the German energy mix (375 g CO2e/kWh) was employed. The results clearly showed that the N2O emissions avoided by the tested aeration strategies exceeded the emissions from the additional energy consumption by far (It must be emphasized that an experimental plant with high N2O emissions and relatively low energy consumption (good O2 transfer) was examined here, so these results are not directly transferable to large-scale plants.).
Altogether, for both systems, the simulations resulted in the lowest emissions for the aeration cycle “30/15”, not considering continuous aeration as an option. However, experience from pilot plant operations showed that sufficient suppression of NOB activity could not be achieved with a “30/10” aeration cycle, so problems can also be expected with the “30/15” aeration cycle. Therefore, an aeration cycle of “15/15” is recommended for the biofilm system, as this minimizes N2O formation by HET (the dominant N2O source). For the SBR, on the other hand, a “30/30” aeration cycle was selected as the preferred setting. The higher N2O production by HET can be compensated in this case by a lower N2O formation by AOB. In total, N2O emissions could be reduced by 15% (SBR) and 41% (biofilm) compared with the baseline scenarios. The results also confirmed that the mechanisms of N2O formation and conversion differed between the different systems, even though both systems were operated identically.

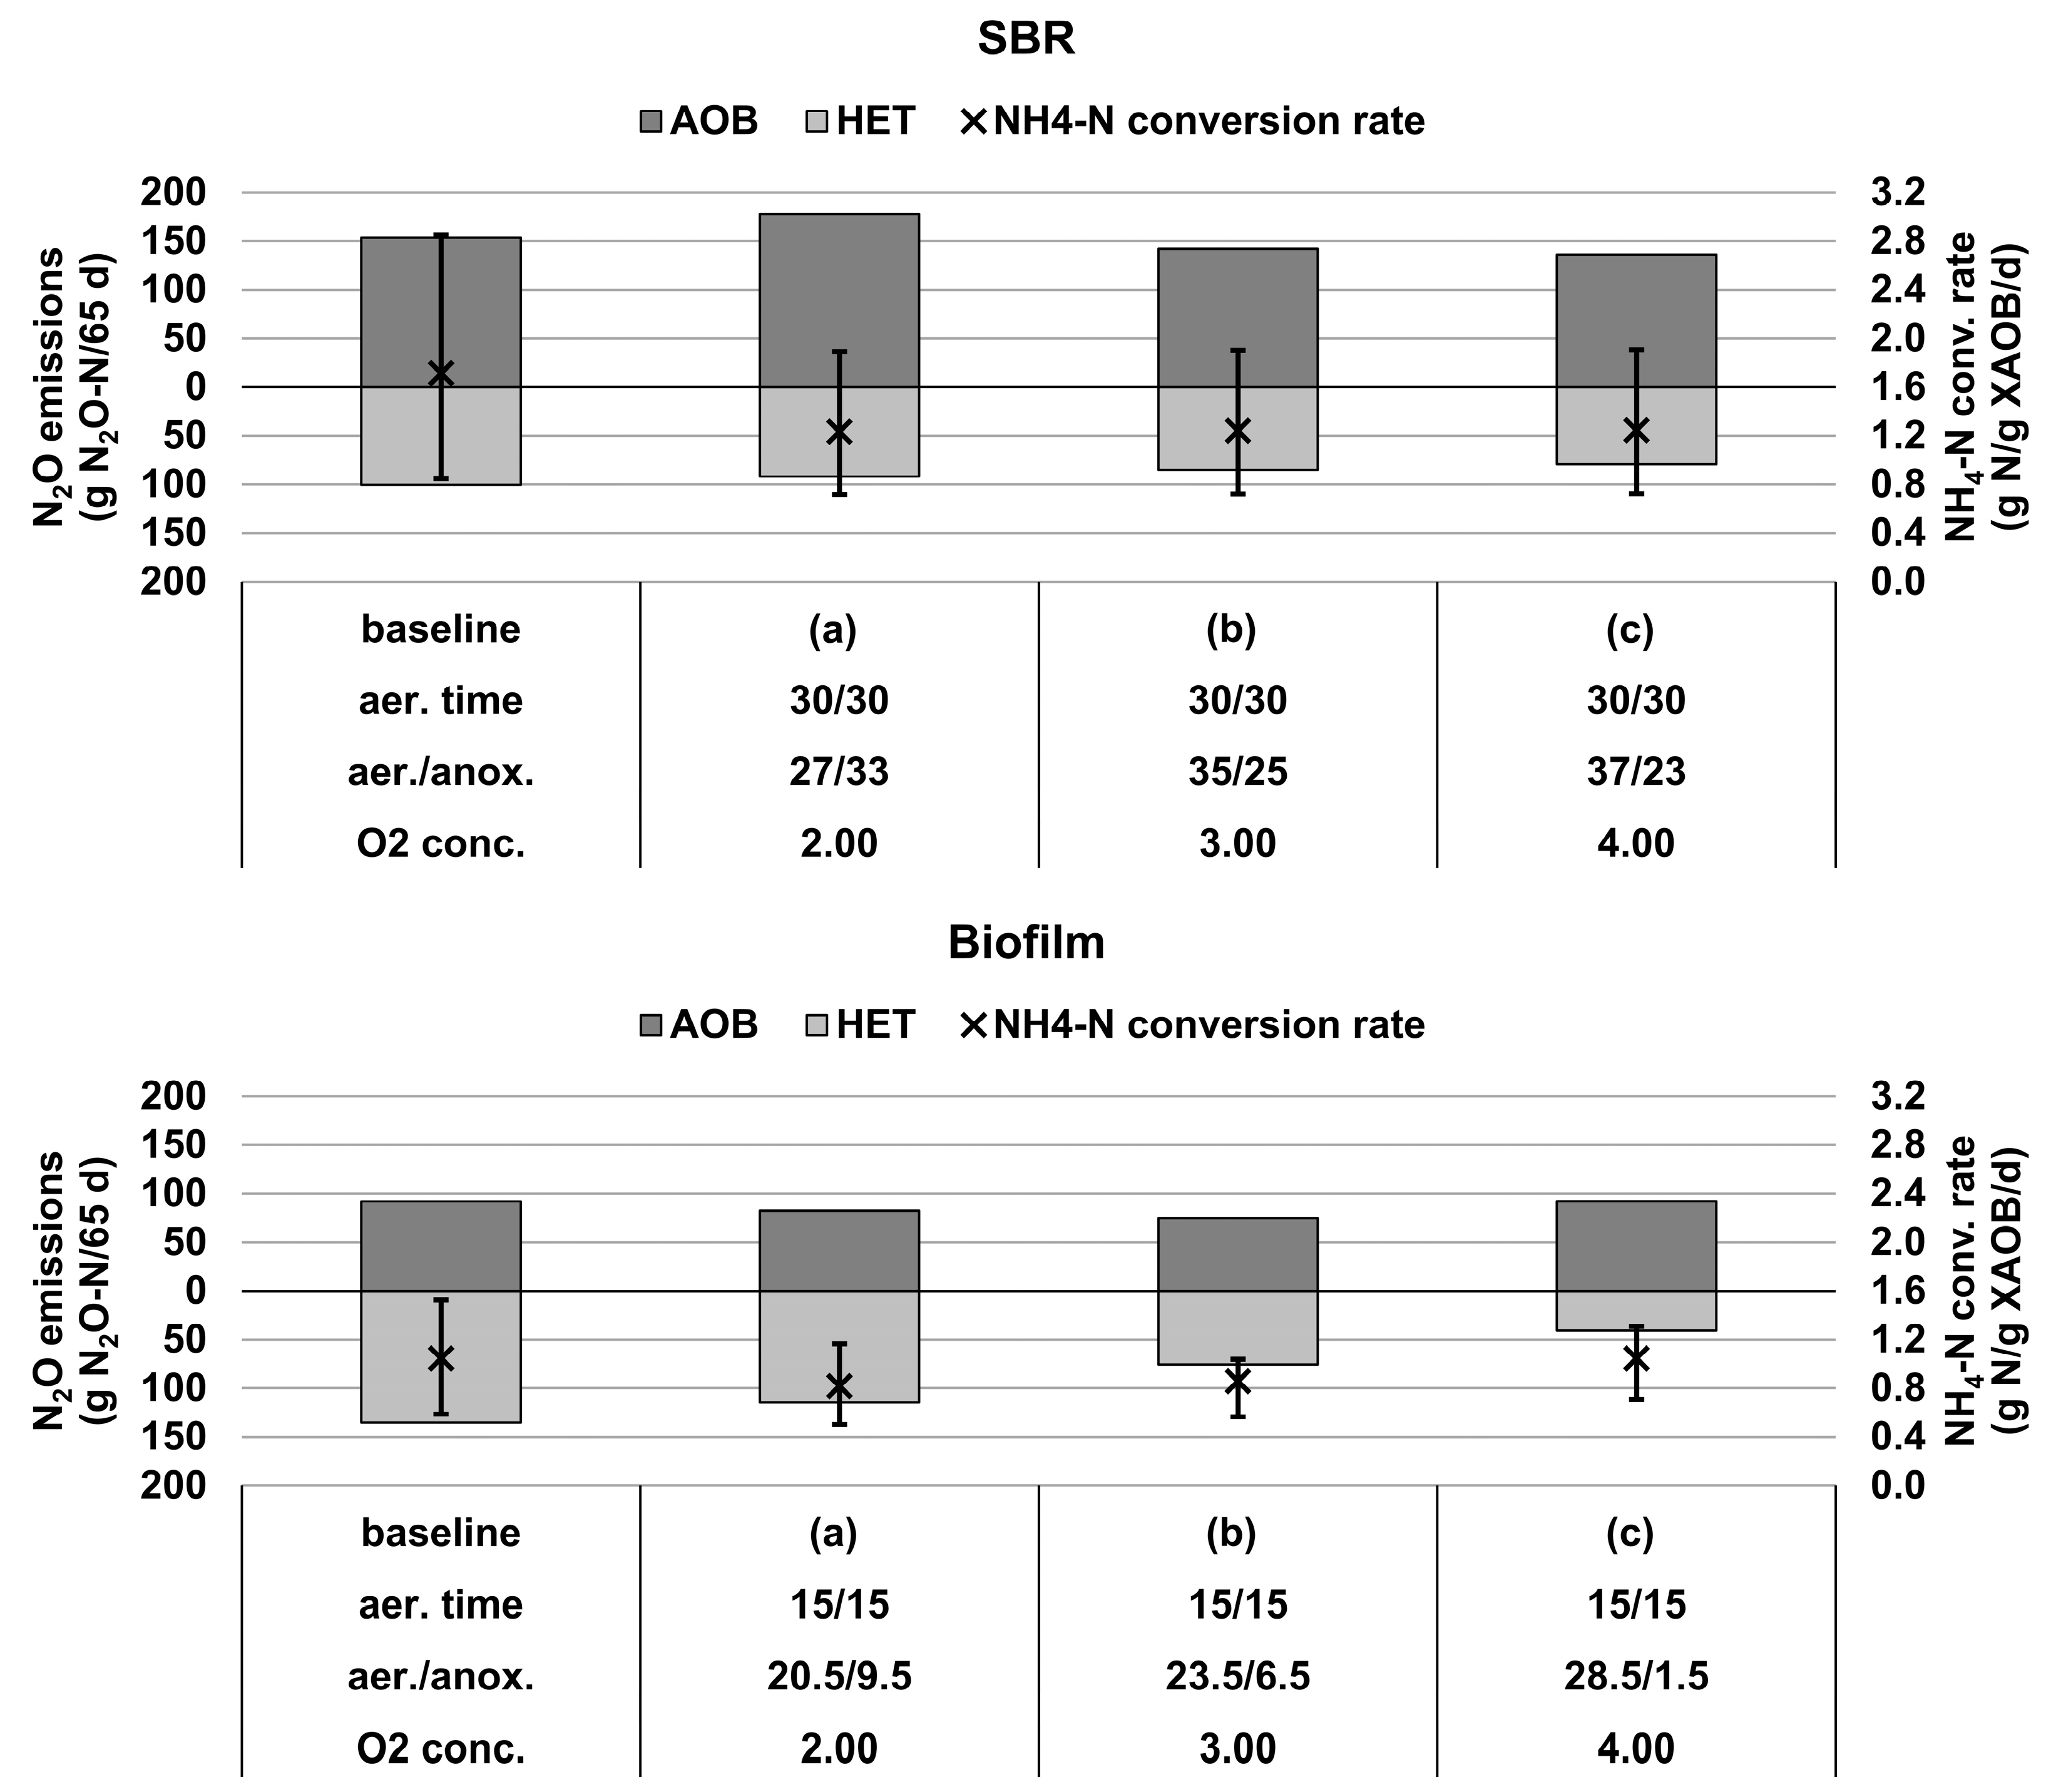
4.4. S2: Effect of Different O2 Concentrations

Figure 8 summarizes the modeling outcomes (emissions caused by AOB and HET over the investigated 65-day period and mean AOB-related NH4-N conversion rate) for different target O2 concentrations (2, 3, and 4 mg/L). A strong decrease in NH4 conversion was observed at concentrations of <2 mg/L; therefore, lower concentrations were not investigated. With reference to the previous section, aeration cycles of “30/30” for the SBR and “15/15” for the biofilm reactor were selected.
For both reactors, a decrease in total N2O emissions was observed for higher O2 concentrations. In the SBR, higher O2 concentrations were associated with a moderate reduction in N2O formation by both AOB and HET. While the former was related to reduced O2 concentration-dependent N2O formation factors, the latter was due to slightly shorter anoxic phases (resulting from the higher O2 mass in the reactor when aeration is switched off). The N2O emissions from the biofilm reactor were more strongly affected by the O2 concentration. As with the SBR, a decrease in N2O formation by HET was observed with an increase in O2 concentration, which was also due to shorter anoxic phases. Even at an O2 concentration of 2 mg/L in the bulk phase, an aerobic environment (O2 concentration > 0.2 mg/L) was still achieved in the innermost biofilm layer during the aerated phase. At lower bulk O2 concentrations, however, slightly lower AOB-induced N2O emissions were calculated. This could be attributed to several effects:
  • At an O2 concentration of 4 mg/L, a lower AOB mass was established in the system because more time was available for aerobic N conversion due to the longer aerobic phases (approx. 7 min more per aeration cycle at 4 mg/L than at 2 mg/L → lower conversion rates were already sufficient). Excess biomass decayed over time (see also next section). At a constant N conversion, the specific AOB conversion rate increased as a result (especially during N load peaks).
  • While N conversion at 4 mg/L occurred in the two outer layers, N conversion at 2 mg/L was mostly localized in the outermost layer. The determined formation factors in the outermost layer at 2 mg/L and the two outermost layers at 4 mg/L were relatively similar during the aerated phase. However, as the O2 concentration in the biofilm dropped after aeration was turned off, an increase in the formation factors was observed. Since the O2 concentration in the biofilm fell more slowly at 4 mg/L, aerobic N conversion could occur for a longer period in a low-O2 environment, inducing higher N2O emissions.
Summarizing the results, O2 concentrations of ≥3 mg/L only have a minor influence on N2O emissions of the SBR. In the biofilm reactor, a decrease in biomass and a longer exposure to low O2 concentrations were associated with slightly higher AOB-related N2O emissions at higher O2 concentrations. However, a strong reduction in heterotrophic N2O formation was observed at higher O2 concentrations, resulting in a net decrease in the total emissions.

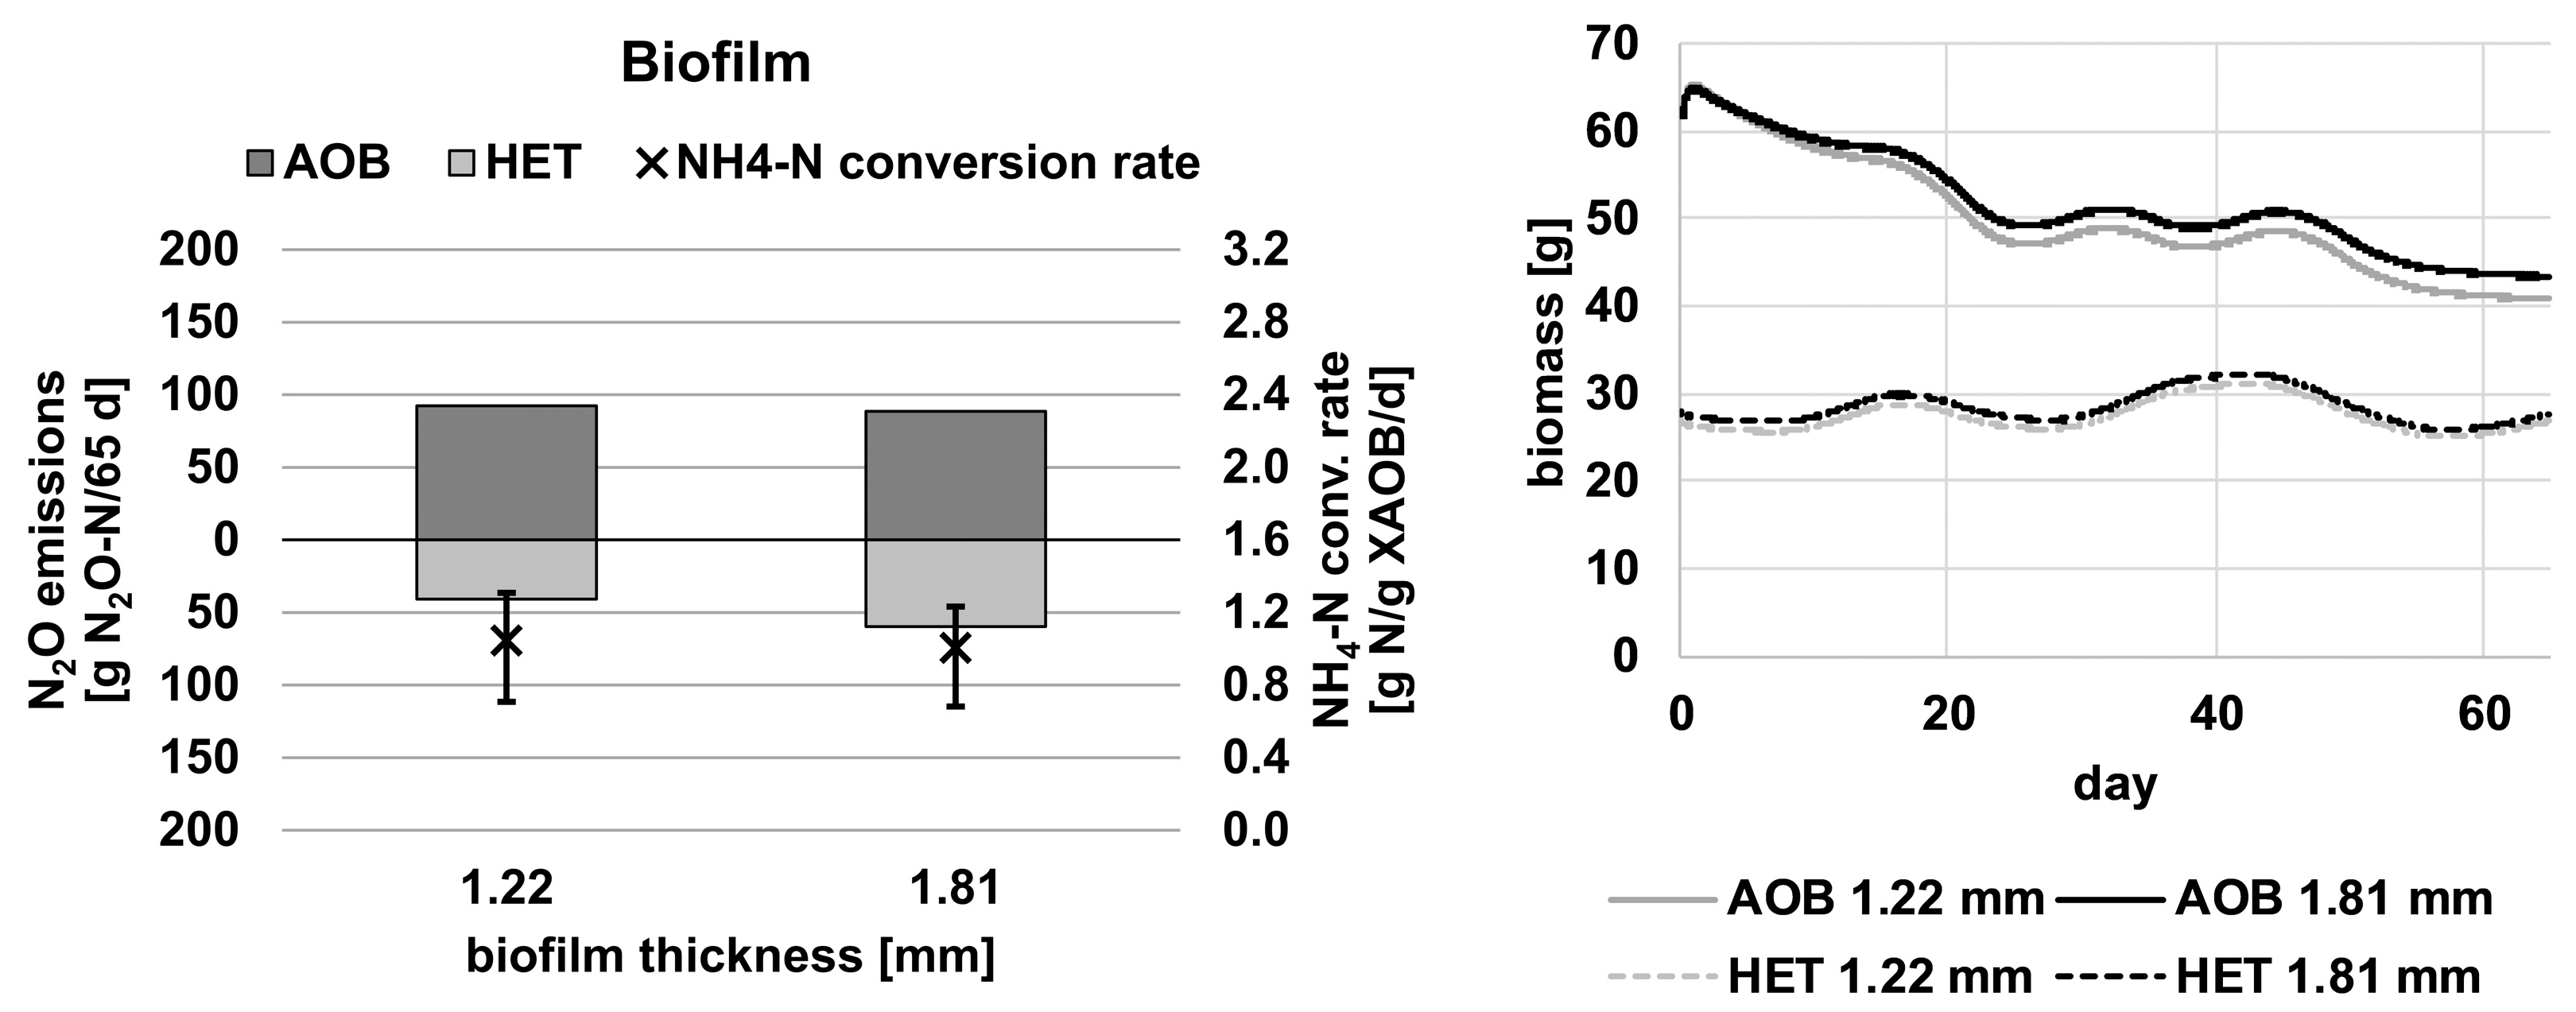
4.5. S3: Effect of Different Biomass Contents

In the SBR, higher TSS concentrations due to improved settling were associated with higher AOB activity and reduced autotrophic N2O formation. However, higher TSS concentrations promoted heterotrophic N2O formation, so the total emissions did not significantly change.
In the biofilm, the simulations (“15/15” aeration cycle, O2 concentration = 4 mg/L) with different erosion velocities resulting in different biofilm thicknesses showed that the total biomass in the reactor does not depend on the biofilm thickness as soon as a steady state is reached (Figure 9 right). Similar to the studies on different O2 concentrations, only the biomass required for the conversion processes (the N conversion is identical here in all scenarios) was retained; the excess biomass decayed. Consequently, the N2O emissions caused by AOB were similar for the investigated biofilm thicknesses. The total N2O emissions of the thicker biofilm were indeed slightly higher due to a faster decrease in the O2 concentration (more O2-consuming microorganisms in the outer biofilm layer), resulting in a longer anoxic phase and a slightly higher activity of HET (Figure 9 left).
It must be emphasized that the simulations started from a steady state, which was reached after more than 500 days. In reality, the conservation of biomass can definitely be achieved over shorter periods. Some studies have confirmed that AOB can be reactivated after longer periods without substrate availability (e.g., [25]). Applying the model, a higher biomass concentration could be maintained by repeated high-load phases. For example, the alkalinity of the inflow could be increased for one day every 7 days. However, since this resulted in increased N conversion on the one hand and higher N2O emissions on the other hand, this was not further examined in this work.

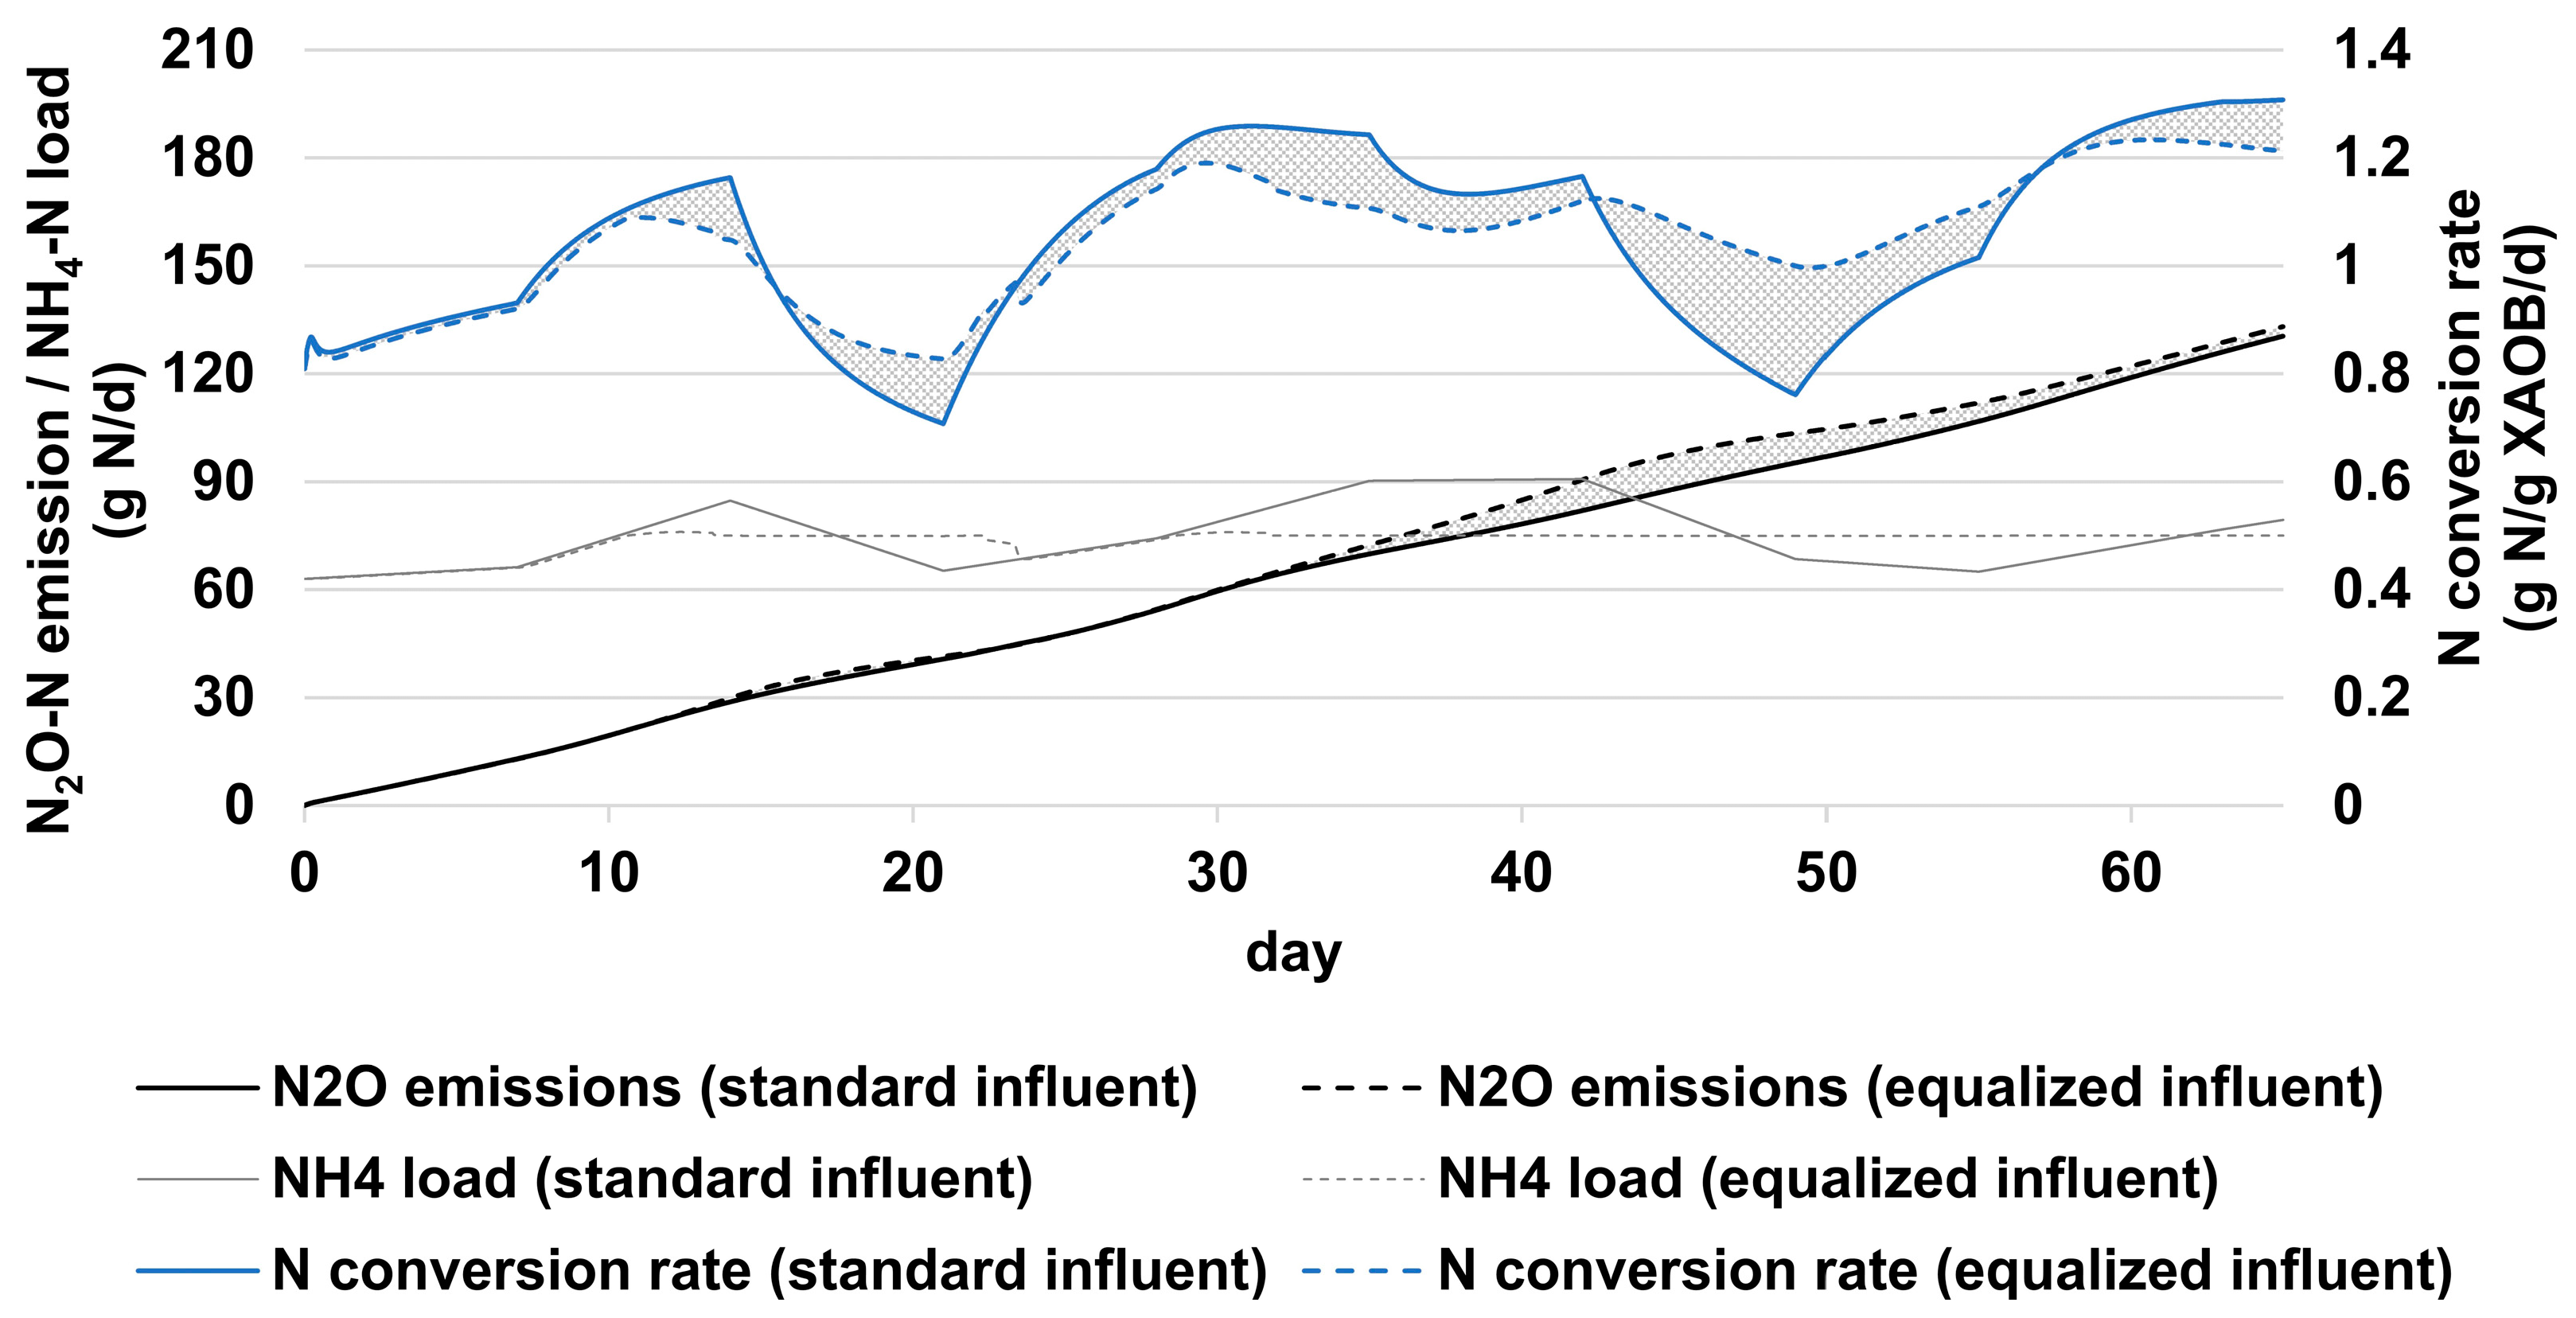
4.6. S4: Equalization of the Influent (Only Biofilm Reactor)

Equalizing the inflow did not significantly affect the total N2O emissions of the biofilm reactor, as shown in Figure 10, although peaks in the inflowing NH4-N load could be reduced. Emissions were just shifted from previously higher-loaded phases to previously lower-loaded phases. In the literature, increased N2O formation has been reported as a result of shock loads (e.g., [26,27]). However, this effect did not play a role in this study because the load change always occurred over several days.

5. Summary and Conclusions

The results of this study confirmed that there are substantial differences in N2O formation between biofilm systems and systems with suspended biomass, even though both systems are operated identically. Therefore, strategies to reduce emissions are not directly transferable. A combination of measurement and modeling, however, can support the identification of the causes of high emissions and the development of appropriate mitigation measures for both systems. Since measurements inside biofilms are usually difficult and expensive, calibrated mathematical models are essential to detect and evaluate the environmental conditions of these systems (model calibration via measurements in the bulk phase) [20].
It was proven in this study that reducing the specific AOB activity can significantly decrease N2O formation without affecting the reactor performance. The relationship between N2O formation and AOB activity has been known for years, but until now, AOB activity has not been used as a target parameter for a control strategy. With the newly developed approach, a main cause of high autotrophic N2O formation can directly be addressed. The described concept is a step from the measurement-based plant control toward a model-based control employing digital twins. For the boundary conditions investigated in this study, the biofilm system proved to be more advantageous, as a higher biomass content could be maintained in the biofilm. Thus, a conversion rate below the upper threshold according to Figure 2 was achieved for more than 60% of the examined period, resulting in the N2O formation by AOB being approx. 40% lower than that in the SBR.
The highest reduction in autotrophic N2O formation was achieved by changing the aeration cycles (SBR: 25%; Biofilm: 27%). A longer aerated time per day resulted in reduced N2O formation, as there was more time for nitrogen conversion (leading to a lower specific AOB activity). In addition, a lower number of aeration cycles had a positive effect on autotrophic N2O formation, as O2 deficiency situations (after aeration is turned off) occurred less frequently. An essential function of intermittent aeration in pure nitritation systems is, however, the prevention of NO2 oxidation by NOB, which must also be considered when selecting the aeration settings. The pilot plant operation showed that with the aeration cycles “15/15” and “30/30”, the suppression of NO2 formation can be ensured in the long term. Nevertheless, longer aerated phases up to continuous aeration can be selected for short periods, for example, to avoid increased N2O formation during load peaks.
For the systems investigated, an O2 concentration of ≥3 mg/L in the bulk phase proved to be ideal. Higher concentrations did not lead to a further reduction in N2O formation. The biofilm thickness and the TSS concentration played only a subordinate role when considering a steady state since in the long term, only the system-specific biomass, depending on the converted nitrogen load and the shear rate/sludge removal rate, is maintained. Temporary storage and equalization of the inflow had no effect on the N2O emissions over the entire investigated period since the emissions were merely shifted (short-term load peaks were not considered).
A disadvantage of the biofilm system is the higher risk of N2O formation by HET (here 34.5% more than in the SBR) due to the higher activity of HET establishing in the biofilm reactor (depending on the biofilm thickness and substrate diffusion). N2O formation by denitrification is unavoidable in both systems under the given boundary conditions since the N2O reduction is inhibited by HNO2 (NO2 concentration: 200–300 mg N/L; pH value: 6.0–6.5). It can be stated that for biofilm systems, incomplete denitrification is the main N2O source. With regard to heterotrophic N2O formation, the longest possible aerobic time per day should be aimed for. Moreover, a higher number of shorter aeration cycles is advantageous.
In summary, it was proven that N2O emissions can be reduced with appropriate aeration strategies by maintaining a low AOB activity (biofilm system: reduction in emissions by 34%). For the biofilm system, however, the measures investigated by [20] for the implementation of heterotrophic denitrification not as a source but as an N2O sink showed higher effectiveness (reduction in emissions by 75%). Therefore, the main focus should be on a reduction in the HNO2 concentration by an adapted operation strategy (e.g., single-stage deammonification instead of two-stage deammonification, resulting in lower NO2 accumulation). Moreover, sufficient anoxic environments must be provided (zoning in biofilm or intermittent aeration). That way, additional N2O formed by AOB can be degraded by denitrification, resulting in lower net emissions. N2O formation by AOB should be addressed after N2O denitrification has been successfully established.
Due to the high complexity and a large number of simultaneously occurring processes, a combination of deterministic models with intelligent optimization algorithms offers a high potential for minimizing greenhouse gas emissions in wastewater treatment. Thus, the control strategy can be automatically adapted to a specific operating situation, addressing autotrophic and/or heterotrophic N2O formation. Furthermore, denitrification capacities could be flexibly adjusted to the load situation.

Author Contributions

Conceptualization and methodology, M.B. and A.F.; investigation and modeling, A.F.; writing and visualization, A.F.; supervision and project administration, M.B. All authors have read and agreed to the published version of the manuscript.

Funding

This work was carried out as part of the MiNzE project (‘Minimization of the CO2 footprint by adapted process development in process water treatment—testing of the MiNzE process in an immersed fixed bed’, FKZ: 02WQ1482B). We thank the German Federal Ministry of Education and Research for financial support.

Data Availability Statement

The data presented in this study are openly available at https://doi.org/10.25835/psv2gfsu (accessed on 30 May 2023).

Conflicts of Interest

The authors declare no conflict of interest. The funders had no role in the design of the study; in the collection, analyses, or interpretation of data; in the writing of the manuscript; or in the decision to publish the results.

Appendix A

Figure A1. ASM matrix.
Water 15 02389 g0a1
Figure A2. ASM equations.
Water 15 02389 g0a2

References

  1. Kuokkanen, A.; Blomberg, K.; Mikola, A.; Heinonen, M. Unwanted mainstream nitritation-denitritation causing massive N2O emissions in a continuous activated sludge process. Water Sci. Technol. 2021, 83, 2207–2217. [Google Scholar] [CrossRef] [PubMed]
  2. IPCC. IPCC 5th Assessment Report: The Physical Science Basis; Cambridge University Press: Cambridge, UK; New York, NY, USA, 2013. [Google Scholar]
  3. Trautmann, N.; Schneider, Y.; Vogel, B.; Beier, M.; Rosenwinkel, K.-H. Determination of the carbon footprint for nitrogen removal from part streams including indirect and direct emissions a case study. In Proceedings of the IWA Conference on ‘Asset Management for Enhancing Energy Efficiency in Water and Wastewater Systems’, Marbella, Spain, 24–26 April 2013. [Google Scholar]
  4. Valkova, T.; Parravicini, V.; Saracevic, E.; Tauber, J.; Svardal, K.; Krampe, J. A method to estimate the direct nitrous oxide emissions of municipal wastewater treatment plants based on the degree of nitrogen removal. J. Environ. Manag. 2021, 279, 111563. [Google Scholar] [CrossRef] [PubMed]
  5. Beier, M.; Seyfried, C.-F. Final Report of the Research Project “N2O in Wastewater Treatment Plants”. Subproject 3 (N2O Formation during Nitrification and Denitrification in Wastewater Treatment Plants with Special Regard to Highly Concentrated Industrial Wastewater and Anaerobic Pre-Treatment); Leibniz University Hannover, Institute of Sanitary Engineering and Waste Management: Hanover, Germany, 1994. [Google Scholar]
  6. Joss, A.; Salzgeber, D.; Eugster, J.; König, R.; Rottermann, K.; Burger, S.; Fabijan, P.; Leumann, S.; Mohn, J.; Siegrist, H. Full-scale nitrogen removal from digester liquid with partial nitritation and anammox in one SBR. Environ. Sci. Technol. 2009, 43, 5301–5306. [Google Scholar] [CrossRef] [PubMed]
  7. Law, Y.; Ni, B.-J.; Lant, P.; Yuan, Z. N2O production rate of an enriched ammonia-oxidizing bacteria culture exponentially correlates to its ammonia oxidation rate. Water Res. 2012, 46, 3409–3419. [Google Scholar] [CrossRef]
  8. Schneider, Y.; Beier, M.; Rosenwinkel, K.-H. Nitrous oxide formation during nitritation and nitrification of high-strength wastewater. Water Sci. Technol. 2013, 67, 2494–2502. [Google Scholar] [CrossRef]
  9. Yu, R.; Kampschreur, M.J.; van Loosdrecht, M.C.M.; Chandran, K. Mechanisms and specific directionality of autotrophic nitrous oxide and nitric oxide generation during transient anoxia. Environ. Sci. Technol. 2010, 44, 1313–1319. [Google Scholar] [CrossRef]
  10. Ritchie, G.A.; Nicholas, D.J. Identification of the sources of nitrous oxide produced by oxidative and reductive processes in Nitrosomonas europaea. Biochem. J. 1972, 126, 1181–1191. [Google Scholar] [CrossRef] [Green Version]
  11. Daelman, M.R.J.; van Voorthuizen, E.M.; van Dongen, U.G.J.M.; Volcke, E.I.P.; van Loosdrecht, M.C.M. Seasonal and diurnal variability of N2O emissions from a full-scale municipal wastewater treatment plant. Sci. Total Environ. 2015, 536, 1–11. [Google Scholar] [CrossRef]
  12. Schneider, Y.; Beier, M.; Rosenwinkel, K.-H. Influence of operating conditions on nitrous oxide formation during nitritation and nitrification. Environ. Sci. Pollut. Res. Int. 2014, 21, 12099–12108. [Google Scholar] [CrossRef]
  13. Liang, W.; Yu, C.; Ren, H.; Geng, J.; Ding, L.; Xu, K. Minimization of nitrous oxide emission from CASS process treating low carbon source domestic wastewater: Effect of feeding strategy and aeration rate. Bioresour. Technol. 2015, 198, 172–180. [Google Scholar] [CrossRef]
  14. Ni, B.-J.; Ruscalleda, M.; Pellicer-Nacher, C.; Smets, B.F. Modeling nitrous oxide production during biological nitrogen removal via nitrification and denitrification: Extensions to the general ASM models. Environ. Sci. Technol. 2011, 45, 7768–7776. [Google Scholar] [CrossRef]
  15. Bollon, J.; Filali, A.; Fayolle, Y.; Guerin, S.; Rocher, V.; Gillot, S. Full-scale post denitrifying biofilters: Sinks of dissolved N2O? Sci. Total Environ. 2016, 563–564, 320–328. [Google Scholar] [CrossRef] [PubMed]
  16. Vogel, B. Denitrification as A Sink of N2O Emissions in Side-Stream Treatment—Model Extension and Application (‘Denitrifikation als Senke von N2O-Emissionen bei der Teilstrombehandlung—Modellerweiterung und-Anwendung’). Ph.D. Thesis, Institute of Sanitary Engineering and Waste Management of the Leibniz University Hannover, Hannover, Germany, 2018. Available online: https://www.tib.eu/de/suchen/id/TIBKAT:1036448681/Denitrifikation-als-Senke-von-N2O-Emissionen-bei (accessed on 30 May 2023).
  17. Zhou, Y.; Pijuan, M.; Zeng, R.J.; Yuan, Z. Free nitrous acid inhibition on nitrous oxide reduction by a denitrifying-enhanced biological phosphorus removal sludge. Environ. Sci. Technol. 2008, 42, 8260–8265. [Google Scholar] [CrossRef] [PubMed]
  18. Sabba, F.; Terada, A.; Wells, G.; Smets, B.F.; Nerenberg, R. Nitrous oxide emissions from biofilm processes for wastewater treatment. Appl. Microbiol. Biotechnol. 2018, 102, 9815–9829. [Google Scholar] [CrossRef] [PubMed] [Green Version]
  19. Ye, L.; Porro, J.; Nopens, I. Quantification and Modelling of Fugitive Greenhouse Gas Emissions from Urban Water Systems; IWA Publishing: London, UK, 2022; Chapter 7.3.5. [Google Scholar] [CrossRef]
  20. Freyschmidt, A.; Beier, M. Model-based identification and testing of appropriate strategies to minimize N2O emissions from biofilm deammonification. Water Sci. Technol. 2022, 86, 1810. [Google Scholar] [CrossRef] [PubMed]
  21. Liu, T.; Liu, S.; He, S.; Tian, Z.; Zheng, M. Minimization of N2O Emission through Intermittent Aeration in a Sequencing Batch Reactor (SBR): Main Behavior and Mechanism. Water 2021, 13, 210. [Google Scholar] [CrossRef]
  22. Duan, H.; van den Akker, B.; Thwaites, B.J.; Peng, L.; Herman, C.; Pan, Y.; Ni, B.-J.; Watt, S.; Yuan, Z.; Ye, L. Mitigating nitrous oxide emissions at a full-scale wastewater treatment plant. Water Res. 2020, 185, 116196. [Google Scholar] [CrossRef]
  23. Beier, M.; Feldkämper, I.; Freyschmidt, A. Model assisted identification of N2O mitigation strategies for full-scale reject watertreatment plants. Water Sci. Technol. 2021, 39, 349–363. [Google Scholar] [CrossRef]
  24. ASM-Modell_ASM3_1_N2O_ISAH. Institute of Sanitary Engineering and Waste Management of the Leibniz University Hannover. Available online: https://data.uni-hannover.de/de/dataset/asm-modell_asm3_1_n2o_isah (accessed on 30 May 2023).
  25. Torà, J.A.; Lafuente, J.; Baeza, J.A.; Carrera, J. Long-term starvation and subsequent reactivation of a high-rate partial nitrification activated sludge pilot plant. Bioresour. Technol. 2011, 102, 9870–9875. [Google Scholar] [CrossRef]
  26. Chandran, K.; Stein, L.Y.; Klotz, M.G.; van Loosdrecht, M.C.M. Nitrous oxide production by lithotrophic ammonia-oxidizing bacteria and implications for engineered nitrogen-removal systems. Biochem. Soc. Trans. 2011, 39, 1832–1837. [Google Scholar] [CrossRef]
  27. Su, Q.; Domingo-Félez, C.; Zhang, Z.; Blum, J.-M.; Jensen, M.M.; Smets, B.F. The effect of pH on N2O production in intermittently-fed nitritation reactors. Water Res. 2019, 156, 223–231. [Google Scholar] [CrossRef] [PubMed]
Figure 1. Measured influent concentrations of NH4-N and alkalinity as well as aeration mode over the investigated operation period used as input for the simulations.
Water 15 02389 g001
Figure 2. Determination of the N2O formation factor depending on the AOB-related NH4-N conversion rate.
Water 15 02389 g002
Figure 3. O2 profile (simulated) and N2O concentration profiles (measured and simulated) for the SBR (water phase).
Water 15 02389 g003
Figure 4. Total cumulated N2O emissions and AOB-related NH4-N conversion rate (red line: critical conversion rate, see Figure 2) of the biofilm reactor (simulated) and the SBR (measured and simulated).
Water 15 02389 g004
Figure 5. Oxygen profiles and total active AOB mass in the biofilm for two operation periods.
Water 15 02389 g005
Figure 6. N2O emissions caused by AOB and HET (bars) over the investigated 65-day period and mean AOB-related NH4-N conversion rate (error bars: min. and max. conversion rate) calculated for different aeration cycles.
Water 15 02389 g006
Figure 7. CO2e emissions resulting from the release of N2O and the consumption of energy for aeration.
Water 15 02389 g007
Figure 8. N2O emissions caused by AOB and HET (bars) over the investigated 65-day period as well as the mean AOB-related NH4-N conversion rate (error bars: min. and max. conversion rate) calculated for different O2 concentrations.
Water 15 02389 g008
Figure 9. N2O emissions caused by AOB and HET (bars) over the investigated 65-day period as well as the mean AOB-related NH4-N conversion rate (error bars: min. and max. conversion rate) calculated for different biofilm thicknesses (left) and total mass of AOB and HET in the reactor (right).
Water 15 02389 g009
Figure 10. Total cumulated N2O emissions, inflowing NH4 load, and N conversion rate for standard and equalized inflow.
Water 15 02389 g010
Table 1. Investigated scenarios.
S1: different aeration cycles
O2 concentration = 4 mg/L
“15/30”
“15/15”
“30/30”
“30/15”
Continuous aeration
S2: different O2 concentrations
SBR: aeration cycle = “30/30”
BF: aeration cycle = “15/15”
2 mg/L
3 mg/L
4 mg/L
S3: increased biomass content
O2 concentration = 4 mg/L
SBR: aeration cycle = “30/30”
BF: aeration cycle = “15/15”
SBR: increased sludge settling abilities
Biofilm: decreased erosion velocity
S4: equalization of the influent
O2 concentration = 4 mg/L
BF: aeration cycle = “15/15”
Target value for the inflowing N load (here: overall mean of the total inflowing N load)
Table 2. N2O emissions caused by AOB and HET over the investigated operation period of 65 d (simulated values).
(g N2O-N/65 d)AOBHETTotal
SBR153.4100.5253.9
Biofilm92.1135.2227.3
Disclaimer/Publisher’s Note: The statements, opinions and data contained in all publications are solely those of the individual author(s) and contributor(s) and not of MDPI and/or the editor(s). MDPI and/or the editor(s) disclaim responsibility for any injury to people or property resulting from any ideas, methods, instructions or products referred to in the content.

