Article

Influences of Underwater Shield Tunnelling on River Embankment Seepage Stability Considering Various Overburden Thickness

1
College of Civil Engineering, Hefei University of Technology, Hefei 230009, China
2
Hefei Rail Transit Group Limited Company, Hefei 230011, China
*
Author to whom correspondence should be addressed.
Water 2023, 15(13), 2346; https://doi.org/10.3390/w15132346
Submission received: 5 May 2023 / Revised: 2 June 2023 / Accepted: 16 June 2023 / Published: 25 June 2023
(This article belongs to the Special Issue Risk Management Technologies for Deep Excavations in Water-Rich Areas)

Abstract

:
Underwater shield tunneling will disturb the soil near the river, especially in water-rich soft ground. This may cause a groundwater infiltration hydraulic gradient to exceed the critical value, leading to calamities, such as unexpected flooding or submerged erosion. To ensure the security of construction and the stability of river embankment seepage, it is crucial to assess the safety of the underwater tunnel cover thickness. A shield tunnel project under a river in Hefei is used as an example. The numerical model established by the finite element method is used for calculating and analyzing the changes in the groundwater flow field and the stability state of embankment seepage induced by underwater shield tunneling under different overburden thickness conditions. The results show that the construction disturbance of the shield tunnel through the river is increased, the internal force environment of the embankment slope is destroyed, and the maximum seepage hydraulic gradient is increased. In the case study, the embankment keeps in a stable state of seepage when the cover thickness of the shield tunnel has 2.9 times its outer diameter. The findings of this study can serve as a scientific guide to assure seepage stability in an underwater shield tunneling project and to stop river embankment erosion.

1. Introduction

In recent years, urban subway construction in China has grown significantly, and tunneling projects that cross rivers are becoming increasingly prevalent [1,2,3,4]. The shield technique is the most widespread tunneling build process [5]. When the shield method is utilized, the construction pace is fast and safe. However, the surrounding soil will inevitably be disturbed while the shield tunnels cut through the rivers. Furthermore, the physical and mechanical characteristics of the disturbed soil can be changed as a side effect of tunnel construction [6], weakening its ability to resist seepage [7] and significantly increasing the infiltration hydraulic gradient [8]. This increases the seepage erosion of the soil on the river embankment slope and causes significant soil loss, which in turn causes infiltration damage, such as flowing soil and pipe surges [9,10]. For example, in the construction of the river-crossing tunnel of Shanghai rail transit line 4, accidents occurred in the connecting channel flowing sand and gushing water, tunnel structures damaging, ground setting, and the direct cause of the accident was the sudden surge of pressurized water [11]. It was reported that sand and water surged at the end of the shield seal when one shield tunnel crossing the river was being built in Wuhan, China [12]. A rapid surge disaster happened during the construction of Tianjin Metro Line 2’s shield structure beneath the river while traversing a thin layer of water-rich silt [13]. The Quaternary fluvial deposits, which mostly consist of clay, pulverized clay, dust, silt layers, and sand layers accumulated in the alluvial phase of ancient rivers, frequently predominate in the riverine strata [14]. These rising and falling are practically coordinated considering the hydraulic connection between the groundwater in the riverine strata and the stream of surface water [15]. There is a high likelihood that seepage channels will be created during tunnel construction, changing the seepage environment and harming the embankment slope’s internal force environment [16,17,18]. The fine particles of the disturbed pore space rock and soil are continuously carried away by the groundwater flow under the influence of high permeability during high water levels in flood season and the sudden drop in water level. This further development leads to infiltration damage caused by seepage, which results in embankment slope instability [19]. To maintain the security of construction and river embankment safety and avoid infiltration damage, it is crucial to design the shield tunnel with the appropriate cover thickness.
Therefore, the minimum cover depth, as one of the most critical aspects to design underwater tunnels, must be addressed. The Japanese minimum water seepage method [20,21], the Norwegian empirical method [22], the mechanical equilibrium method [23], and the Chinese underwater mining empirical method [24] are popular methods for predicting the minimum cover depth, but it is still not certain to what capacity they can be used to estimate the safe thickness of shield tunnels. The level of the tunnel cover depth, together with additional elements, such as soil permeability [25,26,27] and dynamic disturbances [28,29,30], have significant effects on the tunnel and ground reaction.
Several researchers have developed models of the surface settlement caused by tunnel excavation while taking the effect of tunnel cover depth into consideration [31,32]. However, when contemplating realistic modeling of the seepage field for underwater tunnels, it is crucial to take the influence of the depth of cover into account. The seepage field variations in submerged tunnel excavation have been predicted and examined by numerous studies [33,34,35,36]. Additionally, it is beneficial to better understand the fluid-mechanical interaction that occurs in underwater tunneling [37,38,39,40,41]. These studies shed light on the hydraulic interaction between an underwater tunnel and groundwater, which is essential for ensuring the ideal design and construction management of underwater tunnels. Associated research have further shown that tunnel excavation has a stronger effect on the seepage stability of the formation and the region of seepage erosion of the formation is larger when the shield tunnel cover thickness is shallow [42,43]. In this study, the investigation of the maximum hydraulic gradient variation of the embankment slope serves as the primary methodology for estimating the minimum depth of cover for submerged tunnels.
To study the impact of various cover thickness conditions on the seepage stability of the embankment slope, the shield tunnel crossing the river in Hefei serves as an illustration, establishing a two-dimensional seepage model by means of the finite element software Geo-studio. Furthermore, the safety of the overburden thickness of the underwater shield tunnel for this project was also assessed.

2. Methods

To simulate the two-dimensional steady-state seepage and transient seepage field changes on the river embankment slope under the design flood level and the design flood level declining respectively, the seepage calculations in this study primarily use the finite element method of the Geo-studio software. The two-dimensional seepage differential control equations are [44]:
x ( K x h x ) + z ( K z h z ) = C h t
C = θ h
where h(x, y, z, t) is the head function to be sought (m), Kx and Ky are the permeability coefficient (cm∙s−1) in the direction of the x and z axis as the main axis, C is the water capacity, θ is the unit volume of water content.
The fixed solution conditions are as follows:
(1)
Initial conditions:
h | t = 0 = h 0 ( x , z , 0 )
(2)
Assume that the boundary is either Γ = Γ1 or Γ = Γ2. Where Γ1 is the first class of boundary conditions, such as given head bounds and upstream and downstream water level boundary surfaces. Water separation boundaries and other well-known flow borders are examples of the second category of boundary conditions or Γ2.
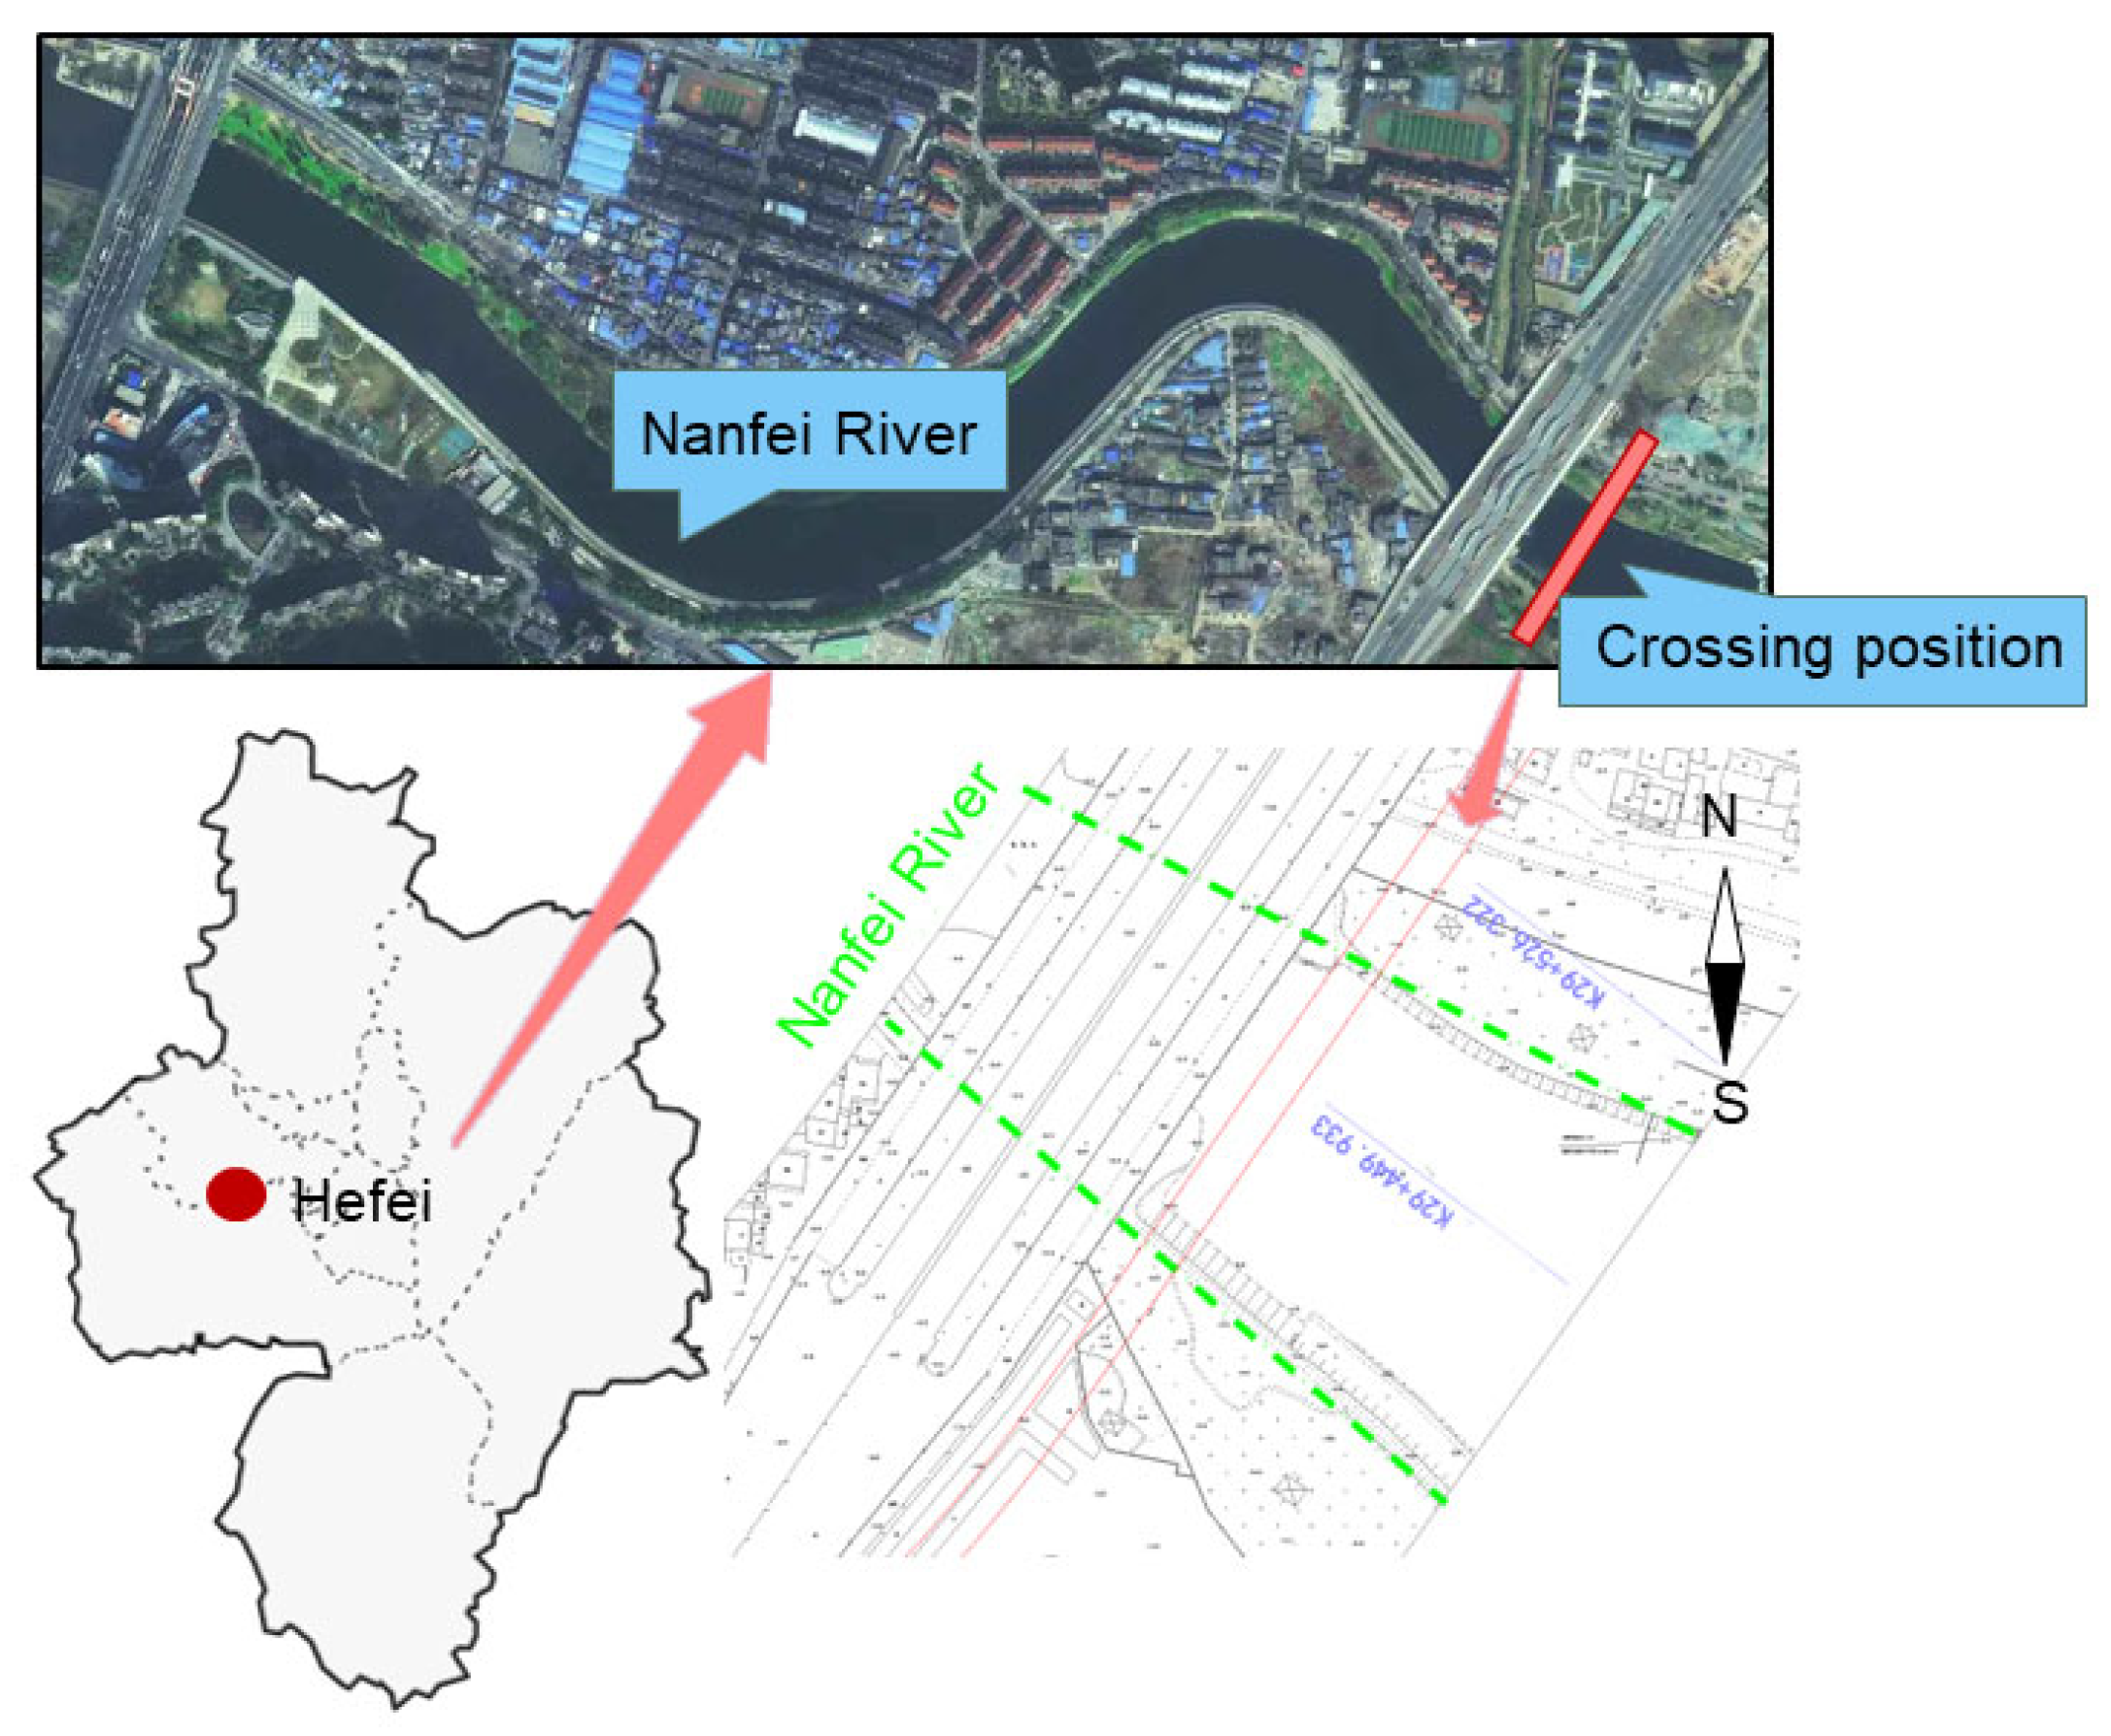
Type I boundary conditions:
h | t = 0 = h 0 ( x , z , t )
Type Ⅱ boundary conditions:
K n H n | Γ 2 = q ( x , z , t )
where Kn is the normal permeability coefficient of the boundary surface (cm∙s−1), and n is the normal vector outside the boundary surface.
The variational approach is used to further get the finite element computation format:
[ K ] { h } + [ M ] { h t } + [ D ] { q } = { F 0 }
where {F0} is the nodal water vector created by sources or sinks inside the seepage field, [K] is the unit seepage conduction matrix, [M] is the matrix of water absorbed or released from the pore with unit head variation, [D] is the matrix of water generated by unit flow variation at the flow boundary.
K ij = Ω e ( K x N j x N i x + K z N j z N i z ) dxdz
M ij = C Ω e N i N j dxdz
D ij = C Ω e Γ 2 N i N j d Γ
where Kij, Mij, and Dij are the relevant matrix elements and iterative calculation is used to determine the seepage field in the embankment slope.

3. Study Area

The Nanfei River is crossed by the metro shield tunnel project in Hefei, Anhui Province. Figure 1 shows the precise site of the project crossing. The shield tunnel cutting through the river is constructed by a single-circle shield method with prefabricated assembly-type single-layer lining. The thickness of the single-circle tunnel segment in the shield section is 300 mm, with an inner diameter of 5.4 m and an outer diameter of 6 m. The project is situated in the Nanfei River, also known as Shishui, Jindou River, which is a major tributary of the Chaohu Lake water system. It originates from the Jianghuai watershed and continues to extend southward from the great submerged mountain of Changgang. The main river channel has a length of 70 km, and the watercourse of crossing position is relatively straight. Moreover, according to the river’s measured part, the project section’s river embankment has an elevation of 12.6 m, the water’s surface is about 80 m wide, and the river’s minimum elevation is 6.0 m. The Nanfei River portion, where the project is located, currently has a 100-year flood control standard.
The Nanfei River’s Second Bottom and river floodplain make up the terrain of the project river segment. The project river section’s top layer is a layer of Quaternary artificial fill, mainly miscellaneous fill that is localized as plain fill. Layers of Quaternary Holocene alluvial clay, pulverized clay, dust, and silt-sand are found beneath the top layer. The deep soil layers are Quaternary alluvial clay, chalky clay, powder clay, and sandy soil layers of the alluvial phase of the ancient river of modest depth. According to the investigation region’s geological survey report, the stratum at the project location is generalized in this study, and the stratum at the crossing section is made up of miscellaneous fill, clay, powdery clay, chalk, and fine sand in that order from top to bottom. The pertinent parameters of the stratum at the river section are shown in Table 1.
The primary aquifers in the study region are water-bearing formations of rocks that are submerged (somewhat pressured), exhibit excellent permeability, receive recharge from atmospheric precipitation, and share fair recharge and discharge relationships with rivers. Additionally, there is no infiltration inside the underwater tunnel in seepage impact of interest. The two-dimensional modeling considered the shield tunnel layer’s permeability coefficient, which is set to 0, in order to mimic the tunnel cross-section. The relevant parameters of the shield tunnel are also shown in Table 1.

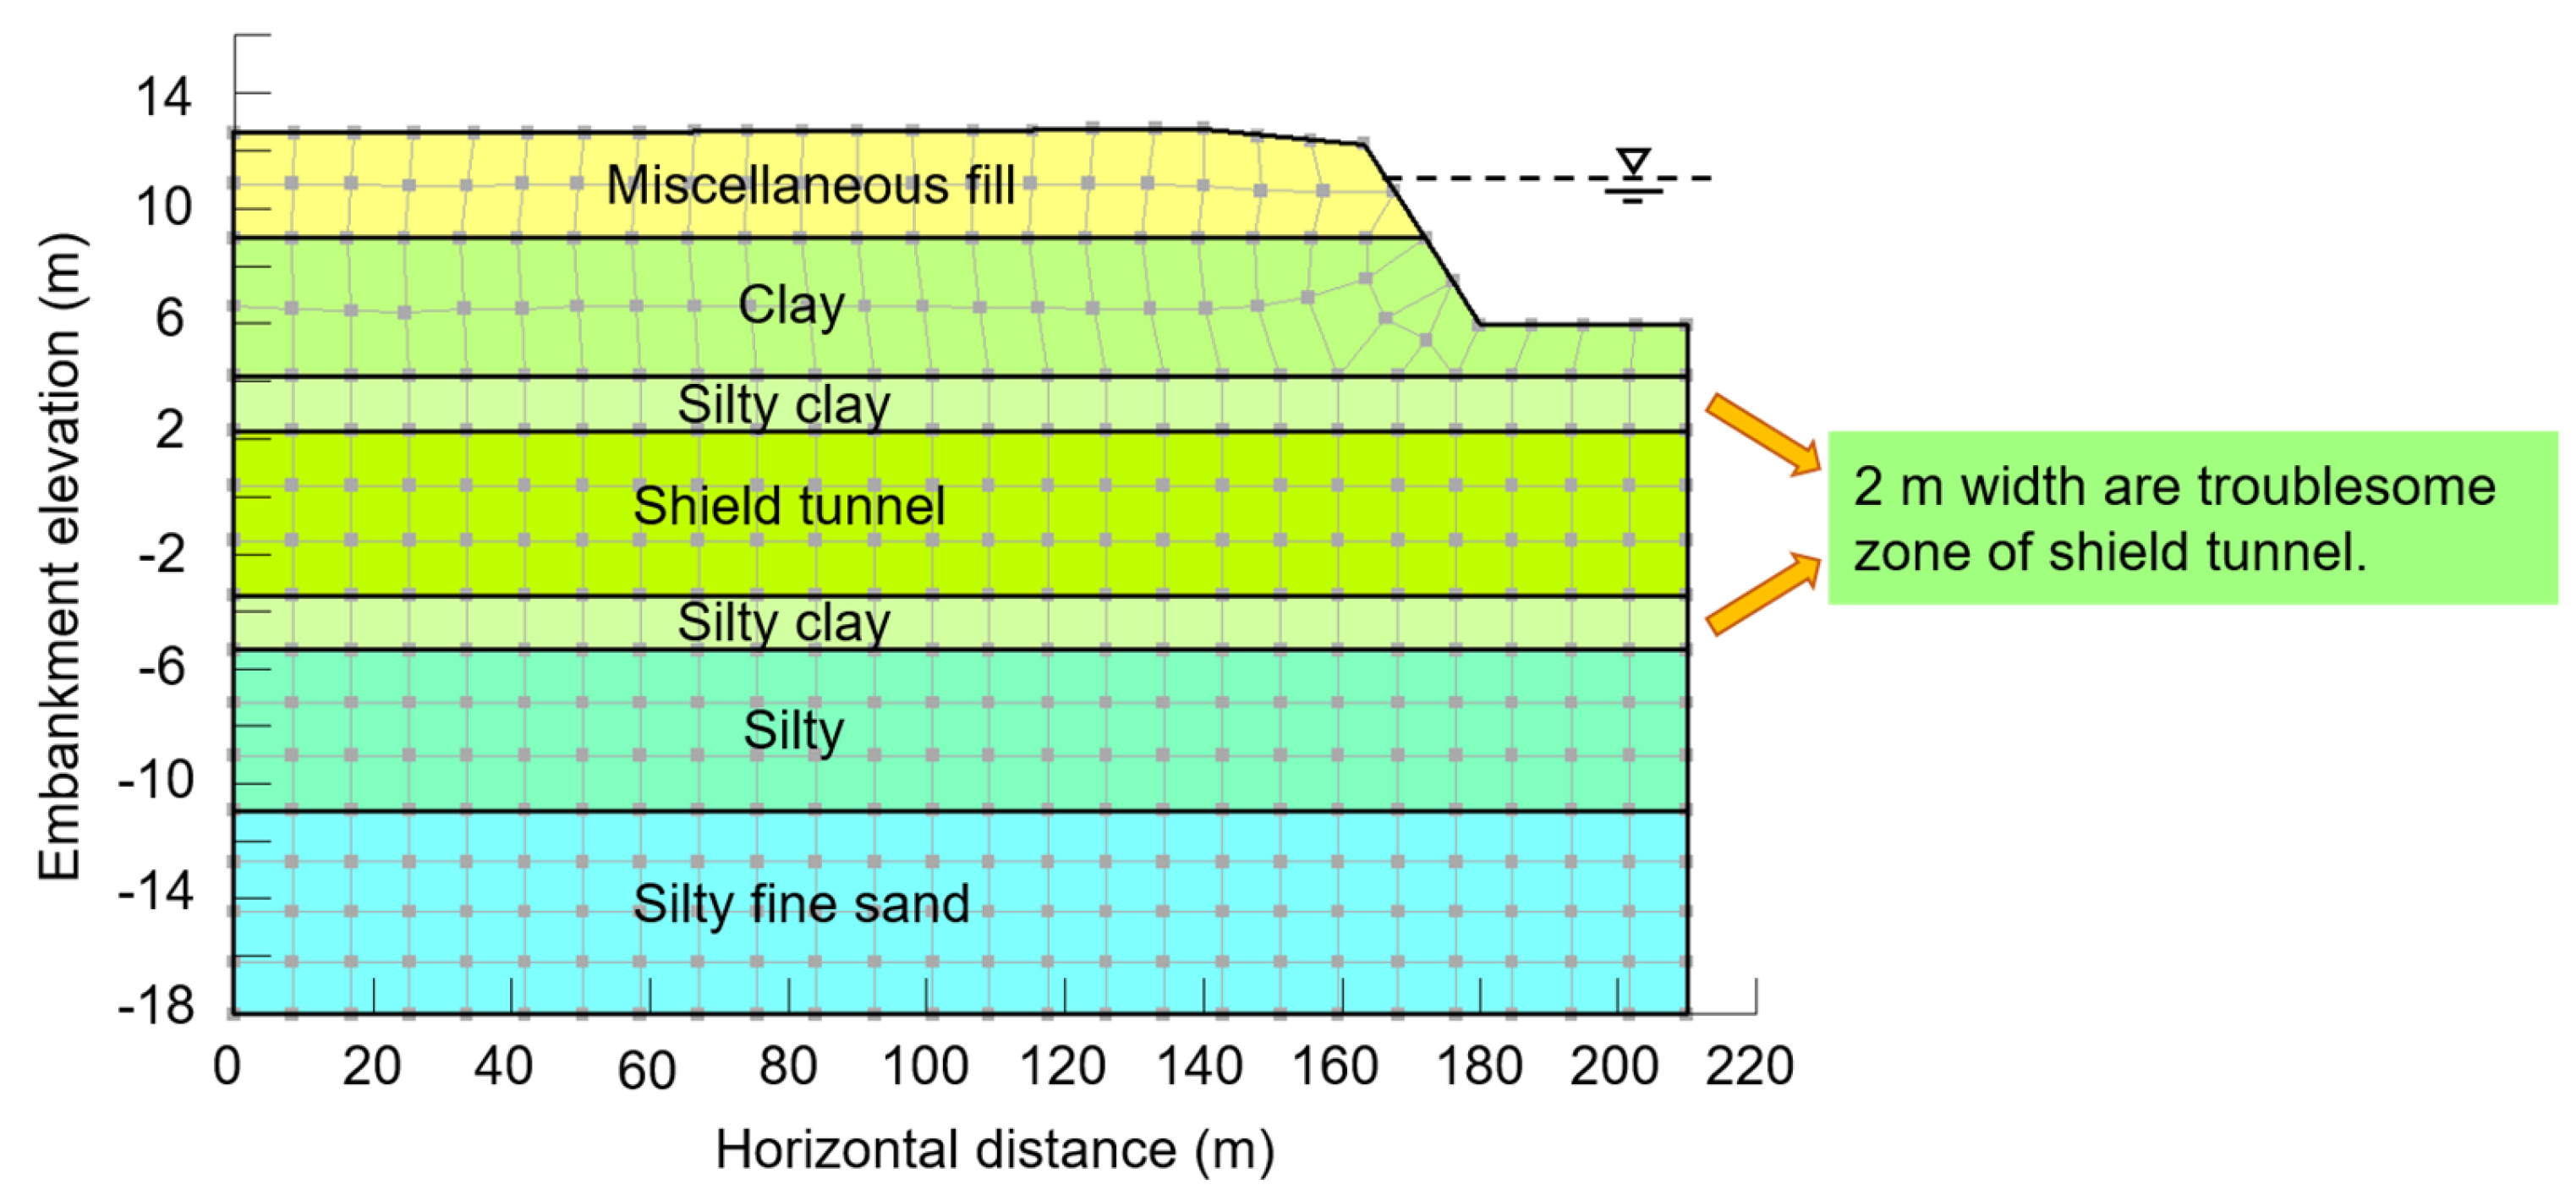
4. Numerical Modeling

In this work, the underwater shield tunnel crossing the river embankment was modeled and examined using the finite element analysis program Geo-studio. A two-dimensional model was created for the semi-river profile at the shield tunnel crossing position based on the project profile. Model the slope’s top elevation (12.6 m), the river’s bottom elevation (6.0 m), and the shield tunnel’s outer diameter (6 m). As mentioned in Section 3, the shield tunnel layer permeability coefficient is configured as 0 to simulate the tunnel section in 2D modeling. While taking into account the shield tunnel’s impact on the surrounding soil disturbance, designate the shield tunnel’s outer diameter 2 m range as the troublesome zone, and increase the soil permeability coefficient value by one order of magnitude for the troublesome zone’s permeability coefficient. The numerical model mesh of seepage is split as indicated in Figure 2 and the upper boundary condition of the model is the first kind of specified head boundary. The prior testing calculations show that the number and size of the grid could accurately define the river boundaries in the case of meeting the demands of numerical calculation accuracy.
Two seepage calculation conditions, steady and unsteady seepage conditions, are used. The 100-year design flood level of 12.21 m is the steady seepage calculation condition, and the unstable seepage calculation is that the design flood level decreases sharply by 2 m in 24 h. The specific calculation circumstances are provided in Table 2.
Along with the investigation of the region’s engineering geology, the shield tunnel’s diameter was held constant, and the overburden thicknesses were chosen to be 3.76 m, 9.07 m, and 17.51 m for the three overburden thicknesses to evaluate the impact of the various overburden thicknesses on the stability of river embankment seepage. Moreover, the top elevation of the embankment minus the minimum top elevation of the tunnel, which corresponds to the location at the burial depth of 17.51 m (the distance between the river bottom and the top of the tunnel), gives the maximum burial depth of the tunnel in the design scheme. Table 3 displays the various operating circumstances and the resulting overburden thicknesses.

5. Results and Analysis

5.1. Analysis of the Impact of Underwater Shield Tunnel on River Embankment Seepage Stability under Design Flood Level

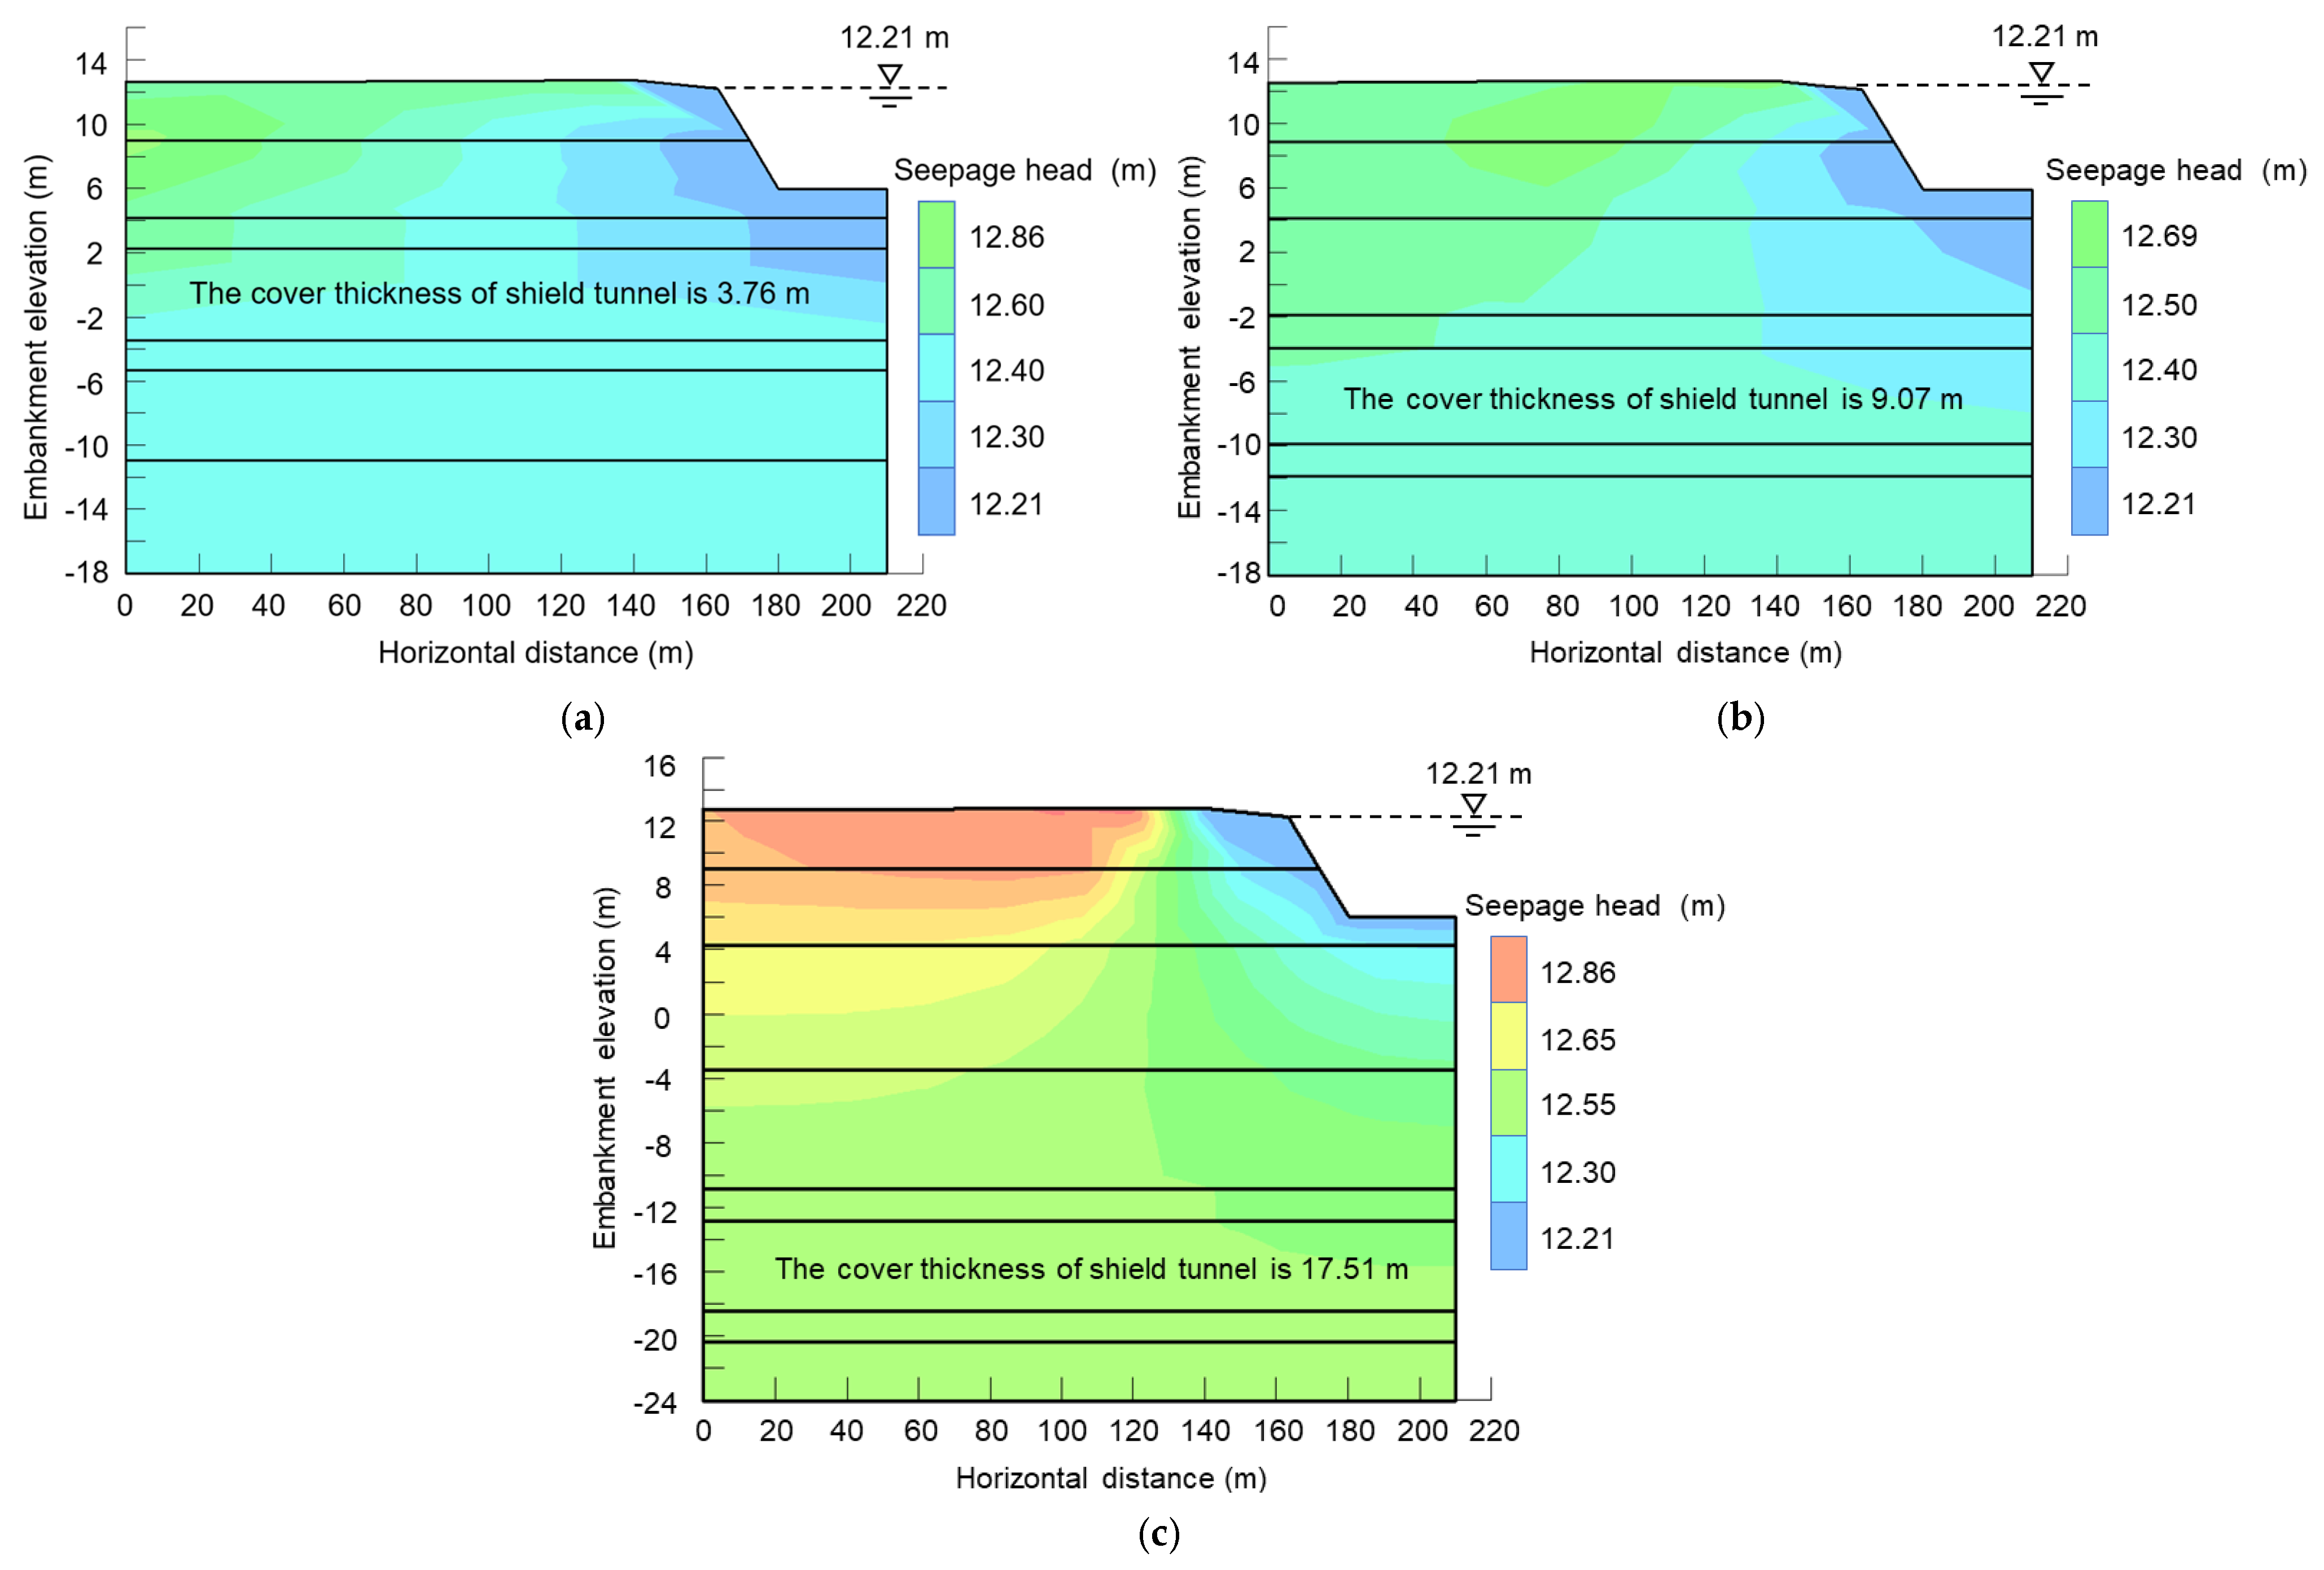
5.1.1. The Results of Seepage Head under Design Flood Level

From a general perspective, the seepage head is smaller the closer it is to the river embankment, and it gradually grows larger the farther it is from the river embankment. This is given as the numerical model makes the top of the slope a zero pressure hydraulic boundary, and the water flow path from the embankment to the river flow, which needs to conquer soil resistance causing the seepage head loss and enhances further the flow of seepage head loss. It is observed that the seepage head contours within the disturbance zone of the underwater shield tunnel with different burial depths are vertical. Consider Figure 3a as a case study, the seepage head within the disturbance zone of the underwater shield tunnel cutting through the powdered clay layer has almost no changes in the vertical direction and only gradually decreases in the horizontal direction, and the seepage head distribution below the disturbance zone changes drastically.
According to Figure 4, the submerged shield tunnel cover thickness of 9.07 m has a maximum seepage head of 12.69 m, which is somewhat less than the maximum seepage head for the 3.76 m and 17.51 m submerged tunnel cover thicknesses. The seepage head contour in Figure 3a is nearly vertical within the soil near the top of the embankment slope, indicating that there is still a significant amount of horizontal seepage at this location. When the underwater tunnel overburden thickness is shallow, the tunnel has a greater impact on the embankment seepage field distribution. The analysis’s findings index that the submerged shield tunnel influences the distribution of seepage head on the river embankment and that the impacts are larger on the seepage field the shallower the overburden thickness.

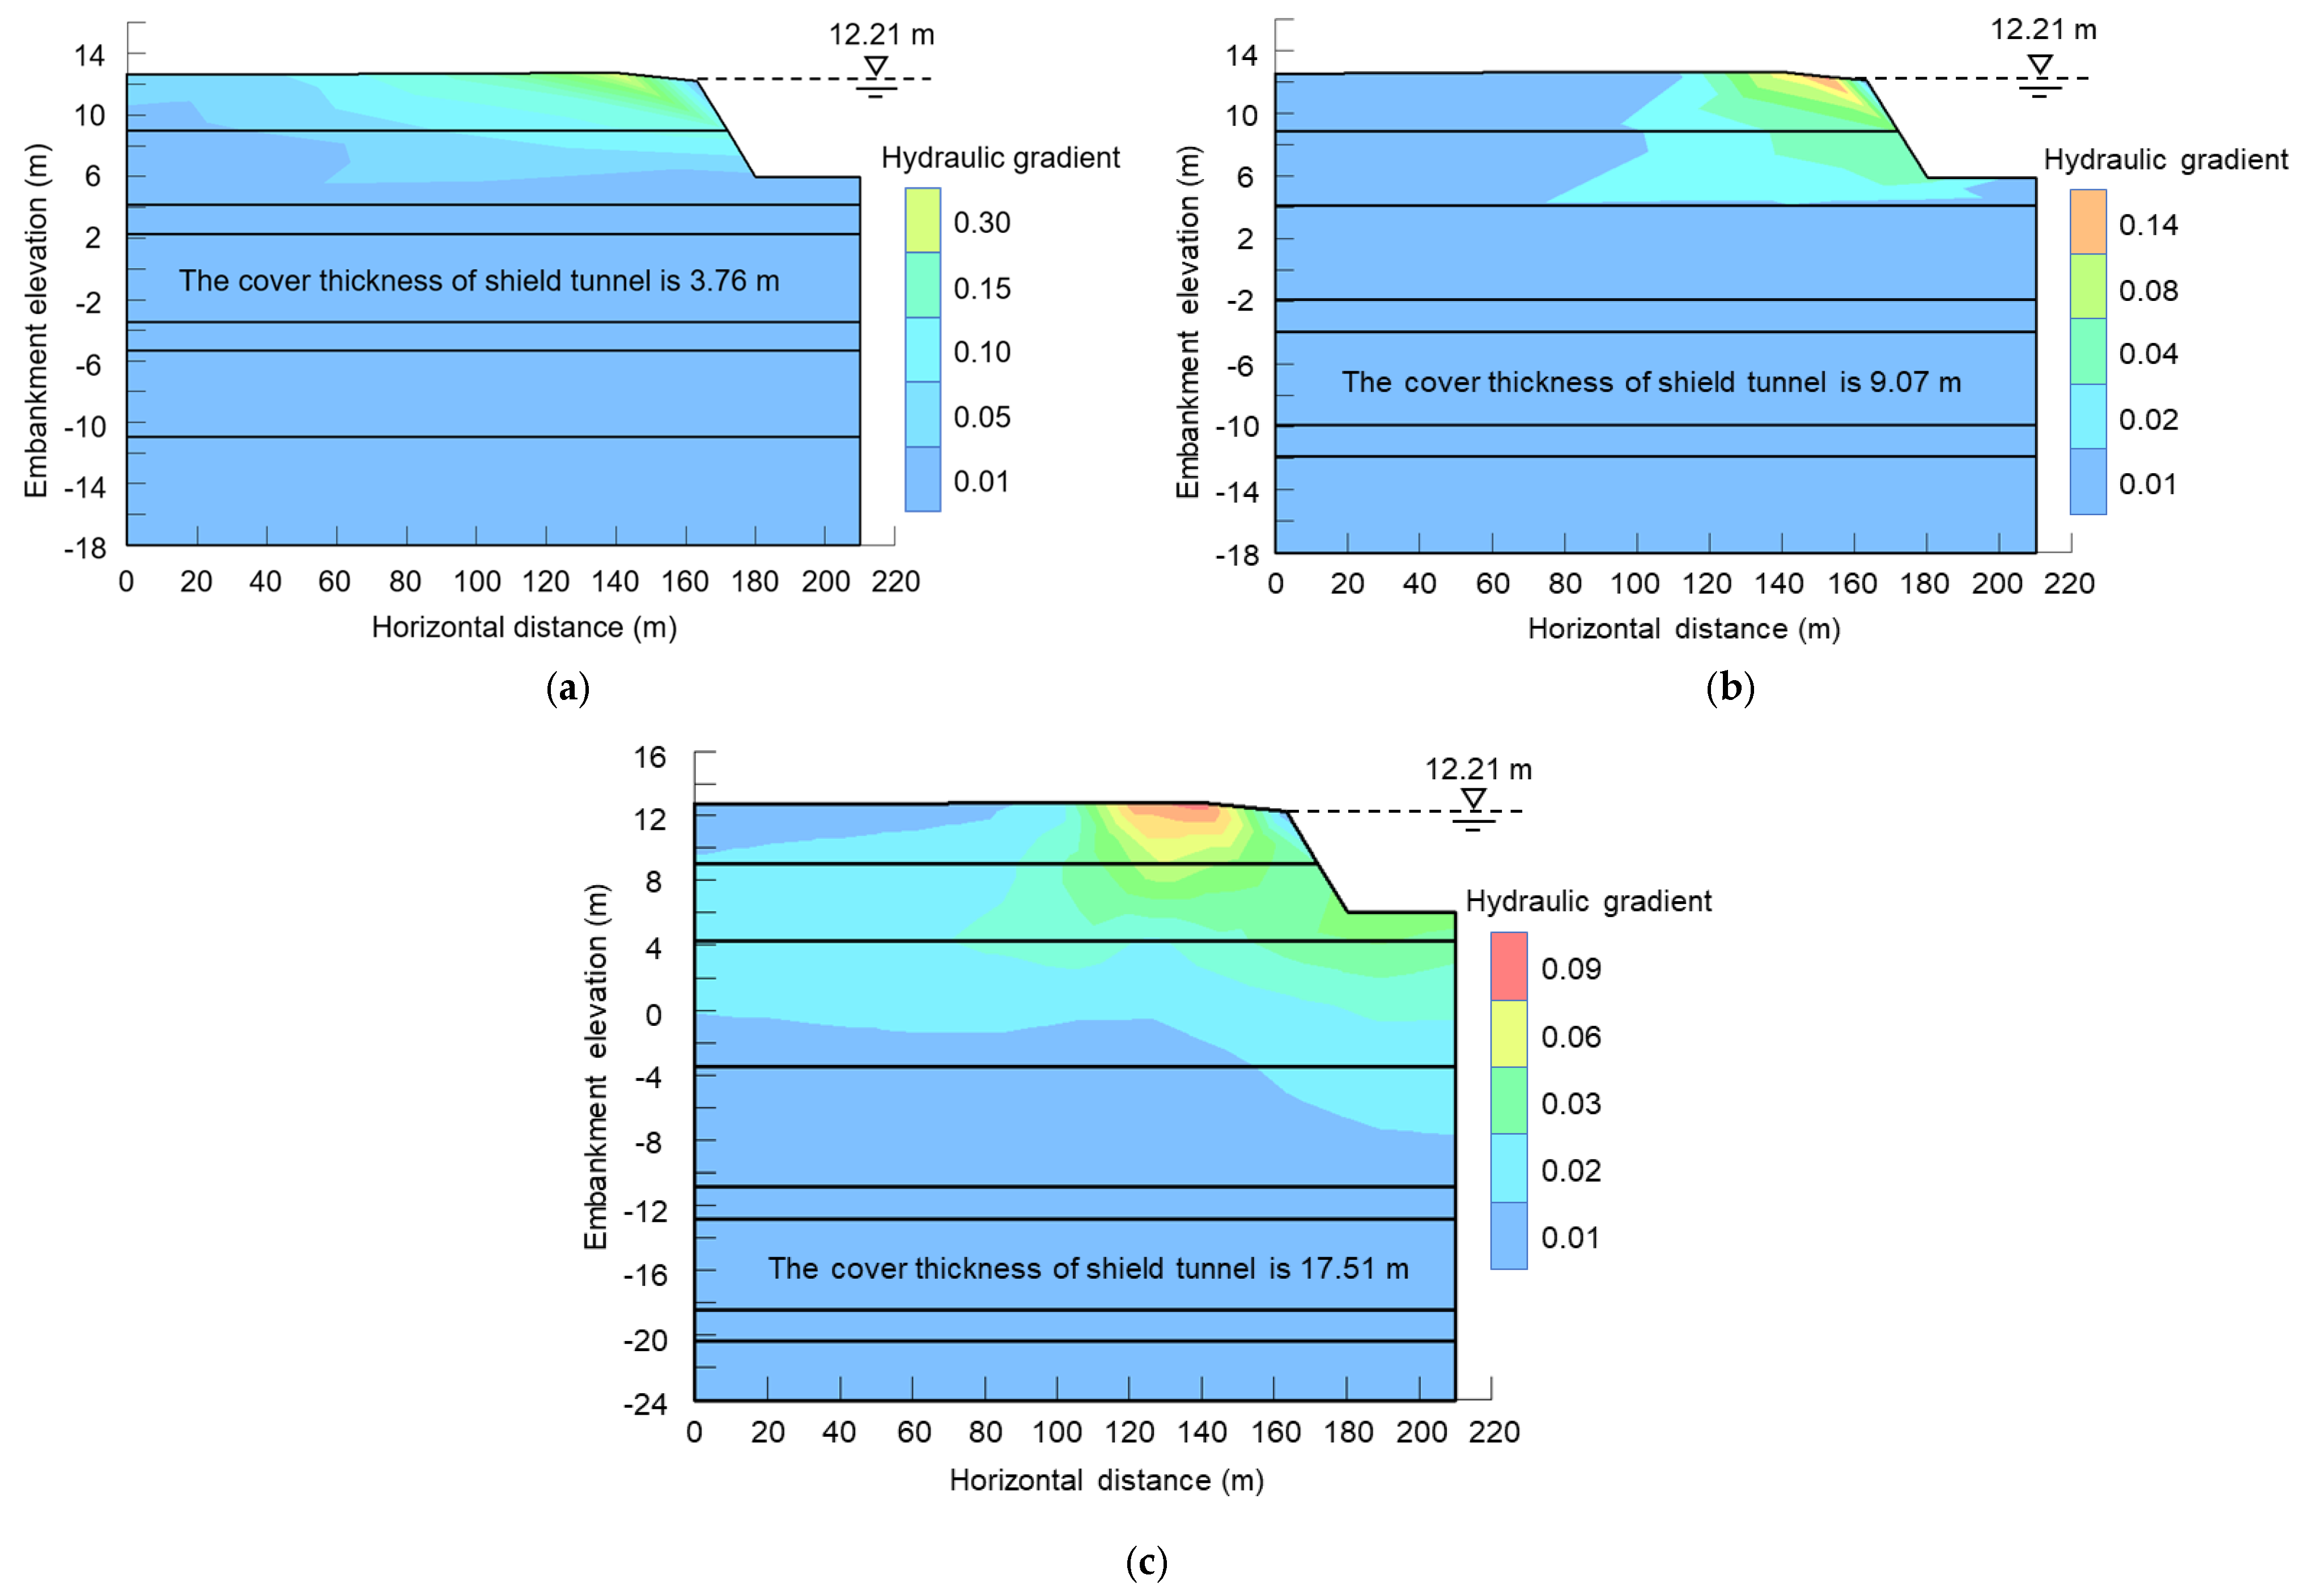
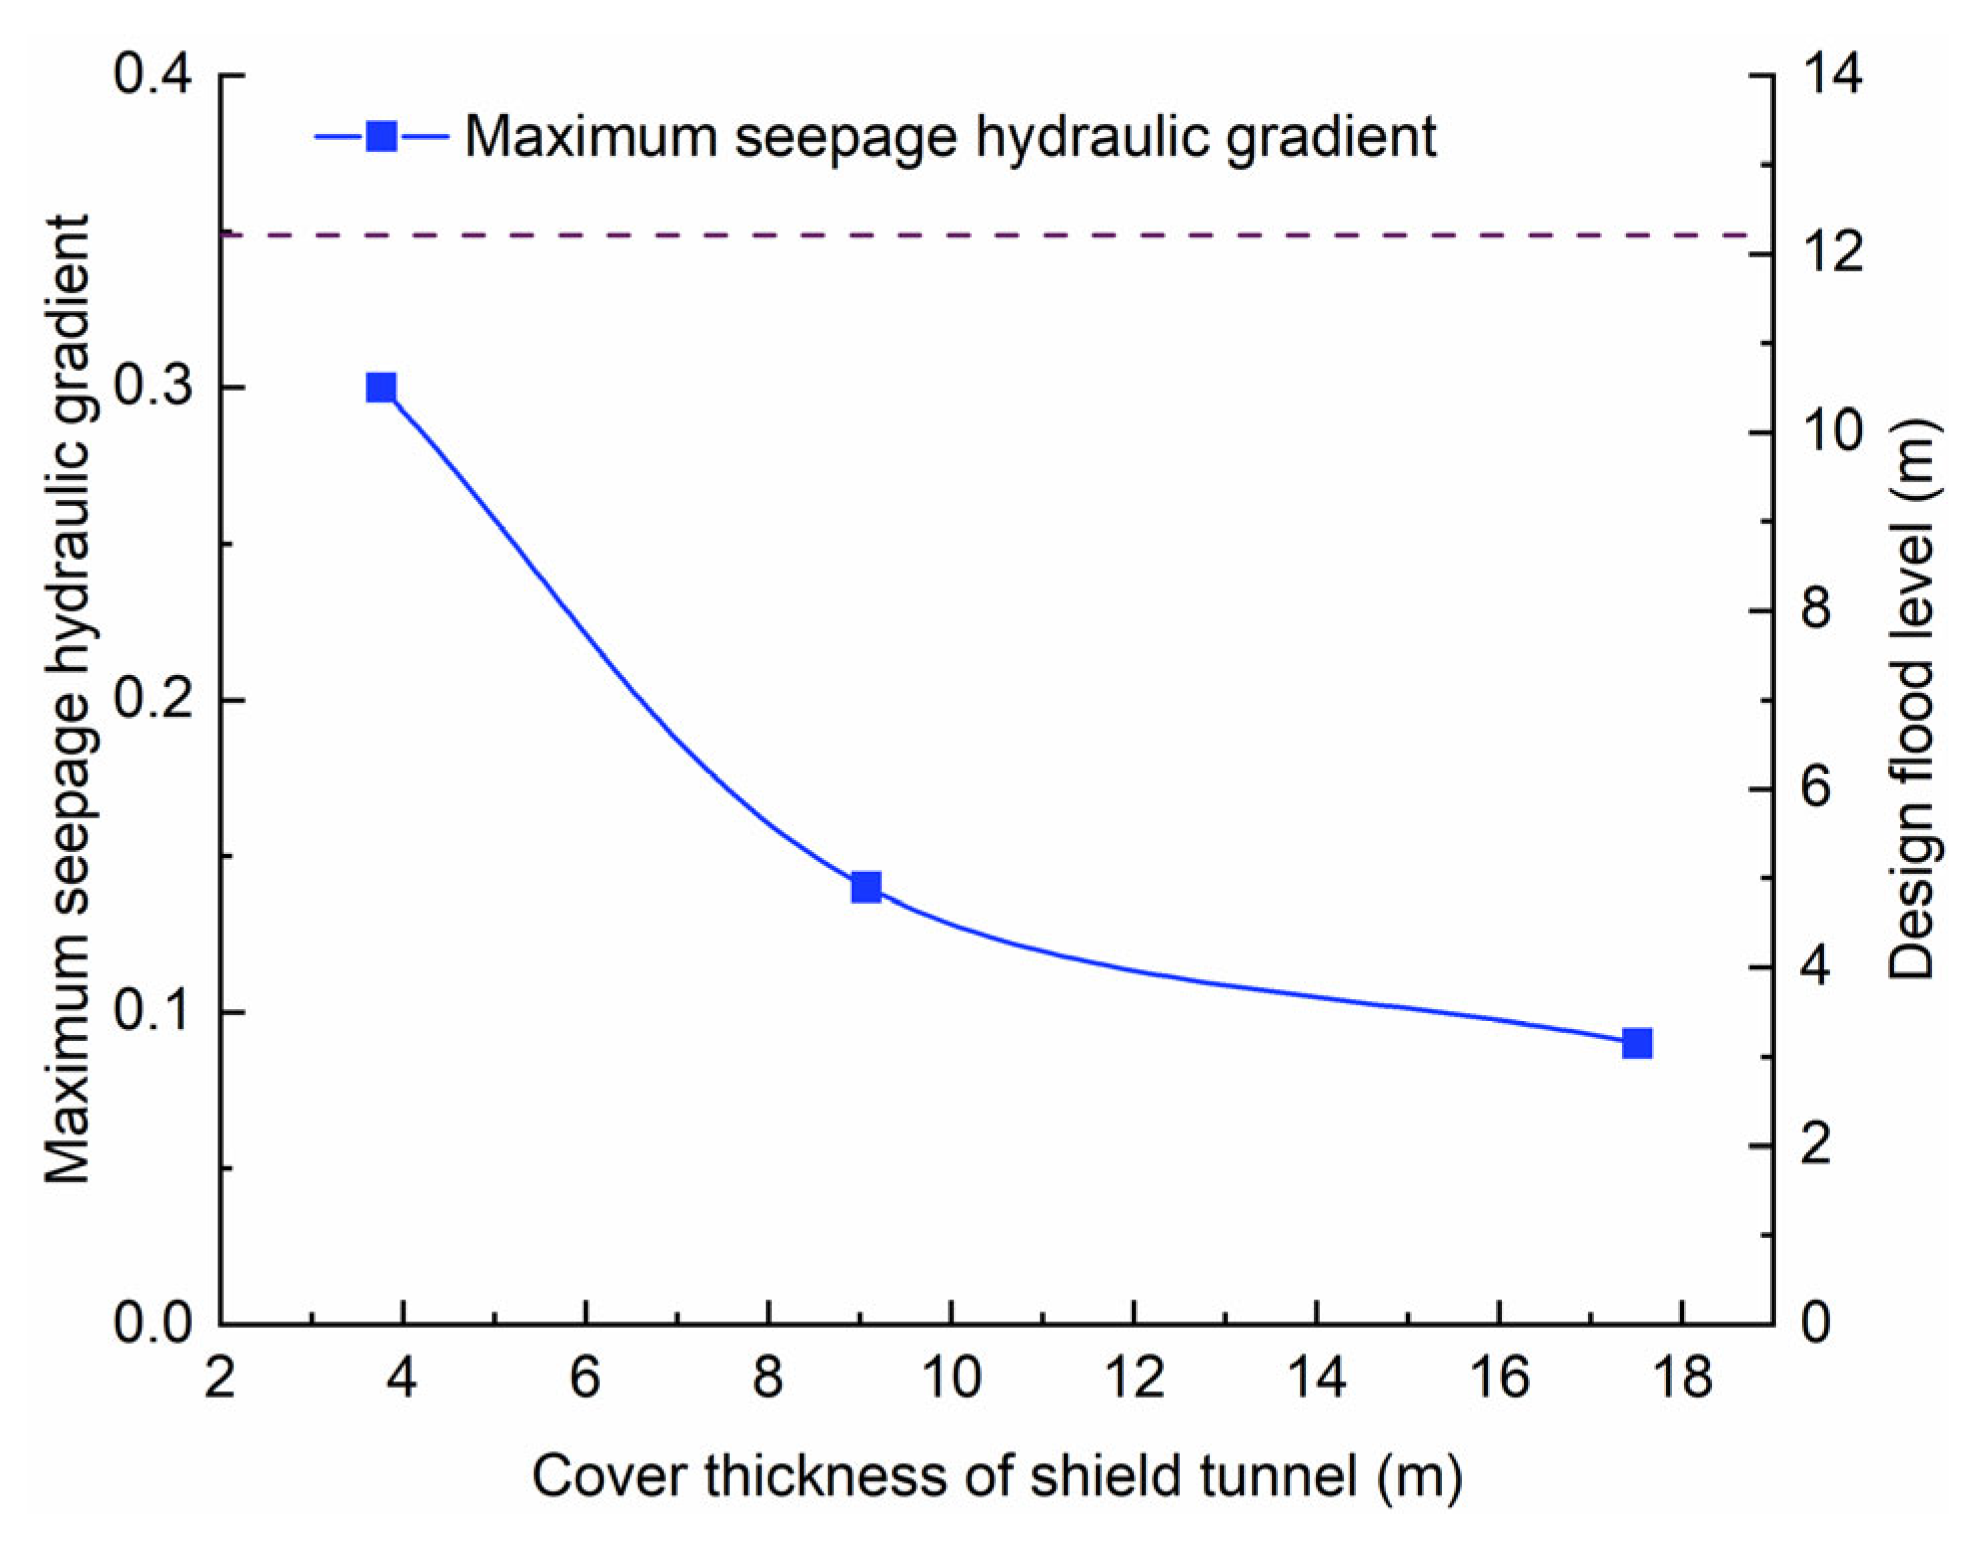
5.1.2. The Results of Seepage Hydraulic Gradient under Design Flood Level

To examine the change in the infiltration hydraulic gradient of the river embankment under various overburden thickness excavation in the underwater shield tunnel at the design flood level condition (100-year event), simulation results from the numerical calculation model of steady seepage are utilized (Figure 5). The top of the river embankment, there remaining violent water flow, is that the infiltration damage occurs at a high level of the water, according to calculation findings, and it is safer to regulate the infiltration hydraulic gradient within 0.30 in accordance with the relevant specification [45]. The findings indicate that when excavating at 3.76 m, the maximum hydraulic gradient reaches 0.30 and there is a likelihood of infiltration damage. In contrast, the infiltration hydraulic gradient of the river embankment under other overburden thickness conditions is below the permitted hydraulic gradient, and there is no immediate risk of infiltration damage on the river embankment.
Figure 6 provides a detailed comparison and analysis of the results of river embankment infiltration hydraulic gradient for various shield tunnel cover thicknesses. The dotted line indicates the design flood level. (12.21 m). The maximum infiltration hydraulic gradient is 0.30 for underwater shield tunnel cover thickness of 3.76 m, 0.14 for underwater shield tunnel cover thickness of 9.07 m, and 0.09 for underwater shield tunnel cover thickness of 17.51 m. The comparison consequences reveal that the overburden thickness rises 141% when 3.76 m to 9.07 m, whereas the river embankment infiltration hydraulic gradient falls by 53.3%. From 9.07 m to 17.51 m, the overburden thickness of the shield tunnel rises 93.1%, while the maximum infiltration hydraulic gradient of the river embankment falls 35.7%. The maximum hydraulic gradient under the design flood level gradually decreases when the burial thickness of the underwater shield tunnel rises.

5.2. Analysis of the Impact of Underwater Shield Tunnel on River Embankment Seepage Stability under Sudden Drop of Design Flood Level

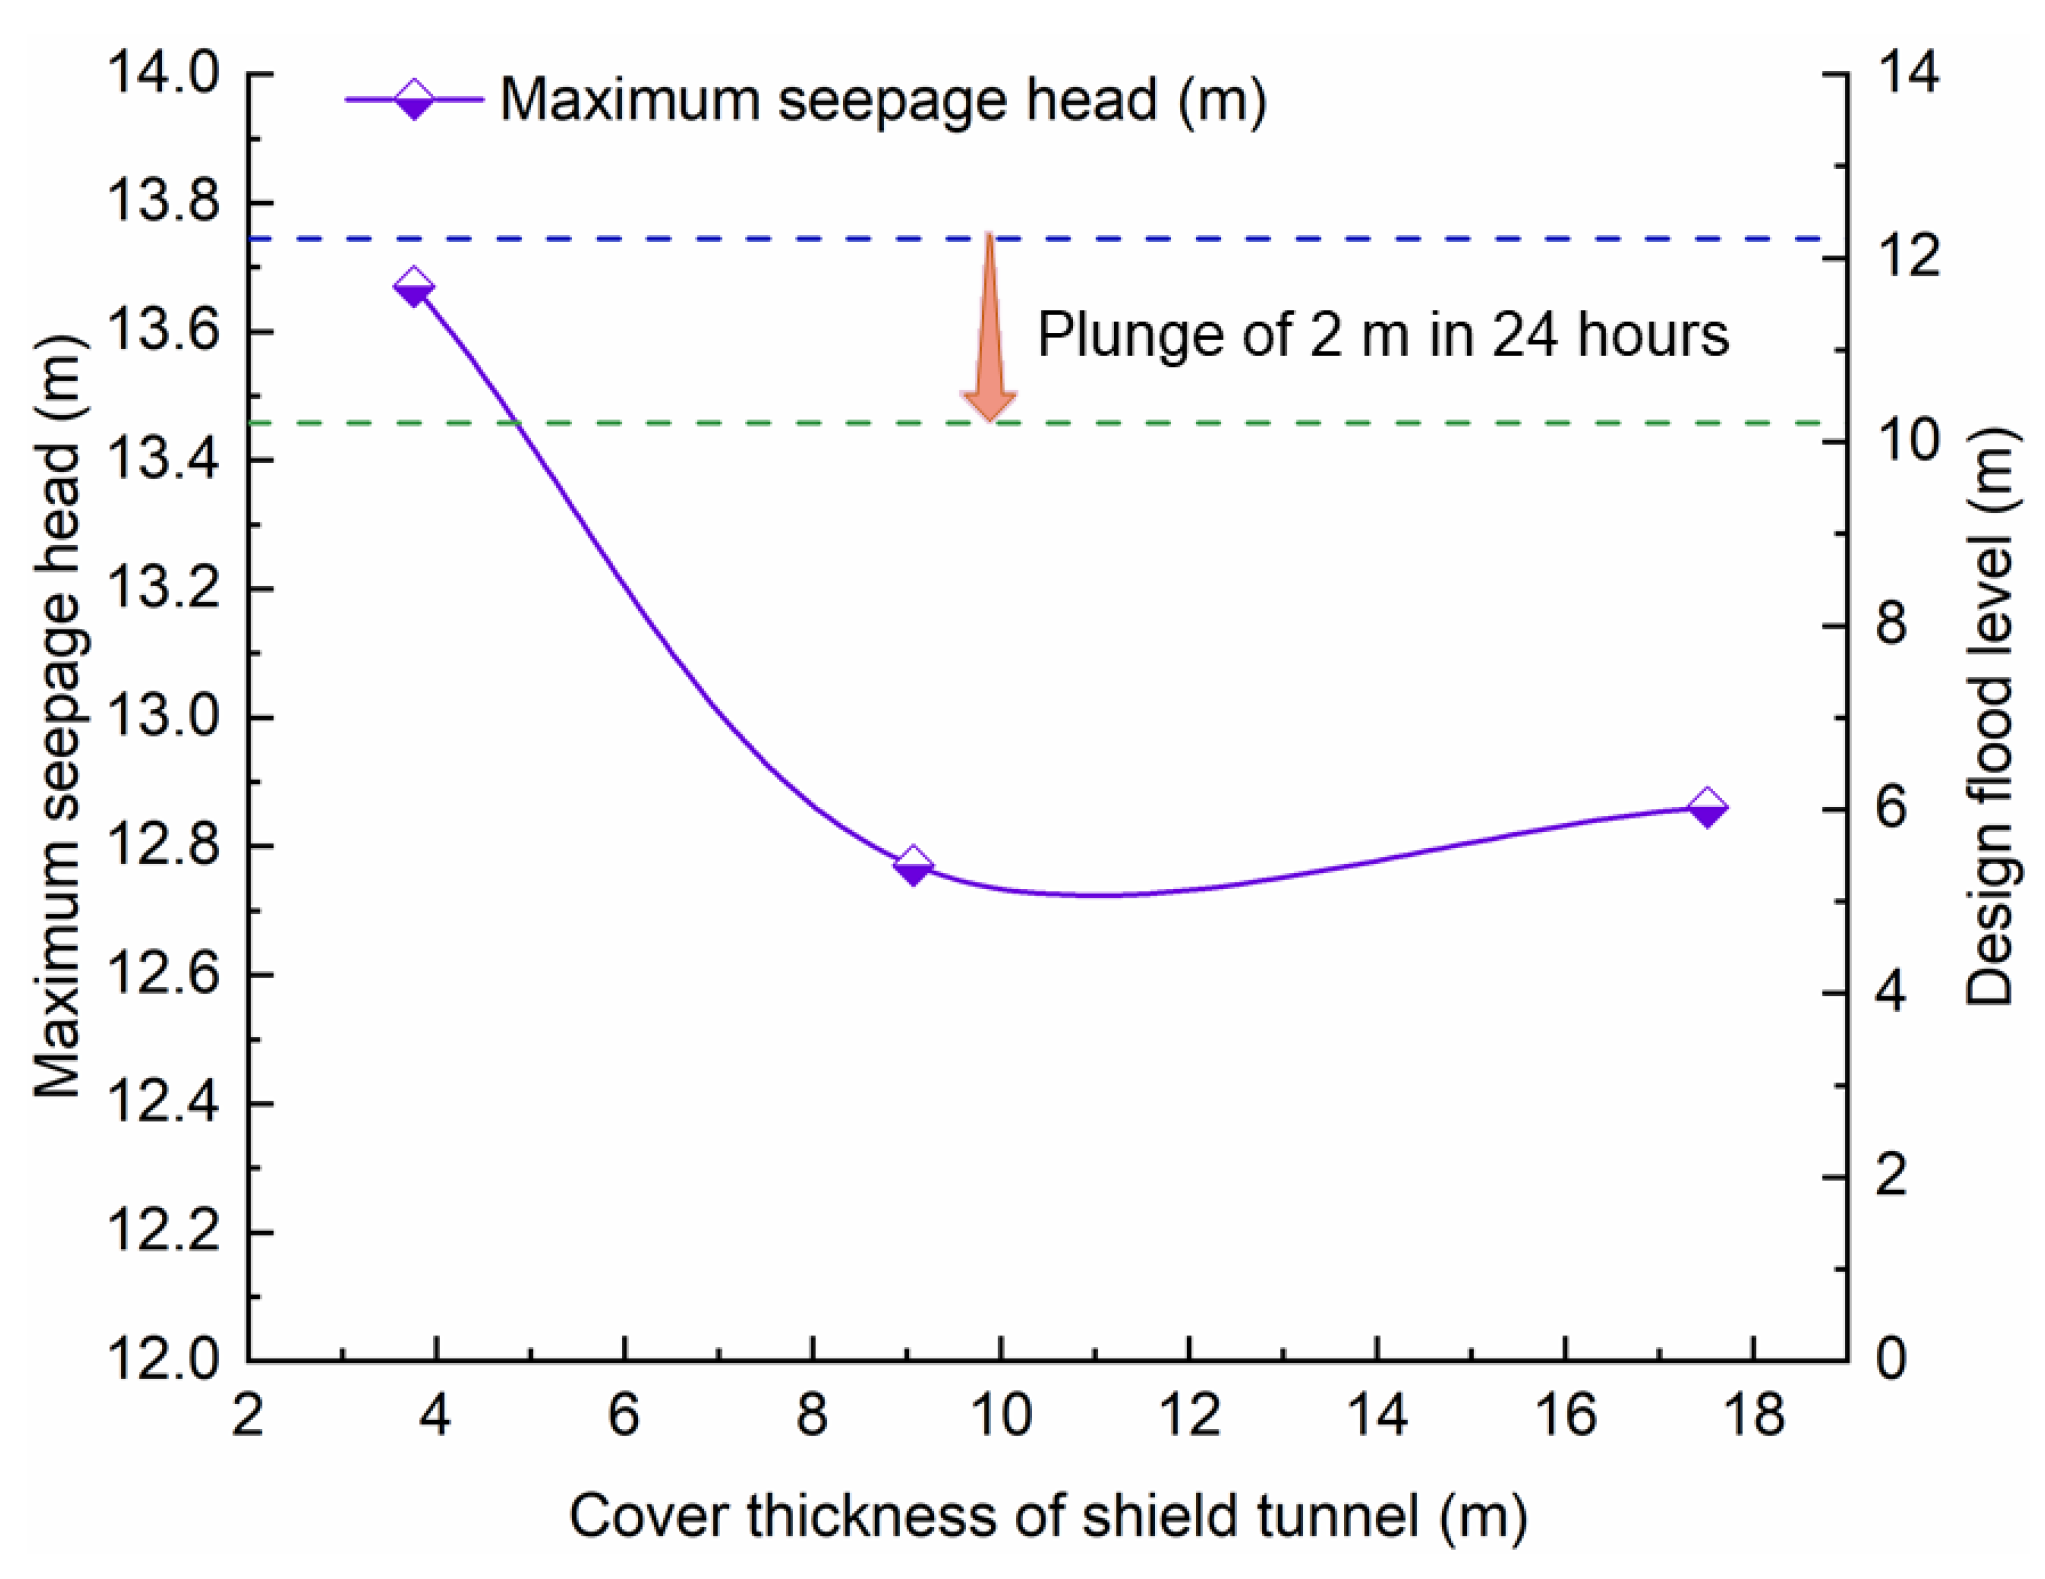
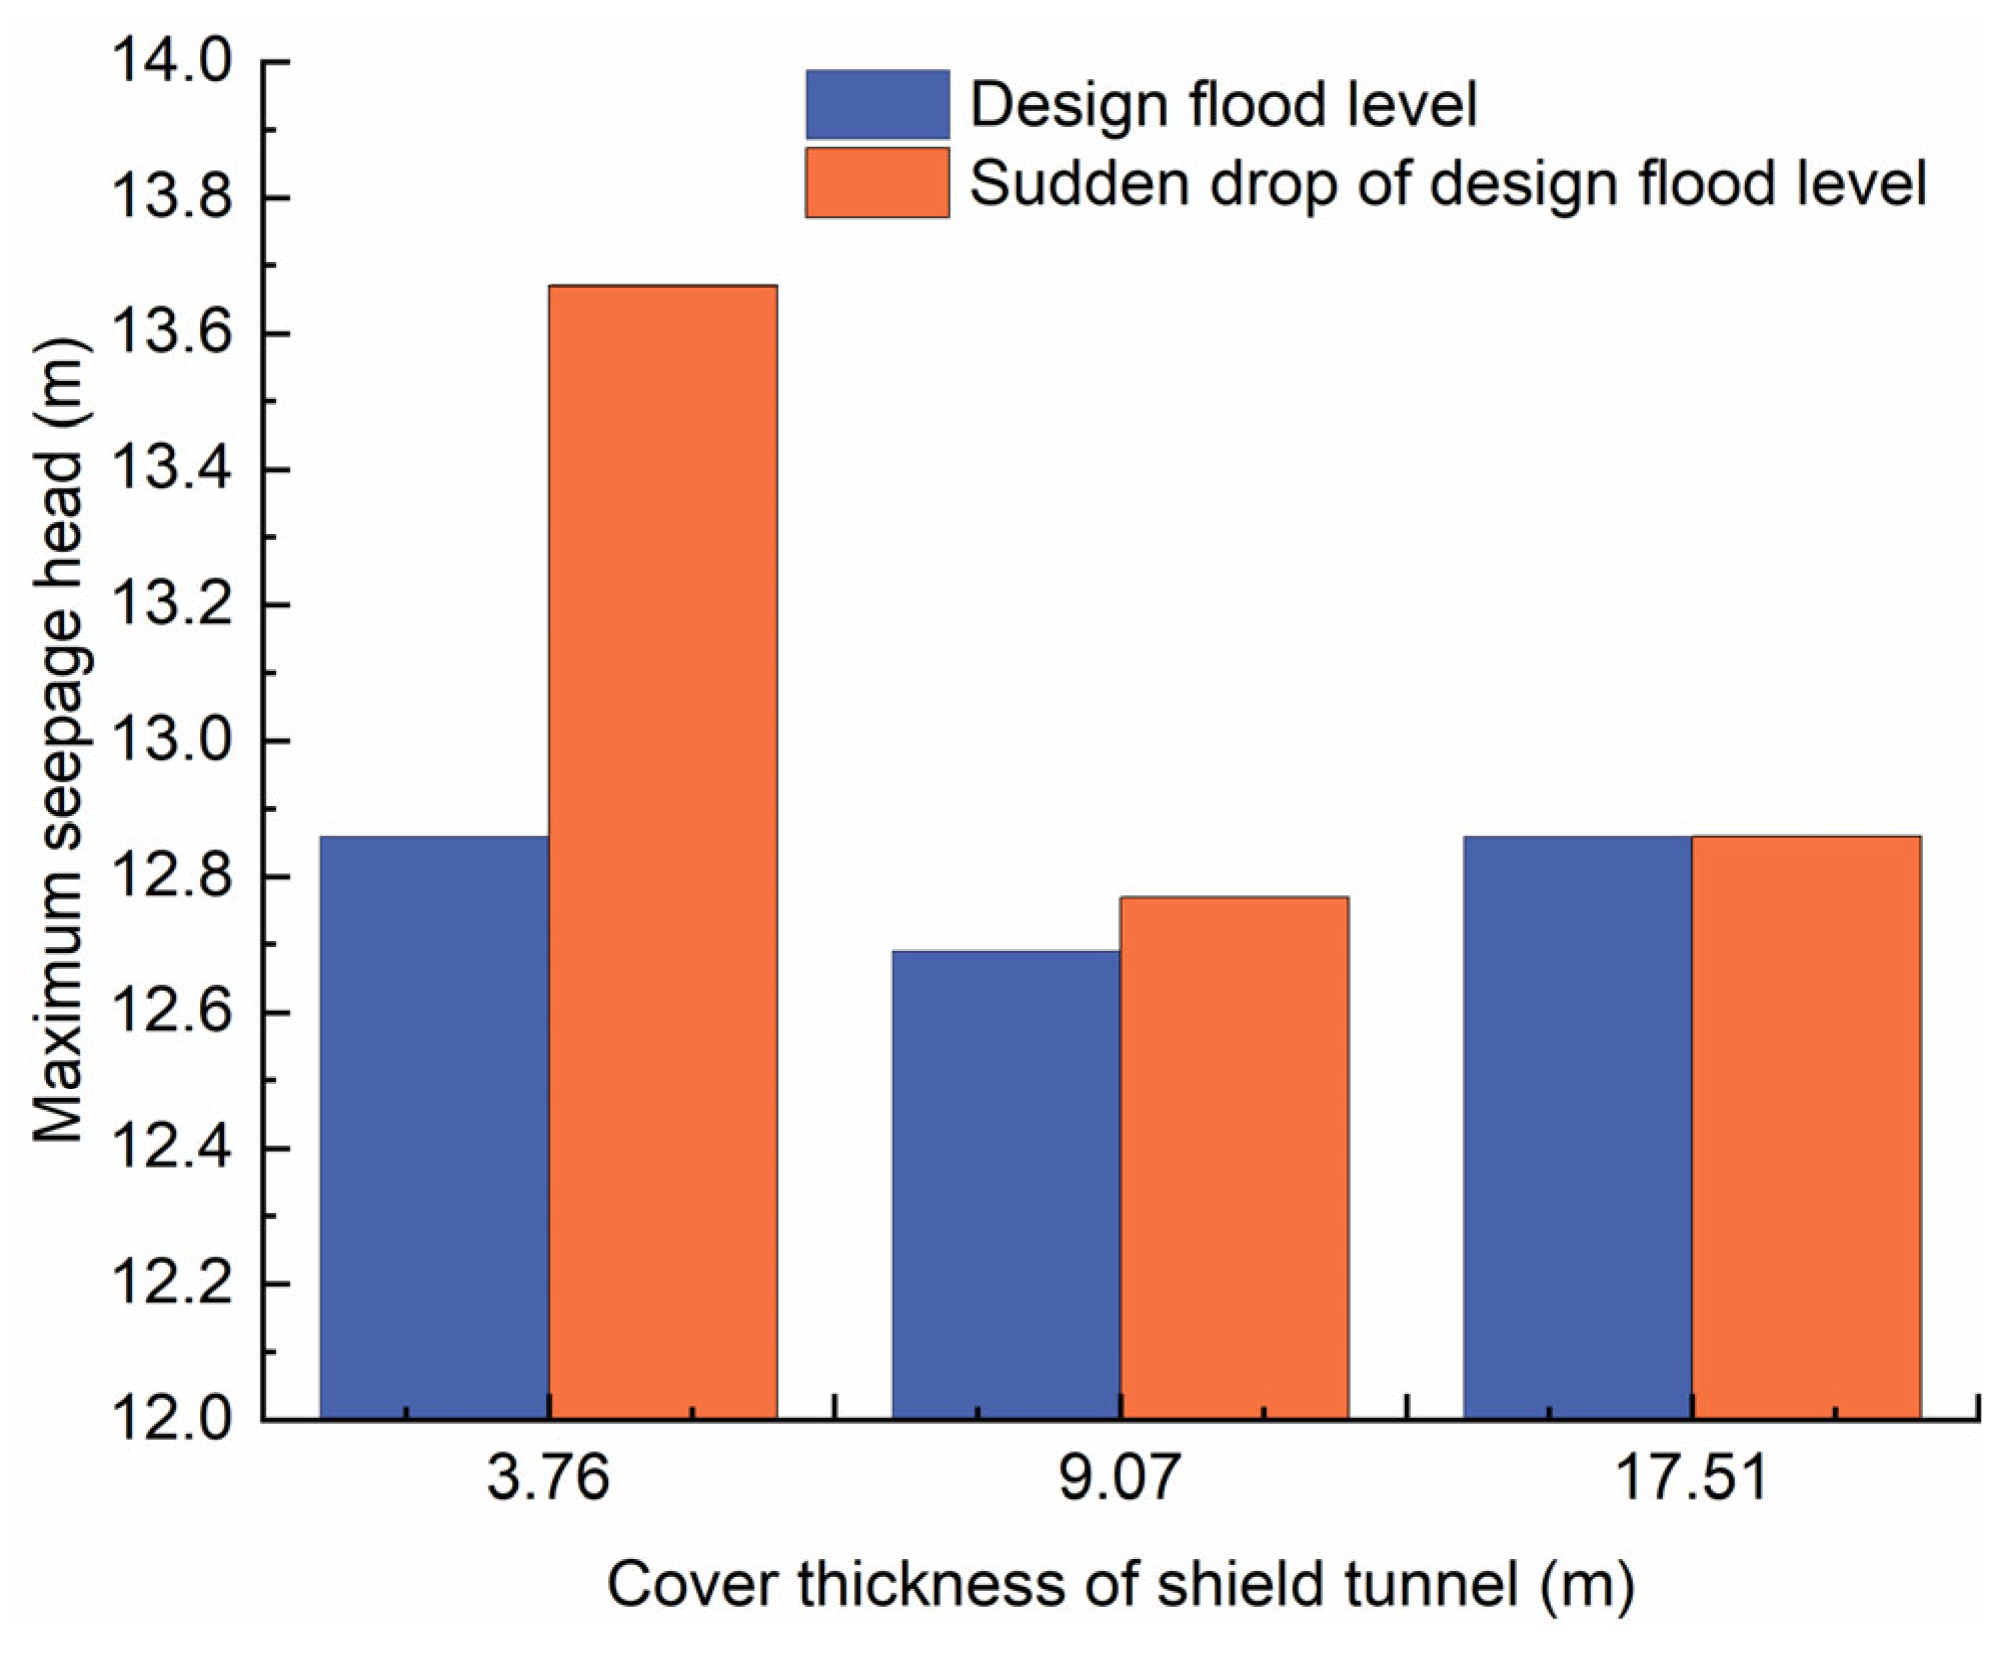
5.2.1. The Results of Seepage Head under Sudden Drop of Design Flood Level

Based on the preliminary analysis of Figure 7, the maximum seepage head value at the underwater shield tunnel overburden thickness of 3.76 m is 13.67 m, the highest seepage head value at the underwater shield tunnel overburden thickness of 9.07 m is 12.77 m, and the maximum seepage head value is 12.86 m at the underwater shield tunnel overburden thickness of 17.51 m.
Figure 8 shows that the maximum seepage head values within the river embankment decrease by 6.6% when the underwater shield tunnel overburden thickness increases by 141% (from 3.76 m to 9.07 m). Moreover, Figure 8 shows that the maximum seepage head of the river embankment increases by 0.7% when the underwater shield tunnel overburden thickness increases by 93.1% (from 3.76 m to 9.07 m). The dotted line indicates the design flood level plunges by 2 m in 24 h. The findings demonstrate that the shallow submerged shield tunnel under unsteady seepage conditions influences both the maximum seepage head and the spatial distribution of the seepage head.
Additionally, it compares the maximum seepage head values of the river embankment under various hydraulic conditions in Figure 9. When the underwater shield tunnel overburden thickness is 3.76 m, the maximum seepage head value under the sudden drop of design flood level is 6.3% higher than the maximum seepage head value under the design flood level. When the underwater shield tunnel overburden thickness is 9.07 m, the maximum seepage head value is 0.63% greater than the maximum head value under the design flood level. The maximum seepage head values for the sudden drop of design flood level and design flood level are the same for the underwater shield tunnel overburden thickness of 17.51 m. The findings demonstrate that when the shield tunnel overburden thickness is shallow, the maximum seepage head value under a sudden drop in design flood level is higher than that of the design flood level. According to the detailed analysis of the causes of the phenomenon, the reasons are that the maximum seepage head increases due to the rapid decline in water level and the low permeability of the soil in the river embankment, which prevents water from flowing out of the embankment in time to discharge.

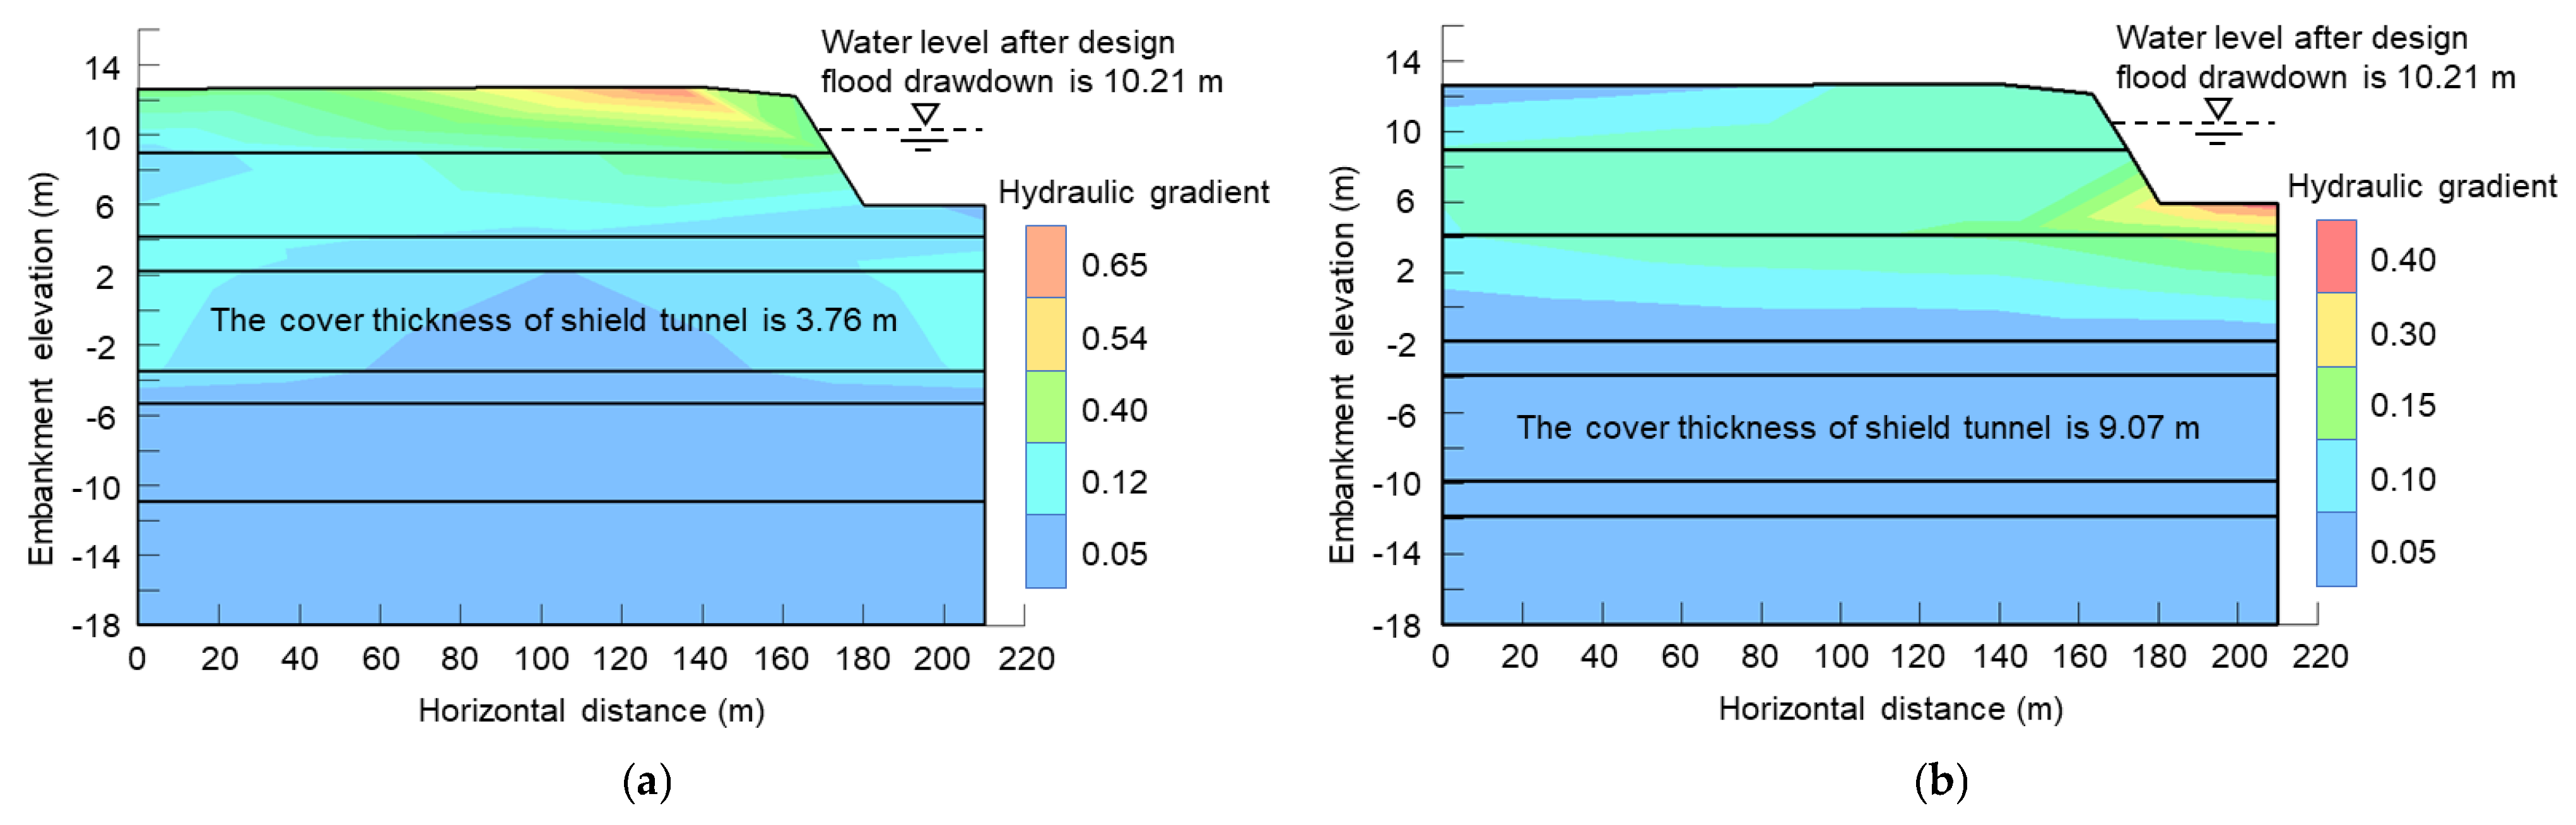
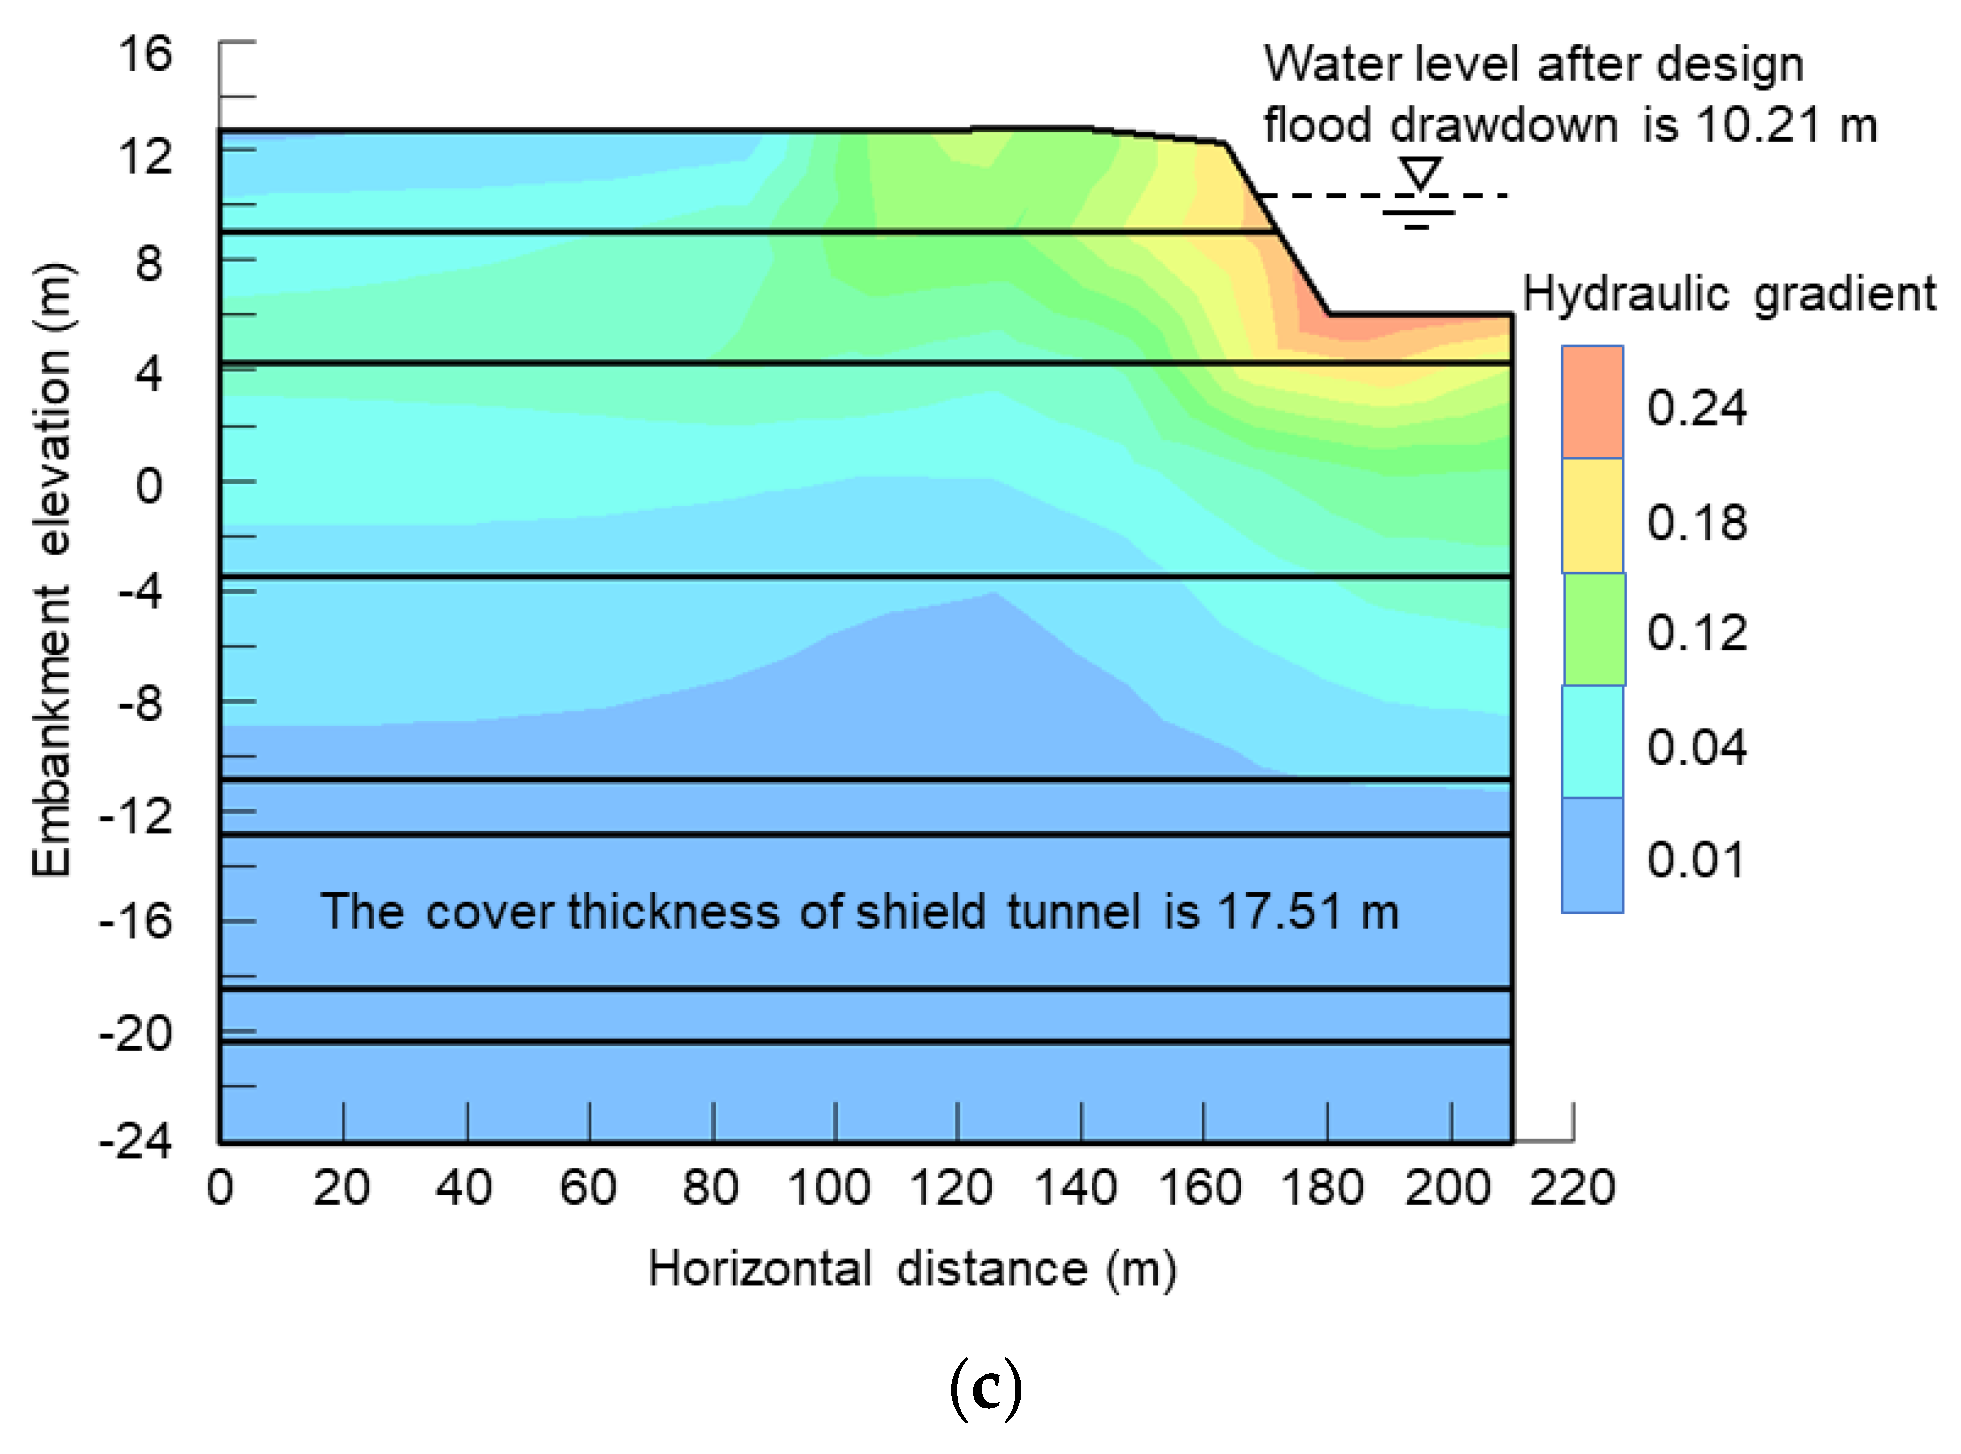
5.2.2. The Results of Seepage Hydraulic Gradient under Sudden Drop of Design Flood Level

Analyze the changing laws of infiltration hydraulic gradient of the river embankment of the shield tunnel excavated with different overburden thickness under a sudden drop of design flood level (a sudden drop of design flood level by 2 m in 24 h), according to simulation results of the numerical calculation of unsteady seepage (Figure 10). When the underwater shield tunnel overburden thickness is 3.76 m, the maximum infiltration hydraulic gradient is 0.65 and the maximum hydraulic gradient is at the top of the river embankment. When the underwater shield tunnel overburden thickness is 9.07 m, the maximum infiltration hydraulic gradient is 0.40 and the maximum hydraulic gradient is at the intersection of the river channel and the river embankment. The greatest infiltration hydraulic gradient value is 0.24 when the shield tunnel overburden thickness is 17.51 m, and the maximum hydraulic gradient is also found at the embankment and river channel converge. The maximum hydraulic gradient values for the underwater shield tunnel overburden thickness of 3.76 m and 9.07 m are 0.65 and 0.40 respectively, which exceed the allowable slope drop of the code. Under these two work conditions, the river embankment may sustain infiltration damage.
The maximum infiltration hydraulic gradient value continually declines with the increasing underwater shield tunnel overburden thickness, and this rule is consistent with the changing trend of the maximum hydraulic gradient under the parameters mentioned above for the design flood level. Comparing and analyzing the infiltration hydraulic gradient results in Figure 11, it can be reported that the underwater shield tunnel overburden thickness increases from 3.76 m to 9.07 m, and its maximum hydraulic gradient decreases by 39.4%. While it increases from 9.07 m to 17.51 m, its overburden thickness increases by 93.1%, and the embankment’s maximum infiltration hydraulic gradient decreases by 40%. And the dotted line indicates the design flood level plunges by 2 m in 24 h in Figure 11.
To investigate the influences of various seepage circumstances and tunnel covering thickness on the maximum infiltration hydraulic gradient of the river embankment, the outcomes for the maximum hydraulic gradient are further compared (Figure 12). When the underwater shield tunnel overburden thickness is 3.76 m, the maximum infiltration hydraulic gradient under a sudden drop of the design flood level is 120% greater than the maximum infiltration hydraulic gradient under the design flood level. When the underwater shield tunnel overburden thickness is 9.07 m, the maximum infiltration hydraulic gradient under the sudden drop of the design flood level is 186% greater than the value under the design flood level. When the underwater shield tunnel overburden thickness is 17.51 m, the maximum infiltration hydraulic gradient under the design flood level is 186% greater than the value under the design flood level. This demonstrates that when the underwater shield tunnel overburden thickness increases, the maximum hydraulic gradient under the sudden drop of design flood level condition is significantly greater than the design flood level condition, which is caused by the flood level plunge creating a large hydraulic head difference between the groundwater and surface water body, resulting in the larger hydraulic gradients.
Moreover, when the underwater shield tunnel overburden thickness is 3.76 m, the maximum infiltration hydraulic gradient occurs at the top of both the river embankment near the shoulder under the design flood level condition and sudden drop of design flood level condition. When the underwater shield tunnel overburden thickness is 9.07 m and 17.51 m, the maximum infiltration hydraulic gradient occurs at the junction between the river channel and the river embankment under the sudden drop of design flood level condition, while the maximum hydraulic gradient always occurs at the top of the river embankment under the design flood level. The outcome reveals that when the underwater shield tunnel overburden thickness is modest, the maximum hydraulic gradient value appears in the top region surrounding the river embankment. When the underwater shield tunnel overburden thickness is large, the maximum hydraulic gradient appears at the junction of the river channel and the river embankment. The simulation results are consistent with the results of unsteady seepage physical tests performed by Duan et al. [46], i.e., they confirm that the maximum infiltration hydraulic gradient is generally near the water level of the surface water body. Thus, the maximum infiltration hydraulic gradient is easily at the junction location between the river channel and the river embankment when the water level drops abruptly.

5.3. Analysis of the Effect of Shield Construction Disturbance on River Embankment Seepage Stability

The surrounding soil is readily disturbed to some level during shield tunnel construction, and the impacts of construction disturbance on the seepage stability of river embankment are modeled for varied overburden thicknesses in response to increased construction disturbance. In this section, the permeability coefficients of the disturbance zone are increased by raising orders of magnitude to generalize the growth of disturbance, and a model for calculating the seepage stability of river embankment with different overburden thickness under the design flood level and sudden drop of design flood level is established. The stratigraphic parameters used in the calculation are shown in Table 1.
Figure 13 illustrates the findings of infiltration hydraulic gradient under the design flood level and design flood level plunging circumstances respectively, and compares them in detail to the infiltration hydraulic gradient results of Figure 6 and Figure 11. In comparison to the previous results for hydraulic gradient when the permeability coefficient of the disturbance zone is raised by one order of magnitude, the maximum hydraulic gradient rises when the permeability coefficient of the disturbance zone is increased by two orders of magnitude. Under design water level conditions, the underwater shield tunnel overburden thickness is 3.76 m, with the maximum hydraulic gradient increasing by 10%. The underwater shield tunnel’s overburden thickness is 9.07 m, with the maximum hydraulic gradient increasing by 2.9%. With the underwater shield tunnel overburden thickness of 17.51 m, the maximum hydraulic gradient does not increase. However, the maximum hydraulic gradient increases by 15% when the shield tunnel overburden thickness is 3.76 m, 12.5% when the shield tunnel overburden thickness is 9.07 m and 8.3% when the shield tunnel overburden thickness is 17.51 m under the design flood level plunging scenario. The results show that when the permeability coefficient of the disturbed zone grows, the maximum hydraulic gradient increases, while the influence of shield disturbance on the permeability hydraulic gradient decreases as the overburden thickness increases.

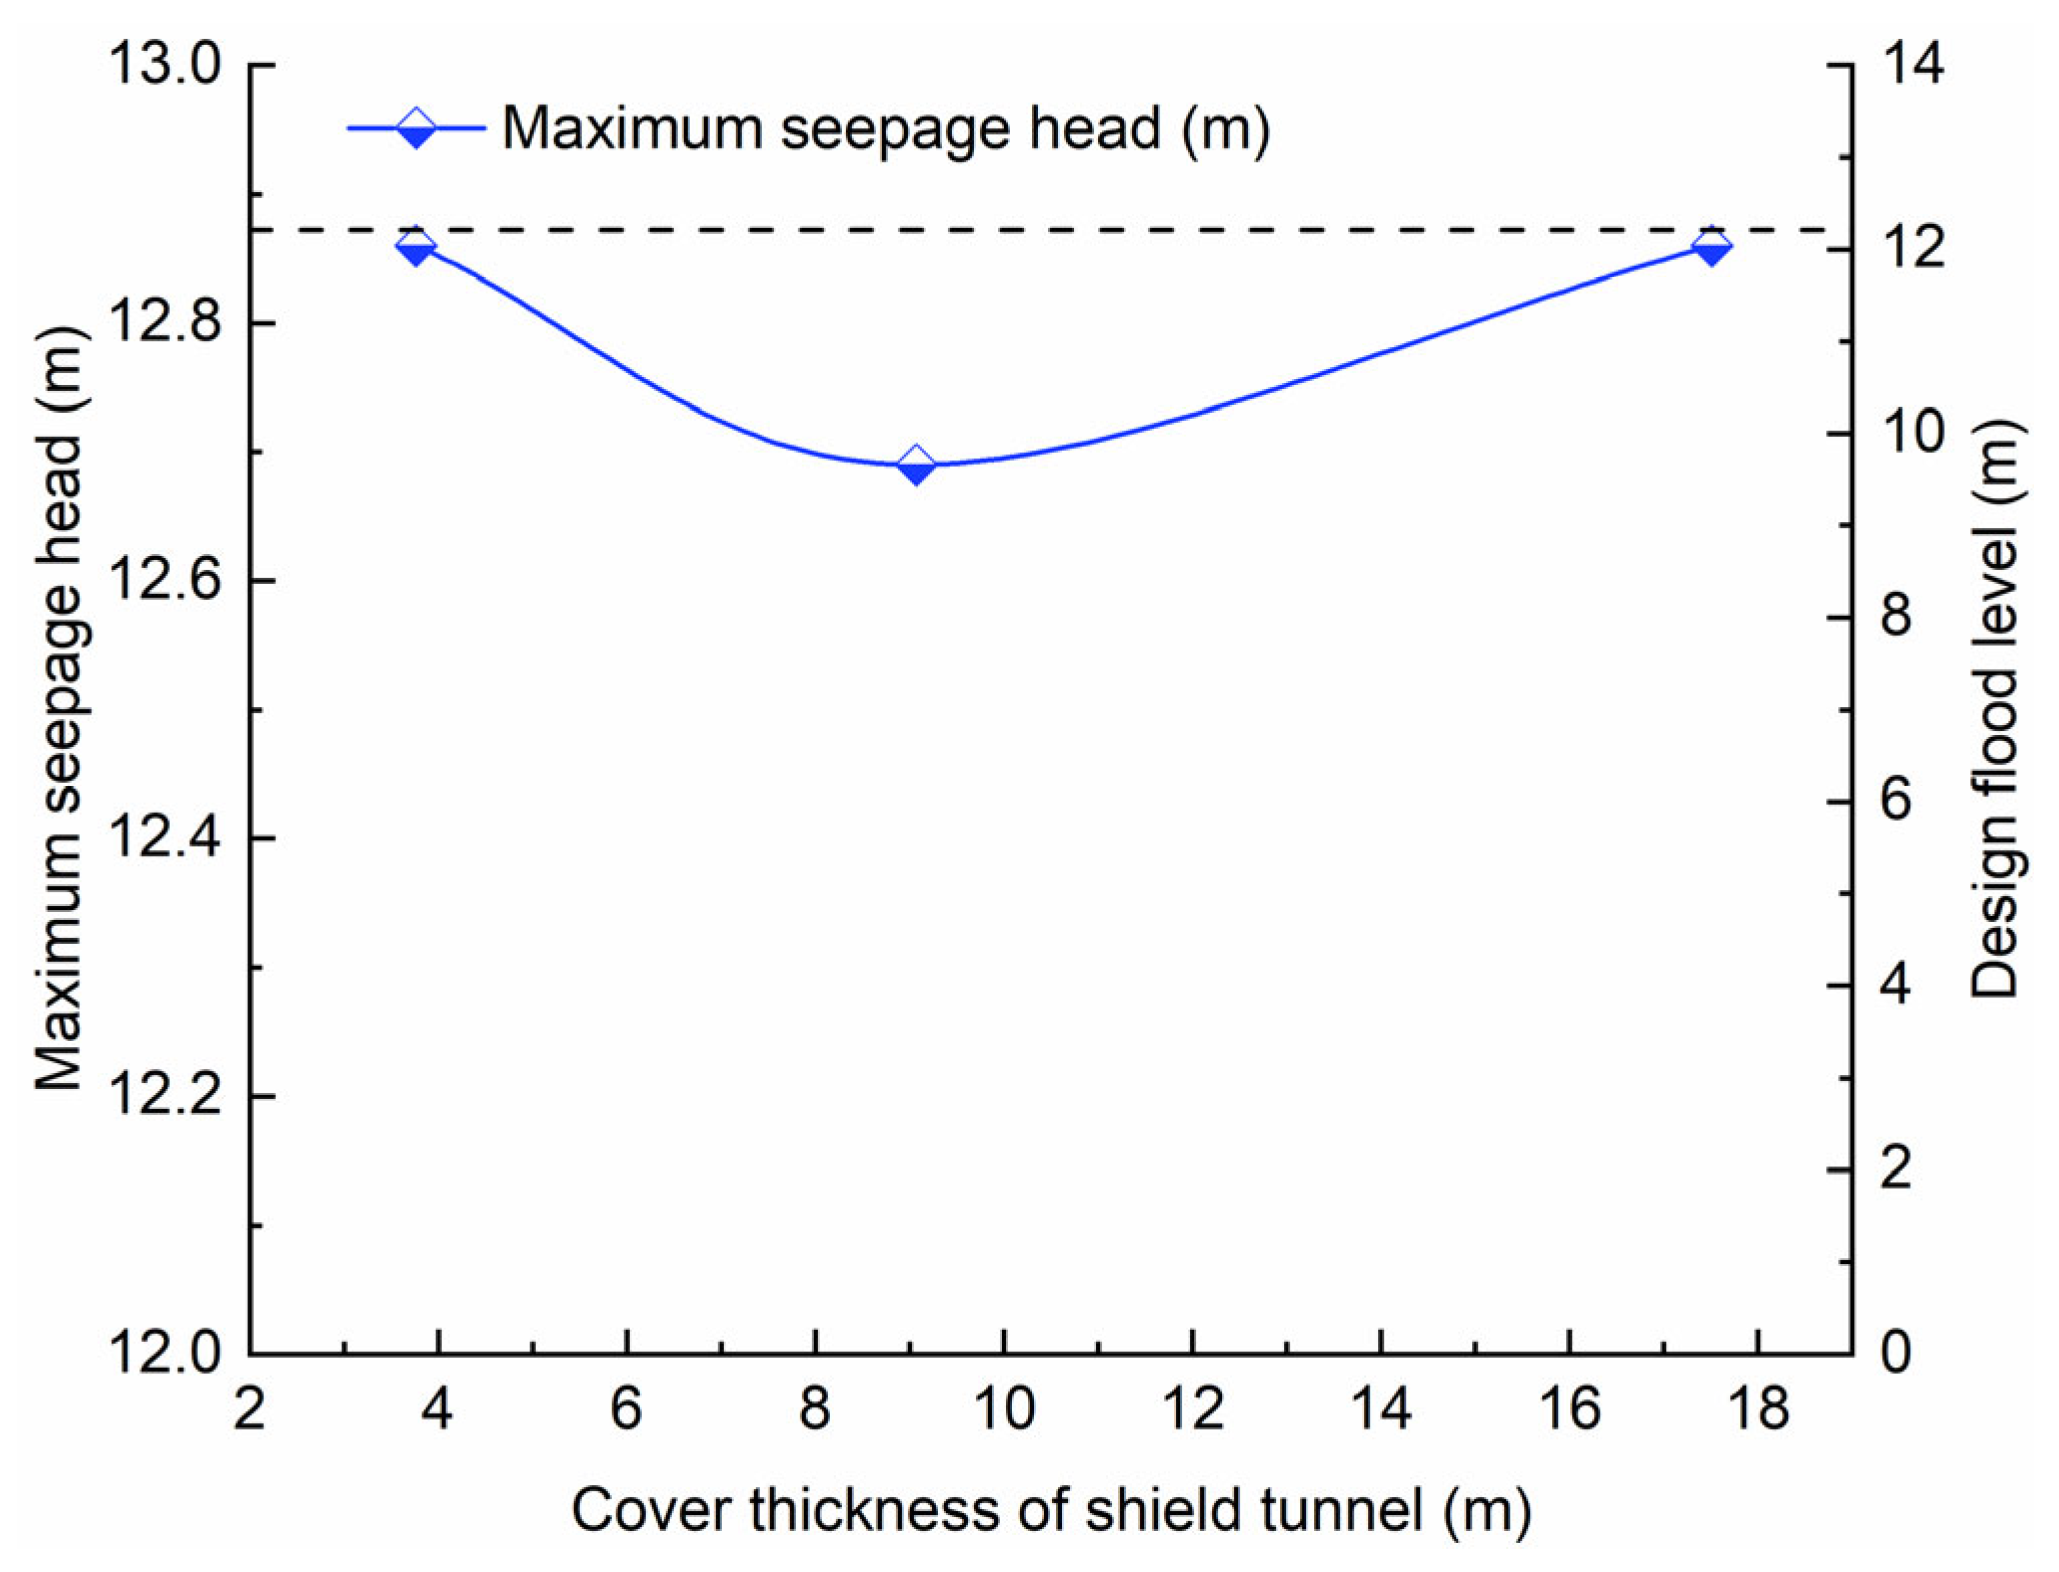
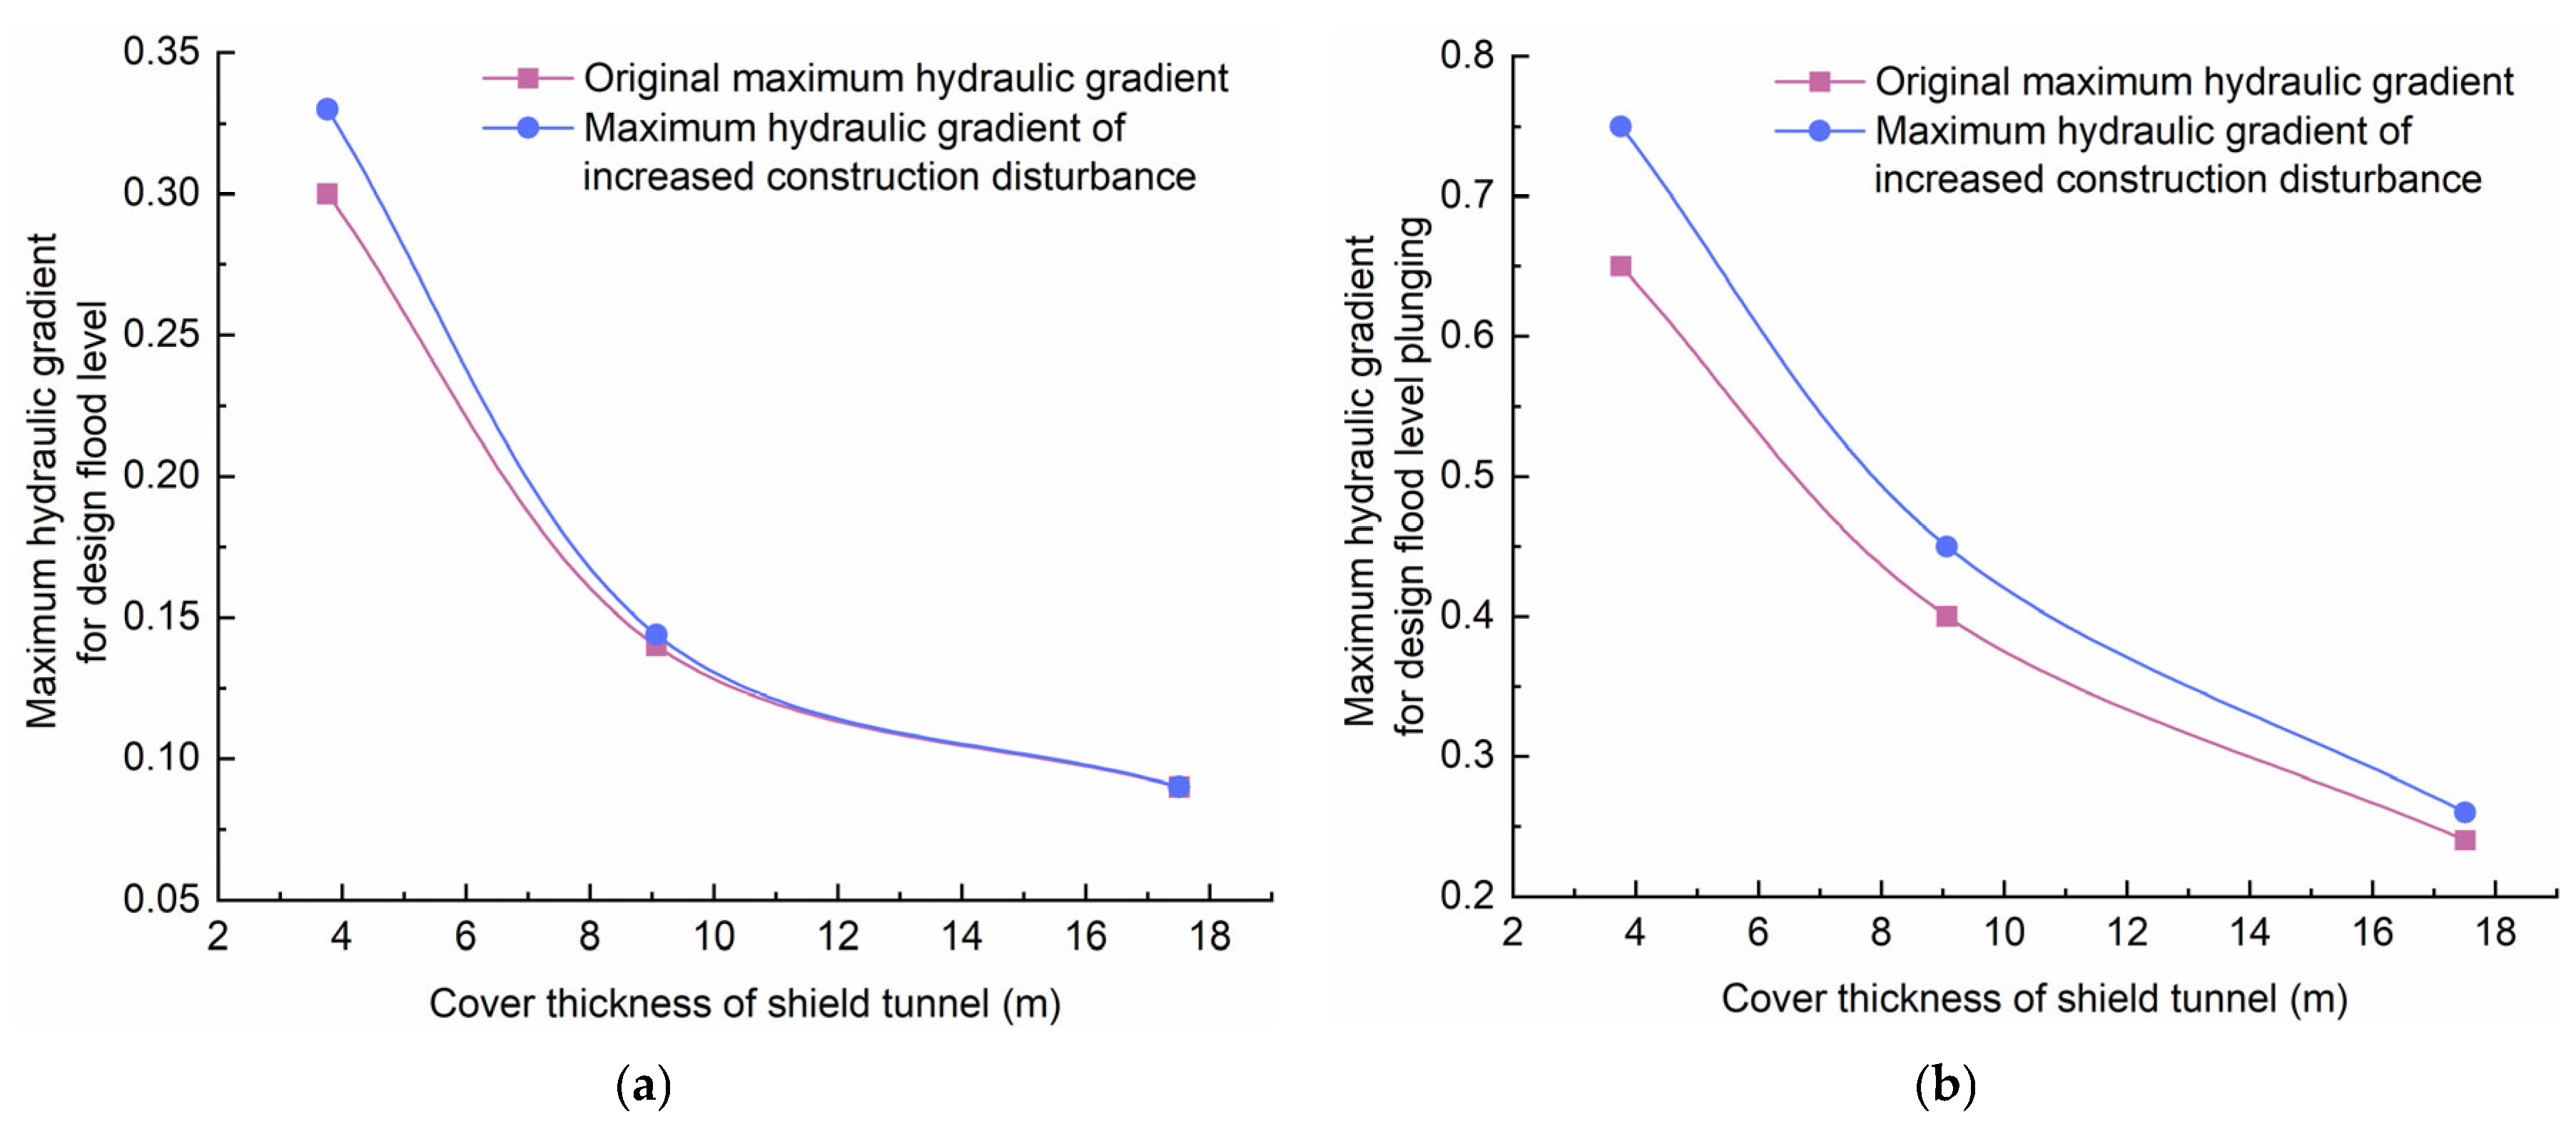
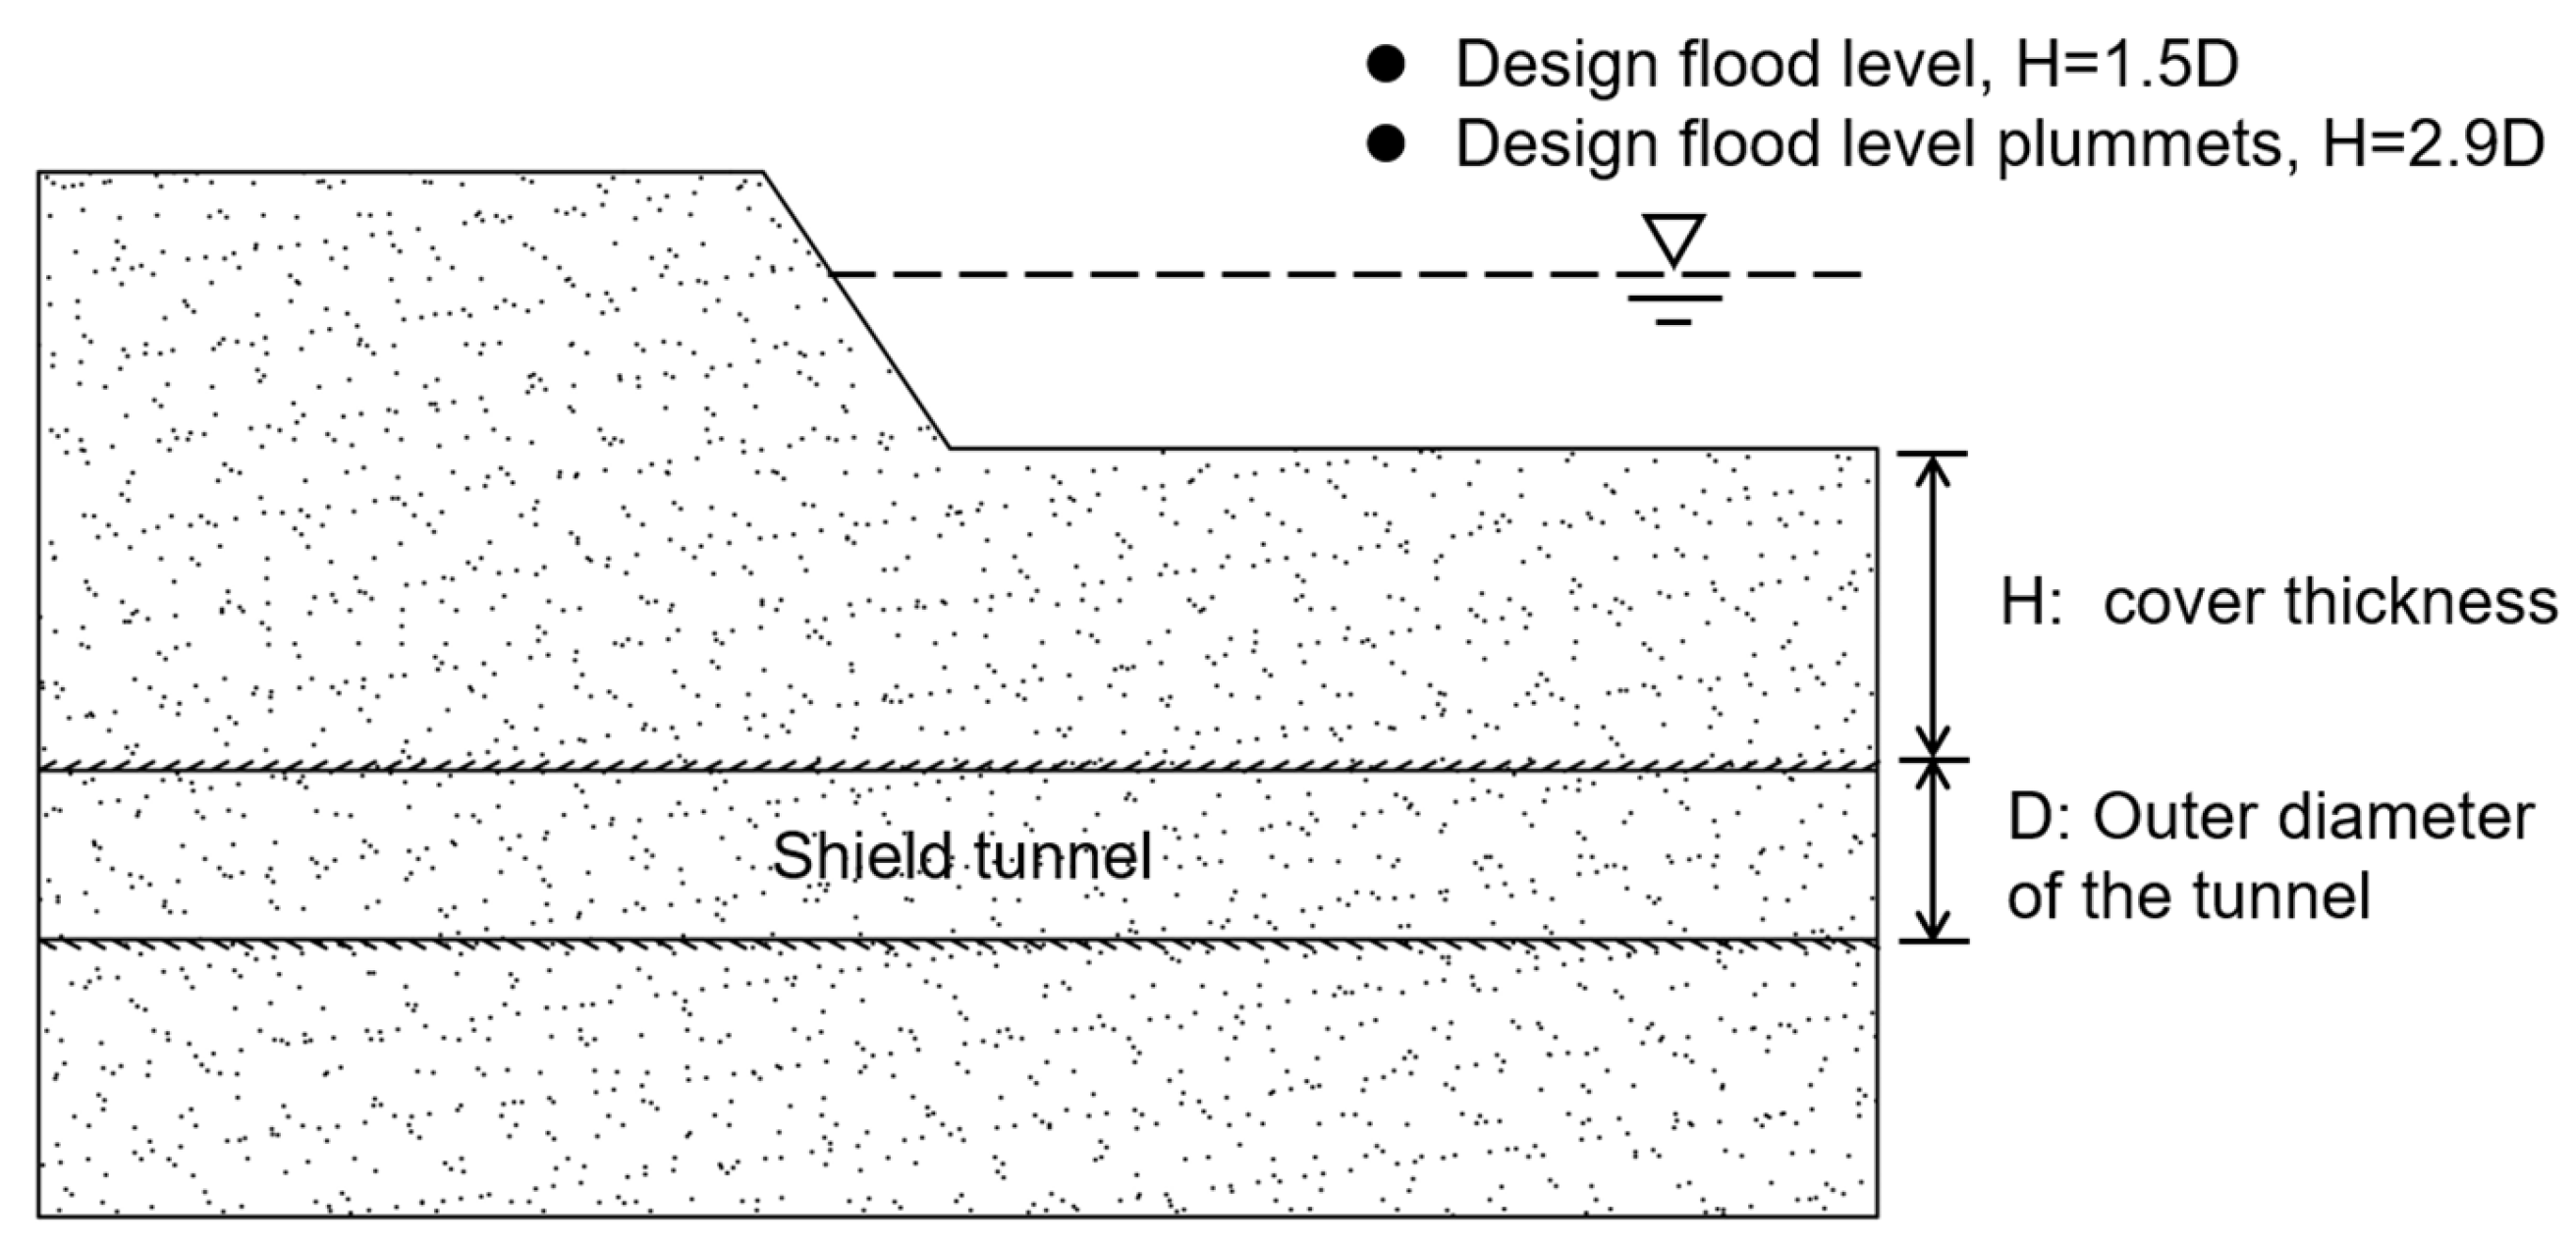
5.4. Analysis of Underwater Shield Tunnel Cover Thickness

According to the findings of the previous investigation, when the underwater shield tunnel overburden thickness is 3.76 m under the design flood level condition, the maximum hydraulic gradient gets the permissible value, the river embankment seepage stability is in the critical state, and when the underwater shield tunnel overburden thickness is 9.07 m, the maximum hydraulic gradient value is within the permissible range. Under the design flood level plunging condition, the maximum hydraulic gradient for shield tunnel overburden thickness of 3.76 m and 9.07 m exceeds the code’s allowable hydraulic gradient, and infiltration damages may occur on the river embankment under the two work conditions, whereas the maximum hydraulic gradient for shield tunnel overburden thickness of 17.51 m does not exceed the allowable value.
Considering the engineering geological background of this study, the river embankment is in seepage stability when the overburden thickness of the underwater shield tunnel is 1.5 times the tunnel outer diameter (9.07 m) under the design flood level condition (Figure 14). Figure 14 shows that the overburden thickness is safe under the design flood level plunge scenario, where the underwater shield tunnel overburden thickness is 2.9 times the tunnel outer diameter (17.51 m), the river embankment is in a seepage stable state, and no infiltration damage occurs.

6. Conclusions

This study is conducted on the underground shield tunnel crossing the river project in Hefei. The effects of shield tunnel cover thickness on river embankment seepage stability are investigated under the design flood level and design flood level plunge conditions, as well as the effects of tunnel shield construction on river embankment seepage stability under different cover thickness, to evaluate the safety of the shield tunnel overburden thickness under engineering geology. The following conclusions were drawn:
(1)
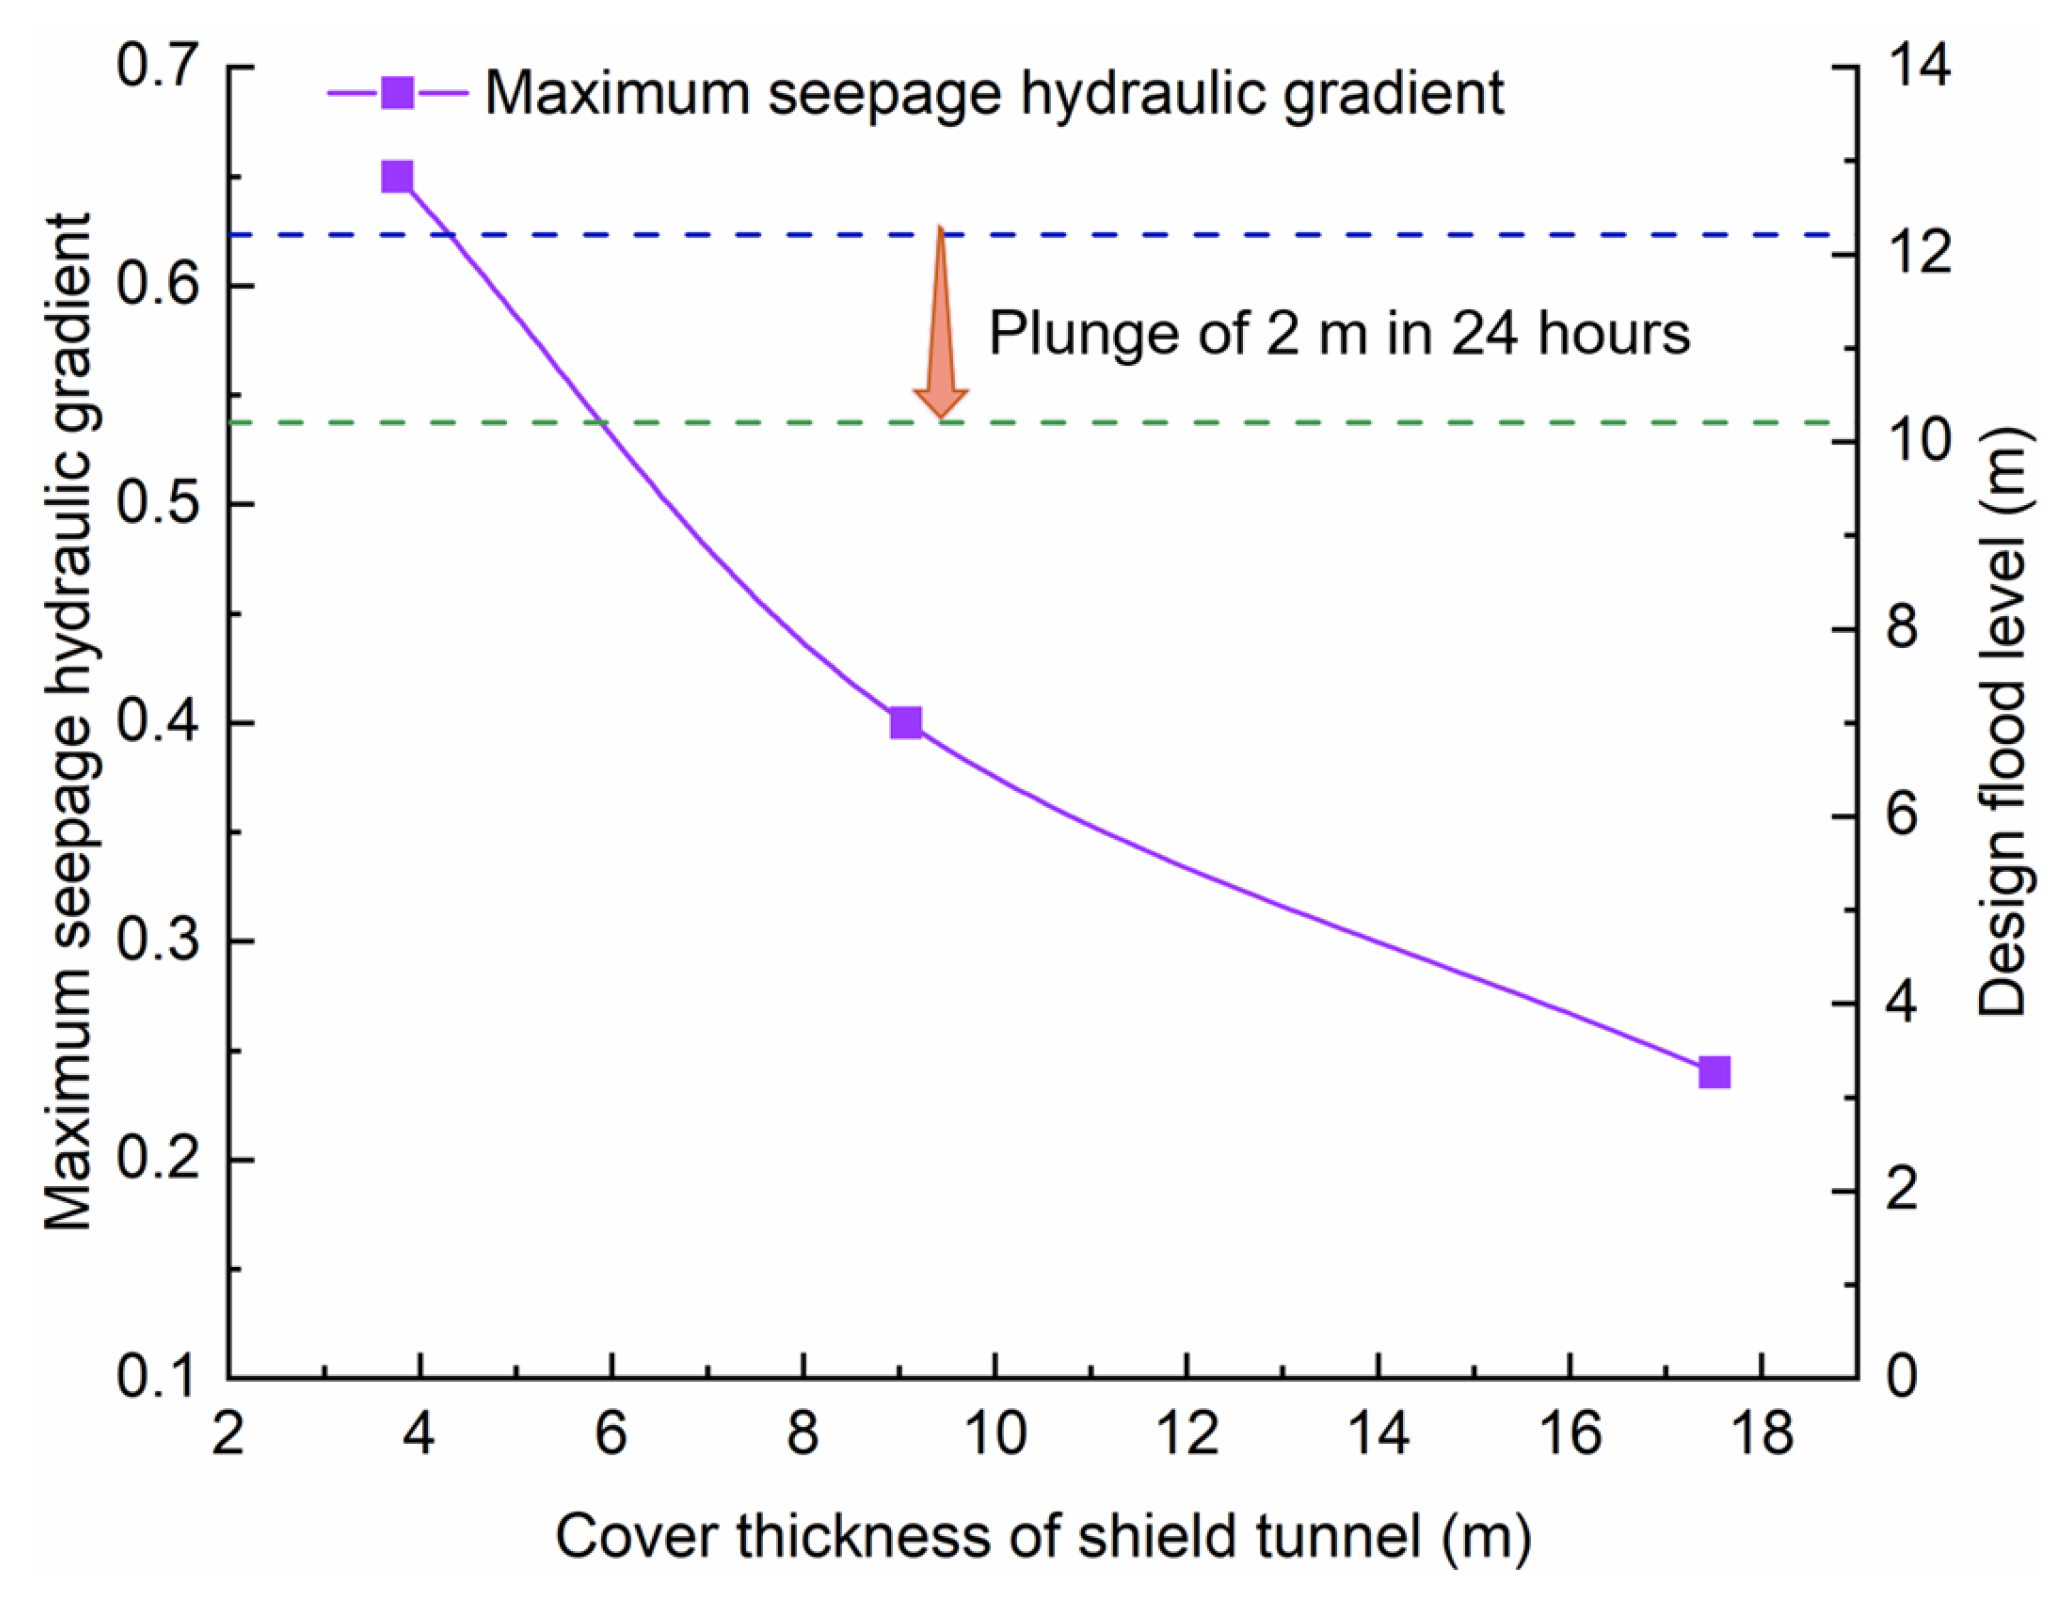
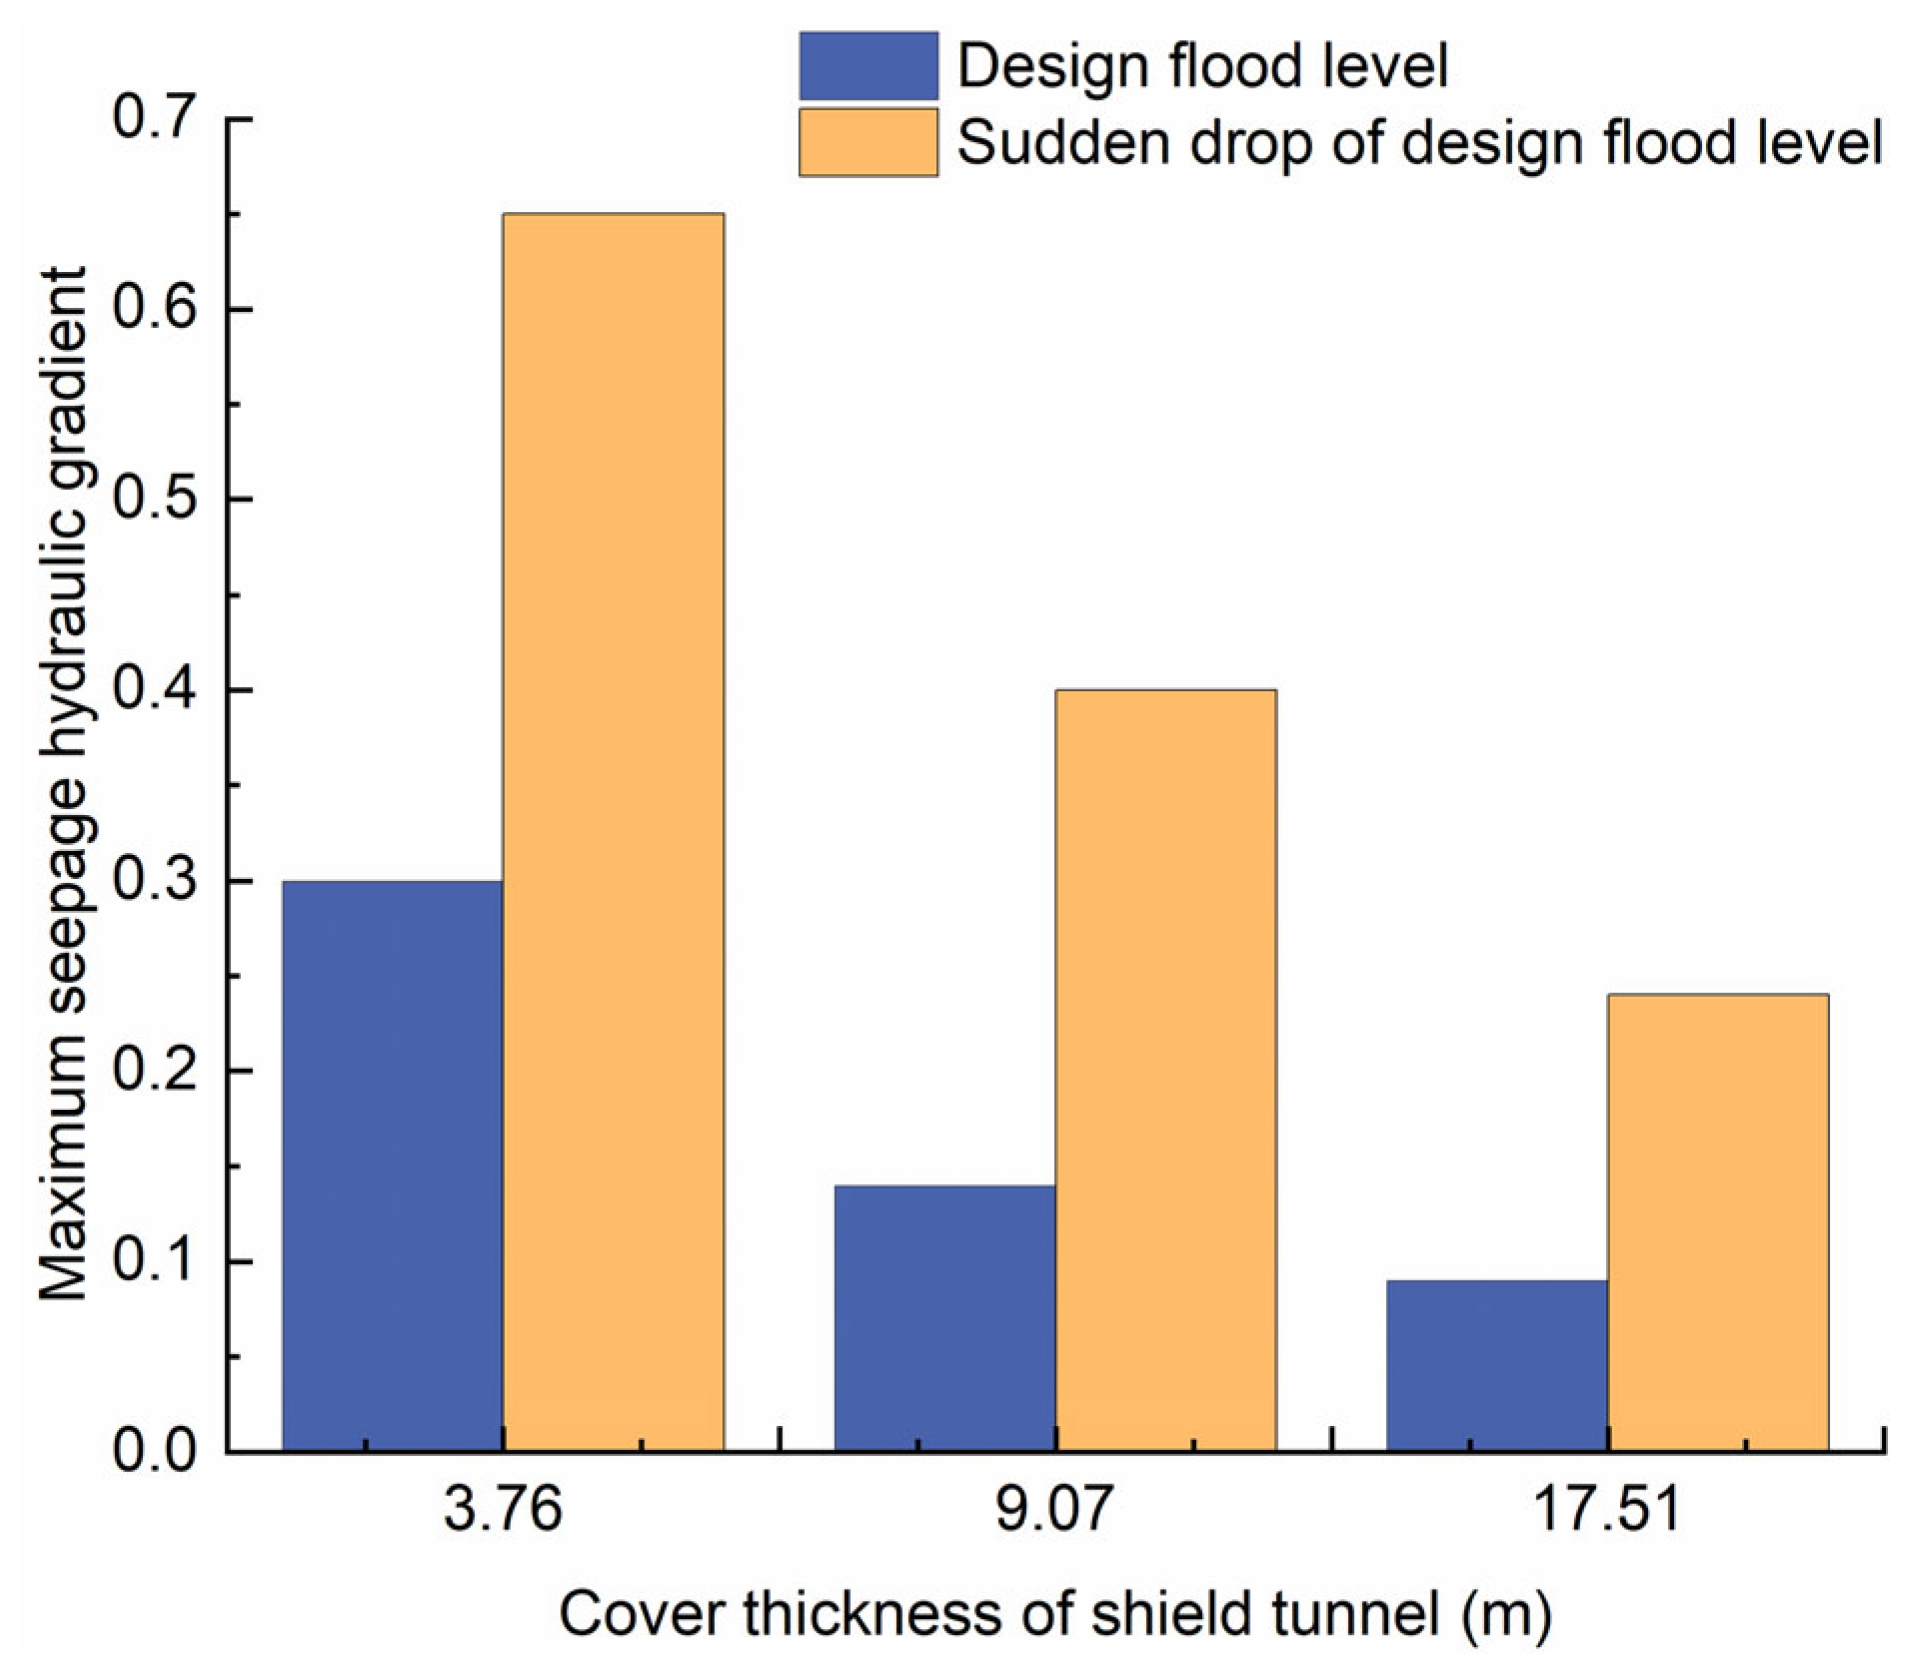
The maximum infiltration hydraulic gradient value of the river embankment gradually lowers as the thickness of the underwater shield tunnel overburden grows. When the underwater shield tunnel overburden thickness is thin, the maximum infiltration hydraulic gradient occurs at the top of the river embankment and the maximum seepage head values increase. When the underwater shield tunnel overburden thickness is thick, the maximum infiltration hydraulic gradient arises at the junction of the river channel and the river embankment.
(2)
Shield tunnel construction has effects on river embankment seepage stability when the construction disturbance is large, i.e., the permeability coefficient of the disturbance zone increases, and the infiltration hydraulic gradient increases. However, as the underwater shield tunnel cover thickness increases, the effect of shield construction disturbance on the infiltration hydraulic gradient weakens, and the effect on river embankment seepage stability decreases.
(3)
In the case of the underwater shield tunnel cover thickness reaching 1.5 times the tunnel outer diameter in the design flood level condition, the river embankment may keep seepage stability. When the design flood level plunges, an underwater shield tunnel cover thickness that remains 2.9 times the outer diameter of the tunnel can keep the river embankment in seepage stability.

Author Contributions

Conceptualization, X.L.; methodology, W.S.; software, W.S.; validation, W.S. and X.L.; formal analysis, X.L.; investigation, W.S.; resources, X.L.; data curation, W.S.; writing—original draft preparation, W.S.; writing—review and editing, X.L., J.M., N.G., Y.X., F.T., S.F. and S.M.; visualization, J.M., N.G., Y.X. and S.M.; supervision, X.L.; project administration, X.L.; funding acquisition, X.L. and W.S. All authors have read and agreed to the published version of the manuscript.

Funding

This research was funded by the National Natural Science Foundation of China (Nos. 4210071795, 42107082), and the Natural Science Foundation of Anhui Province, China (Nos. 2108085QD166) and the Foundation of Hefei Rail Transit Group Limited Company, China (Nos. 2021BFFBZ02689).

Data Availability Statement

All data, models, or code that support the findings of this study are available from the corresponding author upon reasonable request.

Conflicts of Interest

The authors declare no conflict of interest.

References

  1. Liang, Y.; Chen, X.Y.; Yang, J.S.; Huang, L.C. Risk analysis and control measures for slurry shield tunneling diagonally under an urban river embankment. Adv. Civ. Eng. 2020, 24, 336–353. [Google Scholar] [CrossRef]
  2. Ma, W.H.; Yang, C.Y.; Peng, H.; Bai, Y.; Cheng, L.; Gao, L.H.; Liu, Z.Y. Settlement control on retaining wall embankment affected by underneath traversing large-diameter slurry shield tunnels. J. Hunan Univ. 2020, 47, 44–53. [Google Scholar]
  3. Hong, K. Typical underwater tunnels in the mainland of China and related tunneling technologies. Engineering 2017, 3, 871–879. [Google Scholar] [CrossRef]
  4. Li, X.J.; Lu, D.D.; Sun, H.B.; Hu, J.L.; Li, J.L.; Wu, X.; Xu, J.B. Stratum deformation law of tidal river by shield tunneling under shallow overburden soil. Sci. Technol. Eng. 2023, 23, 1270–1277. [Google Scholar]
  5. Zhang, H.C. Construction Deformation Control Technology of Large Diameter Shield Undercrossing Subway Tunnel in Operation. Mod. Tunn. Technol. 2022, 59, 934–940. [Google Scholar]
  6. Guo, P.P.; Gong, X.N.; Wang, Y.X.; Lin, H.; Zhao, Y.L. Analysis of observed performance of a deep excavation straddled by shallowly buried pressurized pipelines and underneath traversed by planned tunnels. Tunn. Undergr. Space Technol. 2023, 132, 104946. [Google Scholar] [CrossRef]
  7. Wu, S.M.; Lin, C.G.; Zhang, Z.M.; Wang, N. Risk analysis and control for slurry shield under-passing embankment. J. Rock Mech. Eng. 2011, 30, 1034–1042. [Google Scholar]
  8. Kong, Q.Y.; Ma, X.L.; Wang, T.T. Seepage stability analysis of Yangtze River levee as tunnel traversing. J. Water Resour. Archit. Eng. 2012, 10, 74–77. [Google Scholar]
  9. Sun, Y.S.; Li, Z.H.; Yang, K.; Wang, G.H.; Hu, R.L. Analysis of the influence of water level change on the seepage field and stability of a slope based on a numerical simulation method. Water 2023, 15, 216. [Google Scholar] [CrossRef]
  10. Gu, J.Y.; Zhang, Q.; Lu, X.C.; Hu, J.; Zhu, J.W. Centrifugal model test study on deformation mechanism of reservoir bank landslide under reservoir water level variation. J. Yangtze River Sci. Res. Inst. 2022. Available online: https://kns.cnki.net/kcms/detail/42.1171.tv.20221122.1555.006.html (accessed on 4 May 2023).
  11. Li, H.R.; Li, Q.M.; Lu, Y. Statistical analysis on regularity of subway construction accidents from 2002 to 2016 in China. Urban Rapid Rail Transit 2017, 30, 12–19. [Google Scholar]
  12. Wu, S.X. Analysis and discussion of water gushing accident in a shield tunnel of a metro river-crossing interval. Intell. City 2017, 3, 118–119. [Google Scholar]
  13. Li, X.Y.; Zhang, D.L.; Hou, Y.J.; Cao, L.Q.; Li, Q.Q. Analysis of ground and structure deformation characteristics during shield tunneling in Tianjin subway. China Railw. Sci. 2018, 39, 71–80. [Google Scholar]
  14. Bomer, E.J.; Wilson, C.A.; Datta, D.K. An integrated approach for constraining depositional zones in a tide-influenced river: Insights from the Gorai River, southwest Bangladesh. Water 2019, 11, 2047. [Google Scholar] [CrossRef] [Green Version]
  15. Jiang, B.H.; Yang, Y.P.; Peng, H.M.; Tian, H.R. Analysis on improving weak links and solutions of low-grade levees in middle and lower reaches of Changjiang River. Yangtze River 2021, 52, 127–130. [Google Scholar]
  16. Qian, J.G.; Li, W.Y.; Yin, Z.Y.; Yang, Y. Influences of buried depth and grain size distribution on seepage erosion in granular soils around tunnel by coupled CFD-DEM approach. Trans. Geotech. 2021, 29, 100574. [Google Scholar] [CrossRef]
  17. Wang, K.; Li, W.J.; Tang, K.; Liang, B. Influence of rainfall infiltration on slope stability of shallow-buried bias tunnel entrance. Water Resour. Power 2022, 40, 121–124. [Google Scholar]
  18. Tao, Z.G.; Zhang, Q.Z.; Yang, X.J.; Zhao, F.F.; Cao, S.D.; Li, Y.P. Physical model test study on steady state effect of underpass tunnel excavation on loose deposit slope. J. China Coal Soc. 2022, 47, 61–76. [Google Scholar]
  19. Li, X.F. Study on seepage characteristics and slope stability of Caipo accumulation body in Three Gorges Reservoir area under combined rainfall condition. J. Water Resour. Water Eng. 2019, 30, 194–200. [Google Scholar]
  20. Zhang, L.W.; Tian, Z.N.; Li, S.C.; Wang, Y. Preventing water outburst in excavation in subsea tunnel. Proc. Int. Conf. Transp. Eng. 2009, 2009, 2102–2107. [Google Scholar]
  21. Chen, S.W. Estimation of Minimum Rock Cover for a Sub-Water Tunnel. In Proceedings of the 3rd ISRM Young Scholars Symposium on Rock Mechanics, Xi’an, China, 8–10 November 2014; pp. 445–449. [Google Scholar]
  22. Do, N.A.; Dias, D.; Oreste, P.; Djeran-Maigre, I. Three-dimensional numerical simulation for mechanized tunnelling in soft ground: The influence of the joint pattern. Acta Geotech. 2014, 9, 673–694. [Google Scholar] [CrossRef]
  23. Guo, P.P.; Gong, X.N.; Wang, Y.X. Displacement and force analyses of braced structure of deep excavation considering unsymmetrical surcharge effect. Comput. Geotech. 2019, 113, 103102. [Google Scholar] [CrossRef]
  24. Li, S.C.; Li, S.C.; Xu, B.S.; Wang, H.P.; Ding, W.T. Study on determination method for minimum rock cover of subsea tunnel. J. Rock Mech. Eng. 2007, 26, 2289–2295. [Google Scholar]
  25. Zhang, D.M.; Ma, L.X.; Zhang, J.; Hicher, P.Y.; Juang, C.H. Ground and tunnel responses induced by partial leakage in saturated clay with anisotropic permeability. Eng. Geol. 2015, 189, 104–115. [Google Scholar] [CrossRef]
  26. Zhang, D.M.; Liu, Y.; Huang, H.W. Leakage-induced settlement of ground and shield tunnel in soft clay. J. Tongji Univ. 2013, 41, 1185–1190+1212. [Google Scholar]
  27. Zhang, P.; Chen, R.P.; Wu, H.N.; Liu, Y. Ground settlement induced by tunneling crossing interface of water-bearing mixed ground: A lesson from Changsha, China. Tunn. Undergr. Space Technol. 2020, 96, 103224. [Google Scholar] [CrossRef]
  28. Tang, Z.L.; Yao, W.; Zhang, J.C.; Xu, Q.J.; Xia, K.W. Experimental evaluation of PMMA simulated tunnel stability under dynamic disturbance using digital image correlation. Tunn. Undergr. Space Technol. 2019, 92, 103039. [Google Scholar] [CrossRef]
  29. Yu, H.; Chen, J.; Bobet, A.; Yuan, Y. Damage observation and assessment of the Longxi tunnel during the Wenchuan earthquake. Tunn. Undergr. Space Technol. 2016, 54, 102–116. [Google Scholar] [CrossRef]
  30. Hu, B.; Li, X.Q.; Huang, D. Safety risk analysis and protective control of existing pipelines affected by deep pit excavation in metro construction. Model. Simul. Eng. 2019, 2019, 3643808. [Google Scholar] [CrossRef] [Green Version]
  31. Ahmed, M.; Iskander, M. Analysis of tunneling-induced ground movements using transparent soil models. J. Geotech. Geoenviron. Eng. 2010, 137, 525–535. [Google Scholar] [CrossRef]
  32. Vu, M.N.; Broere, W.; Bosch, J. Effects of cover depth on ground movements induced by shallow tunnelling. Tunn. Undergr. Space Technol. 2015, 50, 499–506. [Google Scholar] [CrossRef] [Green Version]
  33. Guo, P.P.; Gong, X.N.; Wang, Y.X.; Lin, H.; Zhao, Y.L. Minimum cover depth estimation for underwater shield tunnels. Tunn. Undergr. Space Technol. 2021, 115, 104027. [Google Scholar] [CrossRef]
  34. Bai, Y.; Wu, Z.; Huang, T.; Peng, D.P. A dynamic modeling approach to predict water inflow during karst tunnel excavation. Water 2022, 14, 2380. [Google Scholar] [CrossRef]
  35. Hu, R.; Liu, Q.; Xing, Y.X. Case study of heat transfer during artificial ground freezing with groundwater flow. Water 2018, 10, 1322. [Google Scholar] [CrossRef] [Green Version]
  36. Wang, W.X.; Faybishenko, B.; Jiang, T.; Dong, J.Y.; Li, Y. Seepage characteristics of a single ascending relief well dewatering an overlying aquifer. Water 2020, 12, 919. [Google Scholar] [CrossRef] [Green Version]
  37. Pan, Y.H.; Qi, J.R.; Zhang, J.F.; Peng, Y.X.; Chen, C.; Ma, H.N.; Ye, C. A comparative study on steady-state water inflow into a circular underwater tunnel with an excavation damage zone. Water 2022, 14, 3154. [Google Scholar] [CrossRef]
  38. Niu, F.Y.; Cai, Y.C.; Liao, H.J.; Li, J.G.; Tang, K.J.; Wang, Q.; Wang, Z.C.; Liu, D.D.; Liu, T.; Liu, C.; et al. Unfavorable geology and mitigation measures for water inrush hazard during subsea tunnel construction: A global review. Water 2022, 14, 1592. [Google Scholar] [CrossRef]
  39. Zhang, Y.; Zhang, D.L.; Fang, Q.; Xiong, L.J.; Yu, L.; Zhou, M.Z. Analytical solutions of non-Darcy seepage of grouted subsea tunnels. Tunn. Undergr. Space Technol. 2020, 96, 103182. [Google Scholar] [CrossRef]
  40. Fahimifar, A.; Zareifard, M.R. A new elasto-plastic solution for analysis of underwater tunnels considering strain-dependent permeability. Struct. Infrastruct. Eng. 2014, 10, 1432–1450. [Google Scholar] [CrossRef]
  41. Fang, Q.; Song, H.R.; Zhang, D.L. Complex variable analysis for stress distribution of an underwater tunnel in an elastic half plane. Int. J. Numer. Anal. Meth. Geomech. 2015, 39, 1821–1835. [Google Scholar] [CrossRef]
  42. Mi, B.; Xiang, Y.Y. Model experiment and calculation analysis of excavation-seepage stability for shallow shield tunneling in sandy ground. Rock Soil Mech. 2020, 41, 837–848. [Google Scholar]
  43. Yang, X.L.; Huang, F. Stability analysis of shallow tunnels subjected to seepage with strength reduction theory. J. Cent. South Univ. Technol. 2009, 16, 1001–1005. [Google Scholar] [CrossRef]
  44. Chen, X.W.; Lei, P.; Yang, X.Y. Seepage and stability analysis of dike based on Geo-Studio. J. Chang. Univ. Sci. Technol. 2015, 12, 64–68. [Google Scholar]
  45. Chen, H.R.; Zhang, G.J.; Li, Y.; Liu, L.L.; Meng, Y.Q.; Tian, D.Z. Study on the influence of river-crossing pipeline to the permeability safety of embankment. Yellow River 2017, 39, 34–37+41. [Google Scholar]
  46. Duan, X.B.; Xie, L.F. Unsteady seepage test under condition of rapid drawdown. J. Yangtze River Sci. Res. Inst. 2009, 26, 7–12. [Google Scholar]
Figure 1. Project location map.
Water 15 02346 g001
Figure 2. Diagram of the numerical model of seepage in the study area.
Water 15 02346 g002
Figure 3. Seepage head contours under the design flood water level of: (a) 3.76 m of underwater tunnel overburden thickness; (b) 9.07 m of underwater tunnel overburden thickness; (c) 17.51 m of underwater tunnel overburden thickness.
Water 15 02346 g003
Figure 4. Maximum seepage head of embankment under the design water level.
Water 15 02346 g004
Figure 5. Seepage hydraulic gradient contours under design flood water level of: (a) 3.76 m of underwater tunnel overburden thickness; (b) 9.07 m of underwater tunnel overburden thickness; (c) 17.51 m of underwater tunnel overburden thickness.
Water 15 02346 g005
Figure 6. Maximum seepage hydraulic gradient of embankment under design water level.
Water 15 02346 g006
Figure 7. Seepage head contours under the sudden drop of design flood level of: (a) 3.76 m of underwater tunnel overburden thickness; (b) 9.07 m of underwater tunnel overburden thickness; (c) 17.51 m of underwater tunnel overburden thickness.
Water 15 02346 g007
Figure 8. Maximum seepage head of the embankment under the sudden drop of design flood level.
Water 15 02346 g008
Figure 9. Comparison of maximum seepage head of river embankment.
Water 15 02346 g009
Figure 10. Seepage hydraulic gradient contours under the sudden drop of design flood level of: (a) 3.76 m of underwater tunnel overburden thickness; (b) 9.07 m of underwater tunnel overburden thickness; (c) 17.51 m of underwater tunnel overburden thickness.
Water 15 02346 g010aWater 15 02346 g010b
Figure 11. Maximum seepage hydraulic gradient of embankment under a sudden drop of design flood level.
Water 15 02346 g011
Figure 12. Comparison of maximum seepage hydraulic gradient of river embankment.
Water 15 02346 g012
Figure 13. Comparison for original maximum hydraulic gradient and maximum hydraulic gradient of increased construction disturbance: (a) Design flood level condition; (b) Sudden drop of design flood level condition.
Water 15 02346 g013
Figure 14. Diagram of shield tunnel cover thickness.
Water 15 02346 g014
Table 1. Physical and mechanical parameters of the stratum section at the project river section.
MaterialsE (MPa)γ (kN∙m−3)c (kPa)φ (°)K (cm∙s−1)Enhanced K (cm∙s−1)
Miscellaneous fill1019.5095.0 × 10−5-
Clay5519.87512.51.0 × 10−5-
Silty clay1820.170122.0 × 10−52.0 × 10⁻⁴
Silt1920.567.522.53.0 × 10−53.0 × 10⁻⁴
Silty fine sand2021.0027.51.0 × 10−41.0 × 10⁻³
Shield tunnel3.0 × 10525--0-
Table 2. Seepage calculation conditions.
Initial ConditionsDescriptions
Stabilized seepage condition100-year design flood level 12.21 m
Unsteady seepage conditionThe 100-year design flood level plunges 2 m in 24 h
Table 3. The cladding thickness of the underwater shield tunnel.
NumbersTypes of Strata Crossed by the Underwater Shield TunnelCladding Thickness (m)
1Silty clay3.76
2Silt9.07
3Silty fine sand17.51
Disclaimer/Publisher’s Note: The statements, opinions and data contained in all publications are solely those of the individual author(s) and contributor(s) and not of MDPI and/or the editor(s). MDPI and/or the editor(s) disclaim responsibility for any injury to people or property resulting from any ideas, methods, instructions or products referred to in the content.

