Article

Revealing an Abundance of Microbial Fecal Contamination and Multidrug Resistant Bacteria in the Mississippi Gulf Coast

1
Department of Life, Earth & Environmental Sciences, West Texas A&M University, Canyon, TX 79016, USA
2
School of Biological, Environmental, and Earth Sciences, The University of Southern Mississippi, Long Beach, MS 39560, USA
3
USDA-ARS, Mississippi State, MS 39762, USA
*
Author to whom correspondence should be addressed.
Undergraduate student authors.
Water 2023, 15(13), 2339; https://doi.org/10.3390/w15132339
Submission received: 19 May 2023 / Revised: 17 June 2023 / Accepted: 20 June 2023 / Published: 24 June 2023

Abstract

:
(1) Background: The Mississippi Gulf Coast (MGC) has been greatly affected by microbial contamination-related issues in the past several years. (2) Methods: We analyzed water samples collected from ten sites within the MGC across ten months for FIBs and the distribution of AMR/MDR bacteria. (3) Results: The Escherichia coli numbers within nine out the ten studied sites and Enterococcus values within seven out of the ten sites fell well past the water quality criteria established by EPA. Overall, we found very high AMR within both E. coli and Enterococcus isolates, many of which were also MDR. Within the E. coli, 94.6% were resistant to ≥2 antibiotics, 64.5% to ≥3, 41.8% to ≥4, 18.2% to ≥5, and 6.3% to ≥5 antibiotics. MDR patterns in Enterococcus were 87.3% belonging to the ≥2 category, 66.4% belonging to the ≥3, 37.9% falling into the ≥4, 17.9% were in the ≥5, 8.4% in the ≥6, and 3.6% in the ≥7 antibiotics. (4) Conclusions: Overall, data collected suggest the prevalence of concerning levels of FIBs along the Mississippi Gulf Coast revealing a remarkably high percentage of these FIBs being resistant to multiple antibiotics, a concerning number of which were also found to be MDR.

1. Introduction

Microbial contamination of coastal recreational waters typically assessed by the presence of elevated concentrations of fecal indicator bacteria (FIB) is considered a critical environmental problem on a global scale. In the United States, a substantial segment of coastal water often fails to meet standard regulatory guidelines as set up by the United States Environmental Protection Agency (USEPA), the Natural Resources Defense Council (NRDC), and/or regional and state environmental health agencies [1,2]. Increased amounts of FIBs indicate the presence of elevated pathogenic contamination within these water sources and therefore is deemed to be of great concern due to its damaging effects on public health; as in, the impacts of such effects on the economy resulting from periodic beach closures due to such contamination [3,4,5]. Both E. coli and Enterococcus are native of the normal gut flora commensal bacteria; however, both can become opportunistic pathogens and are significantly associated with healthcare associated infections (HAIs) [6]. The most commonly examined FIBs include Escherichia coli, total coliforms, fecal coliforms, and enterococci, due to the occurrence of these bacteria in fecal matter [1]. To determine if samples meet microbial water quality standards in a recreational water body, the USEPA recommends measurement of culturable E. coli for freshwater (EPA Method 1603) and enterococci for marine and freshwater (EPA Method 1600) [1].
In addition to the widespread problem of microbial fecal pollution in our coastal recreational beaches, another growing matter of paramount concern is the development, spread, and dissemination of antimicrobial resistance (AMR) and multidrug resistance (MDR) within these pathogenic populations, altogether resulting in a critical global threat to public health related issues. Routine antimicrobial application in veterinary, agricultural, and clinical practices has contributed to the spread of AMR and MDR in such populations of pathogenic bacteria that were once susceptible [7,8,9,10,11,12]. Numerous agencies across the world, e.g., the World Health Organization (WHO), the Federal Interagency Task Force on Antimicrobial Resistance (ITFAR), and the U.S. Centers for Disease Control (USCDC), have frequently identified AMR and MDR as one of the key threats concerning current and future human, animal, environmental, and public health concerns [10,12,13,14,15]. Excessive, or even proper use, of antimicrobials results in their dissemination and transmission into the environment through various sources such as sewage, water runoff, physical factors, and biological entities [7,9,16]. Bacteria can rapidly acquire and transfer antibiotic resistance genes (ARGs) by horizontal gene transfer processes [17,18,19]. Potential transmission of these genes into human pathogens is of serious concern [8,9,11]. While the transmission of AMR/MDR through the clinical routes has been studied widely, little is still known about the sources and dynamics of the environmental factors and links to such occurrences and spread [7,8,9]. Water, being one of the most important amongst all bacterial domains, serves as a key source of environmental transmission of AMR/MDR [7,8,20]. Almost all sources of water such as streams, rivers, lakes, and oceans are contaminated with AMR/MDR bacteria and ARGs through discharges from wastewater, sewage systems, farm environments, hospitals, and pharmaceutical companies, among others [21,22,23,24,25,26,27,28,29,30,31,32].
In recent years, the world has seen millions of cases of patients succumbing to MDR microbial infections due to the unavailability of drugs to treat such infections, leading to the scientific community giving these pathogens the designation of “superbugs” [33]. According to current USCDC (the United States Centers for Disease Control) reports, over 2.8 million antibiotic-resistant infections are reported in the U.S. each year, as a result of which over 35,000 people die annually [15,33]. The Global costs associated with AMR/MDR infections are estimated to be 5.8 trillion dollars [33]. While the WHO has acknowledged AMR to be one of the top 10 global public health threats, the USCDC has identified MDR Enterobacteriaceae to be amongst the top in the list of serious threats to public health concerns [15]. Conferring to the 2019 USCDC antibiotic resistance report [33], carbapenem resistant Enterobacteriaceae and vancomycin-resistant Enterococci fall within the serious threats category, leading to about 197,400 and 54,500 hospitalization cases in 2017, respectively [33]. While finding a single solution to a multifaceted problem such as this might be very complicated for scientists to reach, according this USCDC report [33], some of the ways to combat this emerging problem are to use antibiotics effectively and improve antibiotic use, together with better tracking of AMR/MDR prevalence, and finding and filling the present gaps in our knowledge regarding environmental dissemination of resistance.
The Mississippi Gulf Coast serves as a key resource for a variety of recreational, travel, and economic purposes within the state. In 2018, a study conducted by Environment America and Policy Center concluded that 21 tested beach sites were deemed unsafe in Mississippi due to unsafe contamination levels [34]. In the recent years, the Mississippi Department of Environmental Quality (MDEQ) has repeatedly reported coastal waters to be contaminated and issued multiple beach water contact advisories for the public that includes several instances of complete beach closures for the entire Mississippi coast [35,36,37]. In addition, on 27 February 2019, the Mississippi River Commission (MRC) in association with the US Army Corps of Engineers opened the Bonnet Carré Spillway in Louisiana thereby diverting water from the Mississippi River into Lake Pontchartrain which flows into the Western side of the Mississippi Sound area of the Gulf of Mexico [38]. This resulted in a multitude of catastrophic consequences in the Mississippi coastal region that include but are not limited to decreased salinity in the coastal waters, substantial losses of aquatic species such as fish and oysters, and deaths of hundreds of turtles and dolphins [39,40]. The state of Mississippi sued the MRC and the US Army Corps of Engineers in response to the disaster for the inherently irreversible ecological damage imparted to the Mississippi coast due to this action [41,42,43,44,45,46,47,48]. While the overall impacts of such disasters are yet to be fully assessed, all of this clearly indicates that measuring the occurrence and distribution of potentially pathogenic AMR and MDR microbes in the coastal waters is a critical step to keep Mississippi’s coastal ecosystem clean and sustainable for the future. Such data-driven studies could provide vital information to help elucidate the connection between human activities and AMR and MDR occurrences, thereby serving to keep the Mississippi Gulf Coast clean and sustainable. Such data will also serve to improve the state’s environmental and public health control measures. Additionally, only a handful of studies thus far have focused on a comprehensive spatiotemporal assessment of the distribution of AMR and MDR bacterial populations within coastal ecosystems. Therefore, evaluation of the AMR and MDR patterns in the Mississippi coastal region would also deliver a broader insight into the global AMR and MDR crisis by identifying the knowledge gaps and environmental factors of AMR and MDR distribution.
Both E. coli and Enterococcus are considered indicators of fecal contamination in recreational water sources and are recommended by the EPA to be used as standard organisms to quantify presence of FIBs in these water sources [1]. The primary goal of this study was to examine the extent of microbial fecal contamination and the levels of AMR/MDR across the coastal waters in the Mississippi Gulf. To meet these study goals, we collected and analyzed coastal surface ocean water samples from ten sites spanning the Mississippi Gulf Coast over a period of ten months for the following analyses: (1) Enumerate pathogenic FIB using the EPA methods 1603 (E. coli) and 1600 (Enterococcus), and (2) Identify and quantify the occurrence and distribution of AMR and MDR within these FIB isolates by the Kirby–Bauer disc diffusion method. To the best of our knowledge, this is one of the first studies in recent years revealing the abundance of microbial fecal contamination together with the distribution and occurrence of AMR/MDR within these important coastal waters in the US Gulf Coast.

2. Materials and Methods

2.1. Study Area

Ten sampling sites were established spanning the Mississippi Gulf Coast between Bay St. Louis and Biloxi, MS (Figure 1). Sites were selected based on factors such as significant human presence due to recreational activities such as boating, fishing, and swimming activities on the coastal sites. Additional detail on sampling sites is included in Table S1 (see supplementals). Maps of the study locations presented in this article (Figure 1) were made in ArcGIS Pro version 10.3 (Esri).

2.2. Sample Collection

We conducted ten sampling events over a period of ten months across the ten sampling sites in the Mississippi Gulf Coast between September 2020 and July 2021. All samples were collected within 4 h of one another in order to maintain similar conditions across sites for the study. Surface water samples were collected utilizing ~500 mL Whirl-Pak® sterile bags (eNasco, Fort Atkinson, WI, USA). All samples post collection were immediately placed on ice and transported on ice back to our laboratory for analysis. All water samples collected during the ten-month period and across the ten sampling sites were processed within six hours of collection according to USEPA set standards [1,49,50].

2.3. Temperature, pH, and Salinity Measurements

During each sampling event, measurements for ambient surface water temperature, salinity, and pH were taken for each site. Temperature and pH measurements were conducted using handheld portable field probes (EcoSense DO200A, YSI Inc.; Test tube pH pen model no. 850062, SPER Scientific, Scottsdale, AZ, USA). Salinity measurements were conducted using a handheld field refractometer (Model no. MR100ATC, Milwaukee, WI, USA).

2.4. E. coli and Enterococcus Enumeration, Isolation and Archiving

E. coli and Enterococcus were enumerated and isolated from each collected water sample in accordance with the EPA Method 1603 (E. coli) [1,50] and Ethe PA Method 1600 (Enterococci) [1,49]. It is important to mention here that salinity levels along the Mississippi Gulf Coast are usually lower than standard ocean water levels (usually in the oligohaline levels) due to the outflow of the Mississippi River and other freshwater streams/creeks that shuttle water into the coast. To best account for this unique feature of the in-shore waters of the Mississippi Gulf Coast, we chose to utilize both the EPA Method 1603 for E. coli enumeration (freshwater) and Enterococci (fresh and marine waters) as per the USEPA recommendations. Serial dilutions were prepared from each water sample in phosphate-buffered saline solution (PBS). Volumes of 10 mL of each of the dilutions together with additional undiluted volumes of 10 mL and 50 mL water were then filtered using a 0.45 µm membrane filter (Millipore, Billerica, MA, USA) using the vacuum filtration method. Each of these filters were then placed onto: (a) a 47 mm Difco® modified mTEC agar plates (Becton, Dickinson and Company, Sparks, MD, USA) followed by incubation in a water bath set at 44.5 °C for 24 ± 2 h in accordance with EPA Method 1603 for E. coli isolation [1,50], and (b) a 47 mm BBL™ mEI agar (Becton, Dickinson and Company, Sparks, MD, USA) followed by incubation in a water bath set at 41 ± 0.5 °C for 24 ± 2 h in accordance with EPA Method 1600 for Enterococcus isolation [1,49].
After incubation, E. coli (magenta) and Enterococcus (blue) colonies per sample were counted using a colony counter (Cole Palmer, Vernon Hills, IL, USA). Counts were expressed as CFU (colony forming units) 100−1 water sample. Following counting, the colonies on the plates were selected randomly and aseptically streaked onto freshly prepared Difco® Tryptic Soy agar (TSA) plates (Becton, Dickinson and Company, Sparks, MD, USA), and then incubated at 37 °C. Following this isolation step, isolated colonies from each TSA plate were transferred to 1.5 mL of 20% glycerol stock solution prepared in Difco® Tryptic Soy Broth (TSB) for isolate archival purposes and then stored at −80 °C freezer for future analysis purposes.

2.5. Antibiotic Resistance Analysis and Multidrug Resistance Analysis

Following isolation, the E. coli and Enterococcus colonies were examined for antibiotic resistance utilizing the Kirby–Bauer disc diffusion method [51] testing altogether for a total of eight different antibiotics. Selection of the antibiotics was completed based on their differences in mode of action and their clinical, pharmaceutical, and veterinary uses. Details on the antibiotics used, their respective drug classes, and clinical significance are listed in Table S2. Eight antibiotic susceptibility discs (Becton, Dickinson and Company, Franklin Lakes, NJ, USA) comprised of erythromycin (E15—15 µg), tetracycline (TE30—30 µg), ampicillin (AM10—10 µg), ciprofloxacin (CIP5—5 µg), imipenem (IPM10—10 µg), sulfamethoxazole/trimethoprim (SXT—23.75/1.25 µg), cephalothin (CF30—30 µg), amoxicillin (AM10—30 µg) were used for testing each isolate. Discs were placed on the MHA plate with a BBL® Sensi-Disc® 8-place Dispenser (Becton, Dickinson and Company, Franklin Lakes, NJ, USA).
In brief, the E. coli and Enterococcus colonies were first inoculated into BBL® Tryptic Soy Broth tubes (Becton, Dickinson and Company, Sparks, MD, USA) from the stock tubes and then allowed to grow in a 37 °C incubator. Turbidity was checked using a pre-prepared 0.5 McFarland standard that corresponds to a 107–108 CFU/mL bacterial cell count. Following incubation, broth samples were swabbed onto 100 mm Mueller Hinton Agar (MHA) (Sigma Aldrich), plates using sterile cotton swabs. These MHA plates were then stamped with the antibiotic dispenser device containing the eight different antibiotic discs and incubated at 37 °C for 24 ± 2 h.
Post MHA incubation, the diameters of the zones of inhibition were manually measured using a mm ruler to analyze patterns of resistance or susceptibility of each isolate, following the Clinical and Laboratory Standards Institute (CLSI) standards. In addition, the standard ATCC strains E. coli 25922, Staphylococcus aureus 25923, and Pseudomonas aeruginosa 27853, were used as positive controls to measure the repeatability of the antibiotic susceptibility testing process.
Following the measurement of diameters, each isolate was categorized into either susceptible or resistant to ≥2, ≥3, ≥4, ≥5, ≥6, ≥7, and 8 antibiotics. Analysis of MDR was conducted by taking the binomial resistance values of each isolate tested for antibiotic resistance. For reporting purposes, isolates belonging to intermediate categories in the manufacturer list were considered to be resistant.

2.6. Statistical Analyses

E. coli and enterococci levels were log10 transformed prior to statistical analysis to achieve normality. A mixed model analysis with sampling location and sampling date as the independent class variables was utilized to compare mean E. coli or enterococci levels. Furthermore, sampling dates were binned to Summer–Fall and Winter–Spring, compromising samples collected in May–October and November–April, respectively. Binned season and sampling location (Biloxi, Gulfport, Long Beach, and Pass Christian) were tested for significant interactions, while sampling date and sampling site were tested for significant interactions. Models (binned season versus sampling date) were compared using AIC best fit statistics, and the best fit model was utilized for further comparisons and discussions. Means were considered to be significantly different at p < 0.05. All pairwise means were post hoc compared utilizing the difference of least square means with Tukey’s post hoc correction. A Chi square test for independence was applied between season or sample site, as independent class variables, and E. coli or enterococci isolate antibiotic resistant proportions, respectively. To avoid asymptotic cells, isolates were binned to season. Any tested relationship was considered to be significant at p < 0.05, or when the Chi square sum was greater than 3.84. Post hoc multi-comparison tests were conducted, where appropriate, by using pairwise Chi square tests for binned season following Bonferroni correction. Pearson correlations were conducted between temperature, pH, salinity, E. coli, and enterococci. Correlations were considered to be significant at p < 0.05.

3. Results

3.1. Analysis of Microbial Contamination

3.1.1. E. coli Contamination Measurements

Results from E. coli FIB contamination measurements are listed in Table 1A. Based on EPA recommendations of recreational water quality standards, the criteria for E. coli (freshwater) is 126 cfu 100 mL−1 [1]. Overall, across all sampling sites and months, nine out of the ten sampling sites reported E. coli contamination values that were higher than these recommended standards. For the most part, many of the sites were statistically similar, though Sites 1, 2, 4, 6, and 9 were statistically elevated over at least one other study site (p < 0.05), while Site 7 was typically lower than all other sites (p < 0.05) following post hoc pairwise comparisons. Except for Site 7, which displayed an average of 111.8 cfu 100 mL−1, all the other nine sites displayed extremely high E. coli contamination levels on an average across all sites and sampling months, ranging from 181.6 cfu 100 mL−1 from Site 8 in Biloxi to 990.8 cfu 100 mL−1 from Site 4 in Long Beach (Table 1A). Among all the sites tested, Site 4 in Long Beach, MS displayed the highest mean of E. coli across all sampling months, although most of the very high contamination in this particular site was found during the months of September 2020 and July 2021. When sample locations were grouped, E. coli levels in Pass Christian were statistically greater (p = 0.0455) than Gulfport sampling sites, while other locations were not statistically different following post hoc pairwise comparisons. Sample E. coli levels collected in the Summer and Fall seasons were also statistically elevated when compared to other seasons (p < 0.05), with levels approximately 1 log10 greater. Our E. coli contamination measurements in Sites 5 and 6 in Gulfport remained consistently high averaging at 472.6 cfu 100 mL−1 and 669.2 cfu 100 mL−1, respectively. Site 6 in Gulfport, a popular recreational beach area, exhibited the second highest of the E. coli mean averaging at 669 cfu 100 mL−1 (Table 1A). Contamination values were consistently lower during the winter months of December, January, and March. This observation is not uncommon and is likely due to the cooler temperatures during those months in this area which usually lowers overall microbial cell densities during these periods. The highest amount of contamination was observed during the summer month of May 2021 during which all the 7 sites displayed cfu values much higher than the EPA’s recommended values. This observation remained consistent during the following summer months of June and July 2021 during which the levels of contaminations exceeded well beyond the criteria—in particular the sites in Gulfport displaying very high levels of E. coli cfu (Table 1A). Sites 7 in Gulfport and 8 in Biloxi displayed the lowest levels of E. coli contamination across all sampling sites ranging at 111.8 cfu 100 mL−1 and 181.6 100 cfu mL−1.

3.1.2. Enterococcus Contamination Measurements

Results from Enterococcus FIB contamination measurements are listed in Table 1B. Based on EPA recommendations of recreational water quality standards, the criteria for Enterococcus (marine and freshwater) is 35 cfu 100 mL−1 [1]. Following post hoc comparison, sample site did not significantly affect Enterococcus levels (p > 0.05), though there were some trends associated with sampling site. Within all sampling months, Site 9 in Biloxi displayed the highest mean at 674.6 cfu 100 mL−1, while Site 7 in Gulfport displayed the lowest mean at 9.2 cfu 100 mL−1 (Table 1B). Seven out of the ten sampling sites displayed Enterococcus values that had significantly higher than recommended cfu values, ranging between 54.6 cfu 100 mL−1 in Site 5 in Gulfport to 674.6 cfu 100 mL−1 in Site 9 in Biloxi. On an average over all months, the highest value for Enterococcus contamination occurred at Site 9 in Biloxi at 674.6 cfu 100 mL−1, followed by Sites 6 in Gulfport at 636 cfu 100 mL−1, and Site 1 at Pass Christian at 134 cfu 100 mL−1 (Table 1B). Similar to the observations with E. coli cfu across all sampling months, the Enterococcus contamination values were also consistently lower during the winter months of December, January, and March. Parallel to our observations with the E. coli contamination data, the summer month of May reported the highest amounts of Enterococcus contamination as well, during which all the sampled sites displayed observed cfu values well above the EPA’s recommended values. When binning samples by season, samples collected in the Spring and Summer were statistically elevated over other seasons (p < 0.05) following post hoc pairwise comparisons. Additionally, consistent with our analysis of the E. coli cfu values, the Enterococcus cfu values were also found to be the lowest in Site 7 in Gulfport and Site 8 in Biloxi ranging between 9.2 cfu 100 mL−1 and 21 cfu 100 mL−1, respectively, on an average over all sites and sampling events (Table 1B). While these values were lowest overall, the mean values suggested no statistically significant variances between sample sites (p > 0.05).

3.2. Antimicrobial Resistance (AMR) Patterns for Individual Antibiotic Tested

3.2.1. E. coli AMR Patterns

The total number and percentage of E. coli isolates displaying antimicrobial resistance (AMR) observed across all sites and sampling events are listed in Tables S3 and S4 and displayed in Figure 2A. Within the total of 380 E. coli isolates collected across all sampling months, the highest antibiotic resistance rate within E. coli isolates was to the antibiotic erythromycin at 94.9%, followed by cephalothin at 82.8%, ampicillin at 54.3%, amoxicillin at 34.9%, tetracycline at 22.6%, imipenem at 8.5%, ciprofloxacin and sulfamethoxazole being the least at 6.9%. Erythromycin resistance within the E. coli isolates ranged between 75.6% in December 2020 to a 100% during the months of September 2020, October 2020, November 2020, April 2021, May 2021, and June 2021—averaging at 94.9%. This was followed by resistance to the antibiotic cephalothin ranging between 36.2%, in July 2021 to 100% in March 2021—averaging at 82.8% across all sampling months; while, six out of the ten sampled months exhibited >90% resistance to this antibiotic (Tables S3 and S4 and Figure 2A). Resistance to the antibiotic ampicillin was the third highest overall ranging between 28.6% during the winter month of January 2021 and 82.1% during the hotter month of October 2020—averaging at 54.3% across all sampling months (Tables S3 and S4 and Figure 2A). Ampicillin resistance was reported to be at least >50% within five out of the ten sampled sites. Resistance to amoxicillin was next ranging between 0% in the colder month of January 2021, 24.4% in December 2020, and 53.2% during the summer month of July 2021—averaging at 34.9% overall across all months (Tables S3 and S4 and Figure 2A). Tetracycline resistance was recorded to be the fourth highest between 0% in January 2021, and 48% in October 2021—averaging at 22.6% across all sampling months. Tetracycline resistance within the E. coli isolates was recorded to be at least >30% within four out of the ten sampled sites. Strikingly, resistance to the last resort antibiotic imipenem was recorded on an average 8.5% and at least six out of the ten sampling months found E. coli isolates resistant to imipenem. Overall, 39 out of the total 380 isolates of E. coli exhibited resistance to this last resort antibiotic, the highest being in the month of July 2021 at 63.8% (Tables S3 and S4 and Figure 2A). Resistance to both ciprofloxacin and sulfamethoxazole was next at 6.9% average across all sampling sites. Both sulfamethoxazole resistance and ciprofloxacin resistance within the E. coli isolates was observed to be the highest during the summer months—17.1% for sulfamethoxazole during June 2021 and 16.3% for ciprofloxacin during May 2021. In case of sulfamethoxazole, seven out of the ten sites showed E. coli isolates >5% resistance, and in the case of ciprofloxacin, five out the ten sites showed at least >5% resistance.
The highest overall resistance to all antibiotics was observed to be during the summer and fall months—October 2020 (47.8%), June 2021 (47.3%), September 2020 (46.9%), and May 2021 (46.4%). Resistance to erythromycin and tetracycline was influenced by season, specifically Fall, Spring, and Summer (p < 0.01). Resistance to amoxicillin and ampicillin was more typical from samples collected during Fall and Summer, while resistance to cephalothin was more detectable in Spring samples (p < 0.01). Location did not have an influence on resistance to any one antibiotic (p > 0.05).

3.2.2. Enterococcus AMR Patterns

The total number and percentage of Enterococcus isolates displaying antimicrobial resistance (AMR) observed across all sites and sampling events are listed in Tables S5 and S6 and displayed in Figure 2B. Within the 266 Enterococcus isolates collected across all sites and 10 sampling events, the highest resistance was shown in ciprofloxacin at 75.8%, followed by erythromycin at 75%, cephalothin at 61.4%, tetracycline at 38.6%, sulfamethoxazole at 33.1%, amoxicillin at 7.8%, closely followed by ampicillin at 7.5%, and imipenem having the lowest resistance of 2.6% (Tables S3 and S4 and Figure 2B). Of these, ciprofloxacin resistance ranged between 57.9% during September 2020 and remained consistently high through all months irrespective of seasonal temperature variations, the highest being during the month of December 2020 at 87%. Resistance to erythromycin was next, ranging between 50% in November 2020 to a 100% in December 2020—averaging at 75% across all sampling months (Tables S3 and S4 and Figure 2B). It is important to mention here that all ten sampled sites reported resistance to ciprofloxacin and erythromycin to be extremely high and at least >50% at all times. Resistance to cephalothin within the Enterococcus isolates was also recorded to be very high ranging between 30.4% in December 2020 to 100% in January 2021—averaging at 61.4% overall across all months. At least six out of the ten sampled sites exhibited resistance to this antibiotic at least >50% of the times (Tables S3 and S4 and Figure 2B). Tetracycline resistance amongst the Enterococcus isolates was also observed to be very high—15.8% in October 2020 to 69.6% in May 2021—averaging at 38.6% overall. Resistance within the Enterococcus isolates to the antibiotic sulfamethoxazole ranged between 14.3% during March 2021 and 68.4% during the fall month of September 2020—averaging at 33.1% overall across all months. Amoxycillin resistance was next between 4.3% during the winter month of December 2020 to 31.3% during the summer month of June 2021—averaging at 7.8% overall (Tables S3 and S4 and Figure 2B). Resistance to the last resort carbapenem group antibiotic imipenem was observed to be quite high within the Enterococcus isolates within at least 7 out of the total 266 isolates being resistant to this antibiotic group. Highest AMR within the Enterococcus isolates across all antibiotics overall was observed during the month of June 2021 at 56.6%, followed by May 2021 and April 2021 at 42.1%. Location had minimal influence on resistance to specific antibiotics. For example, resistance to erythromycin, AMC, and SXT were all influenced by location (p < 0.01). Specifically, Biloxi selected for resistance to erythromycin, AMC, and SXT (p < 0.01). Season did not have a significant effect on resistance to any one antibiotic (p > 0.05).

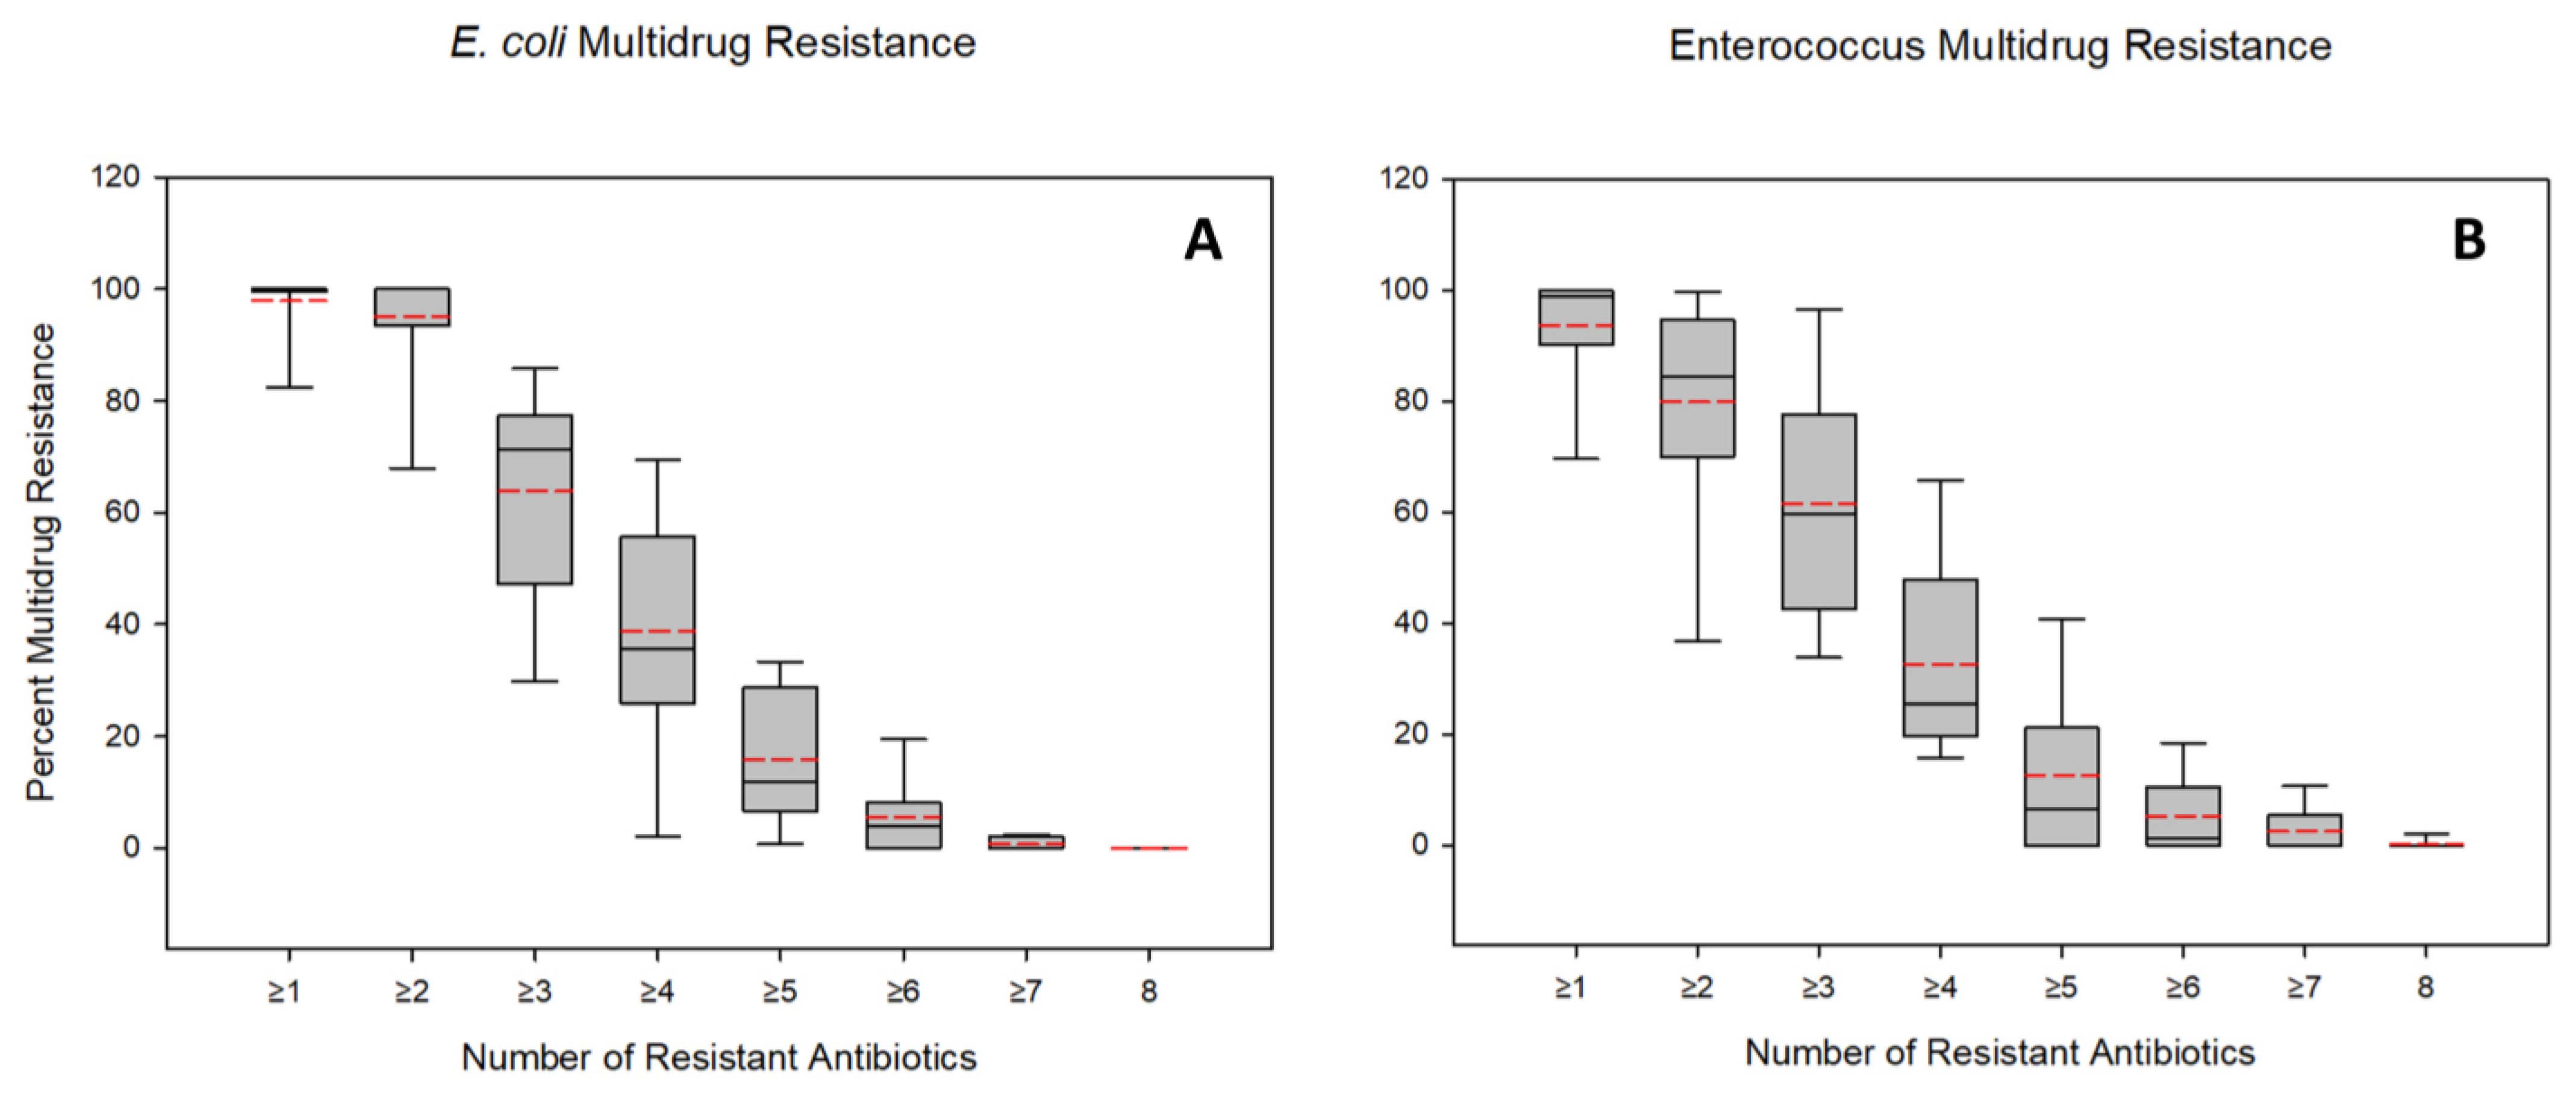
3.3. Multidrug Resistance Patterns

3.3.1. E. coli MDR Patterns

The total number and percentage of E. coli isolates displaying multidrug resistance (MDR) observed across all sites and sampling events are listed in Table S7 and displayed in Figure 3A. One of the most prominent findings of this study is that of the 380 total E. coli isolates, 370 (97.3%) were found to be resistant to at least one antibiotic. Presence of MDR (≥2 category) was noted to be very high—360 out of the total 380 isolates (94.6%) were resistant to at least two antibiotics. Of the rest of the isolates, 244 isolates (64.5%) belonged to the ≥3 category, 156 isolates (41.8%) belonged to the ≥4 category, 68 (18.2%) isolates fell into the ≥5 category, 23 (6.3%) were resistant to ≥5 antibiotics (Table S7 and Figure 3A). Of the total 380 isolates, 3 were found to be resistant to a total of 7 different antibiotics, isolated during the summer months of April 2021, May 2021, and July 2021. Consistent with the findings on E. coli contamination and the AMR patterns, the MDR E. coli was also found to be fewer during the colder months of November’20, December’20, and January 2021 (Table S7 and Figure 3A). Overall, MDR was influenced by sample location and season. Multi-drug resistant E. coli were influenced by season with Spring, Fall, and Summer influencing resistance to ≥1 antibiotic (p < 0.01); all but one of three isolates from Summer were resistant to ≥1 antibiotic, while all isolates in Spring and Fall were resistant to ≥1 antibiotic (p < 0.01). Resistance to ≥2 antibiotics was also influenced by season (p < 0.01), following a similar trend. Isolates resistant to ≥4 antibiotics were influenced by season, as Fall and Summer tended to select for these isolates (p < 0.01). Resistance to ≥5 antibiotics was influenced by season with summer more prone to selection over Winter (p < 0.01). Location did not influence MDR E. coli isolates (p > 0.05).

3.3.2. Enterococcus MDR Patterns

The total number and percentage of E. coli isolates displaying MDR observed across all sites and sampling events are listed in Table S8 and displayed in Figure 3B. Similar to the E. coli MDR patterns, Enterococcus isolates also displayed a very high MDR overall across all sites and sampling events. Out of the 266 total Enterococcus isolates, 254 were found to be resistant to at least one antibiotic (95.8%). Within the rest of the isolates, a large number fell within the MDR categories—230 (87.3%) belonging to the ≥2 category, 177 (66.4%) belonging to the ≥3 category, and 104 (37.9%) falling into the ≥4 category. Of the rest, at least 49 isolates (17.9%) were resistant to at least 5 antibiotics (≥5 category), and 22 (8.4%) isolates were resistant to at least 6 antibiotics (≥6 category) (Table S8 and Figure 3B). Ten (3.6%) out of the 266 totals were found to be resistant to ≥7 antibiotics. Out of the 266, one Enterococcus isolate was resistant to all eight antibiotics we tested. Contrary to E. coli isolates, location did influence isolates’ resistant to ≥4, 5, and 6 antibiotics with Biloxi and Long Beach more selective (p < 0.01). As with E. coli, season selected for MDR isolates. Summer selected for resistance ≥3, 4, 5, and 6 antibiotics (p < 0.01).

3.4. Variations in Physical Parameters in Relation to E. coli and Enterococcus Numbers

Overall, all three measured physical parameters (temperature, pH, and salinity %) were low or moderately correlated with one or both measured bacterial parameters (Figure 4). For example, temperature was moderately (r = 0.48) correlated with E. coli levels (p < 0.001), while temperature was lower (r = 0.24) correlated with Enterococcus levels (p < 0.05). Percent salinity was moderately (r = −0.45) and strongly (r = −0.54) negatively correlated with E. coli and Enterococcus levels, respectively (p < 0.0001). The mean temperature across all samples was 21.3 °C, while the mean salinity was 16.24%. Water pH was only low correlated with E. coli levels. The average pH across samples was 7.73.

4. Discussion

4.1. FIB Contamination in the Mississippi Gulf Coast

Both E. coli and Enterococcus are FIBs that have been routinely used for decades to identify microbial contamination in water and soil sources based on EPA recommendations [1,49,50]. Both of these bacteria are also opportunistic pathogens, meaning they can cause serious infections in animals and humans, e.g., bacteremia, soft tissue infections, urinary tract infections, and meningitis, among others [52,53,54,55,56]. Coastal recreational beaches have in the past been associated with high FIB contamination resulting from sewage contamination issues. Pathogenic microorganisms associated with such sewage contamination are prone to causing severe gastrointestinal diseases and therefore can be of high risk for individuals using this water for recreational purposes (e.g., swimming), in particular those with developing or weakened immune systems such as the children or the elderly [8,57,58]. In addition, both of these groups have been identified to fall within the categories of urgent (carbapenem resistant Enterobacteriaceae) and serious (ESBL producing Enterobacteriaceae and vancomycin resistant Enterococcus) in the recent 2019 CDC antibiotic resistance threats report, reported to cause thousands of deaths within the United States [33]. According to the same report, it is therefore very important for scientists to study the distribution of the AMR and MDR bacteria within environmental sources to identify the gaps in our understanding so we can together help develop better control measures for this extremely vital public health issue we are now faced with worldwide.
Our data on Enterococcus contamination measurements are comparatively lower compared to one other study performed on the Mississippi Gulf coast between 2007 and 2008 [59] that utilized the same analytical methods. According to Flood et al. (2010), the six coastal sites the team had analyzed displayed Enterococcus values of 402 cfu 100 mL−1 on an average taken over all sampling events, while our study across the ten sites and ten sampling events reveal Enterococcus values to be lower than that—averaging at 175.5 cfu 100 mL−1 with Site 9 in Biloxi displaying the highest Enterococcus numbers at 674.6 cfu mL−1 on an average over all sampling events. Our data also suggested a seasonal effect, whereby E. coli and enterococci levels collected in the summer and fall months were statistically greater than samples collected during winter and spring, which corroborates previous reviews in the literature [60]. Similarly, resistance rates were also positively associated with spring, summer, and fall samplings. While not all resistance rates were related to time of year, amoxicillin, ampicillin, and cephalothin antibiotics were seemingly influenced by time of year, suggesting E. coli strains isolated during these months had resistance pathways related to β-lactam class antibiotics, which may be related to source or environmental selective pressures. Singh et al. (2019) [61] reviewed the literature and found resistance rates were affected by seasonality, however rates were more dependent on possible agricultural activities (e.g., manure application) or seasonality related to weather patterns.
In another study examining the Florida Gulf Coast beaches [5], Enterococci levels were found to exceed EPA standards in 13.9% of the water samples collected. Additionally, a more recent study conducted on the Florida beaches [62] found the enterococci levels to exceed the EPA determined values by 33–100% of the samples across the three studied beaches on the Florida coast. Comparable to these studies, our Enterococcus numbers exceeded EPA standards at least in 60% of the samples collected on average (6 out of the 10 sites) (see Table 1B). Sabater et al. (2022) [62] also reports comparatively high E. coli numbers in three of the studied Florida Gulf Coast beaches that ranged between 100 and 1000 cfu mL−1 between the three sites under study.
Both the E. coli and Enterococcus cfu values found in our study are an alarming finding since many of these enterococci isolated from the same samples were also resistant to multiple antibiotics belonging to the MDR (‘superbugs’) category, which raises immediate public health and safety concerns for the Mississippi Gulf Coast beaches routinely used by the public for multiple recreational purposes including swimming, boating, fishing, etc.

4.2. Antimicrobial Resistance Patterns along the Mississippi Gulf Coast

Antimicrobial resistance and multidrug resistance found in the FIB populations within recreational waters are of great concern because these pathogens are opportunistic and are involved in healthcare associated infections (HAIs) [26,57,58,63,64,65]. Many of these organisms that also display AMR and MDR have been reported to be within the high-risk categories in respect to the worldwide AMR crisis situation [15,33]. In addition, because bacteria are proficient in horizontal gene transfers between related species by utilizing multiple gene transfer mechanisms such as transformation, transduction, and conjugation, the presence of high AMR and MDR within the FIBs can be indicative of similar potential gene transfers to other highly pathogenic microorganisms that can be present in contaminated recreational water bodies possibly resulting from sewage contamination [5,66,67].
Erythromycin is one of the most frequently prescribed antibiotics (macrolides) worldwide [5,68]. Erythromycin resistance was found to be very high within both the E. coli and the Enterococcus isolates (average at 94.9% within E. coli and 75% within Enterococcus) across all our sampling times and sites. The recent study Sabater et al. (2022) [62] on the AMR bacteria within the beaches of the Florida Gulf coast found comparable values of erythromycin resistance to be 83% within their Enterococcus isolates. In another study examining AMR prevalence at the freshwater beaches of Lake Huron, erythromycin resistance was found to be comparatively lower at 26%. Resistance to ciprofloxacin, a broad-spectrum antibiotic regularly used for both Gram-positive and negative infections [69], was very high at 75.8% within the Enterococcus isolates, and 6.9% within the E. coli isolates. Our previous study focusing on AMR and MDR in the Maumee River of Lake Erie found ciprofloxacin resistance to be much lower at only 4.2% within the E. coli isolates [31], while resistance to this drug within Enterococcus was not examined. Ampicillin resistance was quite high at 54.3%within E. coli isolates and 7.5% within the Enterococcus isolates, comparable to Sabater et al. (2022) [62] who found ampicillin resistance within both E. coli and Enterococcus from the Florida Gulf coast beaches to be extremely high at 100% and 97%, respectively. In contrast, the freshwaters of the Maumee River found E. coli isolates resistant to this drug at 38.3% [31]. Ampicillin is one of the penicillin group drugs routinely used clinically as a primary drug to treat infections such as respiratory, gastrointestinal, and urinary tract infections [70], and therefore such high resistance to this antibiotic within the coastal waters of Mississippi is worrisome. The sulfamethoxazole resistance detected in this study is comparatively higher than other studies. For example, Sayah et al. (2005) [71] found sulfamethoxazole resistance to be at 2.5% in a watershed in Michigan. In contrast, our study reports resistance to this antibiotic to be at 33% within Enterococcus isolates and 6.9% within the E. coli isolates. Imipenem is a group 2 carbapenem, resistance to which is usually considered to be the last line of defense against Gram-negative pathogenic infections.
Carbapenem resistant Enterobacteriaceae (CRE) is considered one of the most urgent threats to public health due to the high mortality rates and complications associated with such infections [72,73]. Some recent studies have reported incidences of carbapenem resistance and its dissemination through environmental sources such as marine surface water and freshwater [74,75,76,77,78,79]. Our study indicates a comparatively high occurrence of imipenem resistance within both E. coli and Enterococcus isolates from the Mississippi coast sample sites (8.5% for E. coli and 2.6% for Enterococcus overall). This observation exceeds all of our previous studies examining imipenem resistance in the Maumee River, OH (only 2 out of 329 isolates reported to be resistant) [31], and none in the Carter Creek watershed, TX [30], or water runoff from multiple USDA-ARS research sites [29]. Another comprehensive study focusing only on carbapenem resistance conducted on the coastal waters near Netanya, Israel, have found CRE’s in these samples to be as high as 16% [74]. Sources of CREs in environmental and coastal waters have been reported to be multiple including wastewater treatment plants, hospital effluents, livestock, and agricultural discharges, among others.

4.3. Multidrug Resistance Patterns along the Mississippi Gulf Coast

MDR patterns along the Mississippi Gulf Coast as observed in this study were very high overall, when compared to other studies on related coastal and freshwater sites. For example, Mukherjee et al. (2021) [31] found relatively lower abundances of MDR bacteria in the urban regions of the Maumee River near Lake Erie, the highest category found being ≥5 which amounted to an average of 1.2% within the total 329 E. coli isolates collected from the river. While this is still a comparatively high number considering the strains were found to be resistant to at least five antibiotics, this study along the Mississippi Gulf Coast found much higher levels of MDR, including at least three E. coli isolates resistant to a total of seven different antibiotics, and one Enterococcus isolate that was resistant to all eight antibiotics. Multidrug resistance (MDR) bacteria are defined as bacteria resistant to at least three antibiotics, colloquially known as ‘superbugs’ [80]. Considering this definition of MDR bacteria, the Mississippi Gulf coast was found to harbor 64.5% of MDR E. coli and 66.3% MDR Enterococcus. These numbers are higher than our previous study on the Maumee River adjacent to the city of Toledo, Ohio (Mukherjee et al., 2021) where MDR E. coli was found to be only 15% on average. Among other studies that examined the distribution of MDR bacteria in coastal waters, the more recent study on the Florida Gulf Coast [62] found the frequency of multidrug resistance to be <20% within E. coli and 50% within Enterococcus isolates, relatively much higher than what was found in this study. This trend is similar to findings reported in Alm et al. (2014) [21], in which the investigators found only eight E. coli isolates (5.4%) and twenty-seven Enterococcus isolates (18%) from the beaches in Lake Michigan displaying resistance to ≥3 antibiotics.
Overall, AMR and MDR patterns found in our study are either comparable or found to be relatively much higher than other similar studies conducted on coastal and freshwater beaches [62], and mostly higher than that what was seen in freshwater beaches [21,31]. It is important to note that this study was based on culture-based methods only, targeting eight different antibiotics. Further investigations using molecular based approaches targeting antibiotic resistance genes or the entire antibiotic ‘resistome’ would lend additional insights into these results. Both E. coli and Enterococcus are FIBs, and therefore the presence of such high MDR values within their populations along the Mississippi Gulf Coast could also be indicative of similar resistance profiles within other pathogenic bacteria in the coastal waters. In addition to being intestinal commensals and their role as FIBs, both E. coli and Enterococcus can also cause human diseases, specifically healthcare associated infections or HAIs. As such, the data collected and presented in this study is indicative of a highly concerning level of fecal indicator bacterial contamination in these coastal waters, an alarming number of which are also found to be multidrug resistant and resistant to several antibiotics regularly used in healthcare treatment facilities for humans and animals. It is important to mention here that future analysis of the concentrations of specific antibiotics in these waters might also provide additional insights into the selection pressure antibiotics play in the prevalence of AMR/MDR bacteria and the correlations between antibiotics and ARB. Moreover, additional environmental factors such as dissolved organic carbon, total nitrogen, and phosphorus might also have an impact on these AMR/MDR values and future investigations into these parameters would help understand the occurrence and distribution of these communities in the coastal waters. Furthermore, recent studies have indicated that cyanobacterial blooms influence AMR bacterial communities [81]. Since the Mississippi Gulf coast has been experiencing periodic algal blooms each year, it would also be interesting to gain future insights into how the cyanobacterial blooms impact the structure, composition, and diversity of the AMR/MDR bacterial communities in this location.
While in this particular study we have not specifically examined the sources of these AMR and MDR contaminations along the Mississippi coast, the Gulf coast is one of the most urban, industrial, and tourist active related areas within the state of Mississippi and therefore potentially harbors all of these previously suggested sources of discharges into these coastal waters. Moreover, multiple Mississippi creeks flow into these waters throughout the coast carrying water and effluent from a variety of such different sources [59]. The dominant agriculture commodity within the state is poultry production, while soybeans, corn, and cotton production are in the top five commodities. These cash crops often utilize poultry manure as a fertilizer source and while out of the scope of this study, research has indicated that poultry manure can lead to runoff of AMR FIBs [82]. In addition, as mentioned earlier, the Bonnet Carré Spillway incident also resulted in the undesired routing of water from Louisiana into the Mississippi coast [38,43,45,46,47], which may have eventually impacted and heightened these incidences. While all of these are subject to further detailed investigations on the sources and discharge points in additional detail, it is safe to say that while the observed AMR and MDR values, including carbapenem resistance, are highly alarming, it is certainly not a surprising outcome, considering the location and the information similar previous studies on such coastal waters have reported earlier.

5. Conclusions

This is the first study revealing the occurrence and distribution of AMR and MDR within the FIB population in the Mississippi Gulf Coast. Overall, our study spanning a period of ten months of sampling and analysis between 2020 and 2021 on ten coastal recreational sites across the Mississippi Gulf coast reveals concerning levels of both E. coli and Enterococcus contamination. Our study also reports that a remarkably high percentage of these indicator bacteria found in the shore waters are also resistant to multiple antibiotics that are routinely used in clinical and veterinary practices—a concerning number of which were also found to belong to the category of multidrug resistant ‘superbugs’. While this study was conducted on only E. coli and Enterococcus isolates, those two groups are used routinely for identification of microbial pathogenic contaminants in recreational waters worldwide, based on the EPA water quality standards. This is primarily a culture-based study in which eight antibiotics were selected for testing AMR and MDR patterns within two different indicators of fecal contamination in the Mississippi coastal waters. Therefore, further molecular analysis directed towards quantifying the various antibiotic resistant genes across the coastal waters will reveal additional information on the occurrence and distribution of these ‘superbugs’ in the Mississippi Gulf Coast. Additionally, in the future, we also plan to investigate the sources of these FIBs and the high AMR/MDR levels in the coastal waters utilizing microbial source tracking techniques.

Supplementary Materials

The following supporting information can be downloaded at: https://www.mdpi.com/article/10.3390/w15132339/s1. Table S1: Sampling Site descriptions and coordinates; Table S2: Antibiotics used in this study, their classes, and their clinical significance; Table S3: Number of E. coli isolates expressing resistance to antibiotics, by sampling month; Table S4: Number of E. coli isolates expressing resistance to antibiotics, by sampling site across all sampling events; Table S5: Number of Enterococcus isolates expressing resistance to antibiotics, by sampling month. Percentages are shown in parentheses; Table S6: Number of Enterococcus isolates expressing resistance to antibiotics, by sampling site. Percentages are shown in parentheses; Table S7: Number of E. coli MDR isolates (%) expressing resistance to ≥1, ≥2, ≥3, ≥4, ≥5, ≥6, and ≥7 antibiotics, across all sampling events; Table S8: Number of Enterococcus MDR isolates (%) expressing resistance to ≥1, ≥2, ≥3, ≥4, ≥5, ≥6, and ≥7 antibiotics, across all sampling events.

Author Contributions

Conceptualization, M.M.; methodology, M.M., R.E.C., E.A., K.A.G. and K.M.; formal analysis, M.M., J.P.B., R.E.C., E.A., K.A.G. and K.M.; data curation, M.M. and R.E.C.; writing—original draft preparation, M.M. and J.P.B.; writing—review and editing, M.M., R.E.C. and J.P.B.; Supervision, M.M.; project administration, M.M.; funding acquisition, M.M. All authors have read and agreed to the published version of the manuscript.

Funding

Funding provided by a research seed grant ($5000) awarded to the PI (M.M.) by the University of Southern Mississippi College of Arts and Sciences.

Data Availability Statement

Data are available from the authors upon reasonable request.

Acknowledgments

We are very grateful to Jennifer Walker (USM Gulf Park, School of Coastal Resilience) for her invaluable assistance and insights that went into the launch, implementation, and completion of this study. We express our deepest gratitude to Shiao Wang (USM Gulf Park, School of Coastal Resilience) for providing our lab and the students with several of the supplies and equipment required to conduct this research without which this study would not be possible. We thank USM undergraduate students Karah LeBuda and Clarence Nichols for supporting some of the sampling events and helping with laboratory sample processing. We thank Erik Crosman (WTAMU Dept. Life, Earth, and Environmental Sciences) for helping us develop the map in Figure 1. We also thank the reviewers of this article for their thoughtful and thorough feedback. Part of data from this project presented here in this article has been presented in the form of poster presentations at the Mississippi Academy of Sciences meeting in 2021, American Society for Microbiology World Microbe Forum meeting in 2021, and the American Society for Microbiology—Texas Branch meeting in 2022.

Conflicts of Interest

Authors declare no conflict of interest.

Abbreviations

AMR: antimicrobial resistance; MDR: multidrug resistance; ARG: antibiotic resistant genes; CDC: Centers for Disease Control; WHO: World Health Organization; MHA: Mueller Hinton Agar; TSA: Tryptic Soy Agar; TSB: Tryptic Soy Broth; CFU: colony forming unit; EPA: Environmental Protection Agency, FIB: fecal indicator bacteria.

References

  1. USEPA (United States Environmental Protection Agency) Recreational Water Quality Criteria and Methods. 2013. Available online: https://www.epa.gov/wqc/recreational-water-quality-criteria-and-methods (accessed on 7 February 2022).
  2. Devine, J. Testing the Waters 2014: A Guide to Water Quality at Vacation Beaches. 2014. Available online: https://www.nrdc.org/resources/testing-waters-2014-guide-water-quality-vacation-beaches (accessed on 16 November 2022).
  3. Garrido-Pérez, M.; Anfuso, E.; Acevedo, A.; Perales-Vargas-Machuca, J. Microbial indicators of faecal contamination in waters and sediments of beach bathing zones. Int. J. Hyg. Environ. Health 2008, 211, 510–517. [Google Scholar] [CrossRef] [PubMed]
  4. Halliday, E.; Gast, R.J. Bacteria in Beach Sands: An Emerging Challenge in Protecting Coastal Water Quality and Bather Health. Environ. Sci. Technol. 2010, 45, 370–379. [Google Scholar] [CrossRef] [PubMed] [Green Version]
  5. Korajkic, A.; McMinn, B.R.; Harwood, V.J. Relationships between Microbial Indicators and Pathogens in Recreational Water Settings. Int. J. Environ. Res. Public Health 2018, 15, 2842. [Google Scholar] [CrossRef] [PubMed] [Green Version]
  6. Klevens, R.M.; Edwards, J.R.; Richards, C.L., Jr.; Horan, T.C.; Gaynes, R.P.; Pollock, D.A.; Cardo, D.M. Estimating Health Care-Associated Infections and Deaths in U.S. Hospitals, 2002. Public Health Rep. 2007, 122, 160–166. [Google Scholar] [CrossRef]
  7. Baquero, F.; Martinez, J.L.; Cantón, R. Antibiotics and antibiotic resistance in water environments. Curr. Opin. Biotechnol. 2008, 19, 260–265. [Google Scholar] [CrossRef]
  8. Zhang, X.-X.; Zhang, T.; Fang, H.H.P. Antibiotic resistance genes in water environment. Appl. Microbiol. Biotechnol. 2009, 82, 397–414. [Google Scholar] [CrossRef]
  9. Allen, H.K.; Donato, J.; Wang, H.H.; Cloud-Hansen, K.A.; Davies, J.; Handelsman, J. Call of the wild: Antibiotic resistance genes in natural environments. Nat. Rev. Genet. 2010, 8, 251–259. [Google Scholar] [CrossRef]
  10. Bush, K.; Courvalin, P.; Dantas, G.; Davies, J.; Eisenstein, B.; Huovinen, P.; Jacoby, G.A.; Kishony, R.; Kreiswirth, B.N.; Kutter, E.; et al. Tackling antibiotic resistance. Nat. Rev. Microbiol. 2011, 9, 894–896. [Google Scholar] [CrossRef] [Green Version]
  11. Wellington, E.M.H.; Boxall, A.B.A.; Cross, P.; Feil, E.J.; Gaze, W.H.; Hawkey, P.M.; Johnson-Rollings, A.S.; Jones, D.L.; Lee, N.M.; Otten, W.; et al. The role of the natural environment in the emergence of antibiotic resistance in Gram-negative bacteria. Lancet Infect. Dis. 2013, 13, 155–165. [Google Scholar] [CrossRef]
  12. Ventola, C.L. The Antibiotic Resistance Crisis. Pharm. Ther. 2015, 40, 277–283. [Google Scholar]
  13. Spellberg, B.; Guidos, R.; Gilbert, D.; Bradley, J.; Boucher, H.W.; Scheld, W.M.; Bartlett, J.G.; Edwards, J., Jr. The Infectious Diseases Society of America. The Epidemic of Antibiotic-Resistant Infections: A Call to Action for the Medical Community from the Infectious Diseases Society of America. Clin. Infect. Dis. 2008, 46, 155–164. [Google Scholar] [CrossRef] [Green Version]
  14. Pruden, A. Balancing Water Sustainability and Public Health Goals in the Face of Growing Concerns about Antibiotic Resistance. Environ. Sci. Technol. 2014, 48, 5–14. [Google Scholar] [CrossRef]
  15. CDC’s Antibiotic Resistance Threats in the United States (2019 AR Threats Report). 2019. Available online: https://www.cdc.gov/drugresistance/biggest-threats.html (accessed on 14 December 2021).
  16. Wright, G.D. Antibiotic resistance in the environment: A link to the clinic? Curr. Opin. Microbiol. 2010, 13, 589–594. [Google Scholar] [CrossRef]
  17. Davison, J. Genetic Exchange between Bacteria in the Environment. Plasmid 1999, 42, 73–91. [Google Scholar] [CrossRef]
  18. Pepper, I.L.; Gentry, T.J. Microorganisms Found in the Environment. In Environmental Microbiology; Elsevier Inc.: Amsterdam, The Netherlands, 2015; pp. 9–36. [Google Scholar] [CrossRef]
  19. Pepper, I.L.; Gerba, C.P.; Gentry, T.J. Global Emerging Microbial Issues in the Anthropocene Era. In Environmental Microbiology; Elsevier Inc.: Amsterdam, The Netherlands, 2015; pp. 677–688. [Google Scholar] [CrossRef]
  20. Vaz-Moreira, I.; Nunes, O.C.; Manaia, C.M. Bacterial diversity and antibiotic resistance in water habitats: Searching the links with the human microbiome. FEMS Microbiol. Rev. 2014, 38, 761–778. [Google Scholar] [CrossRef]
  21. Alm, E.W.; Zimbler, D.; Callahan, E.; Plomaritis, E. Patterns and persistence of antibiotic resistance in faecal indicator bacteria from freshwater recreational beaches. J. Appl. Microbiol. 2014, 117, 273–285. [Google Scholar] [CrossRef]
  22. Blaak, H.; Lynch, G.; Italiaander, R.; Hamidjaja, R.A.; Schets, F.M.; de Roda Husman, A.M. Multidrug-Resistant and Extended Spectrum Beta-Lactamase-Producing Escherichia coli in Dutch Surface Water and Wastewater. PLoS ONE 2015, 10, e0127752. [Google Scholar] [CrossRef] [Green Version]
  23. Böckelmann, U.; Dörries, H.-H.; Ayuso-Gabella, M.N.; de Marçay, M.S.; Tandoi, V.; Levantesi, C.; Masciopinto, C.; Van Houtte, E.; Szewzyk, U.; Wintgens, T.; et al. Quantitative PCR Monitoring of Antibiotic Resistance Genes and Bacterial Pathogens in Three European Artificial Groundwater Recharge Systems. Appl. Environ. Microbiol. 2009, 75, 154–163. [Google Scholar] [CrossRef] [Green Version]
  24. Cooke, M.D. Antibiotic Resistance among Coliform and Fecal Coliform Bacteria Isolated from Sewage, Seawater, and Marine Shellfish. Antimicrob. Agents Chemother. 1976, 9, 879–884. [Google Scholar] [CrossRef] [Green Version]
  25. Di Cesare, A.; Vignaroli, C.; Luna, G.M.; Pasquaroli, S.; Biavasco, F. Antibiotic-Resistant Enterococci in Seawater and Sediments from a Coastal Fish Farm. Microb. Drug Resist. 2012, 18, 502–509. [Google Scholar] [CrossRef]
  26. Griffin, D.W.; Banks, K.; Gregg, K.; Shedler, S.; Walker, B.K. Antibiotic Resistance in Marine Microbial Communities Proximal to a Florida Sewage Outfall System. Antibiotics 2020, 9, 118. [Google Scholar] [CrossRef] [PubMed] [Green Version]
  27. Ibekwe, A.M.; Murinda, S.E.; Graves, A.K. Genetic Diversity and Antimicrobial Resistance of Escherichia coli from Human and Animal Sources Uncovers Multiple Resistances from Human Sources. PLoS ONE 2011, 6, e20819. [Google Scholar] [CrossRef] [PubMed] [Green Version]
  28. Knapp, C.; Dolfing, J.; Ehlert, P.A.I.; Graham, D.W. Evidence of Increasing Antibiotic Resistance Gene Abundances in Archived Soils since 1940. Environ. Sci. Technol. 2010, 44, 580–587. [Google Scholar] [CrossRef] [PubMed]
  29. Mukherjee, M.; Gentry, T.; Mjelde, H.; Brooks, J.P.; Harmel, D.; Gregory, L.; Wagner, K. Escherichia coli Antimicrobial Resistance Variability in Water Runoff and Soil from a Remnant Native Prairie, an Improved Pasture, and a Cultivated Agricultural Watershed. Water 2020, 12, 1251. [Google Scholar] [CrossRef]
  30. Mukherjee, M.; Laird, E.; Gentry, T.J.; Brooks, J.P.; Karthikeyan, R. Increased Antimicrobial and Multidrug Resistance Downstream of Wastewater Treatment Plants in an Urban Watershed. Front. Microbiol. 2021, 12, 657353. [Google Scholar] [CrossRef]
  31. Mukherjee, M.; Marie, L.; Liles, C.; Mustafa, N.; Bullerjahn, G.; Gentry, T.J.; Brooks, J.P. Elevated Incidences of Antimicrobial Resistance and Multidrug Resistance in the Maumee River (Ohio, USA), a Major Tributary of Lake Erie. Microorganisms 2021, 9, 911. [Google Scholar] [CrossRef]
  32. Zou, S.; Xu, W.; Zhang, R.; Tang, J.; Chen, Y.; Zhang, G. Occurrence and distribution of antibiotics in coastal water of the Bohai Bay, China: Impacts of river discharge and aquaculture activities. Environ. Pollut. 2011, 159, 2913–2920. [Google Scholar] [CrossRef]
  33. USCDC (United States Centers for Disease Control and Prevention). Antibiotic Resistance Threats in the United Stated. 2019. Available online: https://www.cdc.gov/drugresistance/pdf/ar-threats-2013-508.pdf (accessed on 11 November 2022).
  34. Weisman, G. Safe for Swimming? Water Quality at Our Beaches. Environment America Research and Policy Center. 2019. Available online: https://policycommons.net/artifacts/1767748/safe-for-swimming/2499394/ (accessed on 16 November 2022).
  35. DiRienzo, D. Mississippi has Some of the Dirtiest Beaches in the Nation Due to Fecal Bacteria. 2019. Available online: https://www.onlyinyourstate.com/mississippi/fecal-bacteria-beaches-ms/ (accessed on 15 November 2022).
  36. Mississippi Department of Environmental Quality (MDEQ). 11 Beach Water Contact Advisories in Effect. 2020. Available online: https://www.mdeq.ms.gov/11-beach-water-contact-advisories-in-effect/ (accessed on 16 November 2022).
  37. Quyyumi, F. Swim at Your Own Risk: State Issues Bacteria Warnings for 17 Coastal Beaches. Sunherald. 2021. Available online: http://www.sunherald.com/news/local/article251750823.html (accessed on 16 November 2022).
  38. Armstrong, B.N.; Cambazoglu, M.K.; Wiggert, J.D. Modeling the impact of the 2019 Bonnet Carré Spillway Opening and Local River Flooding on the Mississippi Sound. In OCEANS 2021: San Diego—Porto; IEEE: Piscataway, NJ, USA, 2021; pp. 1–7. [Google Scholar] [CrossRef]
  39. Parton, A. NOAA Launches Investigation into Dolphin Deaths. Supertalk Mississippi Media. 2019. Available online: https://www.supertalk.fm/noaa-launches-investigation-into-dolphin-deaths/ (accessed on 17 March 2022).
  40. Rozier, A. A Flood of Catastrophe: How a Warming Climate and the Bonnet Carre Spillway Threaten the Survival of Coast Fishermen. 2020. Available online: https://pulitzercenter.org/stories/flood-catastrophe-how-warming-climate-and-bonnet-carre-spillway-threaten-survival-coast (accessed on 16 November 2022).
  41. Gauntt, B. Mississippi Lt Gov: Corps Ignored Spillway Operating Manual. Clarion Ledger. 2021. Available online: https://www.clarionledger.com/story/news/2021/07/21/mississippi-lt-gov-army-corps-of-engineers-ignored-spillway-operating-manual/8039050002/ (accessed on 11 March 2022).
  42. Herbert, G. Mississippi Cities, Counties Sue Over Damages from Freshwater Dumping from La Spillway. Clarion Ledger. 2019. Available online: https://www.clarionledger.com/story/news/local/2019/12/27/bonnet-carre-spillway-mississippi-cities-counties-file-lawsuit/2755596001/ (accessed on 16 November 2022).
  43. Green, D. The 2019–2020 Bonnet Carre Spillway Opening. ArcGIS StoryMaps. 2020. Available online: https://storymaps.arcgis.com/stories/2558ee4ef8314cb9ab95cd31670783c4 (accessed on 9 February 2022).
  44. McCormack, F. State of Mississippi Sues over Bonnet Carrey. The Waterways Journal. 2020. Available online: https://www.waterwaysjournal.net/2020/01/03/state-of-mississippi-sues-over-bonnet-carre/ (accessed on 16 November 2022).
  45. Parra, S.M.; Sanial, V.; Boyette, A.D.; Cambazoglu, M.K.; Soto, I.M.; Greer, A.T.; Chiaverano, L.M.; Hoover, A.; Dinniman, M.S. Bonnet Carré Spillway freshwater transport and corresponding biochemical properties in the Mississippi Bight. Cont. Shelf Res. 2020, 199, 104114. [Google Scholar] [CrossRef]
  46. Lee, A. ‘Unlawful’ Operation of Bonnet Carré Prompts MS Secretary of State to Sue US Army Corps. Clarion Ledger. Available online: https://www.clarionledger.com/story/news/2019/12/31/bonnet-carre-spillway-lawsuit/2782429001/ (accessed on 9 February 2022).
  47. Schleifstein, M. Environmentalists Plan to Sue over Harm to Endangered Species from Bonnet Carre Spillway. 2020. Available online: https://www.nola.com/news/courts/article_27ca454e-4157-11ea-8e2c-97e7195fce75.html (accessed on 11 March 2022).
  48. Schleifstein, M. What the Bonnet Carre Spillway Opening Means for Lake Pontchartrain. Nola. com. 2019. Available online: https://www.nola.com/news/environment/article_42887d20-14ba-5900-ae2c-c3f4faefa265.html (accessed on 16 November 2022).
  49. USEPA (United Stated Environmental Protection Agency). Method 1600: Enterococci in Water by Membrane Filtration Using Membrane-Enterococcus Indoxyl-β-D-Glucoside Agar (mEI). 2002. Available online: chrome-extension://efaidnbmnnnibpcajpcglclefindmkaj/https://www.epa.gov/sites/default/files/2015-08/documents/method_1600_2009.pdf (accessed on 16 November 2022).
  50. USEPA (United Stated Environmental Protection Agency). Method 1603: Escherichia coli (E. coli) in Water by Membrane Filtration Using Modified Membrane-Thermotolerant Escherichia coli Agar (Modified mTEC). 2002. Available online: https://www.epa.gov/sites/default/files/2015-08/documents/method_1603_2009.pdf (accessed on 20 June 2023).
  51. Bauer, A.W.; Kirby, W.M.; Sherris, J.C.; Turck, M. Antibiotic susceptibility testing by a standardized single disk method. Am. J. Clin. Pathol. 1966, 45, 493–496. [Google Scholar] [CrossRef]
  52. Agudelo Higuita, N.I.; Huycke, M.M. Enterococcal Disease, Epidemiology, and Implications for Treatment. In Enterococci: From Commensals to Leading Causes of Drug Resistant Infection; Massachusetts Eye and Ear Infirmary: Boston, MA, USA, 2014; pp. 1–35. [Google Scholar]
  53. Byappanahalli, M.; Nevers, M.; Korajkic, A.; Staley, Z.R.; Harwood, V.J. Enterococci in the Environment. Microbiol. Mol. Biol. Rev. 2012, 76, 685–706. [Google Scholar] [CrossRef] [Green Version]
  54. De Oliveira, D.M.P.; Forde, B.M.; Kidd, T.J.; Harris, P.N.A.; Schembri, M.A.; Beatson, S.A.; Paterson, D.L.; Walker, M.J. Antimicrobial Resistance in ESKAPE Pathogens. Clin. Microbiol. Rev. 2020, 33, e00181-19. [Google Scholar] [CrossRef]
  55. Jang, J.; Hur, H.-G.; Sadowsky, M.; Byappanahalli, M.; Yan, T.; Ishii, S. Environmental Escherichia coli: Ecology and public health implications-a review. J. Appl. Microbiol. 2017, 123, 570–581. [Google Scholar] [CrossRef] [Green Version]
  56. Vila, J.; Sáez-López, E.; Johnson, J.R.; Römling, U.; Dobrindt, U.; Cantón, R.; Giske, C.G.; Naas, T.; Carattoli, A.; Martínez-Medina, M. Escherichia coli: An old friend with new tidings. FEMS Microbiol. Rev. 2016, 40, 437–463. [Google Scholar] [CrossRef] [Green Version]
  57. Hancock, L.E.; Murray, B.E.; Sillanpää, J. Enterococcal Cell Wall Components and Structures. In Enterococci: From Commensals to Leading Causes of Drug Resistant Infection; Massachusetts Eye and Ear Infirmary: Boston, MA, USA, 2014; pp. 1–35. [Google Scholar]
  58. Whitman, R.L.; Harwood, V.J.; Edge, T.A.; Nevers, M.B.; Byappanahalli, M.N.; Vijayavel, K.; Brandão, J.; Sadowsky, M.J.; Alm, E.W.; Crowe, A.; et al. Microbes in beach sands: Integrating environment, ecology and public health. Rev. Environ. Sci. Bio. Technol. 2014, 13, 329–368. [Google Scholar] [CrossRef] [Green Version]
  59. Flood, C.; Ufnar, J.; Wang, S.; Johnson, J.; Carr, M.; Ellender, R. Lack of correlation between enterococcal counts and the presence of human specific fecal markers in Mississippi creek and coastal waters. Water Res. 2011, 45, 872–878. [Google Scholar] [CrossRef]
  60. Pachepsky, Y.A.; Shelton, D.R. Escherichia coli and Fecal Coliforms in Freshwater and Estuarine Sediments. Crit. Rev. Environ. Sci. Technol. 2011, 41, 1067–1110. [Google Scholar] [CrossRef]
  61. Singh, R.; Singh, A.P.; Kumar, S.; Giri, B.S.; Kim, K.-H. Antibiotic resistance in major rivers in the world: A systematic review on occurrence, emergence, and management strategies. J. Clean. Prod. 2019, 234, 1484–1505. [Google Scholar] [CrossRef]
  62. Sabater, J.K. Antibiotic-resistant Escherichia coli and Enterococcus spp. in Sand and Water at Tampa Bay Beaches. Ph.D. Thesis, University of South Florida, Tampa, FL, USA, 2022. Available online: https://digitalcommons.usf.edu/etd/9452/ (accessed on 20 June 2023).
  63. McGowan, E. Comment on “Antibiotic Resistance Genes as Emerging Contaminants: Studies in Northern Colorado”. Environ. Sci. Technol. 2007, 41, 2651–2652. [Google Scholar] [CrossRef]
  64. Overbey, K.N.; Hatcher, S.M.; Stewart, J.R. Water quality and antibiotic resistance at beaches of the Galápagos Islands. Front. Environ. Sci. 2015, 3, 64. [Google Scholar] [CrossRef] [Green Version]
  65. Zhang, Q.; Gallard, J.; Wu, B.; Harwood, V.J.; Sadowsky, M.J.; Hamilton, K.A.; Ahmed, W. Synergy between quantitative microbial source tracking (qMST) and quantitative microbial risk assessment (QMRA): A review and prospectus. Environ. Int. 2019, 130, 104703. [Google Scholar] [CrossRef]
  66. Nappier, S.P.; Liguori, K.; Ichida, A.M.; Stewart, J.R.; Jones, K.R. Antibiotic Resistance in Recreational Waters: State of the Science. Int. J. Environ. Res. Public Health 2020, 17, 8034. [Google Scholar] [CrossRef] [PubMed]
  67. Rizzo, L.; Manaia, C.; Merlin, C.; Schwartz, T.; Dagot, C.; Ploy, M.C.; Michael, I.; Fatta-Kassinos, D. Urban wastewater treatment plants as hotspots for antibiotic resistant bacteria and genes spread into the environment: A review. Sci. Total Environ. 2013, 447, 345–360. [Google Scholar] [CrossRef] [PubMed] [Green Version]
  68. Dinos, G.P. The macrolide antibiotic renaissance. Br. J. Pharmacol. 2017, 174, 2967–2983. [Google Scholar] [CrossRef] [Green Version]
  69. Davis, R.; Markham, A.; Balfour, J.A. Ciprofloxacin, an updated review of its pharmacology, therapeutic efficacy, and tolerability. Drugs 1996, 51, 1019–1074. [Google Scholar] [CrossRef] [PubMed]
  70. Peechakara, B.V.; Basit, H.; Gupta, M. Ampicillin. In StatPearls; StatPearls Publishing: Tampa, FL, USA, 2022. Available online: https://pubmed.ncbi.nlm.nih.gov/30137853/ (accessed on 20 June 2023).
  71. Sayah, R.S.; Kaneene, J.B.; Johnson, Y.; Miller, R.S. Patterns of antimicrobial resistance observed in Escherichia coli isolates obtained from domestic- and wild-animal fecal samples, human septage, and surface water. Appl. Environ. Microbiol. 2005, 71, 1394–1404. [Google Scholar] [CrossRef] [PubMed] [Green Version]
  72. Nicolau, D.P.; Carmeli, Y.; Crank, C.W.; Goff, D.A.; Graber, C.J.; Lima, A.L.L.; Goldstein, E.J. Carbapenem stewardship: Does ertapenem affect Pseudomonas susceptibility to other carbapenems? A review of the evidence. Int. J. Antimicrob. Agents 2012, 39, 11–15. [Google Scholar] [CrossRef]
  73. van Loon, K.; Voor in ‘t holt, A.F.; Vos, M.C. A systematic review and meta-analyses of the clinical epidemiology of carbapenem-resistant enterobacteriaceae. Antimicrob Agents Chemother 2018, 62, 1. [Google Scholar] [CrossRef] [Green Version]
  74. Cohen, R.; Paikin, S.; Rokney, A.; Rubin-Blum, M.; Astrahan, P. Multidrug-resistant enterobacteriaceae in coastal water: An emerging threat. Antimicrob. Resist. Infect. Control. 2020, 9, 1–9. [Google Scholar] [CrossRef]
  75. Khan, F.A.; Hellmark, B.; Ehricht, R.; Söderquist, B.; Jass, J. Related carbapenemase-producing Klebsiella isolates detected in both a hospital and associated aquatic environment in Sweden. Eur. J. Clin. Microbiol. Infect. Dis. 2018, 37, 2241–2251. [Google Scholar] [CrossRef] [Green Version]
  76. Kieffer, N.; Poirel, L.; Bessa, L.J.; Barbosa-Vasconcelos, A.; da Costa, P.M.; Nordmann, P. VIM-1, VIM-34, and IMP-8 Carbapenemase-Producing Escherichia coli Strains Recovered from a Portuguese River. Antimicrob. Agents Chemother. 2016, 60, 2585–2586. [Google Scholar] [CrossRef] [Green Version]
  77. Kittinger, C.; Lipp, M.; Folli, B.; Kirschner, A.; Baumert, R.; Galler, H.; Grisold, A.J.; Luxner, J.; Weissenbacher, M.; Farnleitner, A.H.; et al. Enterobacteriaceae Isolated from the River Danube: Antibiotic Resistances, with a Focus on the Presence of ESBL and Carbapenemases. PLoS ONE 2016, 11, e0165820. [Google Scholar] [CrossRef] [Green Version]
  78. Montezzi, L.F.; Campana, E.H.; Corrêa, L.L.; Justo, L.H.; Paschoal, R.P.; da Silva, I.L.V.D.; Souza, M.D.C.M.; Drolshagen, M.; Picão, R.C. Occurrence of carbapenemase-producing bacteria in coastal recreational waters. Int. J. Antimicrob. Agents 2015, 45, 174–177. [Google Scholar] [CrossRef]
  79. Paschoal, R.P.; Campana, E.H.; Corrêa, L.L.; Montezzi, L.F.; Barrueto, L.R.L.; da Silva, I.R.; Bonelli, R.R.; Castro, L.D.S.; Picão, R.C. Concentration and Variety of Carbapenemase Producers in Recreational Coastal Waters Showing Distinct Levels of Pollution. Antimicrob. Agents Chemother. 2017, 61, e01963-17. [Google Scholar] [CrossRef] [Green Version]
  80. Magiorakos, A.-P.; Srinivasan, A.; Carey, R.B.; Carmeli, Y.; Falagas, M.E.; Giske, C.G.; Harbarth, S.; Hindler, J.F.; Kahlmeter, G.; Olsson-Liljequist, B.; et al. Multidrug-resistant, extensively drug-resistant and pandrug-resistant bacteria: An international expert proposal for interim standard definitions for acquired resistance. Clin. Microbiol. Infect. 2012, 18, 268–281. [Google Scholar] [CrossRef] [Green Version]
  81. Guo, Y.; Liu, M.; Liu, L.; Liu, X.; Chen, H.; Yang, J. The antibiotic resistome of free-living and particle-attached bacteria under a reservoir cyanobacterial bloom. Environ. Int. 2018, 117, 107–115. [Google Scholar] [CrossRef]
  82. Brooks, J.; Adeli, A.; McLaughlin, M.R.; Miles, D.M. The effect of poultry manure application rate and AlCl3 treatment on bacterial fecal indicators in runoff. J. Water Heal. 2012, 10, 619–628. [Google Scholar] [CrossRef] [Green Version]
Figure 1. Map of the Mississippi Gulf Coast identifying the locations of the ten sampling sites.
Water 15 02339 g001
Figure 2. Box plot of percentage of antimicrobial resistance (AMR) (A). E. coli isolates and (B). Enterococcus isolates responses to eight antibiotics across all sampling events and sampling sites. The black line within each box indicates the median value and the dotted red line indicates the mean value. The whiskers above and below the box indicate the maximum and minimum values.
Water 15 02339 g002
Figure 3. Box plot of percentage of multidrug resistance (MDR) within (A). E. coli isolates and (B). Enterococcus isolates within the four sites across all sampling events.
Water 15 02339 g003
Figure 4. Correlations observed between tested physical parameters (I. temperature, II. pH, and III. salinity) and microbial FIB contamination measurements within sampled sites. (A). E. coli and (B). Enterococcus.
Water 15 02339 g004
Table 1. AE. coli counts per sampling month in 10 sites (cfu 100 mL−1 water). B—Enterococcus counts per sampling month in 10 sites (cfu 100 mL−1 water). * indicates statistically significant differences between sampling site means (p < 0.05); ** indicates statistically significant differences between locations (mean sample sites).
A
Sample SiteSep-20Oct-20Nov-20Dec-20Jan-21Mar-21Apr-21May-21Jun-21Jul-21Mean
1-Pass Christian **91080010204401622660430120400481.8 *
2-Pass Christian10603000940406110490470310250667.6 *
3-Long Beach53011072070248156320750692339.8
4-Long Beach27501309201061030322705605100990.8 *
5-Gulfport6026887200212036011102240472.6
6-Gulfport450180340114014876029021702240669.2 *
7-Gulfport9010982700102036023030111.8
8-Biloxi80120104270022220510190300181.6
9-Biloxi100580780100211060015601101730567.2 *
10-Biloxi6009001050148410290168040380510.2
B
Sample SiteSep-20Oct-20Nov-20Dec-20Jan-21Mar-21Apr-21May-21Jun-21Jul-21Mean
1-Pass Christian1002120102806003002016134
2-Pass Christian100400100100210450321095.2
3-Long Beach1000842828100182429.2
4-Long Beach220600201281086120144071.6
5-Gulfport02011001022801103254.6
6-Gulfport105400000203305254014636.6
7-Gulfport0004080466289.2
8-Biloxi010220284011410421
9-Biloxi6100220204584508030674.6
10-Biloxi10104100125022010633.2
Disclaimer/Publisher’s Note: The statements, opinions and data contained in all publications are solely those of the individual author(s) and contributor(s) and not of MDPI and/or the editor(s). MDPI and/or the editor(s) disclaim responsibility for any injury to people or property resulting from any ideas, methods, instructions or products referred to in the content.

