Article

In Situ IoT Development and Application for Continuous Water Monitoring in a Lentic Ecosystem in South Brazil

by
Emilio Soitsi Junior Zukeram
1,
Lucas Lima Provensi
1,
Milena Veríssimo de Oliveira
1,
Linnyer Beatrys Ruiz
2,
Oswaldo Curty da Motta Lima
1 and
Cid Marcos Gonçalves Andrade
1,*
1
Department of Chemical Engineering, State University of Maringá, Maringá 87020-900, Brazil
2
Department of IT, State University of Maringá, Maringá 87020-900, Brazil
*
Author to whom correspondence should be addressed.
Water 2023, 15(13), 2310; https://doi.org/10.3390/w15132310
Submission received: 14 May 2023 / Revised: 2 June 2023 / Accepted: 5 June 2023 / Published: 21 June 2023
(This article belongs to the Special Issue Field Methods for Water Quality Surveying)

Abstract

:
The monitoring of water resources through conventional methods, related to a manual process when performing the sample collection, followed by laboratory analysis, presents some difficulties concerning the logistics of the process, such as access to the interior of a lake, in addition to often being based on a small number of samples. The concept of the internet of things (IoT) is used here to collect data through five parametric probes contained in the floating station located inside a lake and inform them in real time continuously. The main objective of this research is to demonstrate the applicability of the IoT concept in the continuous monitoring of water in a lentic environment. Therefore, it is necessary to develop a tool for this. Upon reaching this objective, the advantages observed in this research confirmed that the IoT paradigm is an essential resource, justifying a natural tendency to establish itself when there is a need to collect data efficiently and continuously. Furthermore, the experimental result proves the IoT concept’s efficiency, agility, and reliability to environmental issues, especially regarding the most significant natural and indispensable resource for the planet, water.

1. Introduction

The internet of things (IoT) [1,2,3,4,5,6,7] is a concept that is being established both at a scientific and social level. IoT has the potential to transform a wide range of industries, including agriculture, healthcare, and transportation. It is said that it will transform different fields. It encompasses an ecosystem of services hosted in the cloud interacting with smart objects through the execution of computer programs connected through communication networks. The availability of a wide variety of resources in the cloud (cloud services) offers many possibilities for the implementation of chemical analysis monitoring systems, notably increasing their versatility and performance without dramatically increasing the cost or complexity of the resulting system [1,2]. With this constant technological evolution, multiple ecosystems have emerged for integrating hardware devices, embedded software, communication networks, and cloud processing, usually referred to as IoT platforms. These modular IoT platforms can incorporate new modules as new technologies appear. On the other hand, IoT encounters challenges from the point of view of interoperability and heterogeneity, with several compatibility challenges. In addition, different raw data types and formats make establishing a standardized communication interface complex [8].
The IoT has become a concept that can be applied in several sectors positively and efficiently and can contribute to monitoring natural resources and environmental impacts, accelerating decisions through early warnings. As IoT technology becomes more prominent, highly scalable robust systems and platforms are being developed to accommodate the constant increase in IoT devices. One of the sectors in which this growth is expected is environmental monitoring [1,2,9] because IoT brings credibility and trust since it uses reliable sensors and is therefore becoming a new trend in monitoring aquatic environments [1,2,3,4,5,6,7,8,9,10,11,12,13,14,15,16,17,18,19,20,21]. Therefore, integrating the internet of things paradigm in electronic sensors for continuous water-quality monitoring is increasingly reliable and necessary [5].
To solve pain points, improve farming efficiency and modernize fisheries, new digital technologies, such as the internet of things, big data, cloud computing, artificial intelligence, and blockchain, are increasingly widely applied in aquaculture [6].
Sustainable cities aim to have a lower environmental impact by reducing carbon as much as possible. The smart city paradigm based on the internet of things (IoT) is the natural approach to achieving this goal [7].
Artificial intelligence techniques, IoT, and machine-learning models have explained their ability to optimize, model, and automate vital water and wastewater treatment applications, and monitor and supervise natural systems and water-based agriculture, such as hydroponics and aquaponics [10,11,12].
An IoT-based intelligent water monitoring system is of exceptional significance in controlling the threats related to aquaponics farming. Thus, it helps to nourish a remarkable boost to enhance harvest and productivity [13].
The confluence of AI and IoT has sparked recent interest in artificial intelligence of things (AIoT), whereby an IoT system provides data flow to AI methods for data integration and implementation and the performance of automatic image analysis and data prediction. The adoption of AIoT technology seriously transforms the traditional agriculture strategy by managing numerous challenges, including pest management and post-harvest management issues [4,14,15].
Water-quality monitoring is one of the reasons for the evolution of robots allied to IoT for aquaculture farms to relieve agricultural operators of one of the more laborious and time-consuming agricultural operations. To this end, it employs a swarm of unmanned aerial vehicles (UAVs) or drones integrated with underwater systems. Measurement devises to collect in situ water quality data from aquaculture ponds [5].
The internet of underwater things (IoUT) is a subset of the IoT in which underwater sensors continuously collect data about ocean ecosystems. Predictive analytics can present valuable insights to the stakeholders associated with environmentalists, marine explorers, and oceanographers for decision-making and intelligence about the ocean collected from marine data [6,16,17].
The sustainable IoT design of smart cities can be believed in urban management and spatial planning, encouraging people, the environment, the economy, society, space, culture, resources, and platforms to develop an intelligent ecological system and improve the sustainability of smart cities [18,19].
IoT water-quality monitoring is a substantial part of the transition towards intelligent and innovative agriculture. It provides an easy transition to automated monitoring of crucial components of daily human needs as new technologies are continually developed and assumed in agricultural and human daily life [20].
Over the past decade, water resources have encountered challenges, including pollution, drought, etc. Thus, monitoring this vital resource has become essential. The internet of things (IoT) has considerably evolved recently; it has been adopted in various fields to improve human life [21].
Countless problems have been caused by the excessive emission of polluting gases, such as carbon dioxide (CO2), into the atmosphere. Therefore, more effective monitoring of CO2 is essential, especially in central or industrial regions [22,23].
The new concept of IoT emerged from the studies of the British Kevin Ashton in 1999 [24] and has developed so that its application in the future is essential. Therefore, water is the most necessary natural resource for human beings and the planet, and there is thus demand for innovative means of monitoring and mitigating its pollution [25].
To make agile measurements in the monitoring of water quality continuously, it is more efficient to use technological resources compared to manual tasks and procedures performed using conventional methods, justified by the speed of computational processing combined with electronic devices such as probes for reading water parameters and the application of the IoT concept [1,19,20,26,27]. Furthermore, this need is justified by the gain in time, reduced operating costs, and avoiding efforts for such a procedure.
In conventional methods of monitoring water quality, the researcher or the public agency responsible will visit the specific area to monitor and control the water quality manually. Then, they take the water sample to the laboratory to learn the values of the water quality parameters and then employ appropriate control measures. However, this whole process is costly, time-consuming, and less efficient due to the many processes involved in identifying the pollutants, the level of pollution, and the source of the pollutants, in addition to relying on the road transport of vessels to access the site inside the lake, the transport of samples to the laboratory and the possibility of contamination of samples throughout this store. Current trends in water-quality monitoring systems are focused on continuous detection, multiple sensors, automated control, wireless data acquisition mechanisms, cloud data access, and storage. In addition, artificial intelligence technologies such as machine learning, deep learning, and fuzzy logic, integrated with IoT, are emerging technologies recognized as efficient ways to monitor water quality [1,19,20,26,27,28].
Regarding contributions in the literature, we found most of them involved prototypes that, despite not being directly focused on chemical species analysis, have tried to evaluate some physicochemical parameters (pH, turbidity, DO, TDS, temperature, flow rate, EC, ORP…) in natural environments, such as rivers and lakes [1]. In this way, interest in using this type of IoT system to provide greater functionality and allow for better monitoring of these variables to obtain more substantiated conclusions is rising.
In this research, we consider the need to apply the IoT concept in a 24/7 continuous multiparameter water monitoring system over a few months, developing a tool with non-specific materials that can contribute to other researchers’ and scientists’ work. Furthermore, to prove its efficiency, it demonstrates details of the structural project and its architecture, describes the algorithm’s functioning, and brings the main challenges when anchoring this project in the middle of an urban lake subject to the weather and contact with wild animals.
First, we give an overview of the development and technology of application for continuous water monitoring, starting with a straightforward approach to the importance of the IoT concept. The rest of the paper is organized as follows: Section 2 explains the need to design a floating platform, the base of the station anchored in the lake’s center, and this article’s study object. Next, we demonstrate the architecture of the electronics, the system algorithm, and its electronic devices connected to the probes: dissolved oxygen, pH, electrical conductivity, TDS, ORP, and water temperature. Section 3 describes the results and discussion, the experiments, difficulties, and details of changes. Finally, the article concludes in Section 4.

2. Materials and Methods

2.1. Study Area

The experiment was carried out in Inga Park, located within the urban perimeter of the city of Maringa, in the southern region of Brazil, geographically located in the northeast of the state of Parana, with geographic coordinates 23°25′28″ south latitude and 51°55′59″ west longitude and altitude of 557 m (Figure 1). The park has been recognized as an environmental protection area since 1991. It comprises an area of 473,300 m2 and a central lake of enormous importance to the local ecosystem. However, little remains of the forests due to the significant agricultural frontier that has been established in the region in the last six decades. Less than 0.5% of the native species remain [29], justifying the importance of their preservation. The site is intended for tourism and leisure, covered with native forest, and represents one of the last regional remnants of seasonal semideciduous forest, although it has been dramatically altered by human action, with a defined dry season, between May and July [29].

2.2. Floating Platform and Components

This research required designing a stable floating platform in the water to safely and reliably support an airtight box on its top, containing the project hardware inside. Therefore, in this article, the name of this hardware structure will be called “kernel module”.
In order to design the platform, we used a floating dock block (Figure 2a), with dimensions of 50 cm wide, 50 cm long, and 40 cm high, and it is made of high-density polyethylene material with characteristics such as hardness, thermal, mechanical and chemical resistance, light and non-toxic. On the side, we fixed a structure to protect the sensor cables from the exit of the protection box located on the top of the floating station that led to the water level. For this, we use conduits fixed to the floating dock with plastic glue and rigging, helping to keep it fixed, using two fixing means. This procedure was carried out to protect the probe cables from the weather and the action of wild animals at the study site.
Part of the project was used to build an underwater structure that would protect the probes located in the water (Figure 2b), preventing them from being released into the water, exposed to physical contact between them, and suffering the interaction with local aquatic animals such as turtles, fish, giant otters, and diving birds, among others. To build the structure, we used 30 cm of PVC pipe, an inert, non-toxic, and recyclable thermoplastic material, with several holes at the bottom and bottom of the pipe with approximately 1.2 cm in diameter for the entry and passage of water inside the pipe (Figure 2b). There was a need to develop an internal structure whose function was to avoid the collision between the probes inside the protection structure. For that, we used a compound based on tackifying resin and ethylene vinyl acetate (EVA) resin, a thermoplastic adhesive which is a rubbery, flexible polymer with adhesive properties and waterproof components, thus filling the entire interior of the underwater structure, positioning each probe in a specific location, leaving the probes stable and avoiding physical contact and between them (Figure 2c). Figure 1d shows the fitting of this structure containing the fixed probes inside the underwater protection pipe.
With the aim of allocating the kernel module in a safe place and protected from the weather observed in this experiment during the period from 13–14 h, such as high temperatures, torrential rains, and possible cyclones, as well as interactions with wild animals existing in the place, we used an airtight box (Figure 2a) made of ABS (acrylonitrile butadiene styrene), which is a critical engineering copolymer widely used in the industry due to its superior mechanical properties, chemical resistance, ease of processing, and recyclability [30].
The floating station’s implantation and anchoring for continuous water monitoring were carried out in the central part of the lake, located inside the Parque do Ingá, a place difficult to access and requiring water transport. For this, we used a small boat whose function was to transport the project, which was introduced into the water next to the boat and was slowly towed to the anchorage site (Figure 2a). For each anchoring point of the floating station, this experiment used a granite stone of approximately 7 kg and with approximate dimensions of 25 cm in length, 20 cm in width, and 20 cm in height, wrapped with wire, and tied to a nautical rope at one of its ends and the station in the other.

2.3. The Kernel Module and Its Assignments

This research was conducted to combine the IoT concept with electronic sensors specialized in performing parametric readings of water efficiently, quickly, and necessary to optimize the time and cost of these processes [1,2,4,5,6,7,8,9,10,11,12,13,14,15,16,27,31,32,33]. We used probes manufactured by Atlas Scientific (New York, NY, USA). Atlas Scientific is an American company that has years of experience manufacturing high-performance water-quality sensors which are widely used in scientific projects [34], and for reading the temperature and humidity inside the case, we chose the DTH22 sensor since it is commercially accessible.
The kernel module design was based on integrating an Arduino Uno electronic prototyping platform and a C/C++ based language, containing several different I/O pins, with the primary function of connecting to all system peripherals [35]. The rationale for using the Arduino Uno was because it is a microcontroller that is well-established and has been tested with positive results [1,2,4,31,32,35,36,37,38].
Arduino’s function is to command Atlas Scientific’s EZO circuits, each circuit responsible for individually controlling a specific parametric probe. Currently, Atlas Scientific manufacturer falls under the European Union Directive 2015/863/EU (RoHS Directive 3) (Atlas Scientific website). This work used the dissolved oxygen probes, pH, electrical conductivity, redox potential, total dissolved solids, and water temperature. Another Arduino function is to communicate with the DHT22 sensor, reading values for temperature and air humidity, in addition to commanding the SIM800A shield, which aims to connect to the network and access the database.
The communication scheme with the internet network is through the SIM800A GSM module. This device controls the mechanism using the GSM system (Global System for Mobile Communication). It is important to note that the component can access the internet through a SIM card chip [31,32,36,37,38].

2.4. System Algorithm

The algorithm for reading the parameters of the probes basically performs 10 sequential readings at the interval of one reading per second, triggering the operation of one sensor at a time. A function to sort the readings ignoring the 3 most minor and the 3 largest is executed after executing all 10 readings, then an arithmetic average is made between the 4 medians, informing the system of the result of this function, which will later be posited in the database. As soon as the sensor collects the 10 data required by the system, it is immediately put to sleep, waking the next sensor to start its readings. Only one sensor is run at a time, starting with the water-temperature sensor. The collected value will calibrate the dissolved oxygen and electrical conductivity sensors before starting their respective readings, making a required compensation. As soon as the results of the 6 desired parameters of the lake water are obtained, the algorithm takes a reading on the DHT22 sensor installed inside the hermetic box, informing the temperature and humidity, in order to inform of, through the system application explained in the next section, whether electronic equipment is working under ideal conditions.
After verifying the readings of the probes and internal sensor of the box, the central algorithm generates the command using the HTTP protocol destined to the hosting site of the MySQL v5.2 relational database and website files programmed in php7. For this, the Arduino activates the SIM800A shield to send the information to the internet network. Finally, a message is returned and passed on to the central algorithm, containing configuration information. Among these are restarting the system and reprogramming the frequency between probe readings, increasing or decreasing the daily frequency of readings depending on the researcher’s needs. Figure 3 shows the flowchart of the system algorithm.
At the beginning of the experiment, we defined the period to collect data as approximately 23 min between one reading and another, with the average execution time of the algorithm being approximately 3 min, which can be extended when there are communication failures between the GSM module and the 4G network or with the hosting database site. After running the algorithm without interruption, the floating station is put into a sleep state to save the battery charge of the power supply module between one reading and another.

2.5. Power Module

This project is implemented in situ, in an aquatic environment, on a floating platform, developed with non-specific materials, and in a didactic way. The presence of a photovoltaic panel was discarded due to the concern with the possibility of leaving the platform not stable when there are storms, rain-storms, and even the possibility of cyclones, even if they are not common in this region of Brazil. If any of these situations happened, as the wind gusts and shear force were applied to the area of the photovoltaic panel, it would be possible that tipping over could occur, and the entire electronic structure contained in the upper part of the floating dock would submerge, causing irreparable damage and possibly complete loss of the kernel module. Therefore, it was decided to feed the module with lithium batteries contained internally in the hermetic box with a total capacity from the module to 38 A/h, providing a voltage of 12 V for the microcontroller [31], 12 V for the module GSM and 5 V for Atlas probes EZO circuits. Figure 4a shows the battery pack installed inside the kernel module, and Figure 4b shows the box without the power module and the GSM module attached to the side of the box.

2.6. Database and Application

Within the initial expectations of the planning of this project, there was the development of an Android application to access the information contained in the system’s database. One of the reasons for creating the application was not to depend on others developed by third parties but to shape its features as challenges and ideas emerged so that the front end of interaction with the system’s user had its own identity. We used the Android Studio development platform and the JAVA programming language for this. The database chosen was MySQL v5.2, a database widely used in IoT applications [39,40], and the PHP7 programming language was chosen to access the data and inform the application.
Among the functions of the application are: taking readings from the probes, generating individual graphs for each parameter, viewing alerts of readings outside the acceptable range for each parameter, and generating PDF files containing information from all the collections of the station parameters and options to change the time relative to the period between the readings of the floating station and Arduino restarts.
One of the priorities for attributing the system’s business rules was to reduce processing in the Arduino, passing some competencies to the database layer. A trigger is programmed to execute a procedure every time a record is inserted in the table of the database destined to receive the readings of the probes, with the function of analyzing whether it is necessary to generate another record, this time in the alerts table containing information about readings outside the desired range for each parameter. Therefore, the business rules for this project now have an intermediate processing layer, reducing processing tasks on the Arduino and the time between readings and writing to the database. In this way, when using an application to access the data collected in real-time at the station, we have a gain in the monitoring dynamics [31,35]. Figure 5 describes the full system diagram.

3. Results and Discussion

The improvements, according to the experience, and the end of the experiment between 17 June 2020, and 4 October 2020.

3.1. Difficulties, Experiences Gained and Optimizations during Research

An interesting factor was the adaptation of wild animals days after the implementation of the project. For example, some birds of the cormorant species (Phalacrocorax brasilianus) used the platform daily as a fishing and resting place; the combined the physical contact and weight of the birds when they remained on top of the hermetic box left the mechanism vulnerable to imbalance; however, no damage to the structure or interference with the readings were observed (Figure 6a).
The platform initially consisted of three floating dock blocks for the final project. The blocks fit together in an “L” shaped arrangement, with a central dock block and two laterally connected dock blocks (Figure 6b). After some initial tests, through the readings of the DHT22 sensor, it was observed that on certain occasions, such as on very sunny and calm days, the continuous incidence of sunlight caused the internal temperature of the hermetic box to reach temperatures above 40 °C at the hottest time of the day. Therefore, we used white thermal paint, which was applied outside the surface of the hermetic box and part of the platform (Figure 6b). The purpose was to reduce the temperature inside the box, observing a drop in internal temperature of approximately 20%, reaching a maximum value of 32 °C.
The immersion depth of the reading of the parametric probes was approximately 37–40 cm below the water level, observed in Figure 6c on the immersion structure of the probes.
The area of this study has a defined dry season, which occurs between May and July [29], and the project implementation period occurred during winter, a period between 21 June and 22 September in Brazil, defined for this study area during this period as the dry season [41]; however, a particularity drew attention in this experiment: a long period of drought caused the water level of the park’s lake to drop considerably. From Figure 6d, it is possible to observe the mark on the back wall with the previous water level before the severe drought period inside the masonry structure located inside the lake. Therefore, between the period of readings of the water parameters, there were few rainy days and primarily days with little humidity in the air and high solar incidence. Therefore, for the Camargo Climate Classification System (CMCCS), the climate zoning in the experiment region belongs to the subtropical class with dry winter (ST-SEi) [41].
During the research period, an extratropical bomb cyclone passed through the city of Maringá where the project was implemented, recorded by the meteorological station, with strong gusts of wind uncommon for the region. However, experimentally, it was a challenge successfully overcome, proving the stability of the floating platform and its efficiency in housing electronic equipment for this type of weather. Figure 6e shows the moment the bomb cyclone hit the city.
Another challenge, related to wild animal interaction, was the presence of waste on top of the platform. However, there was no interference in the operation of the shielded antenna SIM800A since it was protected by a conduit fixed horizontally and the waste leaked onto its sides (Figure 6f), avoiding contact with waste and possible malfunction of the GSM SIM800A module due to damage to the external antenna.
In the first days of testing after the project’s implementation, it was noticed that on very windy days, the platform that contained only one anchor point moved a lot, causing interference in the readings of the galvanic dissolved oxygen probe. Under these conditions, the readings started to have increase considerably, different from the calm moments, as the sudden movement caused by the displacement of the floating station caused distortions in the partial pressure of oxygen in the membrane of the probe [42]. Soon after this experience, we used three anchor points to reduce its displacement on the water surface on turbulent windy days.
Experimentally, it was found that using the battery module with a capacity of 38 A/h, whose function was to energize the entire kernel system, before the battery reached the voltage level needed to recharge, the project had the autonomy to perform approximately 50 thousand readings, there being five probes and internal sensor DHT22. However, as already explained in Section 2.4 of this article, for every 10 reads/probes, the algorithm returns only one value. Therefore, the project could execute approximately 1000 writes in the database containing a value for each parameter.
During the experiment, it was observed that the performance of parametric readings every 20 min could have a greater frequency since the variation is not so significant between one reading and another. In addition, there would be an increase in the supply capacity of the system’s power supply module in days and even months, consequently increasing the station’s autonomy time considerably before recharging/changing the batteries.

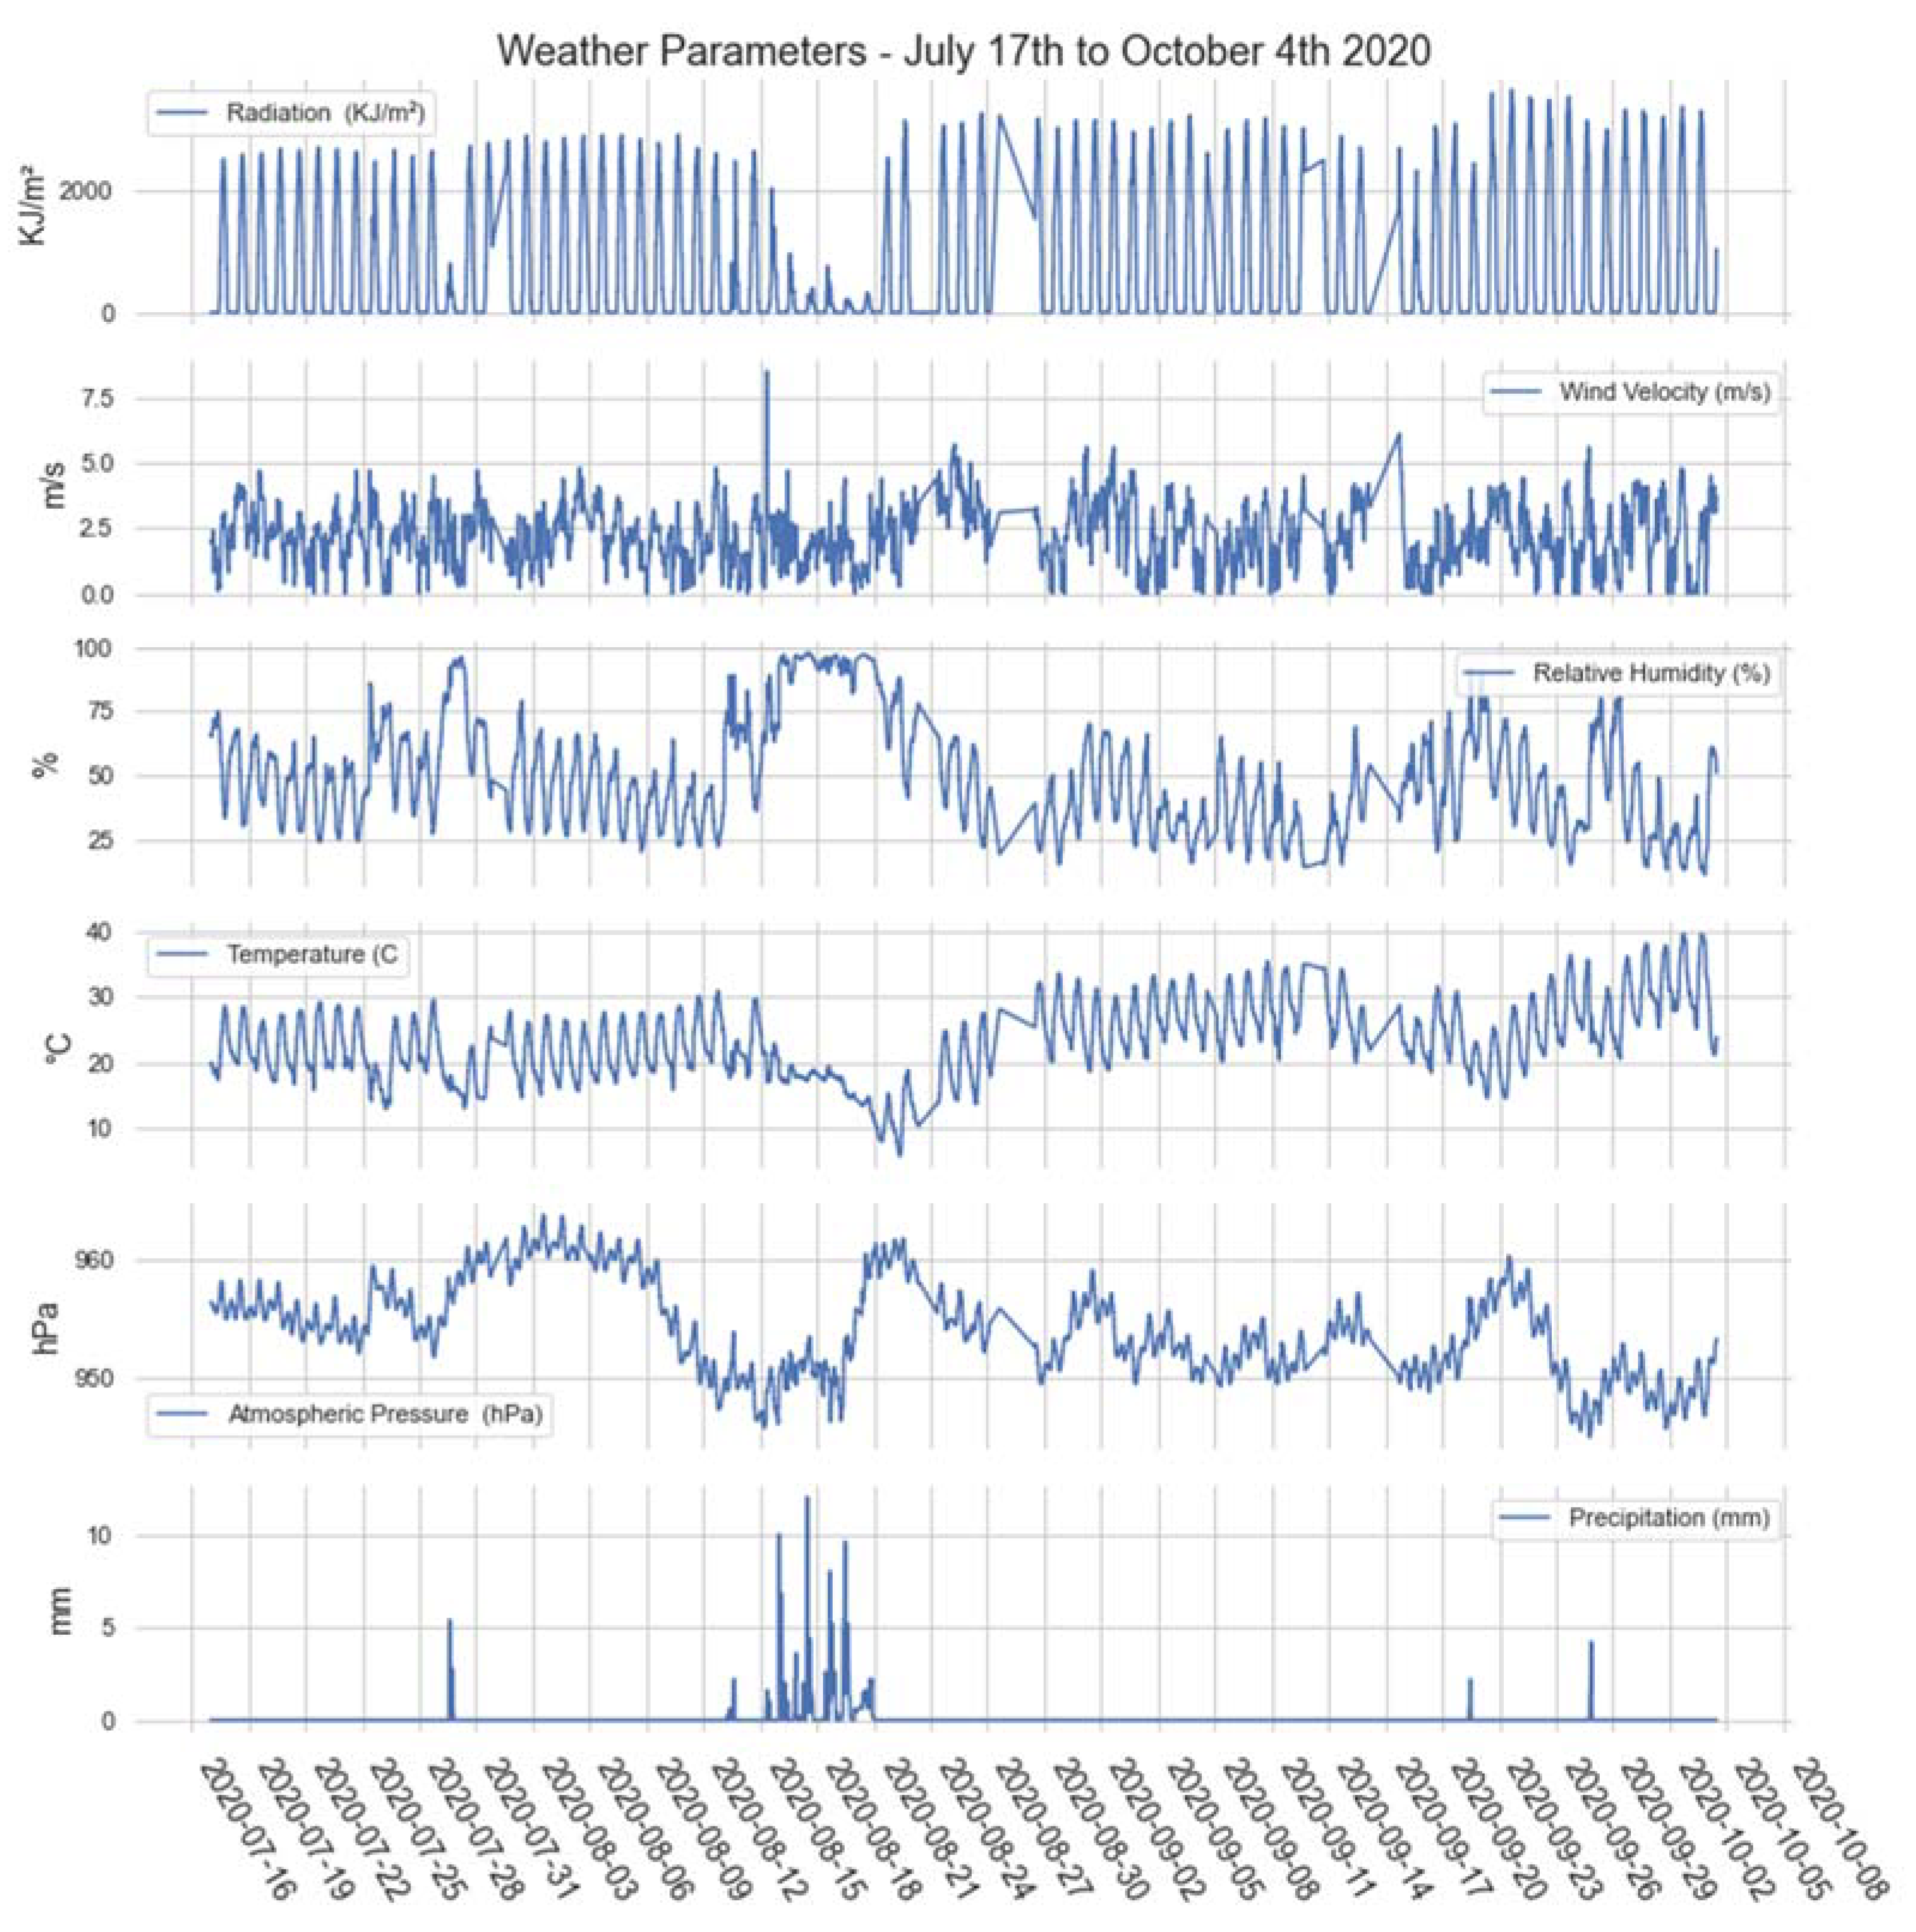
3.2. Weather Parameters

For the period of sensor readings studied in this work, collected through the floating IoT monitoring station, the following parameters were observed: solar radiation had its maximum at 3672 KJ/m2 and minimum of 0 when it was night; precipitation occurred in a few days during almost three months of observation of data collections, characterizing this period with a dry period, with maximum total precipitation of 12 mm; atmospheric pressure oscillated between 963 and 954 hPa; the wind speed had a maximum of 8.5 m/s and a minimum of 0 m/s; maximum relative humidity of 99% and a minimum of 11%. Figure 7 shows the data from the Main Climatological Station of Maringá (ECPM).

3.3. Data Collection: Water Sensors

Six parameters were used as representative indicators in this paper: water temperature (WT), pH, dissolved oxygen (DO), electrical conductivity (EC), total dissolved solids (TDS), and oxide reduction potential (ORP). These physicochemical parameters of water are among the most important [1,32,43] and are related to IoT and water monitoring using electronic sensors in the academy.
The calibration of each Atlas Scientific sensor is mandatory before deployment [44]. The pH and EC sensors consider the three- and two-point calibration process to be accurate and effective. ORP does not require calibration since a linear response is observed. The pH sensor is calibrated using two factory solutions with values of four, seven, and ten. The EC sensor is also calibrated using two solutions with values of 1.41 μS/cm and 12.88 mS/cm. The OD sensor is calibrated using 9.00 mg/L reading on air.
As shown in Figure 8, Figure 9, Figure 10, Figure 11, Figure 12 and Figure 13, we have three plots: the top plot comprises the readings for the entire period of collections by the monitoring station, 17 July to 4 October 2020; just below on the left, we have a shorter period, for better visualization, containing ten days of reading comprising the days between 4 and 14 August 2020; and finally, the plot on the right comprises 24 h, on 4 August 2020.

3.3.1. Water Temperature (WT)

In the dynamics of tropical lakes, high temperature is a fundamental factor; it directly influences vital processes in lake ecosystems such as primary productivity and decomposition of organic matter, so there is intense reproduction of phytoplanktonic organisms, and, consequently, intense absorption of dissolved nutrients [1,32,43,44,45,46]. The recycling of nutrients in tropical lakes, as well as the high rate of decomposition of organic debris, comes from the positive effect of high temperature on the metabolism of microorganisms, causing most of the debris produced in the euphotic zone to be decomposed and reabsorbed there. In this way, the low concentration of nutrients in tropical lakes is compensated by the high recycling rate. The direct action of temperature on aquatic organisms is based on Van T’Hoff’s rule, which proposes that raising the temperature of solutions by 10 °C can double or triple the rate of reactions. As shown in Figure 8, notice a seasonality and trend for this parameter in this time series.

3.3.2. Dissolved Oxygen (DO)

We highlight the atmosphere and photosynthesis as the primary sources of oxygen for water, oxygen being one of the most important gases in the dynamics and characterization of aquatic ecosystems. On the other hand, there is the reduction and solubility of dissolved oxygen in water by the decomposition of organic matter (oxidation), losses to the atmosphere, respiration of aquatic organisms, and oxidation of metal ions [1,32,43,45,46].
Temperature and pressure directly change the solubility of oxygen in the water. Oxygen saturation is the maximum amount of oxygen dissolved in water at a given pressure and temperature. Thus, it is evident that tropical aquatic organisms have, in principle, less oxygen available when compared to temperate lakes. In addition, the nitrification process is an oxidative reaction. Therefore, it depends on the existing dissolved oxygen, in which levels ideal for nitrification of bacteria range from 4 to 8 mg/L [43].
When using Atlas Scientific DO sensors, it is necessary to be aware that DO measurements are affected by temperature and pressure, so that some trade-offs may be necessary.
According to Figure 9, below on the right, we have readings where we notice the variation of the DO indices reaching the highest daily value around 17:00 h and the lowest value between 6:00–8:00 h in the morning before sunrise, indicating that the more significant activity of dissolved oxygen production is directly involved with photosynthesis. Throughout the night, oxygen consumption reaches its lowest rate moments before dawn due to activity, mainly by respiration and decomposition in the aquatic ecosystem [43]. In addition, in the bottom left of Figure 9, we noticed a seasonality observed for this parameter in this time series.

3.3.3. pH

The pH can be considered one of the most important environmental variables [1,32,43,44,45,46], but one of the most difficult to interpret due to the large number of factors that can influence it. In most natural waters, the pH is influenced by the concentration of H+ ions originating from the dissociation of carbonic acid [43,44,47], which generates low pH values and from the reactions of carbonate and bicarbonate ions with the water molecule, raising the pH values into the range of alkaline [43].
Most inland water bodies have a pH that ranges between 6 and 8; however, more acidic or more alkaline environments can be found, and aquatic ecosystems with high pH values are generally found in regions with negative water balance, where precipitation is lower than evaporation [43], a scenario observed during the experiment in the lake of Parque do Ingá. Therefore, during prolonged droughts, it is possible to find values higher than 9.0.
The greater the plant biomass to the water mass, the greater the pH changes in the medium; in addition, they will occur in a shorter period. Thus, it can be expected that during 24 h (daily cycle), large variations in pH may occur in the same continental aquatic ecosystem. Other factors can interfere with the pH of continental aquatic ecosystems, such as rain, which is normally acidic (pH 5–6). One of the biological factors that can affect pH is photosynthesis [43].
Below on the right in Figure 10, we noticed that that the pH reaches its highest daily value between 16–18 h and the lowest value between 7 h in the morning. Thus, the increase in pH directly related to the photosynthesis process is observed, and pH values above 9.0 are also observed in the area during periods of great drought [43]. In addition, in the bottom left in Figure 10, we noticed a seasonality and a particular trend for this parameter in this time series.

3.3.4. Electrical Conductivity (EC) and Total Dissolved Solids (TDS)

Electrical conductivity (EC) is one of lake water’s most critical thermophysical properties, maintaining an almost linear relationship with total dissolved solids (TDS). These parameters, applied to monitoring water quality, become references for implementing pollution prevention strategies [1,32,43,44,46,48].
Electrical conductivity (EC) demonstrates the ability to conduct current and evaluate the total amount of salts or ions dissolved in the water, showing a temperature dependence, with the amount of dissolved or water-soluble materials being called total dissolved solids (TDS) [32,43,46,48], a parameter linked to the productivity of the organism. The more chemical ions or dissolved salts a body of water contains, the higher the conductivity. Consequently, conductivity can be correlated with total dissolved solids and chloride ions. Therefore, any aquatic organism’s continuity, development, or reproduction is primarily controlled by the concentration of dissolved ions in the lake water [37].
The conductivity can have alterations in its readings by several factors, among them natural floods, evaporation, or pollution caused by man, which may indicate lake pollution.
According the bottom right in Figure 11, the variation of the total dissolved solids indices reached the highest daily value between 3 pm and 6 pm and the lowest in the morning. In addition, in the bottom left in Figure 11, we noticed a seasonality observed for this parameter in this time series.
Observing the bottom right in Figure 12, we notice the variation of the electrical conductivity indices that reaches the highest daily value between 16–18 h and the lowest value at 7:00 a.m. In addition, in the bottom left in Figure 12, we noticed a seasonality and a particular trend observed for this parameter in this time series.

3.3.5. Oxidation Reduction Potential (ORP)

The ORP measures the intensity with which electrons are transferred between oxidants to the reductant in a solution. It indicates the water’s ability to rid itself of contaminants and is a qualitative measure of the oxidation state in water [43,44,49]. According to Figure 13, we notice that the total redox potential indices reaches its highest daily value from 12–14 h and its lowest in the night period. In addition, in the bottom left in Figure 13, we noticed a certain trend and seasonality observed for this parameter in this time series.

3.3.6. Correlation of Parameters

In our exploration data analysis (EDA), we noticed that some of the data had very large values, e.g., between 154 and 801, while some had small values between 4 and 8. This graph in Figure 14 adopted the common procedure of data preparation to eliminate these long range values on axis y. We used the sklearn python package MinMaxScaler for the scaling. The sklearn Python package is a machine-learning library that implements various algorithms including preprocessing techniques such as min–max scaling and standardization. Every data record was rescaled into the range [0, 1] using the object MinMaxScaler from Scikit-learn [50,51,52]. Therefore, in order to plot a graph containing all the variables collected by the IoT monitoring station, we applied a new scale to the data through the MinMaxScaler function of the Python sklearn library. Figure 8 shows the result of the plot and visually suggests some correlations between the studied variables.
In order to show all variables in the same plot and visually verify a possible seasonality, trend, cedasticity, and correlation between the variables, we apply the scalability between 0 and 1, as mentioned in the previous paragraph. Figure 14 shows readings from top to bottom: a plot containing data collected throughout the survey period, which corresponds to 17 July through to 4 October; a plot containing only ten days to visualize the readings better and better observes the behavior of the variables, which corresponds to 4 August to 14 August; finally, the last plot shows 24 h of reading, observing the behavior during the beginning of the day, at 00:00, until its end at 23:59:59.
Pearson Correlation of Physicochemical Parameters is a test statistic that measures the statistical relationship, or association, between two continuous variables. It is known to measure the association between variables of interest because it is based on the method of covariance [53]. Thus, the correlations between physicochemical parameters support and explain the relationships between them. In this study, the results for the correlation matrix between parameters are given in Figure 15. An R value that is greater than ±0.5 to near ±1 indicates a strong correlation, while one that is below ±0.5 is considered a weak correlation. Ten strong correlation pairs were observed from the data, which included DO-pH, DO-EC, DO-WT, DO-TDS, pH-WT, EC-TDS, EC-WT, and WT-TDS. Other pairs showed weak correlations with each other. The Pearson correlation matrix was calculated among the parameters:

4. Conclusions

This article discusses how we can design and implement multiparametric sensors in an IoT environment in the context of a case study on an urban lake. First, a guideline on how researchers can build their own custom IoT floating platform was provided to test and develop a floating platform with a 24/7 monitoring option in a sluggish ecosystem. Then, an analysis of the data collected by the platform was presented, and a correlation between them was demonstrated. During the floating platform implementation phase, some intercurrences related to nature and climate actions occurred. However, this experience enriched the work by revealing difficulties we would not find in a laboratory test, and can help future researchers in their in situ projects. Finally, the proposed methodology was implemented and evaluated in a real environment, while the experimental results confirmed the applicability of our approach. In future work, it is worth investigating using ML models to learn the relationships between physical sensor metrics and replace most of them with virtual counterparts. The final vision of this future direction is to approach an intelligent environment, monitored 24/7, using a minimum of physical sensors, which automatically make decisions and interact with the data presented in real-time, being able to analyze future imbalances and environmental imbalances, providing the possibility of anticipating some details of environmental disasters related to the lentic ecosystem, such as lakes, ponds, and dams, among others.

Author Contributions

Conceptualization, C.M.G.A. and E.S.J.Z.; Methodology, E.S.J.Z., L.L.P., C.M.G.A. and O.C.d.M.L.; Software, E.S.J.Z. and L.B.R.; Validation, M.V.d.O., L.L.P. and L.B.R.; Formal analysis, E.S.J.Z. and C.M.G.A.; Investigation, E.S.J.Z., C.M.G.A., M.V.d.O. and L.L.P.; Resources, E.S.J.Z. and L.B.R.; Data curation, E.S.J.Z.; Writing—original draft preparation, E.S.J.Z.; Writing—review and editing, L.L.P. and M.V.d.O.; Visualization, E.S.J.Z., M.V.d.O., L.L.P., O.C.d.M.L. and C.M.G.A.; Supervision, O.C.d.M.L. and C.M.G.A.; Project administration, E.S.J.Z., O.C.d.M.L. and C.M.G.A.; Funding acquisition, L.B.R. All authors have read and agreed to the published version of the manuscript.

Funding

Conselho Nacional de Desenvolvimento Científico e Tecnológico; Coordenação de Aperfeiçoamento dePessoal de Nível Superior; Fundação Araucária.

Data Availability Statement

Not applicable.

Conflicts of Interest

The authors declare no conflict of interest.

References

  1. Bourechak, A.; Zedadra, O.; Kouahla, M.N.; Guerrieri, A.; Seridi, H.; Fortino, G. At the Confluence of Artificial Intelligence and Edge Computing in IoT-Based Applications: A Review and New Perspectives. Sensors 2023, 23, 1639. [Google Scholar] [CrossRef] [PubMed]
  2. Stavropoulos, G.; Violos, J.; Tsanakas, S.; Leivadeas, A. Enabling Artificial Intelligent Virtual Sensors in an IoT Environment. Sensors 2023, 23, 1328. [Google Scholar] [CrossRef]
  3. Jáquez, A.D.B.; Herrera, M.T.A.; Celestino, A.E.M.; Ramírez, E.N.; Cruz, D.A.M. Extension of LoRa Coverage and Integration of an Unsupervised Anomaly Detection Algorithm in an IoT Water Quality Monitoring System. Water 2023, 15, 1351. [Google Scholar] [CrossRef]
  4. Bogdan, R.; Paliuc, C.; Crisan-Vida, M.; Nimara, S.; Barmayoun, D. Low-Cost Internet-of-Things Water-Quality Monitoring System for Rural Areas. Sensors 2023, 23, 3919. [Google Scholar] [CrossRef] [PubMed]
  5. Davis, A.; Wills, P.S.; Garvey, J.E.; Fairman, W.; Karim, M.A.; Ouyang, B. Developing and Field Testing Path Planning for Robotic Aquaculture Water Quality Monitoring. Appl. Sci. 2023, 13, 2805. [Google Scholar] [CrossRef]
  6. Zhang, H.; Gui, F. The Application and Research of New Digital Technology in Marine Aquaculture. J. Mar. Sci. Eng. 2023, 11, 401. [Google Scholar] [CrossRef]
  7. Santos, R.; Eggly, G.; Gutierrez, J.; Chesñevar, C.I. Extending the IoT-Stream Model with a Taxonomy for Sensors in Sustainable Smart Cities. Sustainability 2023, 15, 6594. [Google Scholar] [CrossRef]
  8. Tsampoulatidis, I.; Komninos, N.; Syrmos, E.; Bechtsis, D. Universality and Interoperability across Smart City Ecosystems. In Distributed, Ambient and Pervasive Interactions. Smart Environments, Ecosystems, and Cities; Springer: Cham, Switzerland, 2022; pp. 218–230. [Google Scholar]
  9. Ullo, S.L.; Sinha, G.R. Advances in Smart Environment Monitoring Systems Using IoT and Sensors. Sensors 2020, 20, 3113. [Google Scholar] [CrossRef]
  10. Lowe, M.; Qin, R.; Mao, X. A Review on Machine Learning, Artificial Intelligence, and Smart Technology in Water Treatment and Monitoring. Water 2022, 14, 1384. [Google Scholar] [CrossRef]
  11. Azrour, M.; Mabrouki, J.; Fattah, G.; Guezzaz, A.; Aziz, F. Machine learning algorithms for efficient water quality prediction. Model. Earth Syst. Environ. 2022, 8, 2793–2801. [Google Scholar] [CrossRef]
  12. Mabrouki, J.; Fattah, G.; Kherraf, S.; Abrouki, Y.; Azrour, M.; El Hajjaji, S. Artificial Intelligence System for Intelligent Monitoring and Management of Water Treatment Plants. Emerging Real-World Applications of Internet of Things; CRC Press: Boca Raton, FL, USA, 2022; pp. 69–87. [Google Scholar]
  13. Nemade, B.; Shah, D. An IoT-Based Efficient Water Quality Prediction System for Aquaponics Farming. In Computational Intelligence; Lecture Notes in Electrical Engineering; Shukla, A., Murthy, B.K., Hasteer, N., Van Belle, J.P., Eds.; Springer: Singapore, 2023; Volume 968. [Google Scholar] [CrossRef]
  14. Adli, H.K.; Remli, M.A.; Wan Salihin Wong, K.N.S.; Ismail, N.A.; González-Briones, A.; Corchado, J.M.; Mohamad, M.S. Recent Advancements and Challenges of AIoT Application in Smart Agriculture: A Review. Sensors 2023, 23, 3752. [Google Scholar] [CrossRef]
  15. Mabrouki, J.; Azoulay, K.; Elfanssi, S.; Bouhachlaf, L.; Mousli, F.; Azrour, M.; El Hajjaji, S. Smart System for Monitoring and Controlling of Agricultural Production by the IoT. In IoT and Smart Devices for Sustainable Environment; Springer: Cham, Switzerland, 2022; pp. 103–115. [Google Scholar]
  16. Silva-Campillo, A.; Pérez-Arribas, F.; Suárez-Bermejo, J.C. Health-Monitoring Systems for Marine Structures: A Review. Sensors 2023, 23, 2099. [Google Scholar] [CrossRef]
  17. Razzaq, A.; Mohsan, S.A.H.; Li, Y.; Alsharif, M.H. Architectural Framework for Underwater IoT: Forecasting System for Analyzing Oceanographic Data and Observing the Environment. J. Mar. Sci. Eng. 2023, 11, 368. [Google Scholar] [CrossRef]
  18. Gao, C.; Wang, F.; Hu, X.; Martinez, J. Research on Sustainable Design of Smart Cities Based on the Internet of Things and Ecosystems. Sustainability 2023, 15, 6546. [Google Scholar] [CrossRef]
  19. Mukhopadhyay, S.; Suryadevara, N.K. Smart Cities and Homes: Current Status and Future Possibilities. J. Sens. Actuator Netw. 2023, 12, 25. [Google Scholar] [CrossRef]
  20. Zulkifli, C.Z.; Garfan, S.; Talal, M.; Alamoodi, A.H.; Alamleh, A.; Ahmaro, I.Y.Y.; Sulaiman, S.; Ibrahim, A.B.; Zaidan, B.B.; Ismail, A.R.; et al. IoT-Based Water Monitoring Systems: A Systematic Review. Water 2022, 14, 3621. [Google Scholar] [CrossRef]
  21. Mabrouki, J.; Azrour, M.; Hajjaji, S.E. Use of internet of things for monitoring and evaluating water’s quality: A comparative study. Int. J. Cloud Comput. 2021, 10, 633–644. [Google Scholar] [CrossRef]
  22. Soares, P.H.; Monteiro, J.P.; de Freitas, H.F.S.; Ogiboski, L.; Vieira, F.S.; Andrade, C.M.G. Monitoring and Analysis of Outdoor Carbon Dioxide Concentration by Autonomous Sensors. Atmosphere 2022, 13, 358. [Google Scholar] [CrossRef]
  23. Soares, P.H.; Monteiro, J.P.; Freitas, H.F.; Zenko Sakiyama, R.; Andrade, C.M.G. Platform for monitoring and analysis of air quality in environments with large circulation of people. Environ. Prog. Sustain. Energy 2018, 37, 2050–2057. [Google Scholar] [CrossRef]
  24. Ashton, K. That ‘Internet of Things’ Thing. RFiD J. 2009, 22, 97–114. [Google Scholar]
  25. Ighalo, J.O.; Adeniyi, A.G.; Marques, G. Internet of Things for Water Quality Monitoring and Assessment: A Comprehensive Review. In Artificial Intelligence for Sustainable Development: Theory, Practice and Future Applications; Springer: Cham, Switzerland, 2020; pp. 245–259. [Google Scholar]
  26. Samarinas, N.; Spiliotopoulos, M.; Tziolas, N.; Loukas, A. Synergistic Use of Earth Observation Driven Techniques to Support the Implementation of Water Framework Directive in Europe: A Review. Remote Sens. 2023, 15, 1983. [Google Scholar] [CrossRef]
  27. Piazza, S.; Sambito, M.; Freni, G. Analysis of Optimal Sensor Placement in Looped Water Distribution Networks Using Different Water Quality Models. Water 2023, 15, 559. [Google Scholar] [CrossRef]
  28. Reljić, M.; Romić, M.; Romić, D.; Gilja, G.; Mornar, V.; Ondrasek, G.; Bubalo Kovačić, M.; Zovko, M. Advanced Continuous Monitoring System—Tools for Water Resource Management and Decision Support System in Salt Affected Delta. Agriculture 2023, 13, 369. [Google Scholar] [CrossRef]
  29. Dettke, G.A.; Orfrini, A.C.; Milaneze-Gutierre, M.A. Composição Florística E Distribuição De Epífitas Vasculares Em Um Remanescente Alterado De Floresta Estacional Semidecidual No Paraná, Brasil. Rodriguésia 2008, 59, 859–872. [Google Scholar] [CrossRef] [Green Version]
  30. Yang, S.; Castilleja, R.J.; Barrera, E.V.; Lozano, K. Thermal analysis of an acrylonitrile–butadiene–styrene/SWNT composite. Polym. Degrad. Stab. 2004, 83, 383–388. [Google Scholar] [CrossRef]
  31. Jan, F.; Min-Allah, N.; Saeed, S.; Iqbal, S.Z.; Ahmed, R. IoT-Based Solutions to Monitor Water Level, Leakage, and Motor Control for Smart Water Tanks. Water 2022, 14, 309. [Google Scholar] [CrossRef]
  32. Gudla, S.; Padmaja, B.; Mishra, P.; Sambana, B.; Chandramouli, D.; Abbas, A.M. Global Warming Mitigation using an Internet of Things based Plant Monitoring System. MMTC Commun. Front. 2022, 17, 2. [Google Scholar] [CrossRef]
  33. Pal, M.; Samal, N.R.; Roy, P.K.; Roy, M.B. Electrical conductivity of lake water as environmental monitoring—A case study of Rudrasagar Lake. J. Environ. Sci. Toxicol. Food Technol. 2015, 9, 66–71. [Google Scholar]
  34. Demetillo, A.T.; Japitana, M.V.; Taboada, E.B. A system for monitoring water quality in a large aquatic area using wireless sensor network technology. Sustain. Environ. Res. 2019, 29, 12. [Google Scholar] [CrossRef] [Green Version]
  35. Lu, H.-Y.; Cheng, C.-Y.; Cheng, S.-C.; Cheng, Y.-H.; Lo, W.-C.; Jiang, W.-L.; Nan, F.-H.; Chang, S.-H.; Ubina, N.A. A Low-Cost AI Buoy System for Monitoring Water Quality at Offshore Aquaculture Cages. Sensors 2022, 22, 4078. [Google Scholar] [CrossRef]
  36. Yang, C.; Xu, Y. Design and Implementation of Fruit and Vegetable Vending Machine Based on Deep Vision. In Proceedings of the 11th International Conference on Computer Engineering and Networks. Lecture Notes in Electrical Engineering, Hechi, China, 21–25 October 2021; Liu, Q., Liu, X., Chen, B., Zhang, Y., Peng, J., Eds.; Springer: Singapore, 2022; Volume 808. [Google Scholar] [CrossRef]
  37. Prakash, C.; Barthwal, A.; Acharya, D. FLOODALERT: An internet of things based real-time flash flood tracking and prediction system. Multimed. Tools Appl. 2023, 1–27. [Google Scholar] [CrossRef]
  38. Mattimani, R.; Iyer, N.C.; Devaji, J.P. Pre-stampede Monitoring and Alarm System. In ICT with Intelligent Applications; Smart Innovation, Systems and Technologies; Senjyu, T., Mahalle, P.N., Perumal, T., Joshi, A., Eds.; Springer: Singapore, 2022; Volume 248. [Google Scholar] [CrossRef]
  39. Soares, P.H.; Monteiro, J.P.; Gaioto, F.J.; Ogiboski, L.; Andrade, C.M.G. Use of Association Algorithms in Air Quality Monitoring. Atmosphere 2023, 14, 648. [Google Scholar] [CrossRef]
  40. Fuentes-Pérez, J.F.; Sanz-Ronda, F.J. A Custom Sensor Network for Autonomous Water Quality Assessment in Fish Farms. Electronics 2021, 10, 2192. [Google Scholar] [CrossRef]
  41. Aparecido, L.E.D.O.; Rolim, G.D.S.; Richetti, J.; Souza, P.S.D.; Johann, J.A. Köppen, Thornthwaite and Camargo climate classifications for climatic zoning in the State of Paraná, Brazil. Ciência E Agrotecnologia 2016, 40, 405–417. [Google Scholar] [CrossRef] [Green Version]
  42. Lee, Y.H.; Tsao, G.T. Dissolved Oxygen Electrodes. In Advances in Biochemical Engineering; Springer: Berlin/Heidelberg, Germany, 2005; Volume 13, pp. 35–86. [Google Scholar]
  43. Esteves, F.A. Fundamentos de Limnologia, 2nd ed.; Interciência/FINEP: Rio de Janeiro, Brazil, 1998. [Google Scholar]
  44. Syrmos, E.; Sidiropoulos, V.; Bechtsis, D.; Stergiopoulos, F.; Aivazidou, E.; Vrakas, D.; Vezinias, P.; Vlahavas, I. An Intelligent Modular Water Monitoring IoT System for Real-Time Quantitative and Qualitative Measurements. Sustainability 2023, 15, 2127. [Google Scholar] [CrossRef]
  45. Eramma, N.; Lalita, H.M.; Satishgouda, S.; Renuka Jyothi, S.; Venkatesh, C.N.; Patil, S.J. Zooplankton Productivity Evaluation of Lentic and Lotic Ecosystem; IntechOpen: London, UK, 2023. [Google Scholar] [CrossRef]
  46. Lemessa, F.; Simane, B.; Seyoum, A.; Gebresenbet, G. Assessment of the Impact of Industrial Wastewater on the Water Quality of Rivers around the Bole Lemi Industrial Park (BLIP), Ethiopia. Sustainability 2023, 15, 4290. [Google Scholar] [CrossRef]
  47. Tanjung, R.H.R.; Hamuna, B.; Alianto, A. Assessment of Water Quality and Pollution Index in Coastal Waters of Mimika, Indonesia. J. Ecol. Eng. 2019, 20, 87–94. [Google Scholar]
  48. Kuang, Y.; Guo, X.; Hu, J.; Li, S.; Zhang, R.; Gao, Q.; Yang, X.; Chen, Q.; Sun, W. Occurrence and risks of antibiotics in an urban river in northeastern Tibetan Plateau. Sci. Rep. 2020, 10, 20054. [Google Scholar] [CrossRef]
  49. Tang, Z.; Jiang, Y.; Wang, C.; Zhang, R.; Guo, J.; Fang, F. New Insight into Phosphorus Release of Rhizosphere Soil in the Water Level Fluctuation Zone. Sustainability 2023, 15, 6635. [Google Scholar] [CrossRef]
  50. Phaladisailoed, T.; Numnonda, T. Machine Learning Models Comparison for Bitcoin Price Prediction. In Proceedings of the 2018 10th International Conference on Information Technology and Electrical Engineering (ICITEE), Bali, Indonesia, 24–26 July 2018; pp. 506–511. [Google Scholar]
  51. Czmil, A.; Kluska, J.; Czmil, S. GPR: A Python implementation of an extremely simple classifier based on fuzzy logic and gene expression programming. SoftwareX 2023, 22, 101362. [Google Scholar] [CrossRef]
  52. Mndawe, S.T.; Paul, B.S.; Doorsamy, W. Development of a Stock Price Prediction Framework for Intelligent Media and Technical Analysis. Appl. Sci. 2022, 12, 719. [Google Scholar] [CrossRef]
  53. Qiu, Y.; Vo, T.; Garg, D.; Lee, H.; Kharangate, C.R. A systematic approach to optimization of ANN model parameters to predict flow boiling heat transfer coefficient in mini/micro-channel heatsinks. Int. J. Heat Mass Transf. 2023, 202, 123728. [Google Scholar] [CrossRef]
Figure 1. Study Area. (a) Local Inga Park coordinates. (b,c) floating station.
Water 15 02310 g001
Figure 2. Some details of floating station parts: (a) Floating dock, airtight box installed on top, boat towing station. (b) External protective structure for the probes. (c) Internal protective structure made of silicone. (d) Fitting of the structures.
Water 15 02310 g002
Figure 3. Flowchart describing the process of floating station algorithm.
Water 15 02310 g003
Figure 4. Some details of floating station parts: (a) The power supply module (blue part) with a capacity of 38 A/h installed in the hermetic box. (b) Kernel module only with connections to EZO Circuits and GSM module SIM800A installed on the side, seen in the lower right part of the photo.
Water 15 02310 g004
Figure 5. System software working diagram.
Water 15 02310 g005
Figure 6. Experiences gained and optimizations during research. (a) Detail of the cormorants on top of the platform. (b) Thermal paint applied to the surface of the airtight box and part of the platform. (c) cable protection structure and probe protection case. (d) Drought during the period of experience demonstrated by the lowering of the water level. (e) Cyclone. (f) Bird droppings and detail of the horizontal tube to protect the antenna used by the SIM800A shield.
Water 15 02310 g006
Figure 7. Weather data collection between 17 July to 4 October 2020.
Water 15 02310 g007
Figure 8. Readings for Water Temperature.
Water 15 02310 g008
Figure 9. Dissolved oxygen readings.
Water 15 02310 g009
Figure 10. pH reading.
Water 15 02310 g010
Figure 11. TDS reading.
Water 15 02310 g011
Figure 12. Conductivity electrical reading.
Water 15 02310 g012
Figure 13. ORP reading.
Water 15 02310 g013
Figure 14. Parameters collected by the floating monitoring station. Detail of data scaling between 0 and 1 through the MinMaxScaler algorithm–sklearn Python API.
Water 15 02310 g014
Figure 15. Heat map Pearson correlation coefficient values for each parameter of features.
Water 15 02310 g015
Disclaimer/Publisher’s Note: The statements, opinions and data contained in all publications are solely those of the individual author(s) and contributor(s) and not of MDPI and/or the editor(s). MDPI and/or the editor(s) disclaim responsibility for any injury to people or property resulting from any ideas, methods, instructions or products referred to in the content.

