Article

The Dynamic Characteristics of a Piped Capsule Moving in a Straight Pipeline

1
College of Hydro Science and Engineering, Taiyuan University of Technology, Taiyuan 030024, China
2
College of Mechanical and Vehicle Engineering, Taiyuan University of Technology, Taiyuan 030024, China
*
Author to whom correspondence should be addressed.
Water 2023, 15(12), 2306; https://doi.org/10.3390/w15122306
Submission received: 8 May 2023 / Revised: 15 June 2023 / Accepted: 17 June 2023 / Published: 20 June 2023
(This article belongs to the Section Hydraulics and Hydrodynamics)

Abstract

:
The hydraulic transportation of piped capsules is a new and energy-saving transportation mode, which is especially suitable for the long-distance and high-stability requirements of material transportation. In this paper, the COMSOL Multiphysics software was used to construct a mathematical model of the dynamic characteristics of a piped capsule moving in a straight pipeline, in which the boundary conditions were redeveloped, the inlet velocity distribution function was defined, and the physical experiment was carried out for verification. The dynamic characteristics were analyzed, and through the calculation of the energy consumption, the optimal piped capsule under the research conditions was obtained. The results show that the simulation results and experimental results for the piped capsule’s average moving velocity, axial velocity, and wall shear stress along the cylinder wall were basically consistent, with a maximum error of 14.22%, 2.62%, and 20.13%, respectively. With a decrease in the diameter-to-length ratio of the piped capsule, the axial velocity of the concentric annular gap flow decreased gradually. The area with a large shear stress was mainly concentrated at the front and rear ends of the cylinder wall, especially the rear area of the support feet of the piped capsule. With the increase in the diameter of the piped capsule, the wall shear stress of the capsule increased. Finally, the superior diameter-to-length ratio for the piped capsule under the research conditions was obtained and shown to be ε = 0.4. The research in this paper will provide a theoretical reference for the structural design and dynamic mechanism analysis of the piped capsule.

1. Introduction

As a new way of transporting products, the hydraulic transportation of piped capsules is safer, faster, and more environmentally friendly than traditional transportation methods, such as highways and railways. Products are contained and sealed in a piped capsule and conveyed to the destination through a long-distance pipeline buried underground using the pipeline pressure flow.
In recent years, scholars at home and abroad have conducted much research on the hydraulic transportation of piped capsules. Sun et al. [1] analyzed the axial starting conditions of piped capsules through physical experiments. Liu and Richards [2] theoretically derived the distribution of pressure along the piped capsule and applied it to predicting its initial velocity. Kroonenberg [3] derived the piped capsule speed and the pressure drop changes through theoretical derivation and experimental verification. Dong et al. [4] and Li et al. [5] conducted a preliminary experimental study on the hydraulic characteristics of the transport of different types of piped capsules. Charles [6] estimated the velocity of the concentric annular gap flow between the piped capsule and the pipeline under two conditions: laminar flow and turbulent flow. Tomita et al. [7] derived the relationship between the operating speed of the piped capsule and the average velocity of the annular gap water flow through theoretical derivation and experimental verification. Maurizio [8] adopted a numerical simulation method to reveal the flow field characteristics of the concentric annular gap flow under turbulent conditions. Latto and Chow [9] discussed the impact of different dimensions of annular gaps on the speed, front and rear pressure drop, and unit energy loss of the piped capsule. Asim et al. [10,11,12] computed the pressure drop changes with different gap widths and lengths through CFD, as well as the distribution of flow fields in different types of pipe sections for different types of piped capsules.
When a piped capsule is moving in a straight pipeline, the pressure flow pushes the piped capsule forward and the load exerted by the pipe flow on the piped capsule will cause the capsule to deform. It will also act on the flow, causing changes in the pipe flow—i.e., the coupling response between the piped capsule and the pipe flow. However, there are few studies—whether physical experiments or numerical simulations—on the dynamic characteristics of the coupling between the piped capsule and pipe flow. Therefore, this article used the COMSOL Multiphysics software to jointly solve the pipeline fluid domain and the piped capsule solid domain to explore the dynamic characteristics of the coupling between the piped capsule and the pipe flow when the piped capsule moves in the straight pipe section. It was verified through model tests, and the energy consumption characteristics of the piped capsule was calculated based on the numerical simulation results. This will provide a certain reference for further improving the relevant theory.

2. Materials and Methods

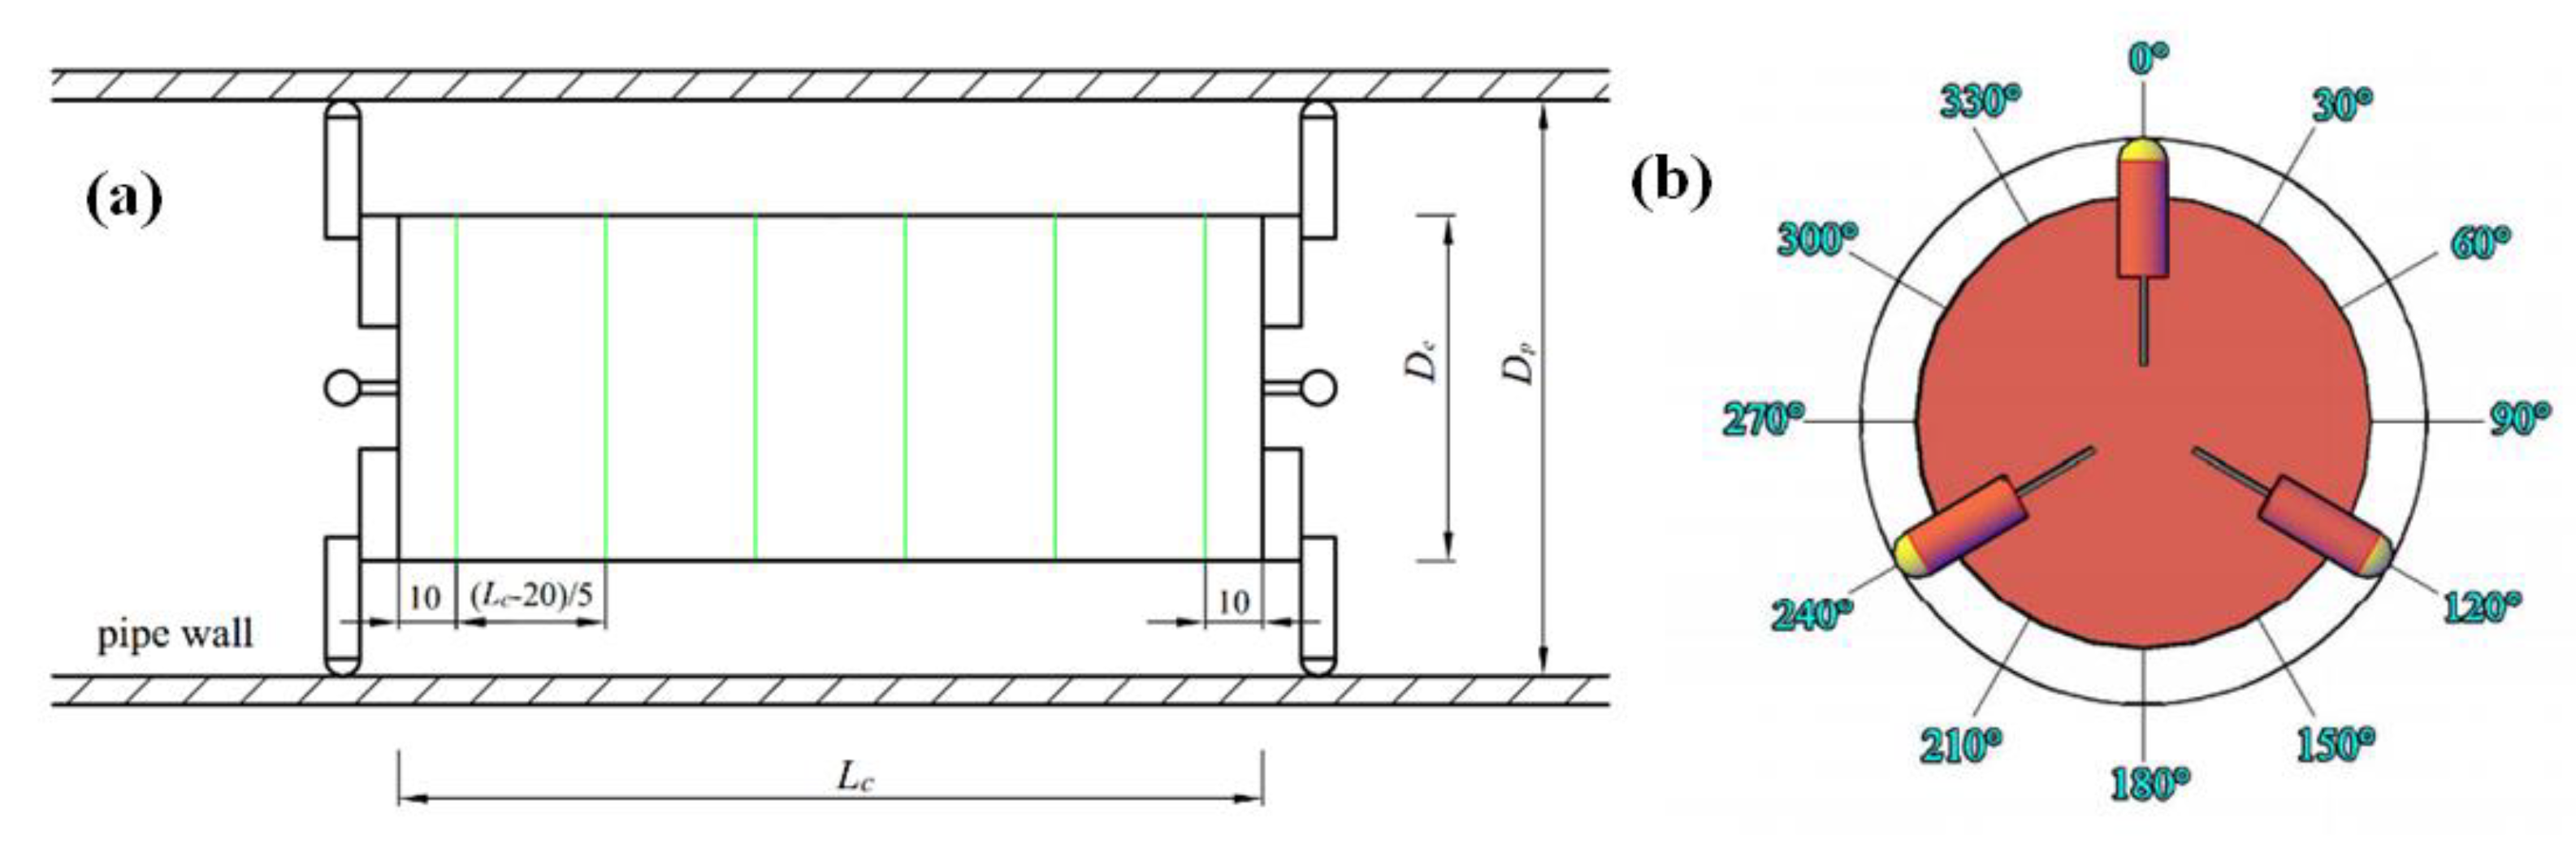
2.1. Piped Capsule Structure

The cylindrical container containing materials was named a piped capsule. It was composed of a cylinder, sealing cap, and capsule feet [1,13,14], as shown in Figure 1. The cylinder was used to hold materials, and the wall thickness of the cylinder was 5 mm. The capsule feet at both ends were distributed at 120° to ensure that the piped capsule was concentric with the pipe center during operation.

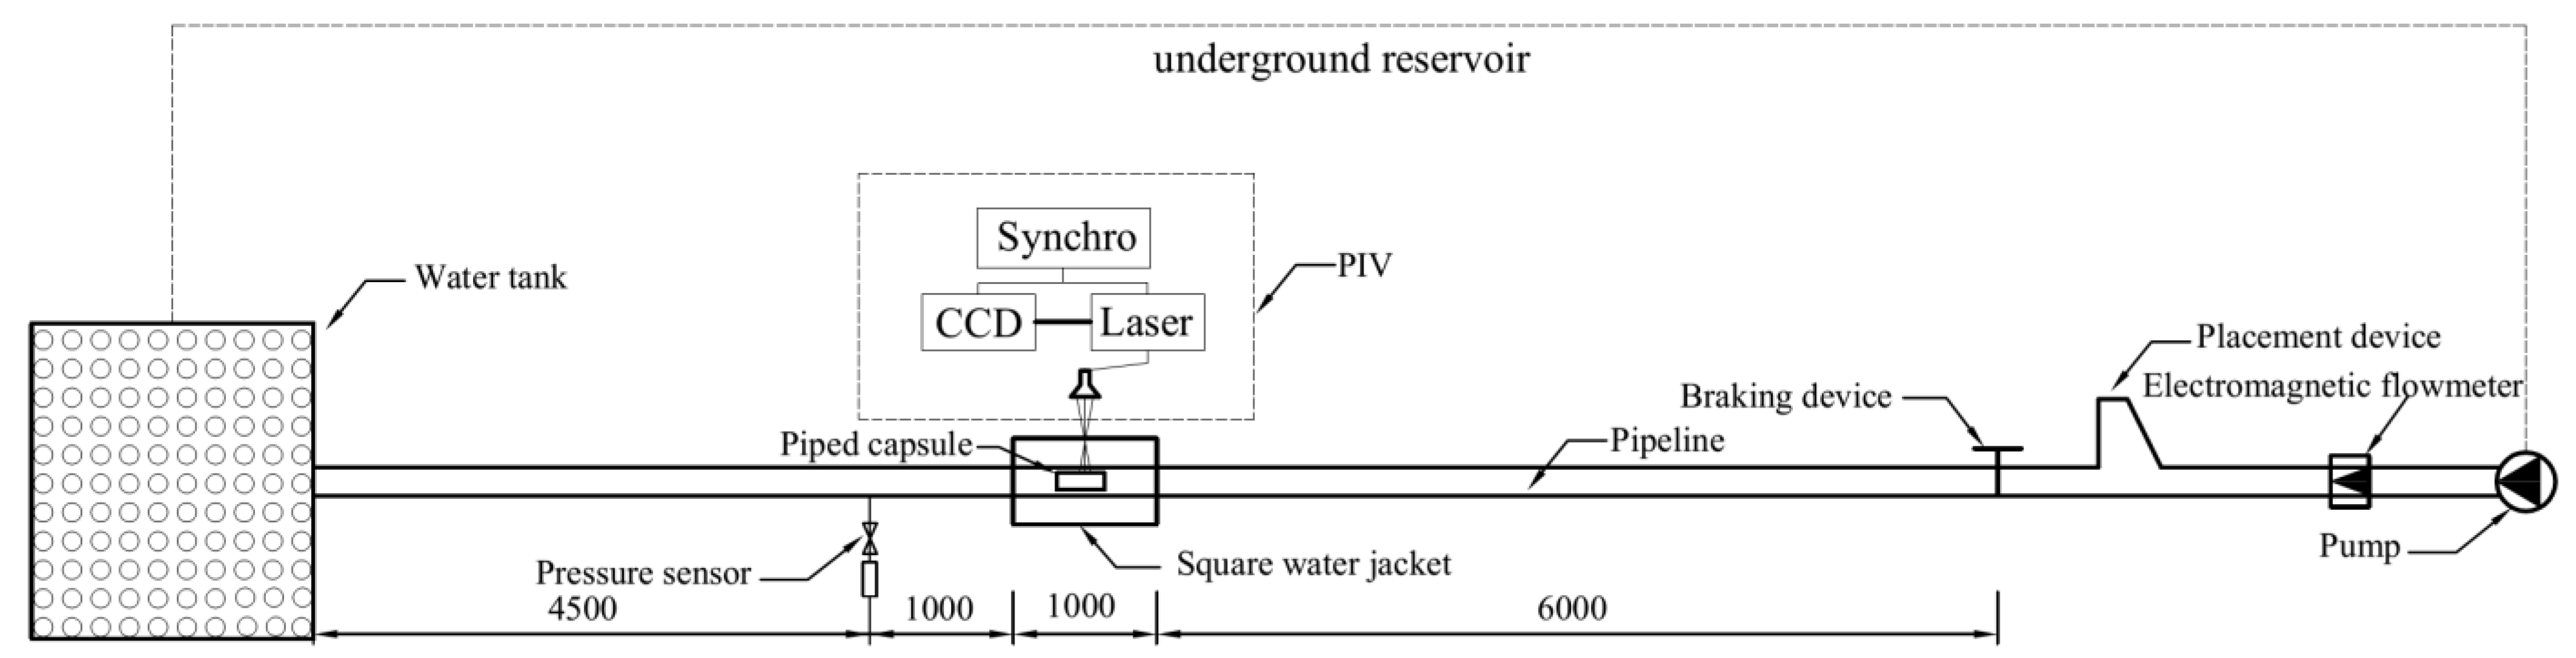
2.2. Experimental System and Methods

The experimental system was located in the Water Flow Test Hall of the Taiyuan University of Technology, as shown in Figure 2. It mainly consisted of conveying pipelines, power devices, testing devices, and recycling devices [15,16,17]. The dimensions of the conveying pipeline were: inner diameter 100 mm, wall thickness 5 mm, and length 15 m. The flow field testing area was 6.0 m away from the starting device and 5.5 m away from the outlet, meeting the conditions for a stable water flow operation [18,19].
As shown in Figure 3, the pipeline section pressure was measured using a pressure sensor combined with a standard dynamic pressure acquisition system. An infrared timer, consisting of a digital timer and two infrared probes, was used to measure the velocity of the piped capsule. The two infrared probes were located at the beginning and end of the straight pipe section. The digital timer showed the total migration time, and the average velocity of the piped capsule could be calculated using the running length of the piped capsule in the corresponding recorded time.
When a pipe capsule runs in a pipeline, the outer wall of the pipe capsule and the inner wall of the pipeline form a circular gap flow with a moving boundary. The velocity field of the gap flow was captured using a PIV. The 30 μm hollow microsphere tracer particles with an excellent water flow following ability were used in the experiment. The camera used in this experiment had a spatial resolution of 2048 × 2048 pixels and a shooting time interval of 250,000 μs. The trigger rate was selected as 4 Hz. We added a rectangular water jacket to the test section to ensure that the incident surface of the laser is flat in order to reduce the impact on measurement accuracy caused by the refraction of light by the circular pipe. To achieve a good shooting effect, we added a black background, as shown in Figure 4a.
The PIV shooting results were processed by the system’s own post-processing program. First, the arithmetic mean of the initial flow field data samples was calculated under the same working conditions to obtain the background boundary of the flow field. Second, the background boundary was subtracted from all data samples taken under the working conditions, and the gap flow field data of the test section was retained. Next, cross-correlation operations were performed through an adaptive PIV. Finally, samples captured by two PIV cameras at the same time were coupled to obtain the three-dimensional velocity vector of the slot flow field plane.
The measurement of the shear stress on the cylinder surface of the pipe capsule was carried out using a stress sensor based on a right-angle strain pattern. The collection system was placed inside the cylinder, as shown in Figure 4b. The stress sensor and collection system used a centralized 20 core lead input and output, and then transmitted the collected data to the computer in real-time through wireless signals. The arrangement of the right-angle strain pattern on the cylinder surface is shown in Figure 5. There was a total of 6 test sections, with 12 test points arranged for each section. The placement method of the right-angle strain pattern was as follows: the positioning reference of the patch was the midpoint of the 45° patch, and the patch was parallel to the axis of the pipe capsule. This patch positioning scheme can minimize the inherent measurement error of the right-angle strain pattern [20].
By using the stress sensor, the line strains of 0°, 45°, and 90° in 3 directions could be measured and substituted into the formula:
ε α = ε x + ε y 2 + ε x ε y 2 cos 2 α + γ x y 2 sin 2 α
As ε x , ε y , and γ x y . According to Formula (2), the maximum and minimum strains can be obtained.
ε min ε max = ε x + ε y 2 + ε x ε y 2 2 ± γ x y 2 2
Finally, based on the generalized Hooke’s law, the maximum of the shear stress on the cylinder surface of the pipe capsule can be determined.
τ max = E 2 ( 1 + μ ) ( ε max ε min ) θ = 1 2 arctan γ x y ε x ε y
where E and μ are the Young’s modulus and Poisson’s ratio of the material for the cylinder, respectively.

3. Numerical Calculation

In this study, the Comsol Multiphysics 5.4 was used for numerical calculation. Compared with other CFD software, this software performs a real Multiphysics simulation direct coupling analysis and can also arbitrarily combine various additional functional modules.

3.1. Geometric Model

The geometric modeling of the piped capsule moving in the straight pipeline is shown in Figure 6, where the inlet section was set to 4.5 m, the migration section was set to 3.0 m, and the outlet section was set to 0.5 m. The geometric modeling of the piped capsule was a simplification of the physical model, with the same size as the physical model. The pipeline and cylinder were made out of organic glass, which is a linear elastic material. Assuming the cylinder was isotropic, we set the model strain to a forced linear strain, and set the sealing cap and capsule foot as fixed constraints.

3.2. Governing Equations

3.2.1. Governing Equations in Fluid Domain

The governing equations of the fluid domain were the incompressible continuous equations and Reynolds-averaged Navier–Stokes equations. For incompressible viscous fluid, the continuity equation and Reynolds-averaged Navier–Stokes equation under arbitrary Lagrangian description can be expressed as follows:
u f = 0
ρ f ( u f t + ( u f ) u f = p + ( μ ( u f + ( u f ) T ) ) + ρ f g + σ k δ n + f
where ρf is the density of the fluid, kg·m−3; uf is the time-average velocity of the fluid, m·s−1; t is the time, s; P is the mean pressure, Pa; μ is the dynamic viscosity of the fluid, Pa·s; g is the acceleration of gravity, m·s−2; σ is the surface tension constant; k is the surface curvature; and δ is the surface Dirac function.

3.2.2. Turbulence Equation

The standard k-ε model was used for the simulation. Some assumptions were made: (1) the flow in the pipeline was steady and incompressible; (2) the heat exchange in the transportation process was not considered; and (3) the gravity effect of the flow in the pipeline was ignored. The equations of k and ε were as follows [21,22].
The turbulent kinetic energy equation:
ρ f ( u f ) k = [ ( μ + μ Τ σ k ) k ] + P k ρ ε
The turbulent energy dissipation rate equation:
ρ f ( u f ) ε = [ ( μ + μ Τ σ ε ) ε ] + C ε 1 ε k P k C ε 2 ρ f ε 2 k , ε = e p
The turbulent eddy viscosity equation:
μ T = ρ C μ k 2 ε
The additional term Pk of kinetic energy caused by average velocity gradient is calculated as:
P k = μ T [ u f ( u f + ( u f ) T ) ]
where Pk is the production term of turbulent kinetic energy k due to the average velocity gradient; σk is the Prandtl number corresponding to the turbulent flow energy k; σε is the Prandtl numbers corresponding to the dissipation rate ε.

3.2.3. Governing Equations in Solid Domain

The cylinder of the piped capsule is plexiglass, which is a compressible material. Therefore, the conservation equation of the solid part can be derived from Newton’s second law [23].
σ s + f s = ρ s d ¨ s
M s = I s α s + ω s × ( I s ω s )
where ρs is the density of the solid; σs is the Cauchy stress tensor; Ms is the instantaneous moment of the piped capsule; Is is the instantaneous moment of the inertia matrix of the piped capsule; ωs is the instantaneous angular velocity of the piped capsule, rad·s−2; fs is the volume force vector; and   d ¨ s   is the local acceleration vector in the solid domain.

3.2.4. Fluid Structure Interaction

The multi-physical field is a fluid–solid coupling physical field, which was studied using the built-in fluid–solid coupling interface in the Comsol Multiphysics software. The fluid coupling interface was turbulent and a standard k-ε. The structural coupling interface was solid mechanics. The fixed geometric coupling type was fully coupled.

3.3. Boundary Conditions

(1)
The non-slip condition was adopted at the wall boundary. For the first grid node near the wall, the standard wall function method was used to connect the wall with the fully developed turbulent region.
(2)
The boundary condition of the entrance was “velocity”, which was described by velocity field u0(u,0,0). u used the self-defined theoretical formula.
According to the Reynolds number of different conditions and the inner diameter Dp of the pipeline, the average velocity vp of the pipe flow was calculated.
v p = Re ν D p
By using Nikolay’s formula, we can obtain λ:
λ = 0 . 0032 + 0 . 221 R e 0.237
According to the relationship between vp and friction velocity u*, u* can be calculated:
v p u * = 2 2 λ
The calculated u* can be substituted into the following formula to express the velocity u at the inlet of the pipeline:
u u * = 5.75 log y 2 + z 2 u * ν + 5.5
COMSOL provides a secondary development of various boundary conditions, such as the Dirchlet boundary condition and flux boundary condition. Here, the flux boundary condition was selected, and its definition form was:
n ( c u α u + r ) = g q u
where c, α, r, g, and u were self-defined coefficients. Finally, Equation (15) was arranged in the form of flux boundary conditions, and each coefficient was defined in the corresponding edit box.
The turbulence length scale LT and turbulence intensity IT were calculated by the following formulas, respectively.
k = 3 2 ( u I T ) 2
ε = C μ 3 4 k 3 2 L T
(3)
The boundary condition of the outlet was “pressure”. Its value was set as the measured value of the model test [24,25,26,27], as shown in Table 1. The backflow was inhibited.

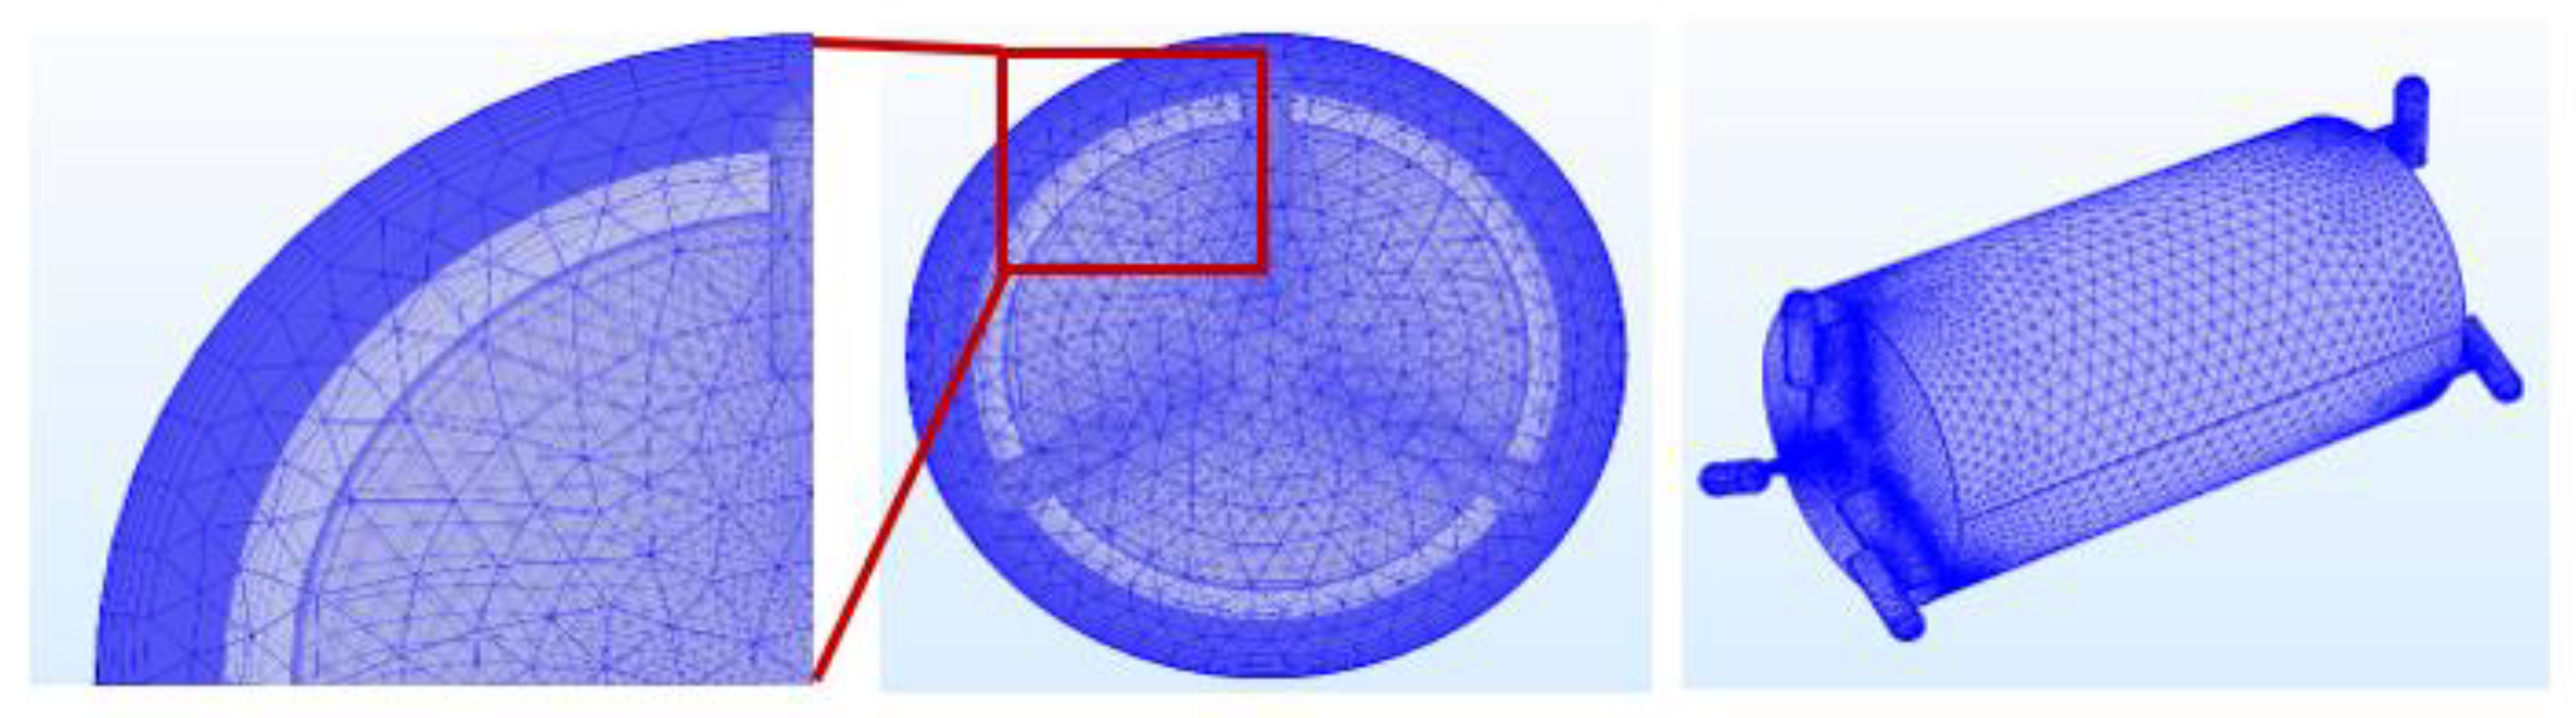
3.4. Grid Generation

In this paper, the ALE mesh adaptive method was used, which combined the characteristics of the Lagrangian mesh and Euler mesh. The mesh can be fixed in space and can also move with the material point in any direction.
Tetrahedron was mainly used for the mesh generation, as shown in Figure 7. The mesh of the whole model was refined. In order to reduce the amount of computation and simulation time, different sub domain densities were used. The grid size of each subdomain is shown in Table 2. The boundary layer of the model included the boundary layer between the fluid and the inner wall of the pipeline and the boundary layer between the fluid and the outer wall of the piped capsule. The number of boundary layers was set to 5, the thickness of the first layer was set to 0.0005 m, and the scale factor between layers was set to 1.2.
The transient analysis method was used to solve the pressure variables in the fluid equation in a time step. Then, the pressure was loaded on the boundary of the solution domain of the solid mechanics as a boundary load, and the deformation and displacement variables of the solid mechanics equation were obtained. The displacement was used to guide the deformation of the moving mesh, and the new mesh was used to calculate the fluid of the next time step. The determination of the time step was based on the calculation process. First, the initial time step was determined using the ratio of the smallest cell size in the fluid domain to the flow velocity. Then, the time step was adjusted step by step according to the three principles of the grid movement amplitude, convergence condition, and computational complexity; and finally, the optimal time step was determined. According to the above method, the best time step was 0.0003 s.

3.5. Design of Conditions

The diameter-to-length ratio of the piped capsule was an extremely important shape parameter. Five diameter-to-length ratios were selected, and their diameters were all 80 mm. The specific design parameters are shown in Table 3.

4. Verification of Simulation Results

In order to verify the rationality and accuracy of the established model, we compared and analyzed the numerical simulation results with the experimental results for the moving average speed, the axial velocity, and the shear stress along the cylinder wall, respectively.

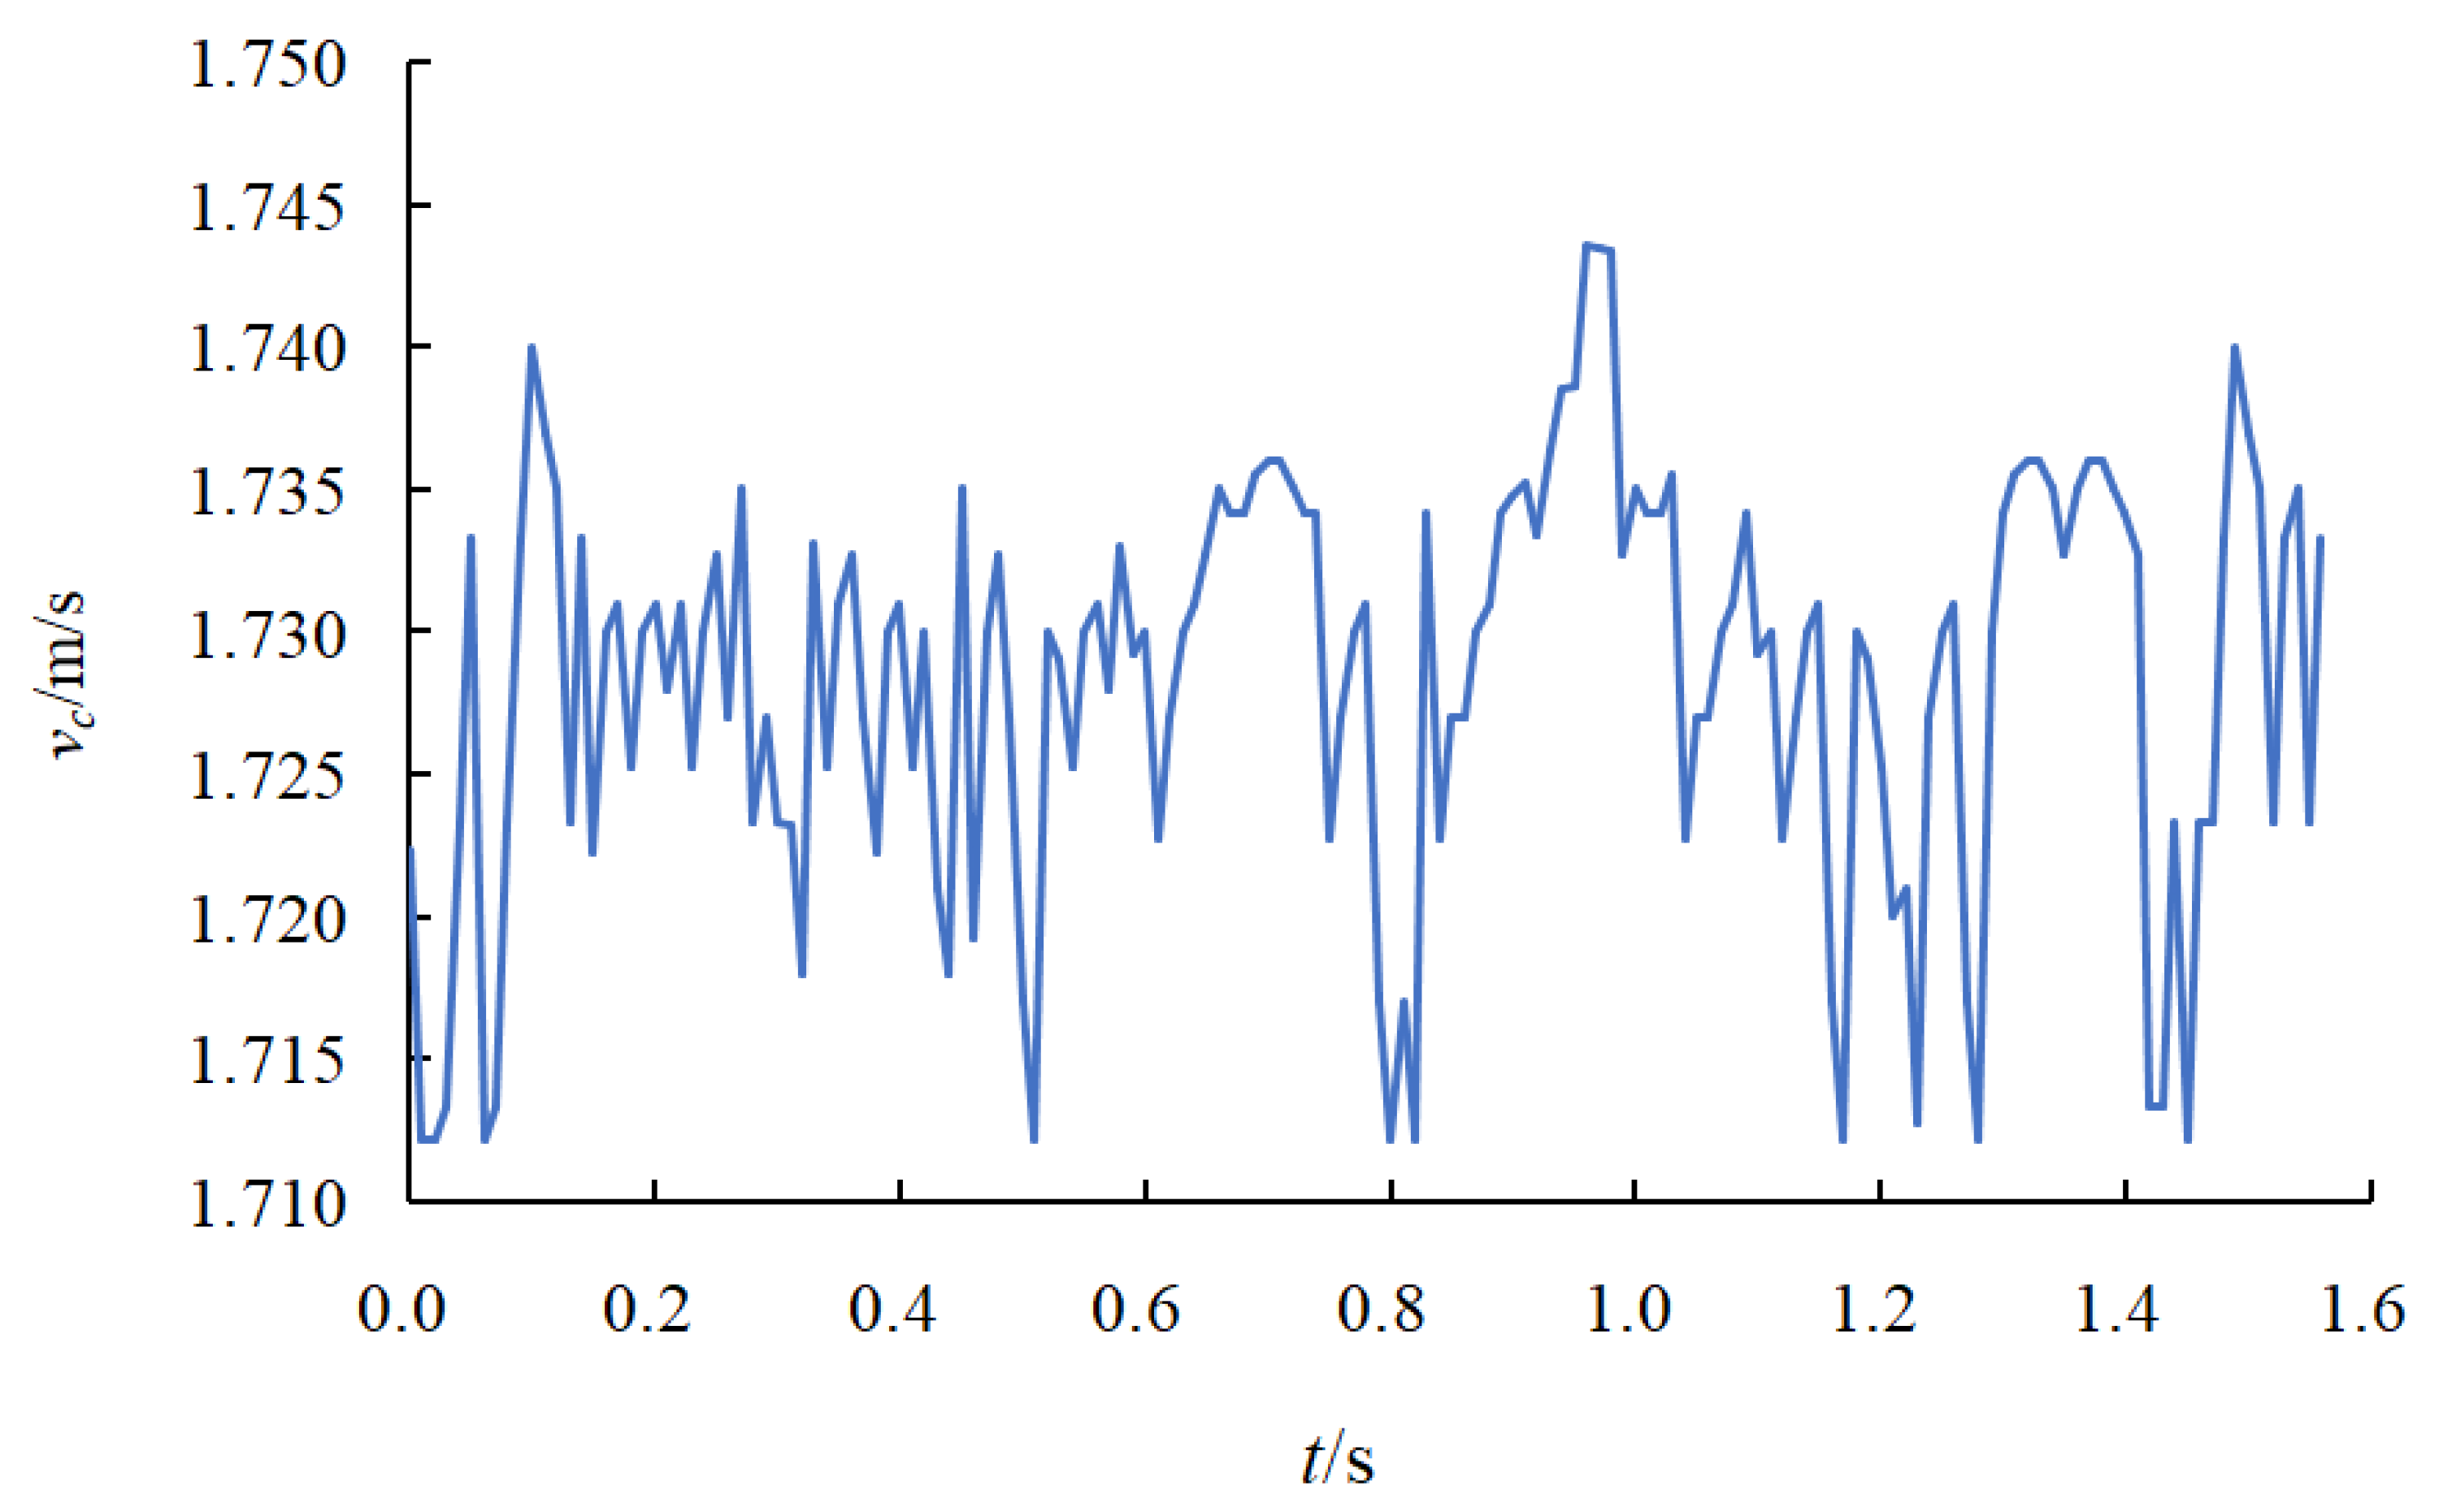
4.1. Transportation Speed of Piped Capsule

Figure 8 shows the comparison chart for the numerical simulation and test results of the average speed of the piped capsules with diameter-to-length ratios of 0.4 and 0.53 at 4 different Reynolds numbers. It can be seen that the results of both were basically consistent. When the Reynolds number was 105,366, the relative errors of the two models were 13.18% and 10.06%, respectively, while under other Reynolds numbers, the relative errors were less than 6.96%. When the Reynolds number was small, the test results were lower than the simulation results; while, when the Reynolds number was large, the test results were greater than the simulation results. Comparing the migration velocity of these two types of piped capsule, the transportation speed of the piped capsule with the diameter-to-length ratio of 0.4 was slightly higher than that of the piped capsule with the diameter-to-length ratio of 0.53 at the same Reynolds number. The transportation speed of the two types of piped capsule in the straight pipe section increased with the increase in the Reynolds number.

4.2. Axial Velocity

Figure 9 shows the comparison between the numerical simulation and the PIV experimental axial velocity along the cylinder wall under the same operating conditions after the flow field stabilized. The diameter-to-length ratio was 0.53, and the Reynolds number was 175,610. The top position of the annular gap was selected, and the distance δ from the cylinder wall was 2 mm, 4 mm, 6 mm, and 8 mm, respectively. The maximum relative error was 2.62%. It can be seen from the figure that the closer the position was to the cylinder wall, the greater the axial velocity. At the rear end of the piped capsule, when δ < 6 mm, the water flowed around the rear end into the annular gap, and the axial velocity increased suddenly. However, when δ > 6 mm, the flow around the rear end of the piped capsule had little effect on the axial velocity. At the front end of the piped capsule, when δ = 2 mm, the axial velocity of the water flow near the front end first increased and then decreased. When δ > 2 mm, the axial velocity of the water flow at this position first decreased and then increased.
Moreover, the farther away from the cylinder wall, the faster the increase in the axial velocity of the water flow at the front end of the piped capsule. This was mainly due to the influence of the feet at the front end of the piped capsule and the cylinder. The farther away from the cylinder wall, the easier it was for the water flow to bypass the capsule feet, so the greater the axial velocity at this position.

4.3. Wall Shear Stress

Figure 10 shows the simulated and experimental results of the wall shear stress along the cylinder when the piped capsule with the diameter-to length-ratio of 0.53 moved in the straight pipe section at Re = 175,610. Due to the limitation of the experimental conditions, the maximum relative error was 20.13%, the minimum relative error was 7.53%, and the average relative error was 11.02%. The chart shows that the simulation results well-supplemented the lack of experimental data near the front and rear end faces of the piped capsule, especially for the positions that could not be measured in the experiment, such as near the front and rear ends of the cylinder. From the simulation results, it can be seen that this position was the area with a large wall shear stress. Figure 10 also shows that the magnitude and distribution of the wall shear stress of θ = 0° and θ = 120° were similar, the maximum shear stress on the cylinder occurred near the front and rear sections, and the shear stress along the wall of the piped capsule was stable at other positions.

5. Results and Analysis

5.1. Flow Field Analysis

In the straight pipe section, when the piped capsule entered the stable migration state, the fluid velocity of the flow field changed very little, but the pressure was unsteady. Therefore, when analyzing the flow field of the piped capsule moving in the straight pipe section, the pressure changed at different times for the same piped capsule, and the velocity changed when the piped capsules with different diameter-to-length ratios were compared moving to the same position.

5.1.1. Pressure Analysis

Figure 11 shows the pressure distribution at 4 typical times when the ε was 0.53 and Re was 175,610. When t = 0.7 s, the pressure of the rear end face of the piped capsule was close to the upstream pressure, and when the water reached the rear end face, the water-passing section suddenly shrank. Due to the fluid inertia, the separation occurred on the surface of the piped capsule near the rear end face, and a large suction was generated on the surface of the piped capsule in this area [28,29]. Under the action of suction, the water flowed to the annular gap so that the pressure in the annular gap area gradually decreased. When the water flowed near the front end of the piped capsule, the cross-section of the water flow expanded, the pressure rose slightly, and the movement in the downstream area was close to a parallel flow. Then, under the action of the differential pressure of water flow at the front and rear ends of the piped capsule, the movement was accelerated. When t = 0.9 s, the pressure difference between the front and rear ends of the piped capsule decreased with the increase in the transportation speed of the piped capsule. When t = 1.1 s, it can be seen from the figure that when the piped capsule pushed the water forward, the pressure at the rear end area of the piped capsule was low. When the water flowed through the annular gap area, the space became smaller, and the pressure rose. After passing through the front end, the water flow was similar to the conventional pipe flow and the pressure gradually decreased, while the water near the front end was pushed forward by the piped capsule, so the pressure increased. When t = 1.2 s, the piped capsule started to decelerate again under the action of water viscosity and friction. Therefore, when the piped capsule moved in the straight pipeline under the interaction of the water flow, the pressure of the water flow near the piped capsule changed periodically.
It was precisely due to the non-constant changes in the water flow pressure in the pipeline that the instantaneous velocity of the piped capsule fluctuates within a certain range during the piped capsule movement in a straight pipeline section, and the fluctuation value of the velocity is not significant, as shown in Figure 12. This further confirmed that the pressure change of the piped capsule during the stable migration in a straight pipe section is not very drastic.

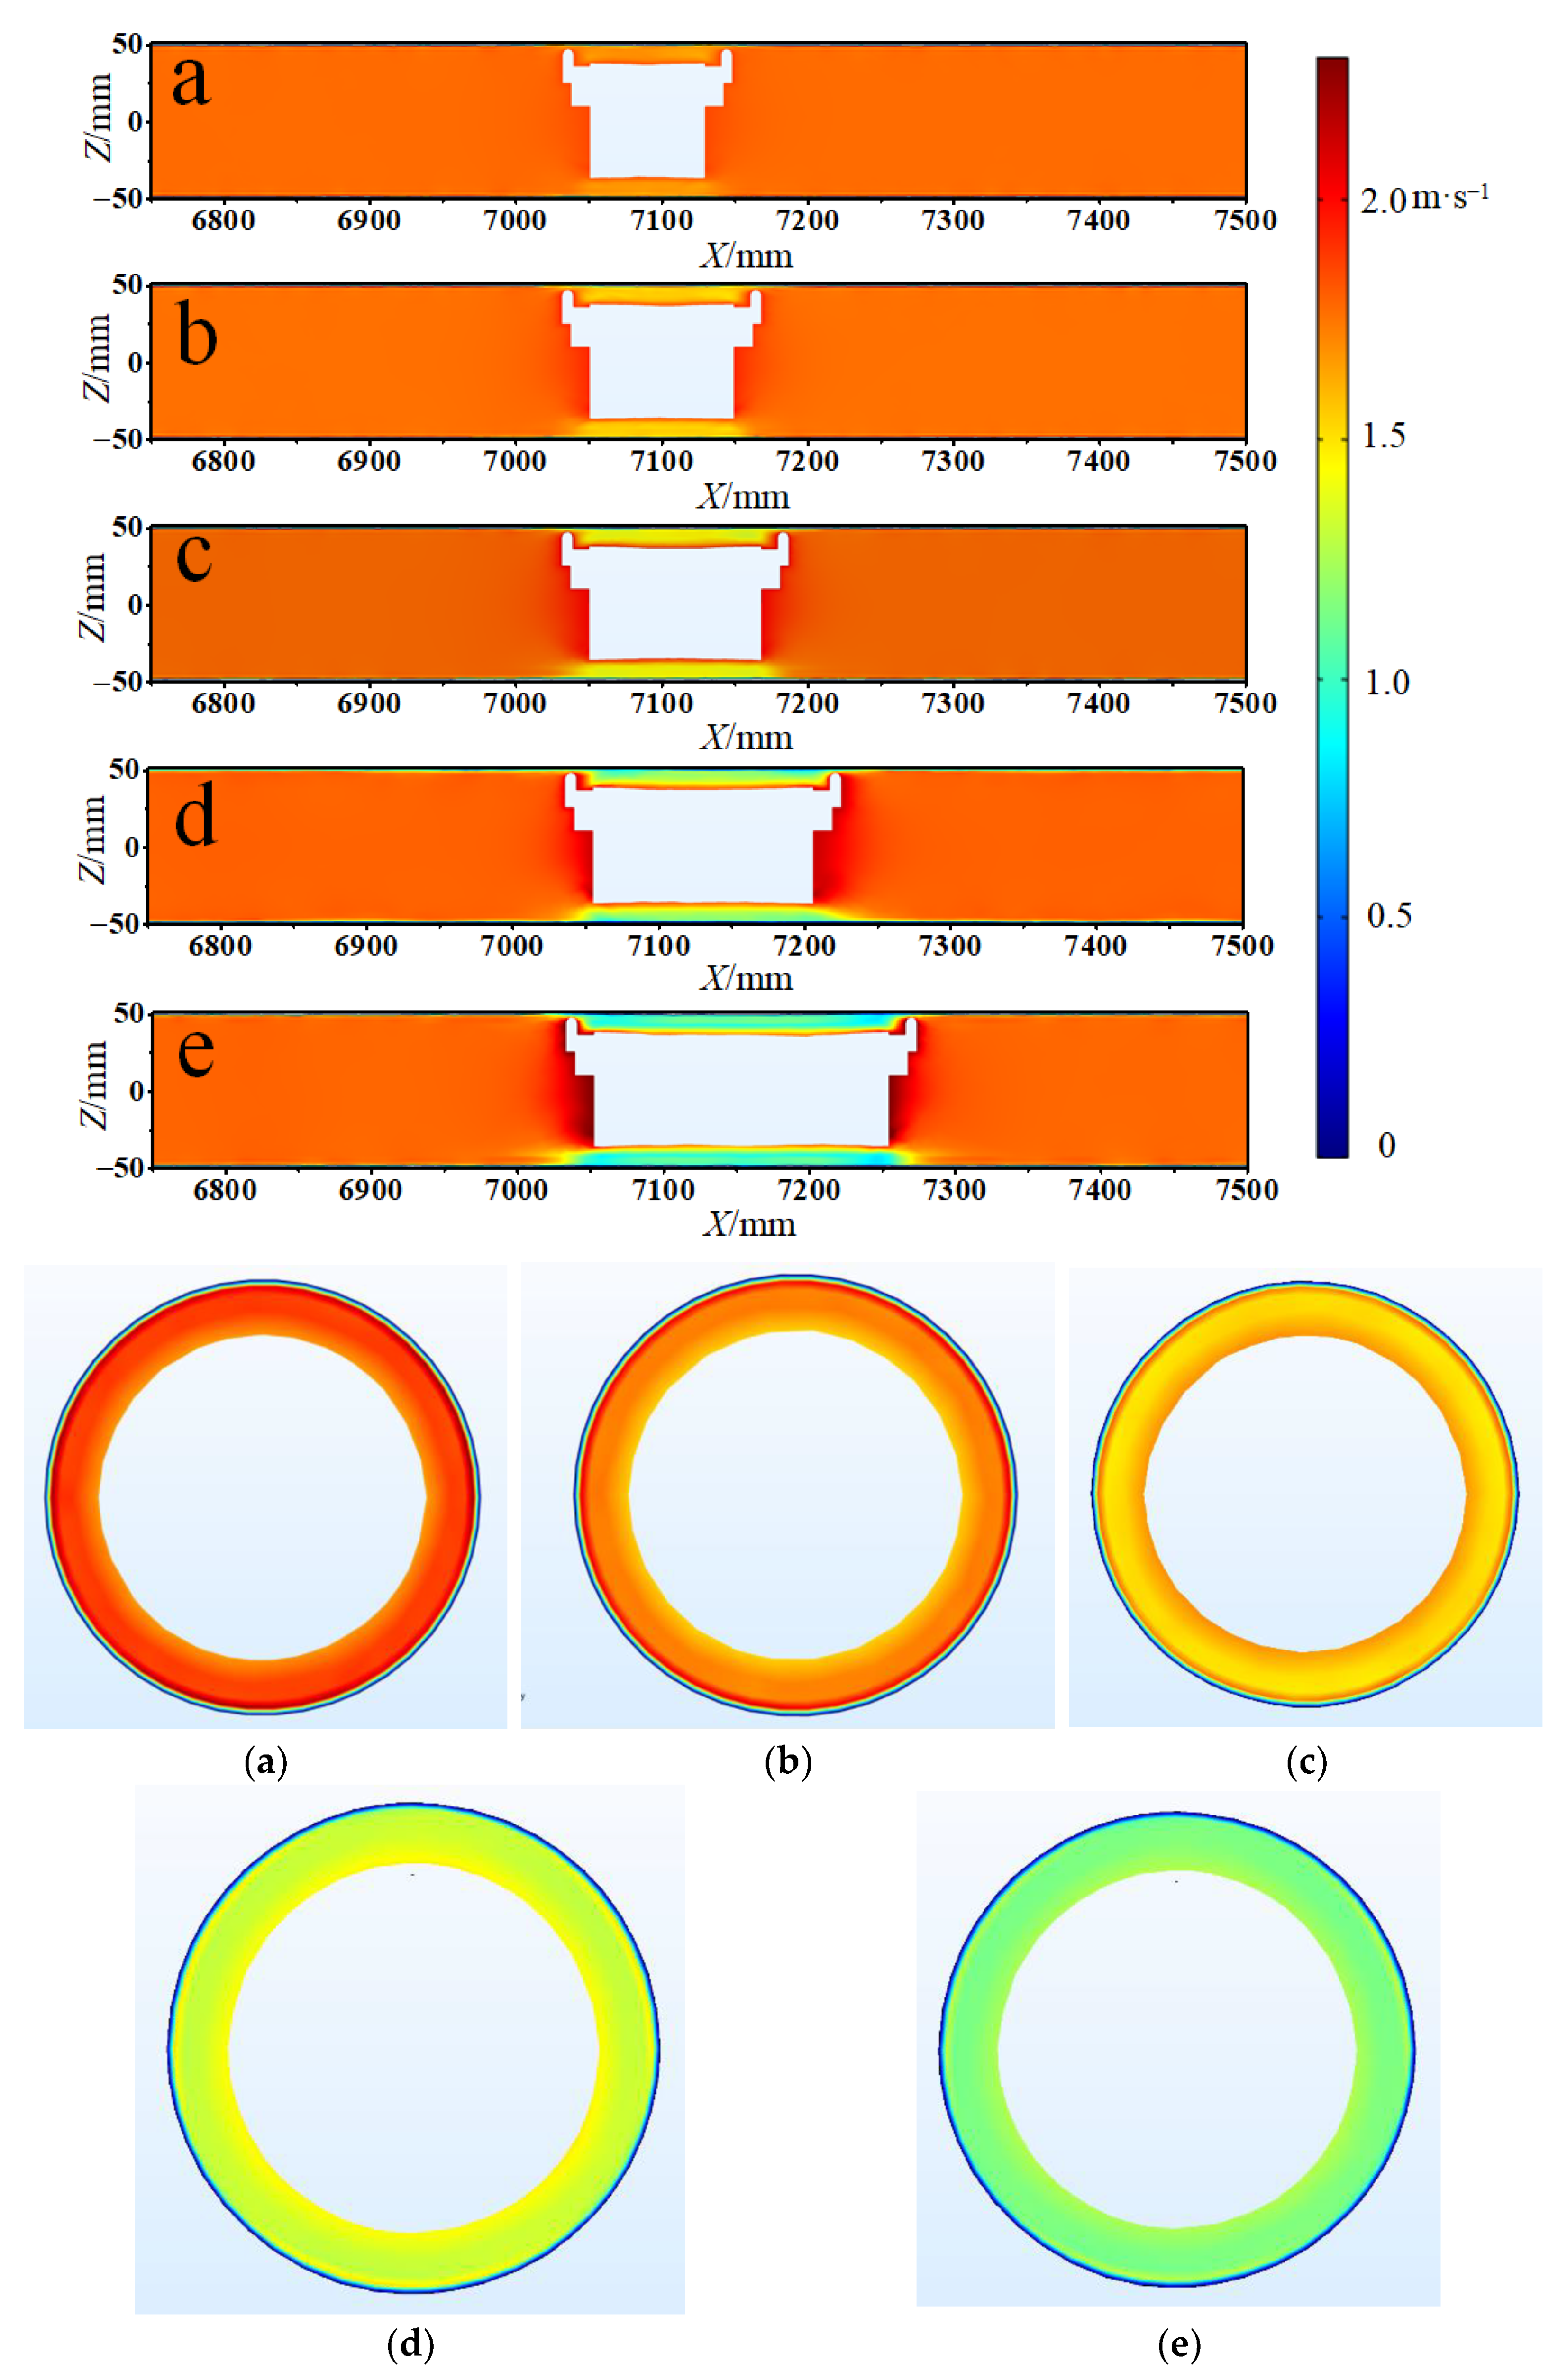
5.1.2. Analysis of Axial Velocity

Figure 13 shows the XZ plane and XY plane axial velocity distribution of piped capsules with different diameter-to-length ratios moving in the straight pipeline. It shows that the smaller the diameter-to-length ratio, the higher the flow velocity of the water in contact with the piped capsule. For the annular gap flow, the velocity of the flow closest to the outer wall of the piped capsule increased with the decrease in diameter-to-length ratio, whereas the velocity of the gap flow in other areas decreased with the decrease in diameter-to-length ratio. The main reason was that with the decrease in the diameter-to-length ratio of the piped capsule, the average transportation speed of the piped capsule increased—that is, the relative velocity of the water flow and the piped capsule increased. According to the conservation of mass, the average velocity of the annular gap flow decreased with the decrease in the diameter-to-length ratio. It can also be seen from Figure 13 that the axial velocity of the flow upstream and downstream of the pipeline was almost unchanged with the decrease in the diameter-to-length ratio of the piped capsule.
From the axial velocity distribution diagram in the XY plane, we can see that the annular gap flow had a low velocity area near the inner wall of the pipe. At the location near the wall of the capsule cylinder, the water flow velocity was slightly lower than the average velocity of the pipeline water flow. These two phenomena are consistent with the boundary layer theory.
Figure 14 shows the XZ plane and XY plane circumferential velocity distribution when the piped capsules with different diameter-to-length ratios moved in the straight pipe section. Larger circumferential velocity values mainly appeared in the lower area of the rear end face of the piped capsule and the area where the upper part of the front end face connected with the support foot of the piped capsule, and the circumferential velocity in the latter area was slightly greater than in the former. The minimum value of circumferential velocity appeared in the symmetrical region. It can also be seen from the figure that both the maximum and minimum values of the circumferential velocity gradually increased with the decrease in the diameter-to-length ratio. Its absolute value increased gradually. The results showed that the circumferential velocity of the flow near the piped capsule was greater than the average circumferential velocity of the flow in the pipeline, and the velocity difference between the two increased with the decrease in the diameter-to-length ratio of the piped capsule. With the decrease in the ratio of diameter-to-length, the circumferential velocity of upstream and downstream pipe flow was almost constant.
It can be seen from the circumferential velocity distribution map of the XY plane that the circumferential velocity was relatively high and positive near 330°, and the maximum negative value appeared near 30°. These two positions were symmetrical around the top support foot of the capsule, and it was precisely due to the blocking effect of the support foot on the water flow that the flow around the area near the support foot occurred, thereby affecting the circumferential velocity near the support foot.

5.1.3. Analysis of Radial Velocity

Figure 15 shows the XZ plane and XY plane radial velocity distribution of the piped capsules with different diameter-to-length ratios moving in the straight pipeline. According to the figure, the radial velocity of the pipe flow was very low, and its range was −0.081~0.066 m/s. Similar to the axial and circumferential velocity, the radial velocity of the flow around the piped capsule was greater than that in other areas and increased with the decrease in the diameter-to-length ratio. The radial velocity of the upstream and downstream flow of the piped capsule was little influenced by the decrease in the diameter-to-length ratio of the piped capsule. The figure also shows that the change in the radial velocity near the inner wall of the pipe and the outer wall of the piped capsule was larger than that in the central area of the pipe flow, which indicates that the turbulence intensity of the flow in these areas was greater.
It can be seen from the radial velocity distribution diagram on the XY plane that the radial velocity of the piped capsules with different diameter-to-length ratios had basically the same change law. The radial velocity had a large, positive value on both sides of the 0° position and around the 150° and 210° positions. The 0° position was the position of the support foot, and the 150° and 210° positions were located between the lower 2 support feet. Therefore, the water flowed from the inner circle to the outer circle along the radius direction of the pipeline, and the flow velocity showed a gradually increasing distribution pattern from the inner circle to the outer circle.

5.2. Analysis of Wall Shear Stress

Figure 16 shows the distribution of the wall shear stress. The range of the wall shear stress of the piped capsule cylinder was 0~400 Pa, and the area with the high wall shear stress was mainly concentrated on the front and rear ends of the cylinder and the plugs, especially in the rear area of the piped capsule feet. It can be seen from the previous analysis that when the piped capsule moved in the straight pipe section with the decrease in the diameter-to-length ratio, the average velocity of the annular gap water flow decreased, as shown in Figure 13. Therefore, with the decrease in the ratio of diameter-to-length, the shear stress on the cylinder wall also decreased. It also showed that the wall shear stress on the surface of the thin-walled quadrangular prism connecting the cylinder was greater. This was mainly affected by the cylinder-like flow, which can be seen as the flow around the cylinder perpendicular to the direction of the incoming flow. The vortex region was formed behind the cylinder-like flow. Combined with the influence of the front and rear ends of the piped capsule, a complex flow region was formed at this position.

5.3. Energy Consumption Characteristics

As a new type of transportation mode, piped capsule hydraulic transportation should not only consider the safety of operation, but also pay attention to its economy. The energy consumption of the piped capsule moving in the straight pipe section included two parts: the energy consumption of water flowing along the straight pipe section and the increased energy consumption due to the existence of the piped capsule. Because the energy consumption of water flowing along the straight pipe section was equal under the same working conditions, only the increased energy consumption of the piped capsule was discussed here.
When the piped capsule ran in the straight pipe section, the increased energy consumption can be expressed as:
E m o v e = Q m × h m o v e
where Qm is the water flow rate in the pipeline, m3/h; hmove is the energy consumption of the piped capsule moving in the straight pipe section, which was composed of two parts: the friction loss between the pipeline water flow, and the piped capsule and the friction loss between the piped capsule feet and the inner wall of the pipeline, m.
h m o v e = ζ m o v e 1 ( v p k 2 v c ) 2 2 g + ζ m o v e 2 ( v c v p ) 2 2 g
where vp is the average velocity of the pipeline water flow, m/s; vc is the transportation speed of the piped capsule, m/s; and ζmove1 and ζmove2 are the resistance coefficients of the piped capsule moving in the straight pipe section, which can be expressed by the following formula:
ζ m o v e 1 = k λ p ε ( 1 k 2 ) 3
ζ m o v e 2 = ( ψ 1 ) 2 + ε k 2 λ c ( 1 k 2 ) 3
where ε is the diameter-to-length ratio of the piped capsule, ε = Dc/Lc; ψ is the contraction ratio of water flowing into the pipe section where the piped capsule was located, ψ = A/(AAc) = 1/(1 − k2); and k is the ratio of the diameter of the piped capsule to the inner diameter of the pipeline, k = Dc/Dp. λp and λc are the friction coefficients of the inner wall of the pipeline and the wall of the piped capsule, respectively, and both are related to the characteristic length—that is, the hydraulic radius. λp is a function of the Rep related to the inner wall of the pipe, and λc is a function of the Rec related to the gap flow on the cylinder wall. Rep and Rec are calculated according to Equations (23) and (24), respectively.
Re p = ( 1 k ) D p ν v a
Re c = D p ( 1 k ) ν ( v c v a )
By substituting Rep and Rec into Equation (25) or looking for the moody diagram, the friction coefficients λp and λc of the wall can be calculated.
1 λ = 1 . 14 2 lg ( Δ d + 21.25 Re 0.9 )
Table 4 lists the energy consumption values of the piped capsules with different diameter-to-length ratios when the Reynolds number was 175,610. It can be seen that under this Reynolds number condition, the energy consumption of the piped capsule with the diameter-to-length ratio of 0.4 was the lowest.
However, in the process of transportation, not only the total energy consumption, but also the “quantity” of materials should be considered, due to the wide range of materials transported by piped capsule—including solid, liquid, and gas. Therefore, the volume Vc of the cylinder was used to express the transportation volume, so the energy consumption per unit volume of material could be expressed as:
Δ E m o v e = E m o v e / V c
The volume Vc of the cylinder can be expressed by the following formula. Here, the wall thickness of the cylinder and the volume occupied by the front and rear sealing covers of the piped capsule were ignored.
V c = π 4 D c 2 × L c
Figure 17 shows the energy consumption per unit volume of the piped capsules with different diameter-to-length ratios moving in the straight pipe section when the Reynolds number was 175,610. It can be seen that the energy consumption per unit volume of the piped capsule with the diameter-to-length ratio of 0.4 was the lowest, and the energy consumption per unit volume of the capsule with the diameter-to-length ratio of 1.0 was the highest.
In the process of transporting materials, the transportation cost should not only minimize the energy consumption per unit volume, but also consider the transportation efficiency—that is, the time cost. To lower the time cost, the larger the transportation volume, the better. Therefore, the conveying efficiency was expressed by the conveying volume of the cylinder. The larger the conveying volume of the cylinder, the higher the hydraulic conveying efficiency of the piped capsule. Thus, the optimal piped capsule type can be obtained by calculating maxW.
max W = max ( V c × 1 Δ E )
It can be seen from Table 5 that under the research conditions, the diameter-to-length ratio of the piped capsule was 0.4—that is, the piped capsule with Dc × Lc = 80 mm × 200 mm was the superior model under this study.

6. Conclusions

In this paper, numerical simulation and experimental verification were used to analyze the fluid structure interaction between the fluid domain and the solid domain of a piped capsule when it moved in a straight pipe section, and its dynamic characteristics and energy consumption characteristics were analyzed. The main conclusions were as follows:
(1)
The simulated values of the average transportation speed, axial velocity, and wall shear stress along the cylinder wall were basically consistent with the experimental values, and the maximum relative errors were 13.18%, 2.62%, and 20.13%, respectively.
(2)
Flow field characteristics: When the piped capsule moved in the straight pipe section, the pressure of the water flow near the piped capsule changed periodically. The results showed that the average axial velocity of annular crevice flow was less than that of the pipeline flow; the decrease in the diameter-to-length ratio of the piped capsule caused the axial velocity of water flow around the piped capsule to decrease gradually, while the circumferential velocity and radial velocity increased gradually.
(3)
Mechanical characteristics: The shear stress on the cylinder wall was mainly concentrated on the front and rear ends of the cylinder wall, especially in the rear area of the capsule foot. With the decrease in the diameter-to-length ratio of the cylinder, the shear stress also decreased.
(4)
By analyzing the energy consumption of the piped capsule moving in the straight pipe section, it was concluded that the superior diameter-to-length ratio was 0.4 in this study.
(5)
The current research only focused on the dynamic characteristics of the capsule during stable transport in a straight pipe section; therefore, the acceleration process and the dynamic characteristics of the climbing and curved sections need to be studied.

Author Contributions

Data curation, X.Y.; formal analysis, X.Y.; funding acquisition, J.M.; investigation, Y.L. (Yongye Li); resources, J.M.; supervision, Y.L. (Yonggang Li); writing—original draft, X.Y.; writing—review and editing, Y.L. (Yongye Li). All authors have read and agreed to the published version of the manuscript.

Funding

The research was funded by the National Natural Science Foundation of China (51109155) and Shanxi Provincial Youth Science Fund (20210302124454).

Data Availability Statement

The data supporting the conclusions of this study can be requested from the corresponding author.

Acknowledgments

This research was supported by the Collaborative Innovation Center of New Technology of Water-Saving and Secure and Efficient Operation of Long-Distance Water Transfer Project at the Taiyuan University of Technology.

Conflicts of Interest

The authors declare no conflict of interest.

References

  1. Sun, X.H.; Li, Y.Y.; Yan, Q.F. Experimental study on starting conditions of the hydraulic transportation on the piped carriage. In Proceedings of the 20th National Conference on Hydrodynamics, Taiyuan, China, 23–25 August 2007; pp. 425–431. [Google Scholar]
  2. Liu, H.; Richards, J.L. Hydraulics of stationary capsule in pipe. J. Hydraul. Eng. 1994, 120, 22–40. [Google Scholar] [CrossRef]
  3. Kroonenberg, H.H. Mathematical model for concentric horizontal capsule transport. Can. J. Chem. Eng. 1962, 56, 538–543. [Google Scholar] [CrossRef] [Green Version]
  4. Dong, X.L. Pilot Experimental Research on the Hydraulic Characteristics of TRM Transportation in Hydraulic Pipe. Master’s Thesis, Taiyuan University of Technology, Taiyuan, China, 2007. [Google Scholar]
  5. Li, Y.Y.; Sun, X.H. Hydraulic characteristics of transportation of different piped carriages in pipe. J. Drain. Irrig. Mach. Eng. 2010, 28, 174–178. [Google Scholar]
  6. Charles, M.E. The pipeline flow of capsules: Part 2: Theoretical analysis of the concentric flow of cylindrical forms. Can. J. Chem. Eng. 1963, 41, 46–51. [Google Scholar]
  7. Tomita, Y.; Yamamoto, M.; Funatsu, K. Motion of a single capsule in a hydraulic pipeline. J. Fluid Mech. 1986, 171, 495–508. [Google Scholar] [CrossRef]
  8. Quadrio, M.; Luchini, P. Direct numerical simulation of the turbulent flow in a pipe with annular cross section. Eur. J. Mech. 2002, 21, 413–427. [Google Scholar] [CrossRef]
  9. Latto, B.; Chow, K.W. Hydrodynamic transport of cylindrical capsules in a vertical pipeline. Can. J. Chem. Eng. 1982, 60, 713–722. [Google Scholar] [CrossRef]
  10. Asim, T.; Mishra, R.; Nearchou, A.; Ubbi, K. Effect of the length and diameter of a cylindrical capsule on the pressure drop in a horizontal pipeline. J. Phys. Conf. Ser. 2012, 1, 364. [Google Scholar] [CrossRef] [Green Version]
  11. Asim, T.; Mishra, R. Computational fluid dynamics based optimal design of hydraulic capsule pipelines transporting cylindrical capsules. Powder Technol. 2016, 295, 180–201. [Google Scholar] [CrossRef] [Green Version]
  12. Asim, T.; Algadi, A.; Mishra, R. Effect of capsule shape on hydrodynamic characteristics and optimal design of hydraulic capsule pipelines. J. Petrol. Sci. Eng. 2017, 161, 390–408. [Google Scholar] [CrossRef]
  13. Yang, X.N.; Li, Y.Y.; Sun, X.H. Analysis on hydraulic characteristics of hydrocyclone in horizontal straight pipeline under operation. J. Hydroelectr. Eng. 2015, 34, 98–102. [Google Scholar]
  14. Zhang, X.L.; Sun, X.H.; Li, Y.Y.; Xi, X.N.; Guo, F.; Zheng, L.J. Numerical investigation of the concentric annulus flow around a cylindrical body with contrasted effecting factors. J. Hydrodyn. 2015, 27, 273–285. [Google Scholar] [CrossRef]
  15. Yang, X.N.; Ma, J.J.; Li, Y.Y.; Sun, X.H.; Jia, X.M.; Li, Y.G. Wall stresses in cylinder of stationary piped carriage using COMSOL Multiphysics. Water 2019, 11, 1910. [Google Scholar] [CrossRef] [Green Version]
  16. Lu, Y.F.; Li, Y.Y.; Zhao, Y.M.; Song, X.T.; Qiang, Y.P.; Yuan, Y.; Cheng, R. Analysis of downstream flow field characteristics of cross-cylinder structure in horizontal pressurized straight pipeline. J. Drain. Irrig. Mach. Eng. 2023, 41, 44–49. [Google Scholar]
  17. Li, Y.Y.; Zhao, Y.M.; Song, X.T. Diagnostic analysis of moving—boundary annular gap flow by Proper Orthogonal Decomposition. J. Hydraul. Eng. 2022, 53, 1490–1499. [Google Scholar]
  18. Sundstrom, L.R.J.; Cervantes, M.J. Characteristics of the wall shear stress in pulsating wall-bounded turbulent flows. Exp. Therm. Fluid Sci. 2018, 96, 257–265. [Google Scholar] [CrossRef]
  19. Marusic, I.; Mckeon, B.J.; Monkewitz, P.A.; Nagib, H.M.; Smits, A.J.; Sreenivasan, K.R. Wall-bounded turbulent flows at high Reynolds numbers: Recent advances and key issues. Phys. Fluids 2010, 22, 065103. [Google Scholar] [CrossRef]
  20. Zheng, D.S.; Jiang, Y.Z. Determination of optimum location of a right-angle strain flower using optimization. J. Vib. Meas. Diagn. 1997, 17, 53–56. [Google Scholar]
  21. Fan, F.; Liang, B.C.; Li, Y.R.; Bai, Y.C.; Zhu, Y.J.; Zhu, Z.X. Numerical investigation of the influence of water jumping on the local scour beneath a pipeline under steady flow. Water 2017, 9, 642. [Google Scholar] [CrossRef] [Green Version]
  22. Yao, R.T.; Guo, D.P. Computational Fluid Dynamics Foundation and STAR-CD Engineering Application; National Defense Industry Press: Beijing, China, 2015. [Google Scholar]
  23. Turek, S.; Hron, J. Proposal for Numerical Benchmarking of Fluid–Structure Interaction between an Elastic Object and Laminar Incompressible Flow. In Fluid–Structure Interaction; Springer: Berlin/Heidelberg, Germany, 2006; pp. 371–385. [Google Scholar]
  24. Li, Y.Y.; Zhang, Q.W.; Song, X.T.; Lu, Y.F.; Yang, X.N.; Sun, X.H.; Zhang, X.L.; Pang, Y.Q. Influence of guide vane length on the velocity characteristics of spiral flow in cross-sections between capsules. Trans. Chin. Soc. Agric. Eng. 2021, 37, 48–56. [Google Scholar]
  25. Damiri, H.S.; Bardaweel, H.K. Numerical design and optimization of hydraulic resistance and wall shear stress inside pressure-driven microfluidic networks. Lab Chip. 2015, 15, 4187–4196. [Google Scholar] [CrossRef]
  26. Thim, T.; Hagensen, M.K.; Falk, E.; Hørlyck, A.; Kim, W.Y.; Niemann, A.K.; Bøtker, H.E. Wall shear stress and local plaque development in stenosed carotid arteries of hypercholesterolemic minipigs. J. Cardiovasc. Dis. Res. 2012, 3, 76–83. [Google Scholar] [CrossRef] [Green Version]
  27. Santos, D.S.; Faia, P.M.; Garcia, F.A.P.; Rasteiro, M.G. Oil/water stratified flow in a horizontal pipe: Simulated and experimental studies using EIT. J. Petrol. Sci. Eng. 2019, 174, 1179–1193. [Google Scholar] [CrossRef]
  28. Zhao, K. Study on Mechanism for Coal Log Pipeline Transportation. Master’s Thesis, Taiyuan University of Technology, Taiyuan, China, 2003. [Google Scholar]
  29. Li, W.J. Study on the Compaction of Coal Logs and the Mechanism of Their Transportation in Hydraulic Pipeline. Ph.D. Thesis, Zhejiang University, Hangzhou, China, 2016. [Google Scholar]
Figure 1. Piped carriage structure. Note: 1—cylinder; 2—sealing cap; 3—capsule foot.
Water 15 02306 g001
Figure 2. Layout sketch of experiment facilities.
Water 15 02306 g002
Figure 3. Pressure and speed testing device. 1—Dynamic pressure acquisition instrument; 2—pressure sensor; 3—infrared probes; 4—digital timer.
Water 15 02306 g003
Figure 4. Velocity field and stress measurement device. (a) PIV; (b) piped capsule force measuring system.
Water 15 02306 g004
Figure 5. Layout of stress measurement points. (a) Cross section distribution; (b) test points on each test section.
Water 15 02306 g005
Figure 6. Geometric model of piped capsule and straight pipe section. (a) Geometric model of piped capsule; (b) geometric model of straight pipe.
Water 15 02306 g006aWater 15 02306 g006b
Figure 7. Grid division of each subdomain.
Water 15 02306 g007
Figure 8. Comparison between simulation results and experimental results of the average velocity of the piped capsule.
Water 15 02306 g008
Figure 9. Comparison between the simulation results and the experimental results of the axial velocity along the cylinder wall.
Water 15 02306 g009
Figure 10. Comparison between simulation results and experimental results of the wall shear stress along the cylinder wall.
Water 15 02306 g010
Figure 11. Pressure distribution in XZ plane at different times. (a) t = 0.7 s, (b) t = 0. 9 s, (c) t = 1.1 s, (d) t = 1.2 s.
Water 15 02306 g011
Figure 12. The instantaneous velocity curve of the piped capsule (ε = 0.67, Re =175,610).
Water 15 02306 g012
Figure 13. Axial velocity distribution. (a) ε = 1.0, (b) ε = 0.8, (c) ε = 0.67, (d) ε = 0.53, (e) ε = 0.4.
Water 15 02306 g013
Figure 14. Circumferential velocity distribution. (a) ε = 1.0, (b) ε = 0.8, (c) ε = 0.67, (d) ε = 0.53, (e) ε = 0.4.
Water 15 02306 g014aWater 15 02306 g014b
Figure 15. Radial velocity distribution. (a) ε = 1.0, (b) ε = 0.8, (c) ε = 0.67, (d) ε = 0.53, (e) ε = 0.4.
Water 15 02306 g015
Figure 16. Wall shear stress distribution. (a) ε = 1.0, (b) ε = 0.8, (c) ε = 0.67, (d) ε = 0.53, (e) ε = 0.4.
Water 15 02306 g016
Figure 17. Energy consumption per unit volume of the piped capsules with different diameter-to-length ratios (Re = 175,610).
Water 15 02306 g017
Table 1. Outlet section pressure under different experimental conditions.
Re105,366140,488175,610210,731
P/Pa54006500970011,200
Table 2. Grid size of each subdomain (mm).
Grid SizeFluid DomainSolid Domain
CylinderSupport Body and Foot
Maximum unit size5.8311.85.83
Minimum unit size0.638.60.63
Maximum unit growth rate1.11.41.1
Curvature factor0.40.40.4
Narrow area resolution0.90.70.9
Table 3. Design parameters of the operation condition.
Design ParametersValue
Re105,366/140,488/175,610/210,731
vp (m·s−1)1.06/1.41/1.77/2.12
ε1.0, 0.8, 0.67, 0.53, 0.4
E (Pa)11.2 × 10⁹
νs0.49
G (kg)0.5
Note: Re is the Reynolds number of the pipe flow; E is the Young’s modulus of the organic glass; νs is the Poisson’s ratio of the organic glass; and G is the load of the piped capsule.
Table 4. Energy consumption of the moving piped capsule in the straight pipe section with the Reynolds number Re = 175,610.
εRecRepλcλpζmove1ζmove2hmove (m)Emove (w)
1.045,87957590.02130.03630.623.450.1226.10
0.838,70710,3490.02220.03070.663.540.0904.50
0.6732,08714,5860.02310.02810.723.640.0653.25
0.5323,81219,8820.02480.02600.833.800.0422.10
0.420,50222,0010.02580.02531.094.040.0371.85
Table 5. The values of different piped capsules.
ε1.00.80.670.530.4
W (×10−8)2.655.6111.127.3154.20
Disclaimer/Publisher’s Note: The statements, opinions and data contained in all publications are solely those of the individual author(s) and contributor(s) and not of MDPI and/or the editor(s). MDPI and/or the editor(s) disclaim responsibility for any injury to people or property resulting from any ideas, methods, instructions or products referred to in the content.

