Article

Improved Delivery of Nanoscale Zero-Valent Iron Particles and Simplified Design Tools for Effective Aquifer Nanoremediation

Department of Environment, Land and Infrastructure Engineering (DIATI), Politecnico di Torino, Corso Duca degli Abruzzi 24, 10129 Torino, Italy
*
Author to whom correspondence should be addressed.
Water 2023, 15(12), 2303; https://doi.org/10.3390/w15122303
Submission received: 7 May 2023 / Revised: 8 June 2023 / Accepted: 15 June 2023 / Published: 20 June 2023
(This article belongs to the Special Issue Coupled Flow and Reactive Transport Processes in Subsoil)

Abstract

:
The subsurface injection of nanoscale zero-valent iron particles (nZVI) for the in situ reductive remediation of contaminated aquifers has grown over the last 25 years. However, several efforts are still being made to improve the stability and delivery of nZVI and to simplify the procedure for site-specific injection design. In this study, the injectability and mobility of a commercial nZVI-based reactive gel was tested in a radial geometry laboratory setup. The gel proved to be highly mobile in sandy porous media, allowing for the achievement of a radius of influence (ROI) of 0.7 m with a homogeneous nZVI distribution within the domain. The experimental results therefore confirmed that nZVI permeation injection with a good radius of influence is possible in conductive formations. The software MNMs 2023 (Micro- and Nanoparticle transport, filtration, and clogging Model-Suite) was then applied to model the radial transport experiment and extrapolate results with the aim of developing a new graphical tool for simple and effective nZVI permeation injection design. For this purpose, 1800 numerical simulations were performed to build two multiparametric maps to predict the expected ROI in two typical aquifer lithologies and over a wide range of operating conditions.

1. Introduction

Soil and groundwater remediation have been shifting from ex situ to in situ techniques to reduce remediation cost and time, energy demand, and environmental impacts [1,2]. Among in situ techniques, the subsurface injection of reactive micro- or nanoparticles—so-called nanoremediation—is becoming a mature technology for the treatment of contaminated aquifer systems. Indeed, these particles can be delivered directly close to the hotspots of contamination to induce the fast degradation or in situ sequestration of pollutants [3,4,5]. Among the reagents and catalysts developed for nanoremediation, nanoscale (nZVI) zero-valent iron is by far the most studied [6,7,8,9]. Thanks to its extremely high specific surface area and its strong reducing power, nZVI exhibits a very high reactivity toward a wide range of persistent organic pollutants, such as chlorinated solvents, pesticides, heavy metals, and metalloids [10,11,12,13,14]. Both laboratory and field tests have, however, demonstrated that there are still some obstacles to address in order for nZVI technology to reach its full potential. These include, for example, the low electron efficiency of nZVI [15,16] and rapid particle agglomeration and sedimentation [17,18]. Sulfidation [10,19,20] and, more recently, nitridation [21,22] have been recognized as promising surface modification approaches to enhance both the electron selectivity and colloidal stability of nZVI particles.
Furthermore, the successful implementation of nZVI-based nanoremediation is strictly related to the effective delivery and distribution of the iron within the contaminated aquifer. For this reason, nanoparticles are typically injected into the subsurface as concentrated slurries either via high-pressure injection using direct push equipment (controlled fracturing approach) or via low-pressure injection through a screened well (permeation approach) [23]. When technically feasible, a permeation injection should be preferred because this allows for a more homogeneous particle distribution within the aquifer thanks to the establishment of a radial or radial-like flow around the well.
From a practical point of view, optimal delivery by permeation should aim to maximize the radius of influence (ROI) of the injection and, at the same time, minimize the injection pressure to avoid the undesired fracturing of the geological formation [24]. Moreover, particle accumulation around the injection well that can lead to porous-medium clogging must be mitigated to prevent additional pressure build-up [25,26]. These goals are achieved by optimizing the particle suspension properties and the injection operating conditions to the case-specific hydrodynamic behavior of the aquifer system.
To improve particle delivery and maximize the injection ROI, nZVI suspensions are commonly stabilized by the addition of green polymers, such as carboxymethylcellulose [27,28,29], guar gum [30,31] or starch [32]. When dosed at a few g/L, these polymers create a stabilizing coating on the particle surface and increase the slurry viscosity. In this way, the polymer prevents particle aggregation and/or sedimentation processes that hinder their injection and migration through the porous medium. On the other hand, such slurries are also characterized by a shear-thinning rheological behavior. This implies that their viscosity sharply decreases in dynamic conditions, thus containing the pressure build-up during the injection through a permeation approach [33].
The optimal design of a nanoremediation intervention requires detailed knowledge of the particle properties (size, density, surface charge etc.), of the carrier-fluid rheology, of the aquifer hydrodynamic properties (grain size distribution, permeability, porosity) and of their influence on the overall particle delivery. This is usually achieved by testing particle mobility in laboratory experiments at different scales and then extrapolating results for field-scale predictions. Pore-scale transport experiments supported by X-ray microcomputed tomography have been, for example, performed to characterize how the micro-scale processes, such as physical straining and porous-medium clogging, affect particle mobility at larger scales [34,35]. Bench-scale 1D column experiments are instead often performed to study the influence of particle surface modifications and hydro-chemical and operating conditions, such as ionic strength, flow velocity and stabilizer additions, on nZVI mobility [25,36]. Finally, 2D/3D geometry experiments can be useful to reproduce field-like conditions and evaluate the influence of macroscale elements that cannot be observed at smaller scales, such as complex flow fields with variable velocity over space, groundwater background flow, aquifer heterogeneity or buoyancy contribution to transport [37,38,39,40,41,42].
However, the information provided by transport experiments are very case-specific, and a time-consuming design optimization process must be applied to identify the most effective operating conditions, i.e., tuning operational parameters such as stabilizer properties, ZVI concentration, and injection flow rate. This study is aimed at filling this gap, presenting a hybrid experimental–modelling approach to support the design of field-scale nZVI injections. As a first step, an injection experiment was performed in a radial transport setup to characterize the transport of a commercial nZVI-based reactive gel. The experiment was then interpreted using the MNMs 2023 software (Micro- and Nanoparticle transport, filtration, and clogging Model-Suite, r. 4.011) [42,43,44] to derive the kinetic parameters governing the injection and transport of nZVI particles in sandy porous media. The kinetic parameters were then used for a parametric sweeping analysis with the aim of investigating the variation of the injection ROI with operating conditions (i.e., stabilizer concentration and injection flow rate) and aquifer hydrodynamic properties (i.e., hydraulic conductivity, porosity, and density). These results were used to derive multiparametric diagrams to support practitioners in the design of particle suspensions and of their injection in site-specific conditions.
The paper is structured as follows. Section 1 introduces the topic and framework of the study. Section 2 describes the experimental setup of nZVI transport experiments, the colloid transport modelling approach implemented in MNMs and the parametric sweeping analysis performed to build the multiparametric graphs for injection design. Section 3 presents the results of the rheological characterization of nZVI slurries, of the transport experiment and its interpretation with MNMs, and the multiparametric graphs, along with an example of their application in a typical context. Conclusions are presented in Section 4.

2. Materials and Methods

This section presents the experiments and the modelling activities that were performed to test nZVI mobility in radial geometries and derive the multiparametric graphs for the estimation of the field-scale expected ROI. The experimental setup and procedures are presented in Section 2.1. Section 2.2 presents the flow and particle transport model. Section 2.3 presents the methodology for the interpretation of the radial transport experiment. Finally, the multiparametric analysis performed to derive the diagrams for nanoparticles injection are presented in Section 2.4.

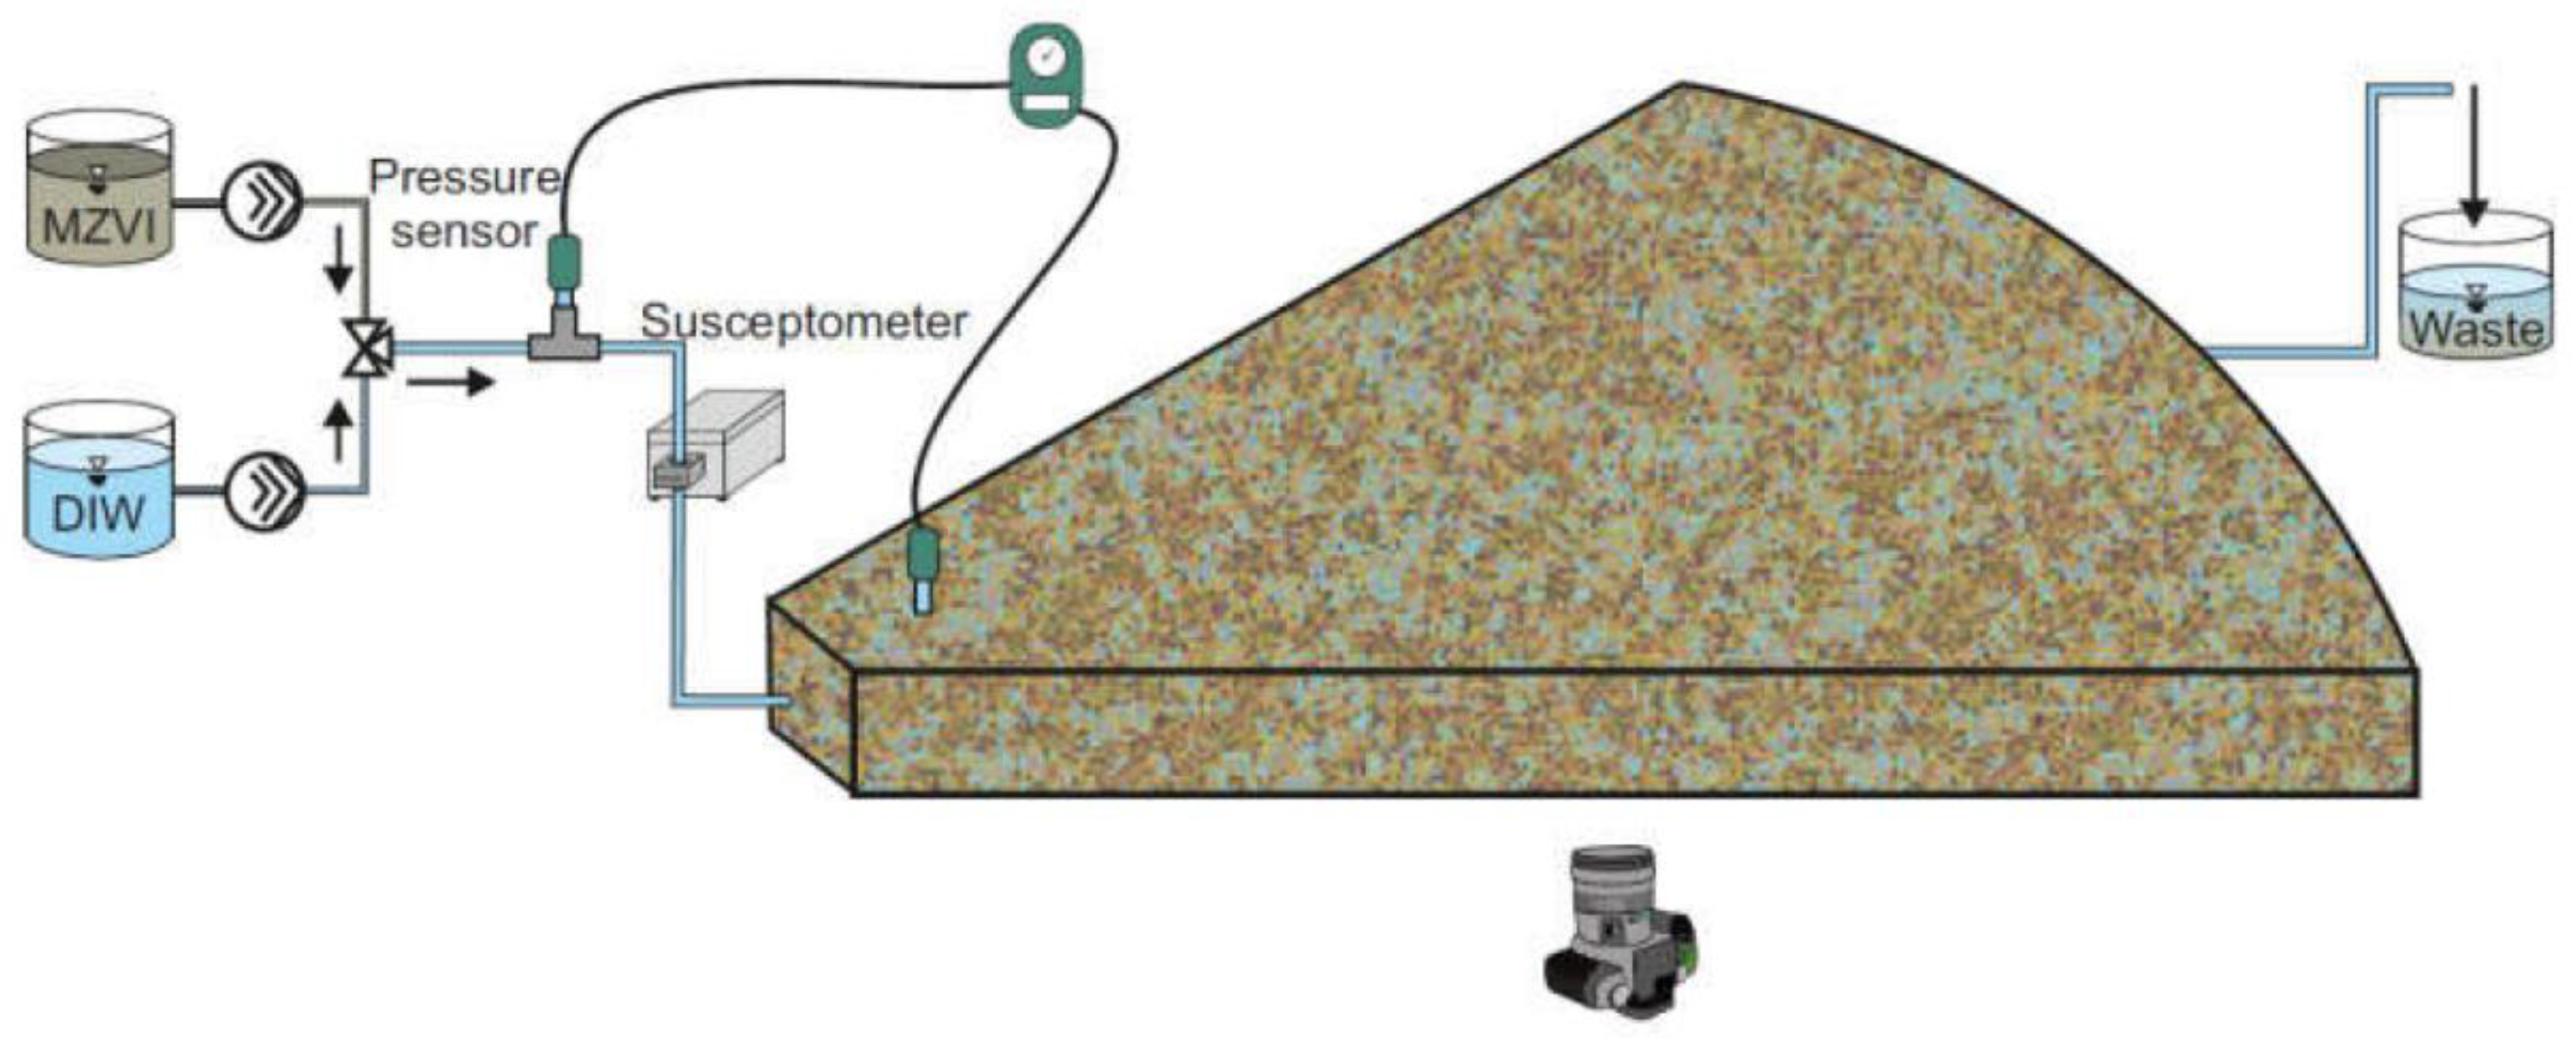
2.1. Experimental Setup and Procedures

The nZVI transport test was conducted with the same experimental setup described in detail by Mondino et al. (2020, ref. [37]) (Figure 1) and hereby recalled.
The porous medium for the injection tests was contained in a 1/6-cylinder portion (i.e., a 60° arc), hereby defined as “wedge”. The wedge had a radius of 90 cm, a depth of 4 cm, a volume of 16.96 L and was designed to resist high injection pressures (>5 bars). The radial setup was wet packed with quartz sand (Dorsilit #8 from Dorfner GmbH & Co., Hirschau, Germany) characterized by a rather homogeneous grain-size distribution ( d 10 , s a n d = 0.22   m m , d 50 , s a n d = 0.28   m m , and d 90 , s a n d = 0.33   m m ) and an average grain density ρ = 2650   k g / m 3 . Before the experiment, the sand was cleaned through three cycles of washing and sonication with NaOH 0.1 M, tap water, and deionized water to eliminate any residual impurities and colloids. The porosity ε of the sand bed was 0.48, resulting in a pore volume P V of the experimental setup of 8.13 L.
A screened well with a 4 cm inner diameter and 0.5 cm thick walls was installed at the vertex of the wedge (see Figure 1) to reproduce a radial flow representative of field injection conditions. At the model outlet, a constant and homogeneous hydraulic head was set to ensure a uniform radial flow in the transport domain, through 17 extraction pipes connected to a tank placed 1 m above.
The model was first preconditioned with 5 PV of deionized water (DIW), then 0.8 PV of nZVI slurry were injected, followed by other 5 PV of DIW flushing. A progressive cavity pump (Seepex, Bottrop, Germany) was used to ensure a constant and non-pulsating flow. The injection flow rate was 7 L/h (that is, ~1 PV/h), corresponding to a unit-length discharge Q s of 1   m 3 / h / m . The particle suspension was injected through the whole thickness of the tank, thus preventing the establishment of any vertical component of migration due to flow velocity, buoyancy or dispersive transport.
A pressure sensor (Delta Ohm HD 2124.1, Padova, Italy) was installed at the setup inlet to record the injection pressure variation induced by the viscous flow and the possible porous-medium clogging. The nZVI inlet and outlet concentration was continuously monitored through a susceptibility sensor with a time interval of 1 s. At the end of the experiment, sand samples were collected along three different radial directions, 15° apart from each other, and the iron content was determined through magnetic susceptibility measurements. A high-definition camera (Nikon D500), placed below the model, recorded the experiment through the transparent bottom wall of the wedge with an acquisition frequency of two photos per minute. The camera was used to verify the achievement of a homogeneous front within the domain, with no formation of preferential pathways, and to qualitatively assess the final distance reached by the nZVI suspension front at the end of the injection. This distance was then confirmed by measurements of particle concentration in sand samples collected at the end of the experiment.
A commercial nZVI-based reactive gel, IronGel-Nano (DeltaNova s.r.l., Torino, Italy), was used in the experiment. IronGel-Nano was provided as a two-component reagent: (i) a water-based concentrated slurry with a 50% weight content of nZVI particles characterized by an average particle diameter of 50–60 nm, a specific surface area of 25 m2/g and a specific gravity of 1.2 g/cm3; and (ii) a proprietary polymeric formulation that, upon dilution with water, creates a colloidally stable reactive gel with shear-thinning behavior. To prepare the suspension to be injected, the two components were mixed and diluted with deionized water using a high shear mixer (Ultra Turrax, IKA, Staufen, Germany) to achieve a final iron concentration of 10 g/L and a polymer content of 7.0 g/L. Before injection, the nZVI slurry was finally degassed using a vacuum pump to remove air bubbles.
The rheological behavior of the shear-thinning gel was characterized by measuring its bulk viscosity in a shear rate range γ ˙ = 10 3 ÷ 10 4   s 1 with an Antoon Paar MCR302 (Graz, Austria) rheometer. The measurements were performed at three different polymer concentrations ( C P ), namely 6.0 g/L, 8.75 g/L and 10.5 g/L, to investigate the influence of the stabilizer content on the slurry rheology.

2.2. Particle Radial Transport Model

The permeation injection of nZVI particles through a screened well was modelled in radial geometry with the coupled flow and transport equation system reported in Equations (1)–(12) (Table 1). The structure of the equation system is briefly discussed in this paragraph, whereas the definition of symbols is explained in the manuscript glossary. Further details are reported in Refs. [42,45].
The group A (Equations from (1)–(3)) defines the mass transport equations for nZVI particles:
  • Equation (1) is a modified advection–dispersion equation that describes the particle transport through a porous medium and their deposition due to physical and physicochemical interactions with the solid matrix;
  • Within Equation (1), the liquid–solid phase mass exchange term ρ b S F e t can assume different forms according to the particle retention mechanism to be taken into account. A single-site linear irreversible deposition kinetics (Equation (2)) was selected for the interpretation of the nZVI test described in Section 2.1;
  • Equation (3) expresses the dependency of the particle-attachment coefficient k a on the slurry and aquifer properties, i.e., the water-flow velocity, the suspension viscosity, the aquifer average grain size [25]. The attachment coefficient also depends on the single collector contact efficiency η 0 that, in this study, was calculated using the formulation proposed by Messina et al. (2015, ref. [46]). η 0 is a theoretical parameter that, under specific assumptions and simplifications (e.g., single spherical collector, infinite fluid domain, uniform flow field), describes the effect of different deposition mechanisms (i.e., gravitational sedimentation, interception, Brownian diffusion) on the particle transport [47,48].
The group B includes the flow equations (Equations (4) and (5)) describing the injection of a non-Newtonian shear-thinning fluid in radial coordinates [25]:
  • Equation (4) defines the steady-state flow field resulting from the fluid injection through a single screened well in an infinite, homogeneous and isotropic aquifer system. Under these hypotheses, and assuming negligible influence of the groundwater background velocity on the overall flow field, the Darcy velocity depends only on the injection flow rate and well geometry, and hyperbolically decreases with increasing distance from the injection well. Although previous studies have demonstrated that background flow can have a notable influence on nZVI transport [38,39], in the specific conditions investigated in this study, the assumption of negligible groundwater flow effects can be deemed acceptable. This is due to the fact that the flow field generated by the well during particle injection (with velocities reaching up to 500 m/day) predominates over the natural groundwater velocity, which typically ranges from centimeters to a few meters per day in highly conductive aquifers;
  • Equation (5) is a modified Darcy’s law for shear-thinning fluids that expresses the pressure build-up induced by the injection as a function of the porous medium hydraulic conductivity K and fluid viscosity μ m γ m ˙ .
The equation group C (Equations (6)–(9)) describes the rheological model adopted to simulate the non-Newtonian behavior of the nZVI suspension. Equation (6) is the Ostwald de Waele power-law model used to describe the decrease of viscosity with increasing of the shear rate γ m ˙ experienced by the fluid during flow through the porous medium (Equation (7)) [49]. Both the reference viscosity ω and the power-law index n were correlated with the gel concentration C P by means of empirical formulations described in Equations (8) and (9); such correlations were derived from the interpretation of the rheological tests results, as better described in the next Section 3.1.
Finally, the equation group D (Equations (10)–(12)) describes the reduction of the porous-medium permeability due to clogging phenomena. A modified version of the Kozeny–Carman equation is applied (Equation (10)) [25], where the permeability reduction is the result of the concurrent decrease of the effective porosity ε (Equation (11)) and of the increase of the specific surface area a (Equation (12)) induced by the particle deposition on the porous-medium surface.

2.3. Radial Transport Test Interpretation

The coupled flow and transport equation system described in Section 2.2 was solved numerically using the finite difference code MNMs 2023 [42,43] to reproduce the experimental conditions of the nZVI injection test. The 0.9 m-wide radial domain was discretized with a logarithmically spaced finite difference grid composed of 300 cells having sizes between 1.27 · 10−4 and 6.99 · 10−3 m. A unit-length discharge Q s of 1   m 3 / h / m was applied to reproduce the flow field expected during the experiment. The corresponding steady-state velocity field around the injection well was calculated analytically by the application of Equation (4). For mass transport, a third-type boundary condition was applied by imposing a mass flux of 2.8 · 10−3 kg/s at the domain inlet. A concentration zero-gradient boundary condition was imposed at the outlet. The transport equation system was solved using an implicit finite difference approach with a central-in-space discretization scheme, with a constant time step equal to 2 s.
The model parameters (i.e., the empirical attachment coefficient C a , the clogging coefficients λ and θ and the power-law model parameters ω and n ) were estimated by global least-square fitting of particle concentration profiles measured at the end of the test, pressure-drop data registered during the injection and rheological characterization data. A summary of the parameters implemented in the MNMs model to simulate the radial injection experiment is reported in Table 2.

2.4. Multiparametric Analysis

A multiparametric analysis was carried out using the MNMs model to investigate the influence of the operating conditions and aquifer hydrodynamic parameters on the effectiveness of particle delivery during field scale injections. The simulation scenario considered the injection of 5 m3 of iron slurry from a single well with a six-inch diameter and a 1 m screening length.
The parametric analysis involved two important design variables, i.e., the injection flow rate per unit length Q s (hereby: specific flow rate) and the concentration of stabilizing gel C P . In particular, 30 different values for each variable were explored, ranging from 0.125 m2/h and 5 m2/h for the specific flow rate and from 4 g/l and to 14 g/L for the polymeric stabilizer concentration. Additionally, 2 different aquifer formations were considered (gravelly sand and medium sand) leading to a total of 1800 simulations (i.e., the combination of 30 flow rates, 30 biopolymer concentrations and 2 aquifer formations). The hydrodynamic parameters of each formation are reported in Table 3.
For each combination of parameters, the radius of influence of the injection and maximum injection pressure were obtained. The results were then aggregated to create a multiparametric map for each lithological formation.
The ROI was defined as the radial distance from the injection point where a nanoparticle threshold concentration of 1 g per kg of soil was reached. For comparison, also the corresponding theoretical R O I m a x was calculated as the distance that a tracer would reach in the same conditions. The theoretical R O I m a x depends on the fluid injected volume and on the effective porosity ε , and can be calculated according to the following formula:
R O I m a x = V / h π ε
where V / h (L2) is the injected volume per unit length of the screen (and, hence, of the aquifer depth).
When performing a permeation injection, it is pivotal to keep the injection pressure below a critical value to prevent porous medium fracturing and, hence, the slurry propagation along the fractures instead of the pores. The threshold fracturing pressure P f is an intrinsic property of the aquifer system that is typically determined experimentally through pilot tests in the field, i.e., step injection tests. However, a reasonable estimate of P f is given by the effective stress σ ( z ) according to Luna et al. (2015, ref. [24]):
P f = σ z = ρ b g z ρ f g z s
where g is gravity acceleration (LT−2), z is the injection depth from the ground level (L), ρ f is the density of the injected fluid (ML−3) and s is the depth to water table (L).
Considering typical injection depths, all simulations resulting in P i n j > 10   b a r were excluded from results and hence from the design-support diagrams shown in Section 3.4.

3. Results

This section presents the results of the experimental and modelling activities. Section 3.1 shows the results of the rheological characterization of the IronGel suspensions in different polymer concentrations, which were used to calibrate the rheological parameters of the power-law model. Section 3.2 presents the results of the radial transport test and its interpretation with the software MNMs 2023. Finally, in Section 3.3 and Section 3.4, the results of the parametric analysis and the multiparametric diagrams built to support the design of field-scale injections are reported along with an example of their application.

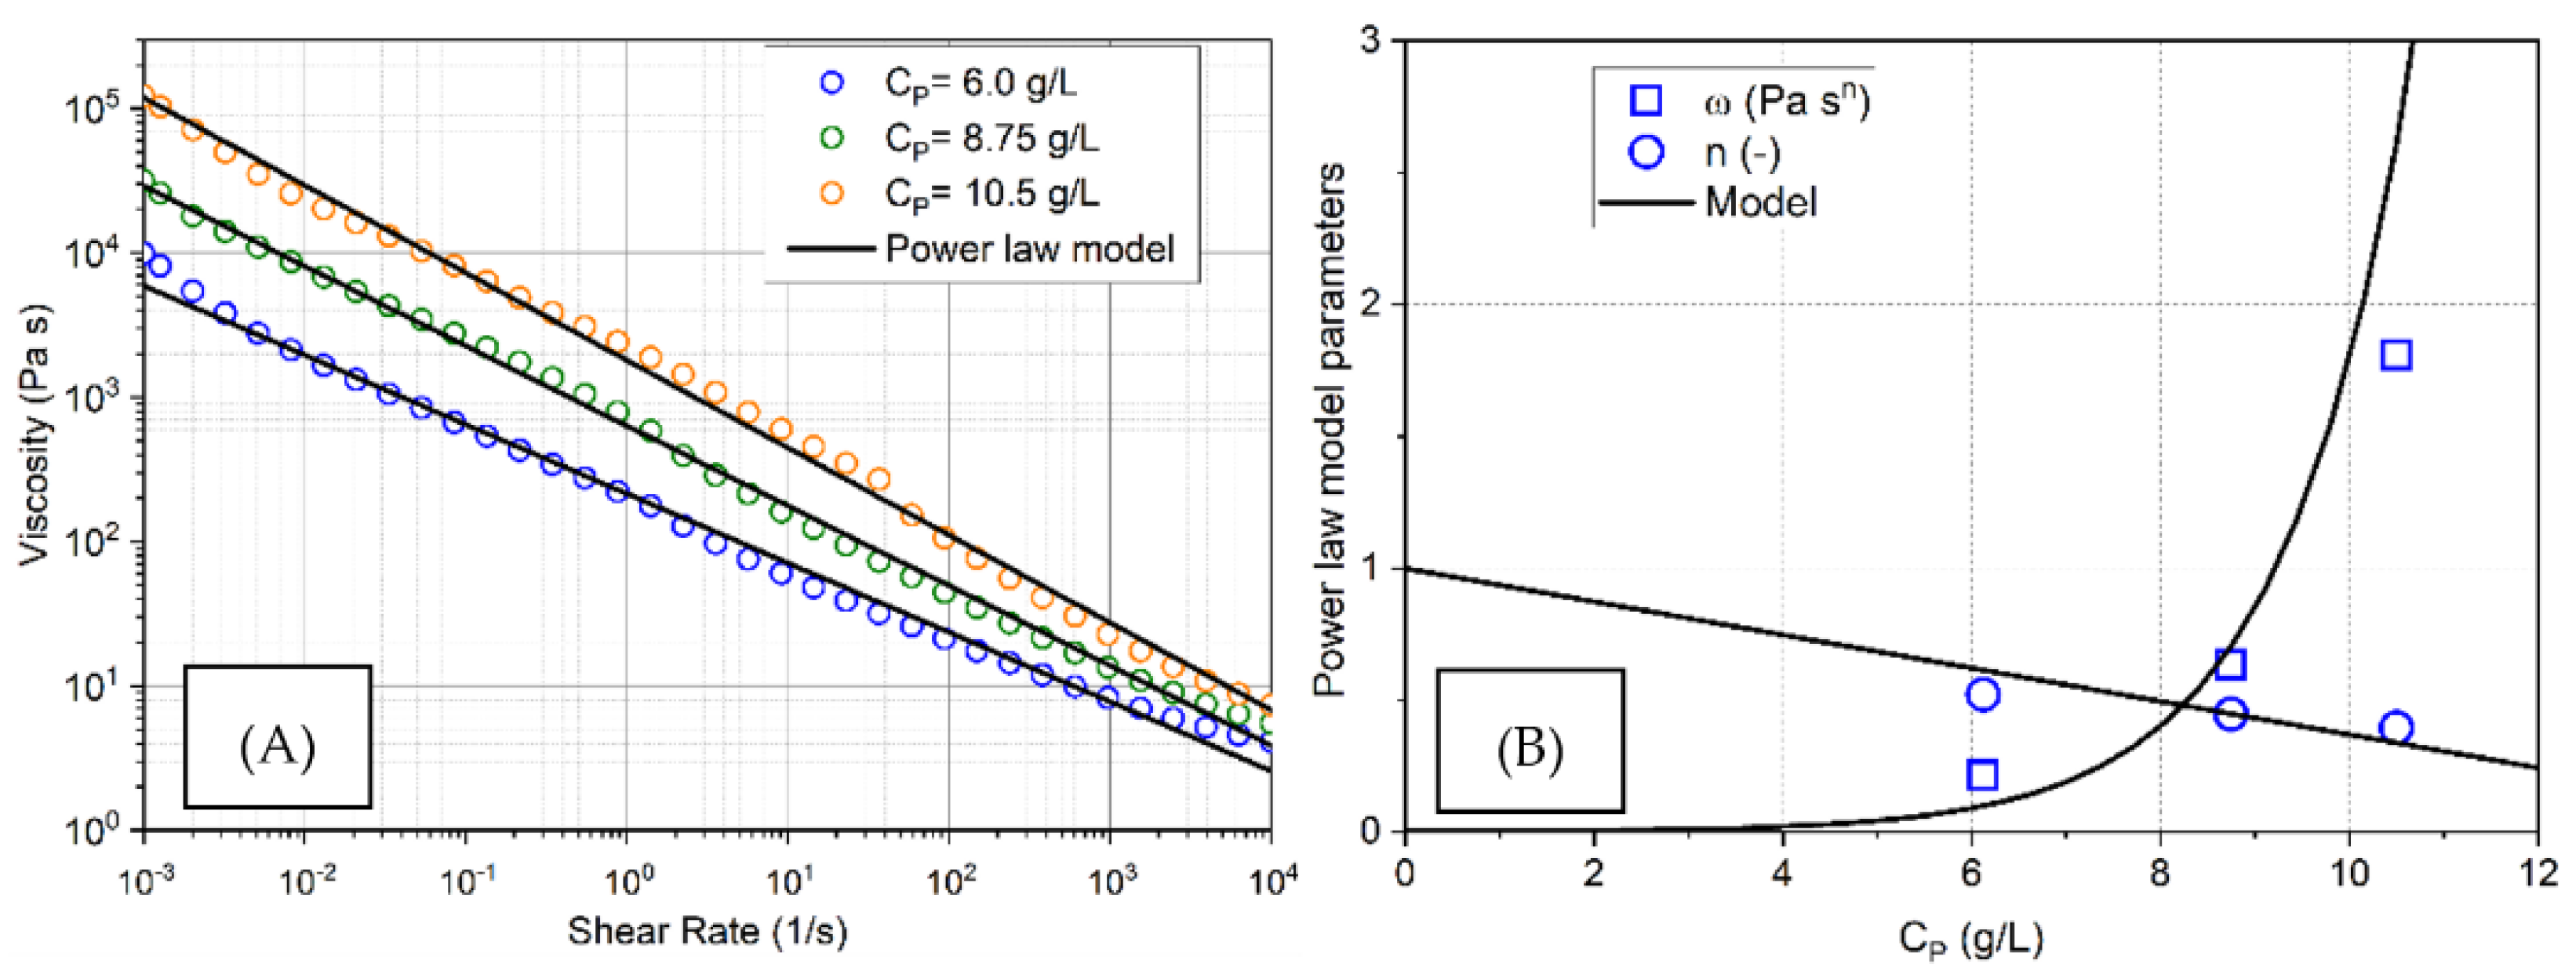
3.1. Slurry Rheology

Figure 2A presents the results of rheological characterization of the stabilizing gel in different polymer concentrations. The gel shows a clear shear-thinning behavior in all tested concentrations, that is:
  • the viscosity is in the order of 104 Pa·s in quasi-static conditions (i.e., at shear rates γ m ˙ = 10 3 ÷ 10 2   s 1 ), which is optimal to guarantee pre-injection stability of the iron suspensions;
  • the viscosity decreases to less than 10−3 Pa·s at shear stress values typical of subsurface injections (i.e., at γ m ˙ = 10 2 ÷ 10 3   s 1 ), thus allowing the expected pressure build-up to be contained.
Each rheological curve was fitted with the power-law model reported in Equation (6). The resulting fitting coefficients ω and n are reported in Figure 2B as a function of the polymeric stabilizer concentration C P . The reference viscosity ω was found to increase exponentially with the stabilizer concentration, whereas a linear decrease was observed for the power-law index n . The following empirical equations were applied to model these trends:
ω C P = μ w e x p A · C P
n C P = 1 B · C P
where μ w = 10 3   P a · s is the viscosity of pure water and A = 0.75 [L3M−1] and B = 6.3 · 10 2 [L3M−1] are empirical parameters. For a null concentration of C P , we have ω = μ w and n = 1 , and the power-law model degenerates into μ = μ w , i.e., the shear-rate independent viscosity of water.
Coupling Equations (15) and (16) with the power-law model reported in Equation (6) it is possible to obtain an explicit formulation that correlates viscosity to both the shear-rate γ m ˙ and the stabilizer concentration C P :
μ m γ m ˙ = μ w exp A · C P · γ m ˙ B · C P

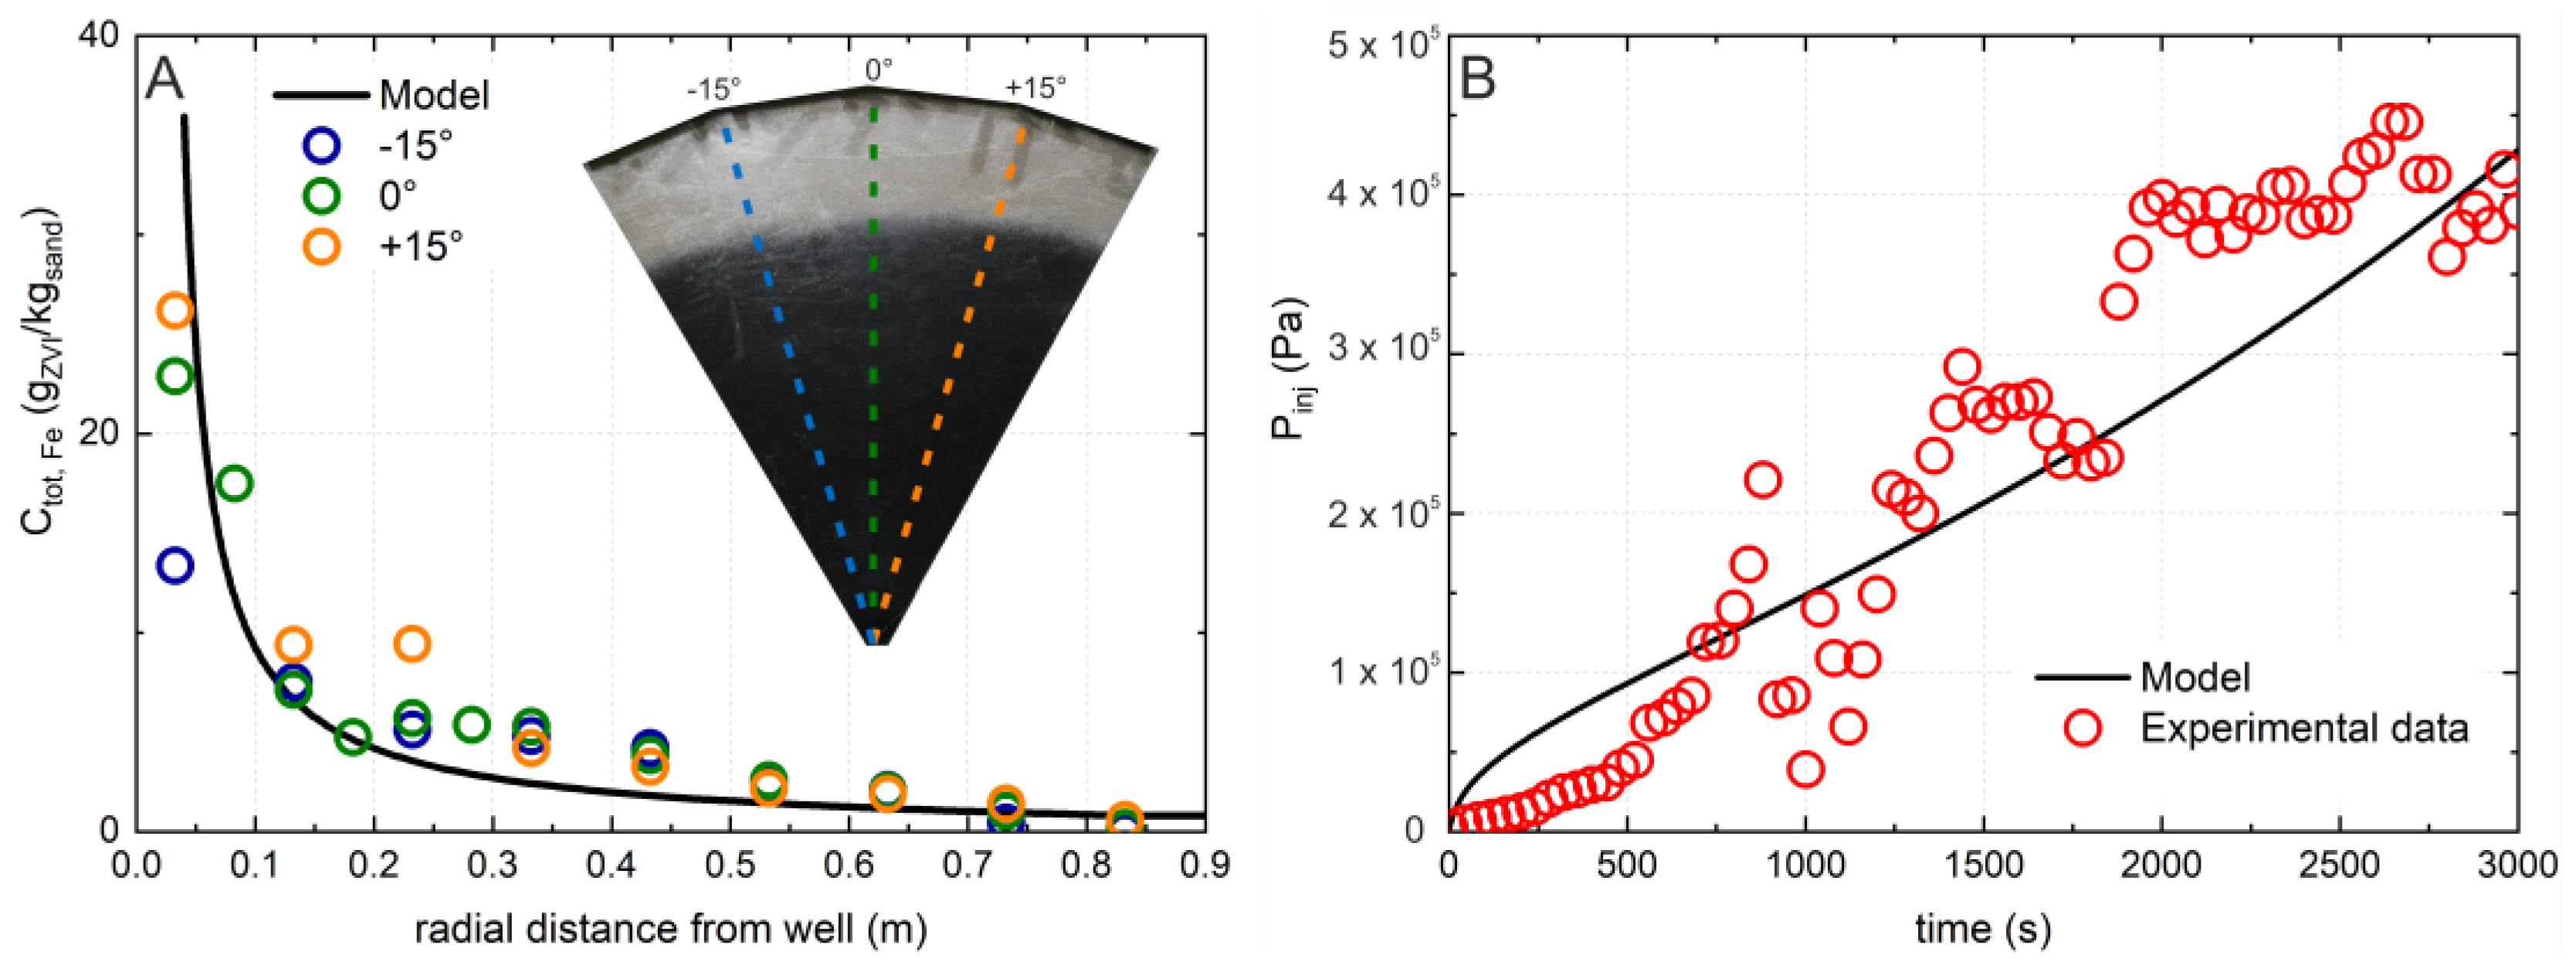
3.2. Radial Transport Experiment

The results of the transport experiment performed within the radial geometry setup are summarized in Figure 3. The radial distribution of the nZVI concentration at the end of the injection phase is shown in Figure 3A for three transects (center of the wedge and ±15° from it), along with a picture of the tank captured at the end of the test. Figure 3B reports the evolution of the pressure build-up over time measured at the model inlet.
The experimental findings showed that the nZVI-based reactive gel is highly mobile in sandy porous media. The particle front reached a distance R O I = 0.70   m from the injection point, corresponding to the 88% of the maximum value achievable in the absence of attachment phenomena, i.e., R O I m a x = 0.81   m according to Equation (13).
The radial profiles of the iron concentration were similar in all three of the directions observed, confirming that a homogeneous radial flow was established, and that the permeation regime was ensured during the injection, i.e., no formation of preferential paths. No differences in the shape of the plume were observed between the bottom and top faces of the tank, thus confirming that buoyancy did not play a relevant role in the test conditions. The particle distribution showed a concentration decrease with increases in the distance from the well, indicating partial accumulation of the particles near the injection point. This led to a slight clogging of the porous medium in the proximity of the well, as confirmed by the trend of pressure, which increased up to 4.5 bar at the end of the slurry injection (Figure 3B).
The numerical model (solid back line in Figure 3) reproduced, with good accuracy, both the concentration profiles and pressure build-up curves, thus confirming MNMs as a useful and reliable tool for the simulation of field-like injections of ZVI nanoparticles. The following transport and clogging parameters were derived from model fitting of the experimental data: the empirical attachment parameter C a = 0.15 , the packing degree of the iron deposits λ = 0.35 , and the fraction of the deposed particles that contributes to the specific area increase θ = 0.85 . Despite the fact that these values were specifically derived for a sandy-aquifer medium, these parameters are expected to be substantially independent from the hydrodynamic properties of the aquifer system (i.e., permeability, porosity, and median diameter d 50 ) and operating conditions (i.e., injection flow rate and stabilizer concentration) [45]. Therefore, the same coefficients can be used as input parameters to predict the expected particle behavior in different hydrogeological formations and support the design of field-scale ZVI injections, as is better described in Section 3.3.

3.3. Predictive Simulations and Implications for Field Applications

A modelling multiparametric analysis was performed using the coefficients derived from the interpretation of the radial transport experiment to investigate nZVI injection performance in two lithological formations: gravelly sand and medium sand. A total of 900 simulations were performed for each aquifer formation, exploring the combination of 30 different values of injection-specific flowrates and stabilizing gel concentrations. The results of the multiparametric analysis are shown in Figure 4.
Figure 4A,B are two-dimensional contour graphs reporting, respectively, the variation of the radius of influence (Figure 4A) and of the maximum injection pressure (Figure 4B) obtained for nZVI injection in a medium-sand aquifer as a function of the specific flow rate and stabilizer concentration. In these graphs, the blue color indicates low values of ROI and Pinj, whereas the red is associated with high numbers. As expected, an increase of the gel concentration and/or of the injection flow rate results in an increase in both the ROI and the injection pressure (in the graphs color changes from blue to red while moving from bottom to top and from left to right). While the former is desirable, the latter represents an issue as it could lead to porous-medium fracturing due to overpressure, especially at low depths. On the other hand, a slight increase in the injection pressure is also observed when stabilizer concentrations are too low ( C P < 5.0   g / L ) and specific flow rates ( Q s < 1   m 2 / h ) are applied (bottom left corner in Figure 4B). In such conditions, the suspension stabilization is less efficient, thus leading to a reduction of the nZVI mobility and to partial porous-medium clogging due to particle accumulation in the vicinity of the injection well. This is more evident in Figure 4D, where the injection pressure is reported as a function of Q s for three different gel doses: while the pressure follows the expected monotonic trend for C P equal to 8.75 and 10.5 g/L, at the lower value C P = 5.0   g / L the pressure shows a minimum at around Q s = 1   m 3 / h / m and increases in smaller and larger flow rate values.
To better understand the influence of Q s and C P on particle mobility, Figure 4C, reports the partial derivative of the ROI with respect to Q s ( R O I / Q s ) for three different C P values (5.0, 8.75, and 10.5 g/L). The derivative value was found to be positive all over the range of Q s and C P , indicating that an increase of the injection flow rate always corresponds to an improvement of the migration distance. However, it can be observed that: (i) the derivative value sharply decreases in the range between 0.3 m3/h/m and 3.0 m3/h/m and approaches a constant value for greater values; and (ii) for higher CP values, indicating a highly stable nZVI suspension, the derivative value decreases, which suggests that under such conditions, increasing the injection flowrate does not significantly enhance particle mobility, as the ROI value remains consistently high across all injection flow rates. Therefore, considering that the use of higher injection flow rates results in increased pressure build-up, particularly for elevated polymer concentrations (Figure 4D), we can deduce that, in practical terms, employing a flow rate greater than 3 m3/h/m does not offer significant benefits in terms of ROI and may result in excessive pressure and potential fracturing, particularly at shallow depths.

3.4. Multiparametric Graphs

The ROIs and the maximum injection pressures obtained from the modelling analysis discussed before were combined, and multiparametric graphs were developed for their use as predictive tools in the design of permeation injections of gel-stabilized nZVI particles (Figure 5). In these graphs, the expected radii of influence ( R O I ) and the specific flow rates ( Q s ) are reported as functions of the expected maximum injection pressure ( P i n j ) and of the concentration of stabilizing agent ( C P ). In particular, the coloured bands represent the expected ROIs (with a discretization of 0.1 m) and the black lines indicate the specific flow rates Q s (from 0.125 m2/h up to a maximum of 5.0 m2/h). Each group of curves refers to a specific hydrogeological formation. As stated above in Section 2.4, all simulations resulting in injection pressures greater than 10 bar were excluded, as they would lead to fracturing at the typical depth ranges of nZVI injections. This choice leads to the exclusion of low-permeability aquifers, high-injection flowrates, high-stabilizer concentrations, and combinations of them. Conditions leading to intense clogging phenomena (i.e., low stabilizer concentrations and injection flowrates) were not considered either.
The diagrams of Figure 5 highlight the high potential for nZVI injections to achieve large ROI values (exceeding 2 m) in highly conductive formations such as gravelly sand ( K = 2.5 · 10 2   m / s = 2160   m / d ) and medium-sand sands ( K = 3 · 10 3   m / s = 260   m / d ).

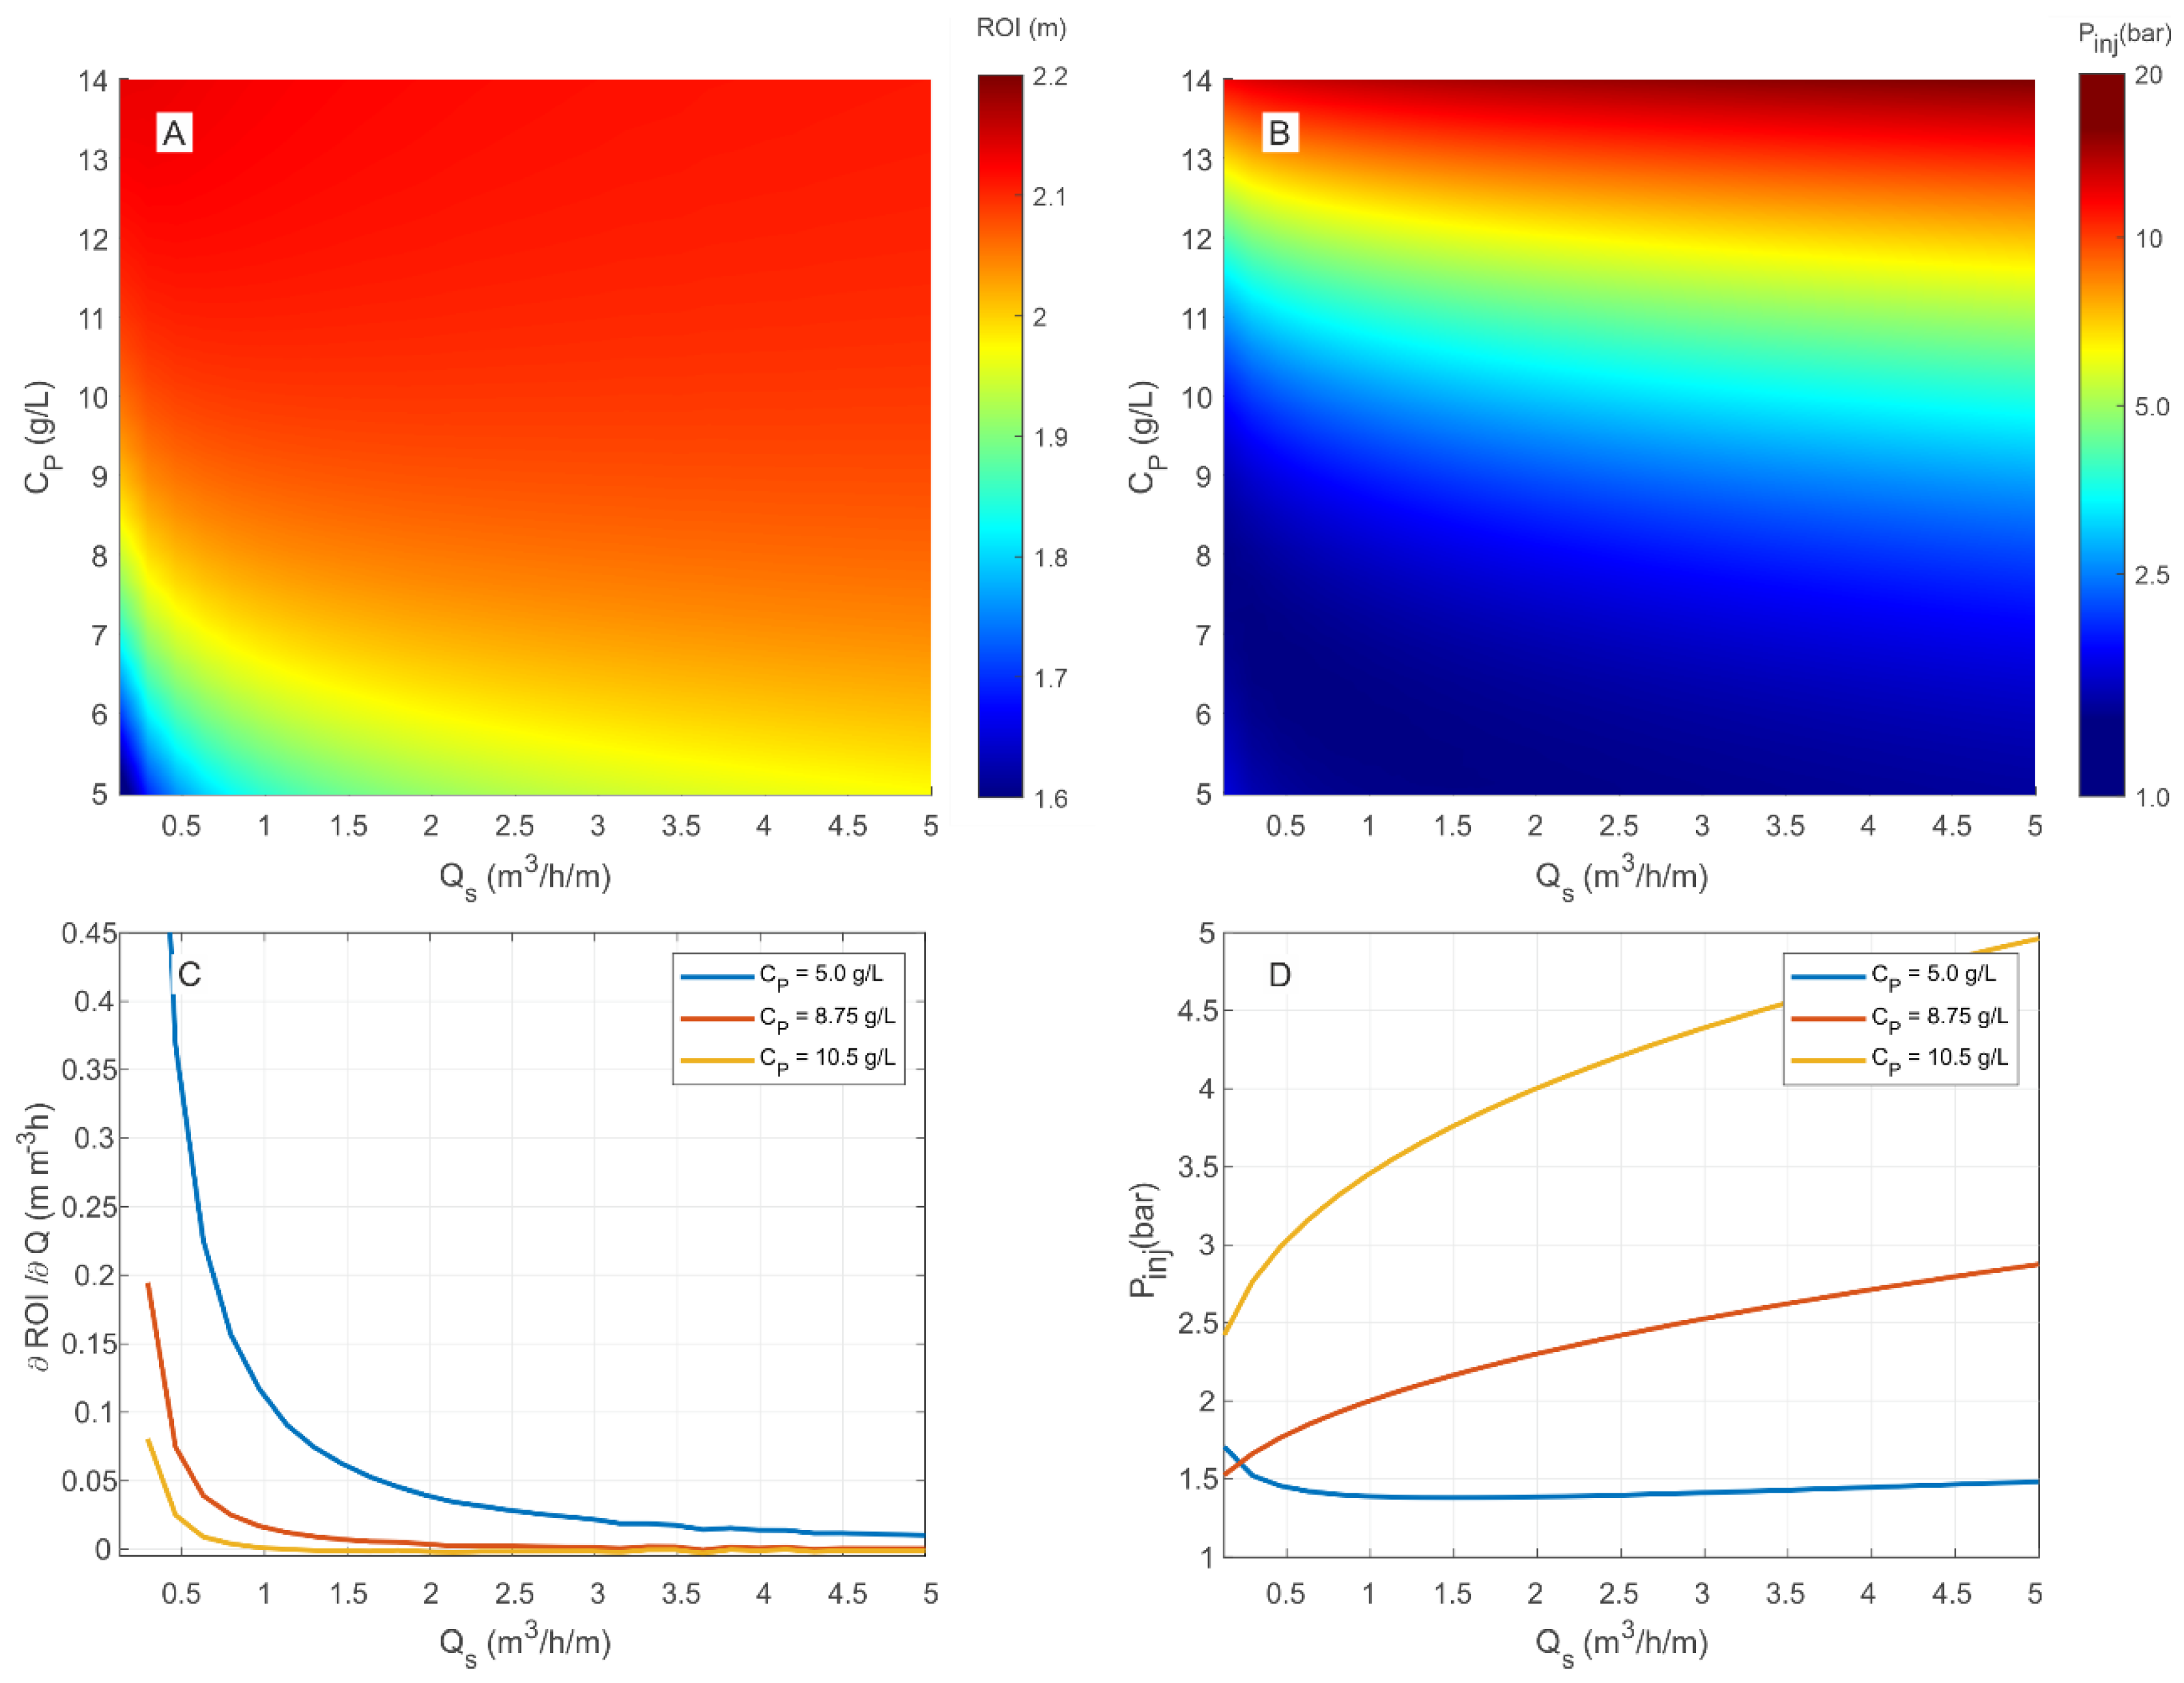
Example of Use of the nZVI Injection Diagrams

The following procedure can be applied to support a case-specific design of field-scale injections of nZVI particles using the multiparametric graph reported in Figure 6.
Let us consider the following remediation scenario: the groundwater contamination is located in a medium sandy aquifer; the contamination depth is 20 m b.g.l., whereas the depth to the water table is 5 m bgl.; an injection well is drilled, with a diameter of six inches and a screened section of 1 m; 5 m3 of a 10 g/L nZVI suspension is injected with the aim of achieving a target concentration of 1 gZVI/kgsand. In such conditions, the maximum injection pressure to be applied to avoid porous medium fracturing, estimated through Equation (16), is equal to 3 bar. Considering a minimum concentration of the stabilizing gel of 5 g/L, which is necessary to ensure the colloidal stability of the suspension, a “safe” operating window can be defined in terms of the injection pressure ( P i n j < 3   b a r ) and stabilizer concentration ( C P > 5   g / L ). The adoption of any operating conditions within this region, identified by the white part of the graph in Figure 6, is therefore expected to ensure the nZVI injection to be performed in a permeation regime.
Once da working point within the “safe” window is defined, a reasonable estimation of the expected ROI can be obtained by looking at the corresponding colored bands. As an example, if we assume the injection of an nZVI reactive suspension stabilized with a 7 g/L gel with a specific flow rate Q S of 1 m3/h/m, the working point 1 can be identified in Figure 6 by the intersection between the corresponding flowrate curve and the ordinate relative to the chosen concentration (line a in Figure 6). This point corresponds to an expected radius of influence between 1.95 and 2.0 m (as indicated by the relative coloured band) and an injection pressure of 1.45 bar (point b in Figure 6).
However, if the goal is to maximize the radius of influence with no restraints on the other parameters, two options are possible to keep the injection pressure below the critical value of 3 bar:
  • to keep constant the injection flowrate and increase the stabilizer concentration: this can be achieved by going from point 1 to point 2 by moving along the specific flow rate curve of 1 m3/h/m up to the maximum allowed stabilizer concentration of 10.2 g/L; at this new working point it is possible to increase the radius of influence up to 2.10 m with an injection pressure of 2.9 bar;
  • to increase both the injection flow rate and the stabilizer concentration: this can be accomplished by imposing Q S equal to 5 m2/h and the injection pressure equal to 2.9 bar, and by deriving from the graph the corresponding maximum dose of stabilizing gel that can be applied to not exceed the pressure threshold ( C P = 9   g / L ); in these operational conditions, identified by the working point 3, an ROI between 2.05 and 2.10 m is expected. For comparison, if the gel concentration had been increased to 10.2 g/L as in the previous example, the expected injection pressure would have been greater than 4 bar (point 4 in Figure 6), thus leading to potential fracturing of the porous medium.

4. Conclusions

In this study, the injectability and mobility of a commercial nZVI-based reactive gel was tested in a radial geometry laboratory setup. The gel proved to be highly mobile in sandy porous media, allowing the achievement of a radius of influence (ROI) of 0.7 m with a homogeneous nZVI distribution within the domain and an acceptable injection pressure. The rheology of the gel was characterized at different concentrations, and a shear-thinning behavior was found, which was well described by a power-law model. The experimental results therefore confirmed that nZVI permeation injection with a good radius of influence is possible in conductive formations.
The software MNMs 2023 was applied to model the radial transport experiment. The software was capable of characterizing, with good accuracy, both the spatial nZVI distribution at the end of the experiment and the evolution over time of the injection pressure. This result confirmed that MNMs can be successfully applied in the interpretation of laboratory experiments and in the prediction of nZVI particle mobility during field injections.
Based on this experimental and modelling study, a multiparametric analysis was conducted with the software MNMs to build multiparametric graphs to be used as a tool for supporting the sizing and design of in situ permeation injections of nanoscale zero-valent iron. A total of 1800 simulations were performed to assess the dependence of the radius of influence (ROI) of the nZVI injections on the specific flow rate of injection ( Q S = 0.125 ÷ 5   m 2 / h ), the stabilizer concentration ( C P = 4 ÷ 14   g / L ), and the hydraulic properties of the aquifer (two formations considered: gravelly sand and medium sand). The multiparametric graphs can be used by practitioners to obtain a preliminary evaluation of the feasibility of nZVI permeation injections in gravelly and sandy aquifers. Furthermore, given a set of operating conditions, i.e., the stabilizing gel dose C p and specific flow rate Q S to be applied, and the tensional properties of the aquifer formation, i.e., the threshold fracturing pressure P f , these graphs allow for the estimation of the injection ROI to potentially be achieved. Alternatively, any of these parameters can be determined based on the other three, offering flexibility in the evaluation process. It must be noted that, being based on radial simulations, the predictions obtained in these graphs are subject to some simplifying assumptions (i.e., negligible background groundwater flow, negligible vertical migration of the slurry) and can therefore be applied only under certain conditions, e.g., in a feasibility study and preliminary design of nZVI permeation injections in fairly homogenous aquifers. Three dimensional models, accounting also for groundwater flow influence and possible vertical migration due to buoyancy forces, should instead be applied when the injection is performed in highly heterogeneous aquifers or when the long-term fate of nZVI under natural flow conditions (after the injection has been stopped) must be evaluated.
The multiparametric graphs developed in this study will serve as a valuable decision-making tool, aiding practitioners to assess the feasibility and implementation of nZVI injections in the field. This will ultimately contribute to a more effective and efficient utilization of this technology.

Author Contributions

Conceptualization, C.B.; methodology, C.B.; software, A.C., F.M. and C.B.; Data Curation, C.B., F.M. and A.C.; writing—original draft preparation, C.B. and F.M.; writing—review and editing, A.C., F.M. and C.B.; supervision, C.B. All authors have read and agreed to the published version of the manuscript.

Funding

This research received no external funding.

Data Availability Statement

The data presented in this study are available on request from the corresponding author. The data are not publicly available due to the nature of this research.

Acknowledgments

The authors gratefully acknowledge the valuable contribution of Sofia Credaro, who assisted in the proofreading and language editing of the manuscript.

Conflicts of Interest

The authors declare no conflict of interest.

Glossary

Acronyms
DIWDeionized water
MNMsMicro- and Nanoparticle transport, filtration, and clogging Model-Suite
mZVIMicroscale zero-valent iron
nZVINanoscale zero-valent iron
PVPore volume
ROIRadius of influence
Latin letters
A Empirical viscosity correction coefficient (m3/kg)
a Specific surface area of the porous medium (m2/m3)
a 0 Initial specific surface area of the porous medium (m2/m3)
a F e Specific surface area of the iron particles (m2/m3)
B Empirical power law correction coefficient (m3/kg)
b length of the well screening (m)
C a Empirical attachment coefficient (s−1)
C F e Iron particles concentration in the mobile phase (kg/m3)
C p Polymeric stabilizer concentration (g/L)
D r Dispersion coefficient (m2/s)
d 50 Mean diameter of sand grains (m)
g Gravity acceleration (m/s2)
K Porous medium permeability (m2)
K 0 Intrinsic permeability (m2)
k a Particle attachment coefficient (s−1)
n Power law index (−)
P Pressure (Pa)
P f Threshold fracturing pressure (bar)
q Darcy velocity (m/s)
Q Discharge rate (m3/s)
Q s Unit-length discharge rate (m3/h/m)
r Radial distance from well (m)
S F e Iron particles concentration in the solid phase (−)
s Depth to water table (m)
t Time (s)
z Depth from ground level (m)
Greek letters
α Shift factor (−)
γ m ˙ Shear rate (s−1)
ε Porosity (−)
ε 0 Initial porosity (−)
η 0 Single collector contact efficiency (−)
θ Surface increment coefficient (−)
λ Density reduction coefficient (−)
μ m Fluid viscosity (Pa·s)
ρ b Density of sand grains (kg/m3)
ρ F e Density of iron particles (kg/m3)
ρ w Density of injected fluid (kg/m3)
ω Reference viscosity (Pa·sn)

References

  1. Palma, V.; Accorsi, F.; Casasso, A.; Bianco, C.; Cutrì, S.; Robiglio, M.; Tosco, T. AdRem: An Integrated Approach for Adaptive Remediation. Sustainability 2020, 13, 28. [Google Scholar] [CrossRef]
  2. Suthersan, S.S.; Horst, J.; Schnobrich, M.; Welty, N.; McDonough, J. Remediation Engineering: Design Concepts; CRC Press: Boca Raton, FL, USA, 2016; ISBN 1-4987-7336-2. [Google Scholar]
  3. Beryani, A.; Bianco, C.; Casasso, A.; Sethi, R.; Tosco, T. Exploring the Potential of Graphene Oxide Nanosheets for Porous Media Decontamination from Cationic Dyes. J. Hazard. Mater. 2022, 424, 127468. [Google Scholar] [CrossRef]
  4. Mohammadian, S.; Krok, B.; Fritzsche, A.; Bianco, C.; Tosco, T.; Cagigal, E.; Mata, B.; Gonzalez, V.; Diez-Ortiz, M.; Ramos, V.; et al. Field-Scale Demonstration of in Situ Immobilization of Heavy Metals by Injecting Iron Oxide Nanoparticle Adsorption Barriers in Groundwater. J. Contam. Hydrol. 2021, 237, 103741. [Google Scholar] [CrossRef] [PubMed]
  5. Czinnerová, M.; Vološčuková, O.; Marková, K.; Ševců, A.; Černík, M.; Nosek, J. Combining Nanoscale Zero-Valent Iron with Electrokinetic Treatment for Remediation of Chlorinated Ethenes and Promoting Biodegradation: A Long-Term Field Study. Water Res. 2020, 175, 115692. [Google Scholar] [CrossRef]
  6. Mondal, A.; Dubey, B.K.; Arora, M.; Mumford, K. Porous Media Transport of Iron Nanoparticles for Site Remediation Application: A Review of Lab Scale Column Study, Transport Modelling and Field-Scale Application. J. Hazard. Mater. 2021, 403, 123443. [Google Scholar] [CrossRef]
  7. Wacławek, S.; Nosek, J.; Cádrová, L.; Antoš, V.; Černík, M. Use of Various Zero Valent Irons for Degradation of Chlorinated Ethenes and Ethanes. Ecol. Chem. Eng. S 2015, 22, 577–587. [Google Scholar] [CrossRef] [Green Version]
  8. Gallo, A.; Bianco, C.; Tosco, T.; Sethi, R. Zerovalent Iron for the Remediation of Contaminated Aquifers. Geoing. Ambient. E Min. 2018, 155, 5–16. [Google Scholar]
  9. Tosco, T.; Petrangeli Papini, M.; Cruz Viggi, C.; Sethi, R. Nanoscale Zerovalent Iron Particles for Groundwater Remediation: A Review. J. Clean. Prod. 2014, 77, 10–21. [Google Scholar] [CrossRef]
  10. Mangayayam, M.C.; Perez, J.P.H.; Alonso-de-Linaje, V.; Dideriksen, K.; Benning, L.G.; Tobler, D.J. Sulfidation Extent of Nanoscale Zerovalent Iron Controls Selectivity and Reactivity with Mixed Chlorinated Hydrocarbons in Natural Groundwater. J. Hazard. Mater. 2022, 431, 128534. [Google Scholar] [CrossRef]
  11. Němeček, J.; Pokorný, P.; Lacinová, L.; Černík, M.; Masopustová, Z.; Lhotský, O.; Filipová, A.; Cajthaml, T. Combined Abiotic and Biotic In-Situ Reduction of Hexavalent Chromium in Groundwater Using NZVI and Whey: A Remedial Pilot Test. J. Hazard. Mater. 2015, 300, 670–679. [Google Scholar] [CrossRef] [PubMed]
  12. Li, Q.; Chen, Z.; Wang, H.; Yang, H.; Wen, T.; Wang, S.; Hu, B.; Wang, X. Removal of Organic Compounds by Nanoscale Zero-Valent Iron and Its Composites. Sci. Total Environ. 2021, 792, 148546. [Google Scholar] [CrossRef]
  13. Gallo, A.; Bianco, C.; Tosco, T.; Tiraferri, A.; Sethi, R. Synthesis of Eco-Compatible Bimetallic Silver/Iron Nanoparticles for Water Remediation and Reactivity Assessment on Bromophenol Blue. J. Clean. Prod. 2019, 211, 1367–1374. [Google Scholar] [CrossRef]
  14. Sappa, G.; Barbieri, M.; Viotti, P.; Tatti, F.; Andrei, F. Assessment of Zerovalent Iron Nanoparticle (NZVI) Efficiency for Remediation of Arsenic-Contaminated Groundwater: Two Laboratory Experiments. Water 2022, 14, 3261. [Google Scholar] [CrossRef]
  15. Micić, V.; Bossa, N.; Schmid, D.; Wiesner, M.R.; Hofmann, T. Groundwater Chemistry Has a Greater Influence on the Mobility of Nanoparticles Used for Remediation than the Chemical Heterogeneity of Aquifer Media. Environ. Sci. Technol. 2020, 54, 1250–1257. [Google Scholar] [CrossRef]
  16. Schöftner, P.; Waldner, G.; Lottermoser, W.; Stöger-Pollach, M.; Freitag, P.; Reichenauer, T.G. Electron Efficiency of NZVI Does Not Change with Variation of Environmental Parameters. Sci. Total Environ. 2015, 535, 69–78. [Google Scholar] [CrossRef]
  17. Zhang, W.; Elliott, D.W. Applications of Iron Nanoparticles for Groundwater Remediation. Remediat. J. 2006, 16, 7–21. [Google Scholar] [CrossRef]
  18. Phenrat, T.; Saleh, N.; Sirk, K.; Tilton, R.D.; Lowry, G.V. Aggregation and Sedimentation of Aqueous Nanoscale Zerovalent Iron Dispersions. Environ. Sci. Technol. 2007, 41, 284–290. [Google Scholar] [CrossRef] [PubMed]
  19. Zhou, L.; Li, Z.; Yi, Y.; Tsang, E.P.; Fang, Z. Increasing the Electron Selectivity of Nanoscale Zero-Valent Iron in Environmental Remediation: A Review. J. Hazard. Mater. 2022, 421, 126709. [Google Scholar] [CrossRef]
  20. Xiao, S.; Jin, Z.; Dong, H.; Xiao, J.; Li, Y.; Li, L.; Li, R.; Chen, J.; Tian, R.; Xie, Q. A Comparative Study on the Physicochemical Properties, Reactivity and Long-Term Performance of Sulfidized Nanoscale Zerovalent Iron Synthesized with Different Kinds of Sulfur Precursors and Procedures in Simulated Groundwater. Water Res. 2022, 212, 118097. [Google Scholar] [CrossRef] [PubMed]
  21. Brumovský, M.; Oborná, J.; Micić, V.; Malina, O.; Kašlík, J.; Tunega, D.; Kolos, M.; Hofmann, T.; Karlický, F.; Filip, J. Iron Nitride Nanoparticles for Enhanced Reductive Dechlorination of Trichloroethylene. Environ. Sci. Technol. 2022, 56, 4425–4436. [Google Scholar] [CrossRef]
  22. Brumovský, M.; Micić, V.; Oborná, J.; Filip, J.; Hofmann, T.; Tunega, D. Iron Nitride Nanoparticles for Rapid Dechlorination of Mixed Chlorinated Ethene Contamination. J. Hazard. Mater. 2023, 442, 129988. [Google Scholar] [CrossRef]
  23. Phenrat, T.; Lowry, G.V. (Eds.) Nanoscale Zerovalent Iron Particles for Environmental Restoration: From Fundamental Science to Field Scale Engineering Applications; Springer: Cham, Switzerland, 2019; ISBN 978-3-319-95340-3. [Google Scholar]
  24. Luna, M.; Gastone, F.; Tosco, T.; Sethi, R.; Velimirovic, M.; Gemoets, J.; Muyshond, R.; Sapion, H.; Klaas, N.; Bastiaens, L. Pressure-Controlled Injection of Guar Gum Stabilized Microscale Zerovalent Iron for Groundwater Remediation. J. Contam. Hydrol. 2015, 181, 146–158. [Google Scholar] [CrossRef]
  25. Tosco, T.; Gastone, F.; Sethi, R. Guar Gum Solutions for Improved Delivery of Iron Particles in Porous Media (Part 2): Iron Transport Tests and Modeling in Radial Geometry. J. Contam. Hydrol. 2014, 166, 34–51. [Google Scholar] [CrossRef] [Green Version]
  26. Strutz, T.J.; Hornbruch, G.; Dahmke, A.; Köber, R. Effect of Injection Velocity and Particle Concentration on Transport of Nanoscale Zero-Valent Iron and Hydraulic Conductivity in Saturated Porous Media. J. Contam. Hydrol. 2016, 191, 54–65. [Google Scholar] [CrossRef]
  27. Johnson, R.L.; Nurmi, J.T.; O’Brien Johnson, G.S.; Fan, D.; O’Brien Johnson, R.L.; Shi, Z.; Salter-Blanc, A.J.; Tratnyek, P.G.; Lowry, G.V. Field-Scale Transport and Transformation of Carboxymethylcellulose- Stabilized Nano Zero-Valent Iron. Environ. Sci. Technol. 2013, 47, 1573–1580. [Google Scholar] [CrossRef]
  28. Raychoudhury, T.; Tufenkji, N.; Ghoshal, S. Aggregation and Deposition Kinetics of Carboxymethyl Cellulose-Modified Zero-Valent Iron Nanoparticles in Porous Media. Water Res. 2012, 46, 1735–1744. [Google Scholar] [CrossRef] [PubMed]
  29. Gao, F.; Zhang, M.; Zhang, W.; Ahmad, S.; Wang, L.; Tang, J. Synthesis of Carboxymethyl Cellulose Stabilized Sulfidated Nanoscale Zero-Valent Iron (CMC-S-NZVI) for Enhanced Reduction of Nitrobenzene. Sep. Purif. Technol. 2023, 315, 123704. [Google Scholar] [CrossRef]
  30. Tiraferri, A.; Chen, K.L.; Sethi, R.; Elimelech, M. Reduced Aggregation and Sedimentation of Zero-Valent Iron Nanoparticles in the Presence of Guar Gum. J. Colloid Interface Sci. 2008, 324, 71–79. [Google Scholar] [CrossRef]
  31. Sakulchaicharoen, N.; O’Carroll, D.M.; Herrera, J.E. Enhanced Stability and Dechlorination Activity of Pre-Synthesis Stabilized Nanoscale FePd Particles. J. Contam. Hydrol. 2010, 118, 117–127. [Google Scholar] [CrossRef] [PubMed]
  32. Mosaferi, M.; Nemati, S.; Khataee, A.; Nasseri, S.; Hashemi, A.A. Removal of Arsenic (III, V) from Aqueous Solution by Nanoscale Zero-Valent Iron Stabilized with Starch and Carboxymethyl Cellulose. J. Environ. Health Sci. Eng. 2014, 12, 74. [Google Scholar] [CrossRef] [Green Version]
  33. Gastone, F.; Tosco, T.; Sethi, R. Guar Gum Solutions for Improved Delivery of Iron Particles in Porous Media (Part 1): Porous Medium Rheology and Guar Gum-Induced Clogging. J. Contam. Hydrol. 2014, 166, 23–33. [Google Scholar] [CrossRef] [Green Version]
  34. Fopa, R.D.; Bianco, C.; Archilha, N.L.; Moreira, A.C.; Pak, T. A Pore-Scale Investigation of the Effect of Nanoparticle Injection on Properties of Sandy Porous Media. J. Contam. Hydrol. 2023, 253, 104126. [Google Scholar] [CrossRef]
  35. Schiefler, A.A.; Bruns, S.; Müter, D.; Uesugi, K.; Sørensen, H.O.; Tobler, D.J. Retention of Sulfidated NZVI (S-NZVI) in Porous Media Visualized by X-ray μ-CT–the Relevance of Pore Space Geometry. Environ. Sci. Nano 2022, 9, 3439–3455. [Google Scholar] [CrossRef]
  36. Chen, B.; Lv, N.; Xu, W.; Gong, L.; Sun, T.; Liang, L.; Gao, B.; He, F. Transport of Nanoscale Zero-Valent Iron in Saturated Porous Media: Effects of Grain Size, Surface Metal Oxides, and Sulfidation. Chemosphere 2023, 313, 137512. [Google Scholar] [CrossRef] [PubMed]
  37. Mondino, F.; Piscitello, A.; Bianco, C.; Gallo, A.; de Folly D’Auris, A.; Tosco, T.; Tagliabue, M.; Sethi, R. Injection of Zerovalent Iron Gels for Aquifer Nanoremediation: Lab Experiments and Modeling. Water 2020, 12, 826. [Google Scholar] [CrossRef] [Green Version]
  38. Andrei, F.; Sappa, G.; Boni, M.R.; Mancini, G.; Viotti, P. Mobility of NZVI in a Reconstructed Porous Media Monitored by an Image Analysis Procedure. Water 2021, 13, 2797. [Google Scholar] [CrossRef]
  39. Viotti, P.; Sappa, G.; Tatti, F.; Andrei, F. NZVI Mobility and Transport: Laboratory Test and Numerical Model. Hydrology 2022, 9, 196. [Google Scholar] [CrossRef]
  40. Tatti, F.; Papini, M.P.; Sappa, G.; Raboni, M.; Arjmand, F.; Viotti, P. Contaminant Back-Diffusion from Low-Permeability Layers as Affected by Groundwater Velocity: A Laboratory Investigation by Box Model and Image Analysis. Sci. Total Environ. 2018, 622–623, 164–171. [Google Scholar] [CrossRef]
  41. Jaberi, N.; Linley, S.; Thomson, N.R. Targeted Delivery of Nanoparticles to a Heterogeneous Crude Oil Zone in an Unsaturated Porous Medium. Environ. Sci. Water Res. Technol. 2023, 9, 1518–1530. [Google Scholar] [CrossRef]
  42. Bianco, C.; Tosco, T.; Sethi, R. A 3-Dimensional Micro- and Nanoparticle Transport and Filtration Model (MNM3D) Applied to the Migration of Carbon-Based Nanomaterials in Porous Media. J. Contam. Hydrol. 2016, 193, 10–20. [Google Scholar] [CrossRef] [Green Version]
  43. Bianco, C.; Tosco, T.; Sethi, R. MNMs 2021 Software (Micro- and Nanoparticle Transport, Filtration, and Clogging Model-Suite). Available online: www.polito.it/groundwater/software/mnms/ (accessed on 9 September 2022).
  44. Pulido-Reyes, G.; Magherini, L.; Bianco, C.; Sethi, R.; von Gunten, U.; Kaegi, R.; Mitrano, D.M. Nanoplastics Removal during Drinking Water Treatment: Laboratory- and Pilot-Scale Experiments and Modeling. J. Hazard. Mater. 2022, 436, 129011. [Google Scholar] [CrossRef] [PubMed]
  45. Tosco, T.; Sethi, R. Transport of Non-Newtonian Suspensions of Highly Concentrated Micro- and Nanoscale Iron Particles in Porous Media: A Modeling Approach. Environ. Sci. Technol. 2010, 44, 9062–9068. [Google Scholar] [CrossRef] [Green Version]
  46. Messina, F.; Marchisio, D.L.; Sethi, R. An Extended and Total Flux Normalized Correlation Equation for Predicting Single-Collector Efficiency. J. Colloid Interface Sci. 2015, 446, 185–193. [Google Scholar] [CrossRef] [Green Version]
  47. Tufenkji, N.; Elimelech, M. Correlation Equation for Predicting Single-Collector Efficiency in Physicochemical Filtration in Saturated Porous Media. Environ. Sci. Technol. 2004, 38, 529–536. [Google Scholar] [CrossRef] [PubMed]
  48. Li, J.; Xie, X.; Ghoshal, S. Correlation Equation for Predicting the Single-Collector Contact Efficiency of Colloids in a Horizontal Flow. Langmuir 2015, 31, 7210–7219. [Google Scholar] [CrossRef] [PubMed]
  49. Lindner, A.; Bonn, D.; Meunier, J. Viscous Fingering in a Shear-Thinning Fluid. Phys. Fluids 2000, 12, 256–261. [Google Scholar] [CrossRef]
Figure 1. Experimental setup for nZVI transport tests (modified from Ref. [37]).
Water 15 02303 g001
Figure 2. Rheology of the shear thinning IronGEL at different stabilizer concentrations: (A) viscosity value at different shear rates (10−3–104 s−1) and at different stabilizer concentrations (6.0 g/L, 8.75 g/L and 10.5 g/L); and (B) parameters of the power-law viscosity model obtained at different stabilizer concentrations. Symbols represent the experimental data, whereas black lines indicate the fitting models.
Water 15 02303 g002
Figure 3. Radial injection of nZVI particles: (A) photo of the radial setup at the end of the injection (black plume indicates nZVI particles) and graph of the concentration profiles determined from susceptibility measurements of sand samples collected along three different radial directions (colored dashed lines); and (B) variation over time of the injection pressure measured at the setup inlet. Symbols represent the experimental data, whereas black lines indicate the fitting models.
Water 15 02303 g003
Figure 4. Results of the multiparametric analysis for nZVI injection in a medium sand aquifer: (A) two-dimensional contour graph showing the variation of the radius of influence ( R O I ) as a function of the injection specific flow rate ( Q s ) and stabilizer concentration ( C P ); (B) two-dimensional contour graph showing the variation of the injection pressure ( P i n j ) as a function of the injection specific flow rate ( Q s ) and stabilizer concentration ( C P ); (C) partial derivative of the R O I with respect to Q s for different C P concentrations; and (D) injection pressure as a function of Q s for different C P concentrations.
Water 15 02303 g004
Figure 5. Multiparametric graphs for nZVI injection in different hydrogeological formations.
Water 15 02303 g005
Figure 6. Example of the application of the multiparametric graphs for the design of an nZVI injection in a medium sand aquifer.
Water 15 02303 g006
Table 1. Model equations for simulation of particle injection and transport in radial coordinates: ε is the porous medium porosity (−), C F e is the nZVI concentration in the mobile phase (kg/m3), ρ b is the bulk density of sand grains (kg/m3), S F e is the nZVI concentration in the solid phase (−), t is time (s), r is the radial distance from well (m), q is the Darcy velocity (m/s), D r is the dispersion coefficient (m2/s), k a is the particle attachment coefficient (s−1), C a is the empirical attachment coefficient (s−1), η 0 is the single collector contact efficiency (−), μ m is the fluid viscosity (Pa·s), Q is the discharge rate (m3/s), P is the pressure (Pa), K is the porous medium permeability (m2), γ m ˙ is the shear rate (s−1), ω is the reference viscosity (Pa·sn), C P is the polymeric stabilizer concentration (g/L), n is the power law index (−), α is the shift factor (−), ε 0 is the initial porosity of the porous medium, a 0 is the initial specific surface area of the porous medium (m2/m3), a is the porous medium specific surface area during the deposition process (m2/m3), K 0 is the intrinsic permeability (m2), λ is the density reduction coefficient (−) and θ is the surface increment coefficient (−).
(A) Particle transport
Modified advection-dispersion equation
ε C F e t + ρ b S F e t + 1 r r r q C F e 1 r r r ε D r C F e r = 0 (1)
nZVI Deposition kinetics
ρ b S F e t = ε k a C F e (2)
Velocity dependency
k a q , μ m = C a q ε d 50 , s a n d η 0 q , μ m (3)
(B) Non-Newtonian fluid flow
q = Q 2 π r b (4)
P r = μ m γ m ˙ K S F e q (5)
(C) Fluid rheology
μ m γ m ˙ = ω C P γ m ˙ n C P 1 (6)
γ m ˙ = α q K ε (7)
ω C P = f 1 C P (8)
n C P = f 2 C P (9)
(D) Porous medium clogging
K ( S F e ) = ε S F e ε 0 3 a 0 a S F e 2 K 0 (10)
ε S F e = ε 0 ρ b λ ρ F e S F e (11)
a S F e = a 0 + θ a F e ρ b ρ F e S F e (12)
Table 2. Model parameters used for the simulation of the radial injection experiment.
ParameterValuesUnits
Simulation radius0.9m
Cell number300-
Time step2s
Pore Volume ( P V )8.13L
Injection flow rate ( Q )7L/h
1m3/h/m
Injected volume6.5L
nZVI concentration10g/L
Polymer concentration7g/L
Sand bulk density ( ρ b )1.46 · 103kg/m3
Sand specific surface area ( a 0 )2.14 · 10−4m2/m3
Sand hydraulic conductivity ( K ) 12 · 10−4m/s
Sand dispersivity ( α ) 14.2 · 10−3m
Sand specific storage ( S s ) 11 · 10−5m−1
Sand porosity ( ε )0.48-
Empirical attachment coefficient ( C a ) 10.15s−1
Density reduction coefficient ( λ ) 10.35-
Surface increment coefficient ( θ ) 10.85-
Empirical viscosity correction coefficient ( A ) 20.75m3/kg
Empirical power law correction coefficient ( B ) 26.3 · 10−2m3/kg
Note: 1 Obtained by fitting of experimental data of the radial transport experiment. 2 Obtained by fitting of rheological experimental data.
Table 3. Hydrogeological properties of the aquifer formations considered for the multiparametric analysis: porosity ε , hydraulic conductivity K , porous medium permeability k 0 , bulk density ρ b , average grain d 50 .
Lithology ε (−) K (m/s) k 0 (m2) ρ b (kg/m3) d 50 (m) R O I m a x (m)
Gravelly sand0.252.5 · 10−22.55 · 10−919611.58 · 10−32.8
Medium sand0.273.0 · 10−33.06 · 10−1017365.48 · 10−42.7
Disclaimer/Publisher’s Note: The statements, opinions and data contained in all publications are solely those of the individual author(s) and contributor(s) and not of MDPI and/or the editor(s). MDPI and/or the editor(s) disclaim responsibility for any injury to people or property resulting from any ideas, methods, instructions or products referred to in the content.

