1. Introduction
Pollution of the biosphere by heavy metals (HM) as a result of anthropogenic activities poses a danger to the ecosystem and to humanity. The problem of HM pollution is most serious in the territories used for agriculture, as well as coastal zones with active economic operations related to mariculture harvesting.
A majority of all pollutants, including HMs, enter water bodies with continental runoff and subsequent migration along trophic chains [
1,
2]. Here, some HMs are characterized by biomagnification in living organisms [
3,
4,
5], while most HMs do not accumulate there [
6,
7] and ultimately are deposited in sea bottom sediments [
8,
9] of freshwater basins (ponds, lakes) and coastal sea areas. Here, the migration of heavy metals in water basins directly depends on the magnitude of the distribution coefficient in the ‘water–bottom sediments (BS)’ system [
8]. In the processes of transfer and deposition of BS, HM adsorbed on them are exposed to all physical–chemical and biological processes occurring in an aqueous environment with significant seasonal changes [
10]. In an equilibrium medium, sedimentation of suspended matter occurs; however, as a result of dynamic changes in equilibrium under the action of bioturbation, as well as natural and anthropogenic physical chemical processes, a secondary transition of accumulated elements into a water-soluble form is possible [
11]. In addition, suspended particles are actively transported by water currents, which contributes to the redistribution of pollutants in large water areas. The study of the HM content in bottom sediments of various types of water basins at the interface of the water/sediment phases, as well as along vertical profiles of BS, can serve as an integral indicator of the degree of pollution of water bodies and enables one to evaluate and establish the mechanisms of migration of elements [
12,
13,
14,
15].
The study of the migration and transformation of HM in seawater and freshwater basins of the same geographical region is of particular interest due to the various effects of natural conditions and pollution sources, which are the fundamental factors of migration and concentration of HM in bottom sediments.
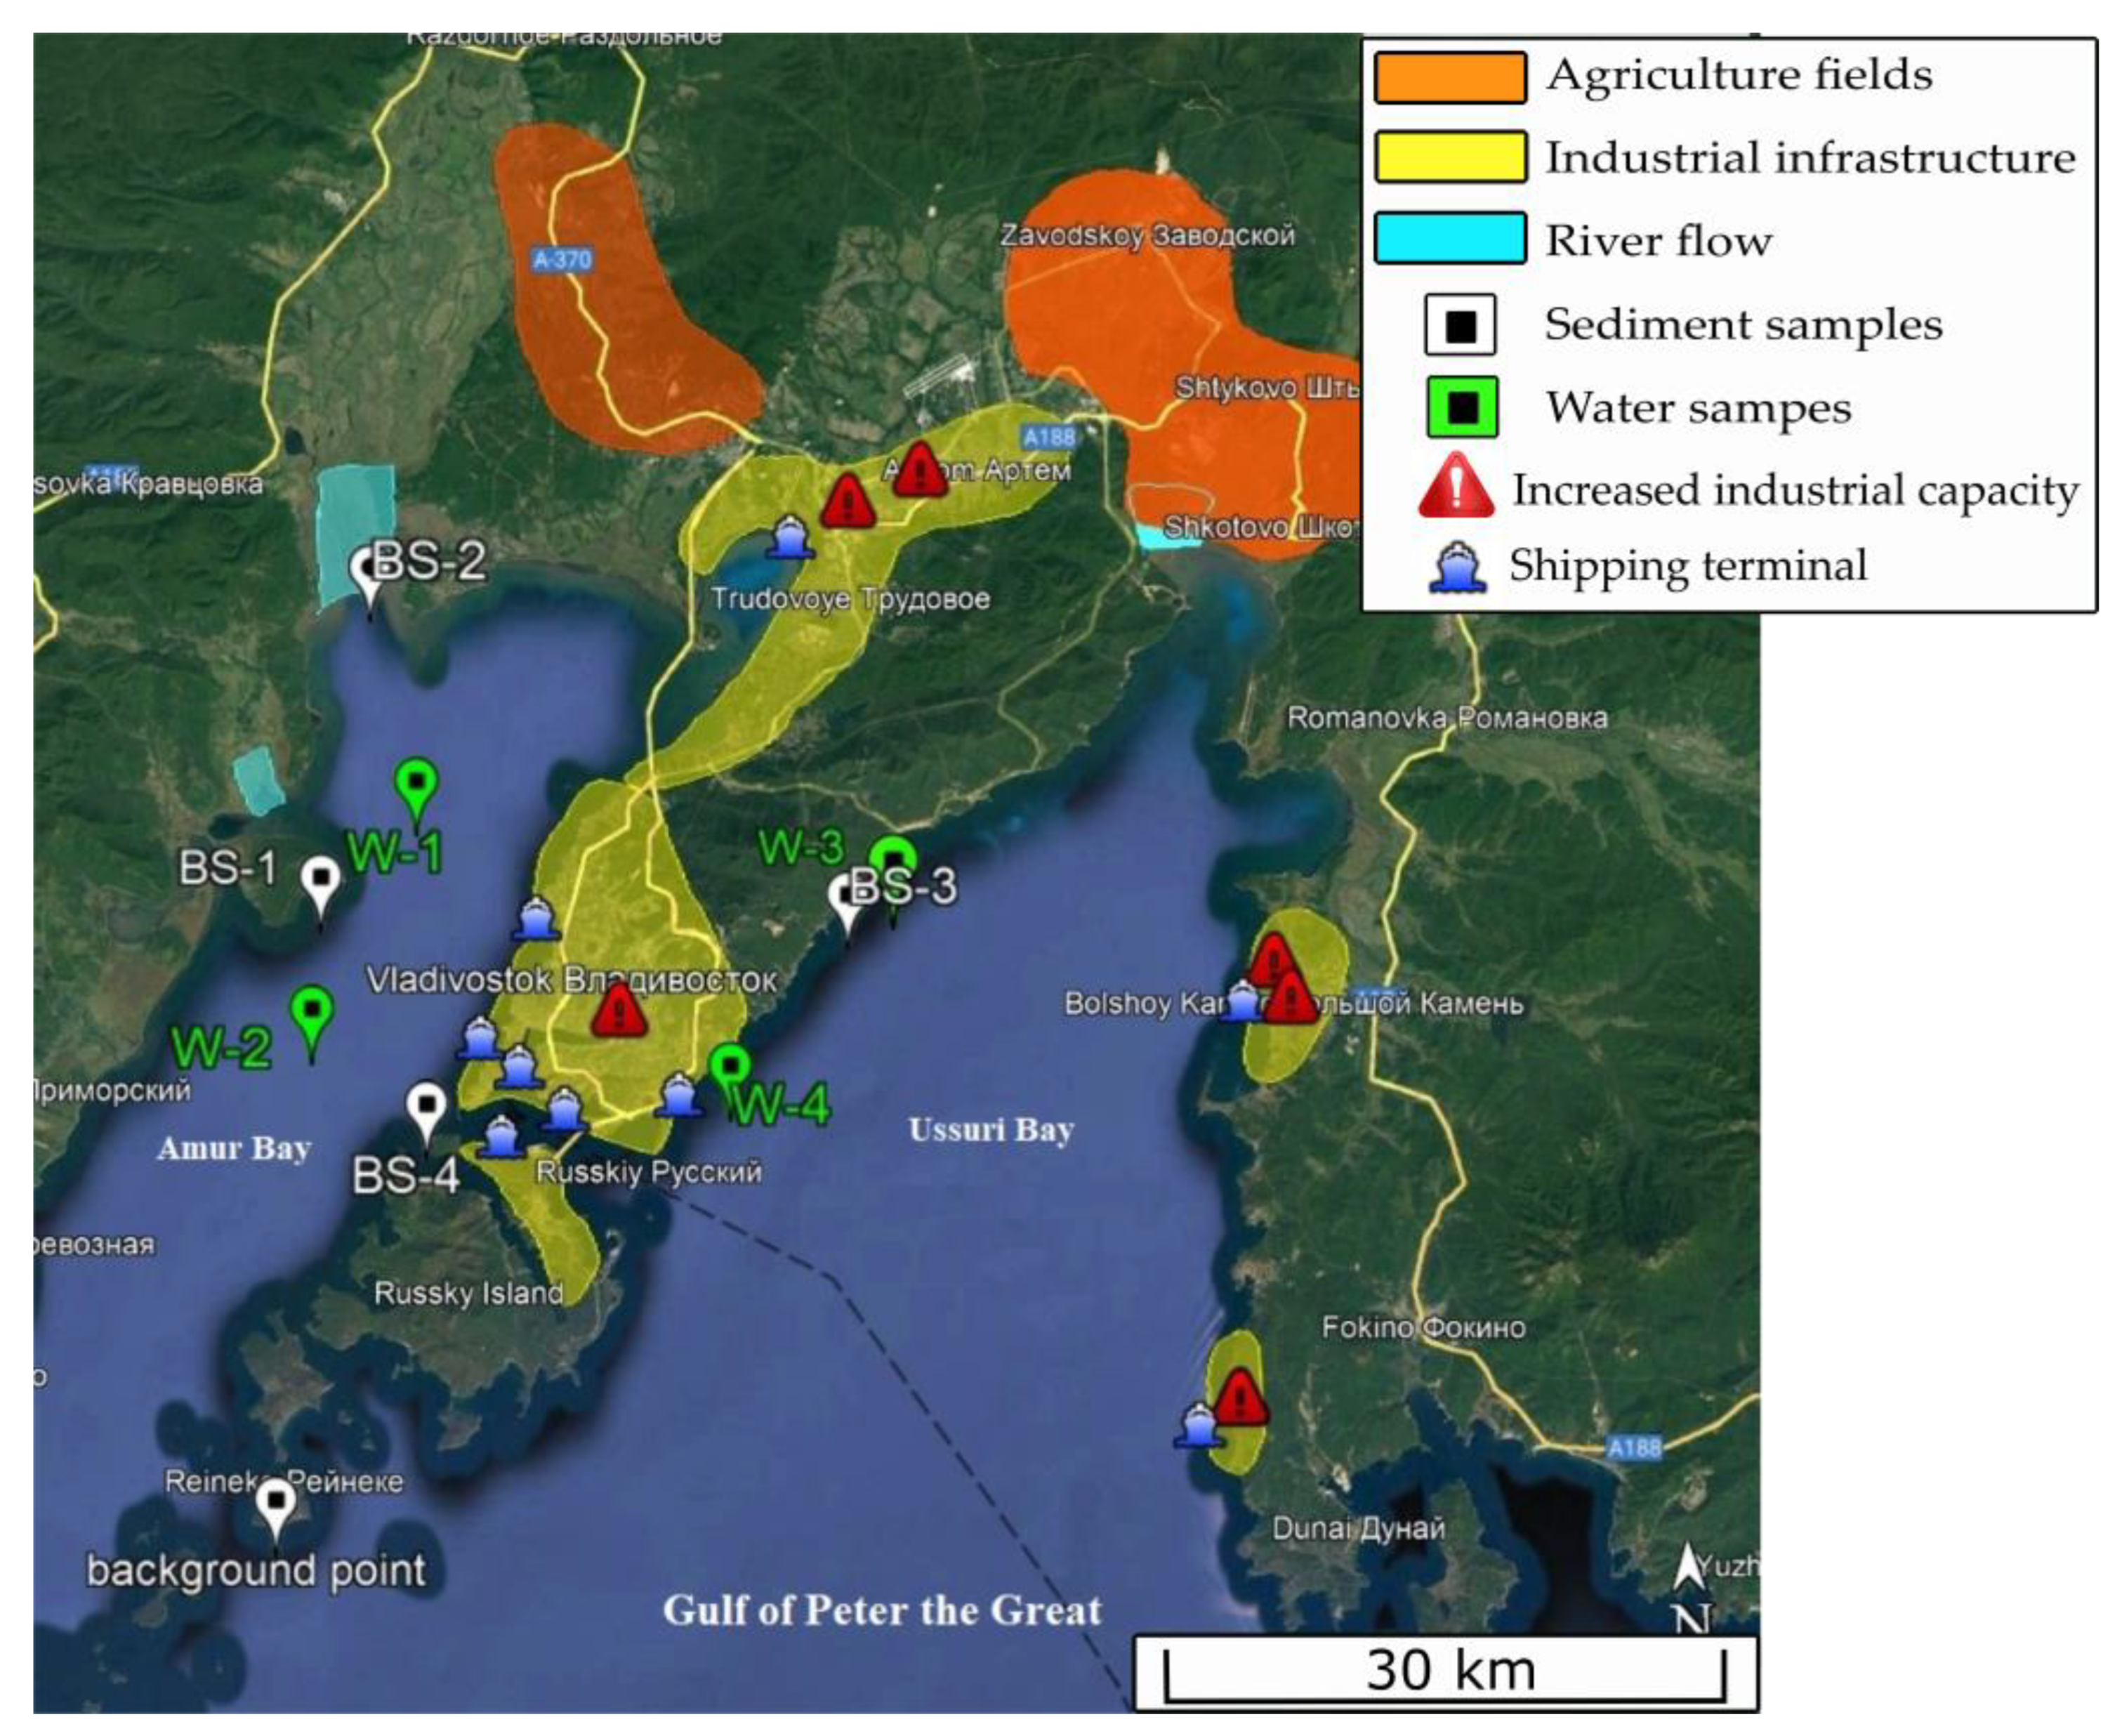
Peter the Great Bay is one of the most important structural, functional, and fishing parts of the coastal ecosystem of the Sea of Japan due to its vast water area, bays of different sizes, and substantially long coastline with a developed industrial infrastructure. The highest urbanization rate of the coastal territory is observed around Ussuri Bay and Amur Bay, which are the largest inland water basins occupying the northeastern part of the Bay and which wash the shores of the city of Vladivostok. The length of the coastline of both water basins varies between 50 and 60 km, whereas the maximum depth is 50–60 m. Only some parts of the wastewater from residential areas and industrial facilities of the city of Vladivostok are processed at treatment facilities. The greatest damage is caused by the enterprises of water and communal services. According to the estimates of the Unified State System of Information on the Situation in the World Ocean maintained in Russia, their share in wastewater discharged into Peter the Great Bay is 55%, in Amur Bay—72%, and in Ussuri Bay—49%. The damage of substances formed from fish processing and agricultural activities that have toxic properties in Peter the Great Bay accounts for 28%. The yearly influx of pollutants into the internal bays of Peter the Great Bay is 4.82 g/m
3 of seawater in Amur Bay, and 269.2 g/m
3 in Zolotoy Rog Bay. According to expert estimates, the actual volumes of annual releases of certain pollutants into the waters of the bay are many times higher than the corresponding estimates of state statistical reports. Therefore, at analyzing the state and causes of pollution of water areas, it is necessary not only to consider the volume of wastewater or other pollutants, but also to critically approach the information itself. The coastline of Amur Bay formed by islands, shallow spits, and sand bars contributes to the formation of heterogeneous hydrological conditions, which is reflected in the sedimentogenesis of the bay. The largest river in the south of Primorsky Krai (Razdolnaya River) flows into the upper part of Amur Bay, the waters of which are carried into the bay by municipal wastewater from the cities of Suifenhe (PRC), Ussuriysk (RF), and a number of small rural towns, as well as water from forest lands and agricultural fields of the water catchment area. The total solid flow of the river is 462 thousand tons with an ionic flow of 157 thousand tons [
16]. In this part of the bay, fresh and salty seawaters are mixed, which leads to the continuation of flocculation processes and the formation of Fe/Mn oxides and hydroxides. In addition, the water saturates with biogenic elements, which contributes to a high degree of eutrophication of the waters of Amur Bay [
17], as well as pollution with various toxic substances.
On the shore of Ussuri Bay, there is a landfill of household solid waste (HSW) in Vladivostok which was recultivated in 2012, which is a source of strong local pollution of the marine environment with heavy metals [
18,
19]. In addition, the water area accumulates trace elements coming from the Artemovka River flow surrounded by agricultural land, as well as from the sewage of Bolshoy Kamen, which hosts a ship repair yard.
Many scientific papers have shown that Amur Bay and Ussuri Bay are among the most polluted areas of Peter the Great Bay [
20,
21,
22]. This situation was observed starting from the 1990s, which was associated with the increased development of industry [
23]. Here, in 1980, the content of Zn, Cu, Pb, Hg, and Ni increased 1.5–5.0-fold as compared to background concentrations corresponding to the period before 1900 [
24]. This was followed by a decline in industrial volumes since 1990 that contributed to the improvement of the environmental situation [
25] and decrease of the concentrations of heavy metals in water [
9,
26,
27]. In the period until 2012, there was a gradual self-purification of marine waters, accompanied by a 2–8-fold decrease of the content of HM in bottom sediments, except for Cu and Cd, which could be due to the reduction of the discharge of household waste into the aqueous environment [
19]. The recent studies (2019–2021) showed that the contents of some elements, for example, Mn, Ni, and Pb, did not virtually change and equaled to about 340, 30, and 40 mg/kg, respectively, unlike Cu and Zn, where the content of which increased disproportionately over the years and equaled to 90 and 210 mg/kg, respectively [
28]. Here, the increased content of heavy metals could be due to the fact that they enter aqueous ecosystems along with the allochthonous surface runoff as part of highly dispersed particles of suspensions, as well as a result of the situation that most of them are typomorphic elements. The effect of the monsoon climate and tropical typhoons prevailing in the warm season on the shelf zone is accompanied by a change in sedimentation, as a result of which the amount of BS carried out by rivers in both bays increases by many times. Humus substances containing chemical elements, HM in particular, accumulated by hydrobionts and plants as a result of the life cycle, affect the BS composition of water areas, which also contributes to changes in the chemical composition and migration of elements in the aqueous medium. A number of studies [
29,
30] show a significant excess of the contents of Fe, Ni, Si, Zn, and Pb in green and brown algae, which is, probably, due to atmospheric precipitation and secondary pollution from bottom sediments.
The basin of Lake Khanka (Xingkai) and the lake itself are characterized with a rich bioresource potential and are of great international importance as a territory preserving the unique biodiversity of Northeast Asia, since it is a key part of the Asian migration route of birds, and, also, of considerable interest from the perspective of the economy of the Northeast of China and the Russian Far East. The lake was formed as a result of the destruction and sinking of the earth’s crust. The lake area ranges from 3940 to 5010 km2, reflecting fluctuations in precipitation between seasons and years. The average and maximum depths of the lake are 4.5 and 10.6 m, respectively. The relief of the lake’s catchment basin is characterized by a transition from mountain ranges of medium-mountain and low-mountain relief to a zone of mounded and hummocky relief and, as a consequence, to high and low accumulative plains. In general, the basin is quite flat, especially in the northern and eastern parts, which contributes to the complex hydrology of the area. The main basin contains approximately 23 rivers flowing into the lake, 8 from China, and 15 from Russia. The hydrological regime of Lake Khanka and its capacity characteristics are determined by natural (precipitation, river runoff, evaporation from the lake’s water surface) and anthropogenic (economic activity in the lake’s catchment area and the transfer of runoff) factors.
According to the background hydrochemical composition, the waters of the lake and the rivers of its basin belong to the Far Eastern type, which is characterized by a small amplitude of fluctuations in the amount of dissolved salts over time and the absence of a clearly expressed relationship between flow rates (levels) and mineralization, which generally varies within 0.06–0.12 g/dm
3. Unlike the lake, the mineralization of the waters of Peter the Great Bay varies in the range 28–33 g/dm
3. The water of the lake and the rivers of the basin belong to the bicarbonate-calcium type. The pH value of the lake water varies in the range of 7.4–7.6 in summer and drops slightly in winter (7.0–7.2) [
31].
The main problem in the state of the surface waters of the Lake Khanka basin consists in their pollution with biogenic substances. The trophic nature of water basins characterizes the content of biogenic elements, while the distribution of pollutants in the lake is uneven. The area of maximum biogenic pollution refers primarily to the area adjacent to the mouth of the Spasovka River [
31].
A substantial contribution to the pollution of the basin is made by wind erosion of agricultural lands of the Chinese territory of the basin. According to Chinese experts, about 1115 km
2 of land undergoes wind erosion of soils on the territory of China. On the arable land, erosion reaches up to 2 mm per year, which is almost 30,000 tons per 1 km
2 per year. According to preliminary estimates, total soil losses in the Chinese sector reach 235 × 10
4 m
3 per year. With this volume of soil, about 5 × 10
3 tons of nitrogen compounds are lost, the same amount of phosphorous compounds, and up to 4 × 10
4 tons of potassium compounds. As for the state of lake waters, the waters of the Little Khanka are generally more polluted by the main macro components than the waters of the main Lake Khanka [
32]. The ecological situation in the Lake Khanka basin is of a primary concern. Regular discharge of poorly treated or not treated wastewater from agricultural and industrial enterprises constitutes the main anthropogenic factor that adversely affects the environmental situation. Sewage spills also often occur due to the deterioration and damage to the water supply and sanitation networks of local residential areas. As a result, pollutants enter the soil, creeks, and eventually the lake. Territories of the Lake Khanka water basin on the Russian side were actively developed for agricultural purposes over the past 10 years. The areas of cultivated land increased, so did the volumes of fertilizers and chemical crop protection products used in these areas. In this regard, the assessment of the current state of the lake’s environment is an urgent task [
31].
The authors of [
33] stated that most HM dissolved in water (Al, Cr, Mn, Fe, Co, Ni, Cu, Zn, As, Cd, and Pb) were characterized by seasonal fluctuations in concentration, which is related to changes in hydrological and hydrochemical conditions depending on the time of year. The highest concentrations of Mn, Fe, Pb, and Zn were observed, and their average values over the entire water basin equaled 1.4, 0.4, 0.03, and 0.035 mg/L, respectively. Here, the increased contents of Mn and Fe could be related to the fact that these elements were of the terrigenous origin, while the increased content of the rest probably indicated the influence of the discharge of household and industrial wastewaters.
Characteristic features of the lake’s water consist in its high turbidity and high content of BS in it from the end of March to the end of October, while, during freezing in winter, their content drops to 5–11 mg/dm
3 [
31]. It was established that the content of HM in BS was inversely proportional to the BS amount [
33]. For instance, in the coastal southern and southeastern parts of the lake, where the amount of BS was the lowest, the maximum Mn content was observed, which equaled to 6000 mg/kg. Another characteristic feature is a significant difference of HM between the indicators in water and BS. With a minimum content of metals in water, their values in BS exceed 10–100-fold and are equal to 32,300 mg/L for Fe, 28,000 mg/L for Al, 70 mg/L for Cu, 46 mg/L for Cr, 68 mg/L for Ni, 125 mg/L for Zn, and 41 mg/L for Pb.
Al and Fe are the main structure-forming elements in the suspension particles, which are formed as a result of the destruction and weathering of rocks, and, therefore, they enter into Lake Khanka as a terrigenous drain. As for the remaining elements, the ways of how they enter the aquatic environment and the distribution mechanisms in the BS composition are not completely clear and require additional research. Another issue is the process of studying the bottom sediments of Lake Khanka, since its peculiar bottom structure and relatively shallow depth does not allow the use of traditional oceanological equipment for core sampling.
Table 1 presents the results of the analysis of BS in the water basins of Amur Bay, Ussuri Bay, and Lake Khanka regarding the HM content. The presented data indicate the constant variability of the HM concentration, which is associated with both hydrological atmospheric changes and migration features of these elements.
The objective of the present work was to establish the dependence of the HM content in the bottom sediments of seawater and freshwater basins on their chemical form, as well as the concentration in the water, and the vertical distribution in the columns of bottom sediments. To do this, the following tasks were solved: assessing of the distribution of HM both on the surface layer of bottom sediments of the water bodies and on the vertical profile taking the sedimentation rate into account; establishing the features of sedimentation processes of the water bodies; performing comparative analysis and establishing the features of horizontal and vertical distribution of HM in seawater and freshwater basins of regional and international strategic importance, and assessing the ecological and geochemical state of the studied bottom sediments.
3. Results and Discussion
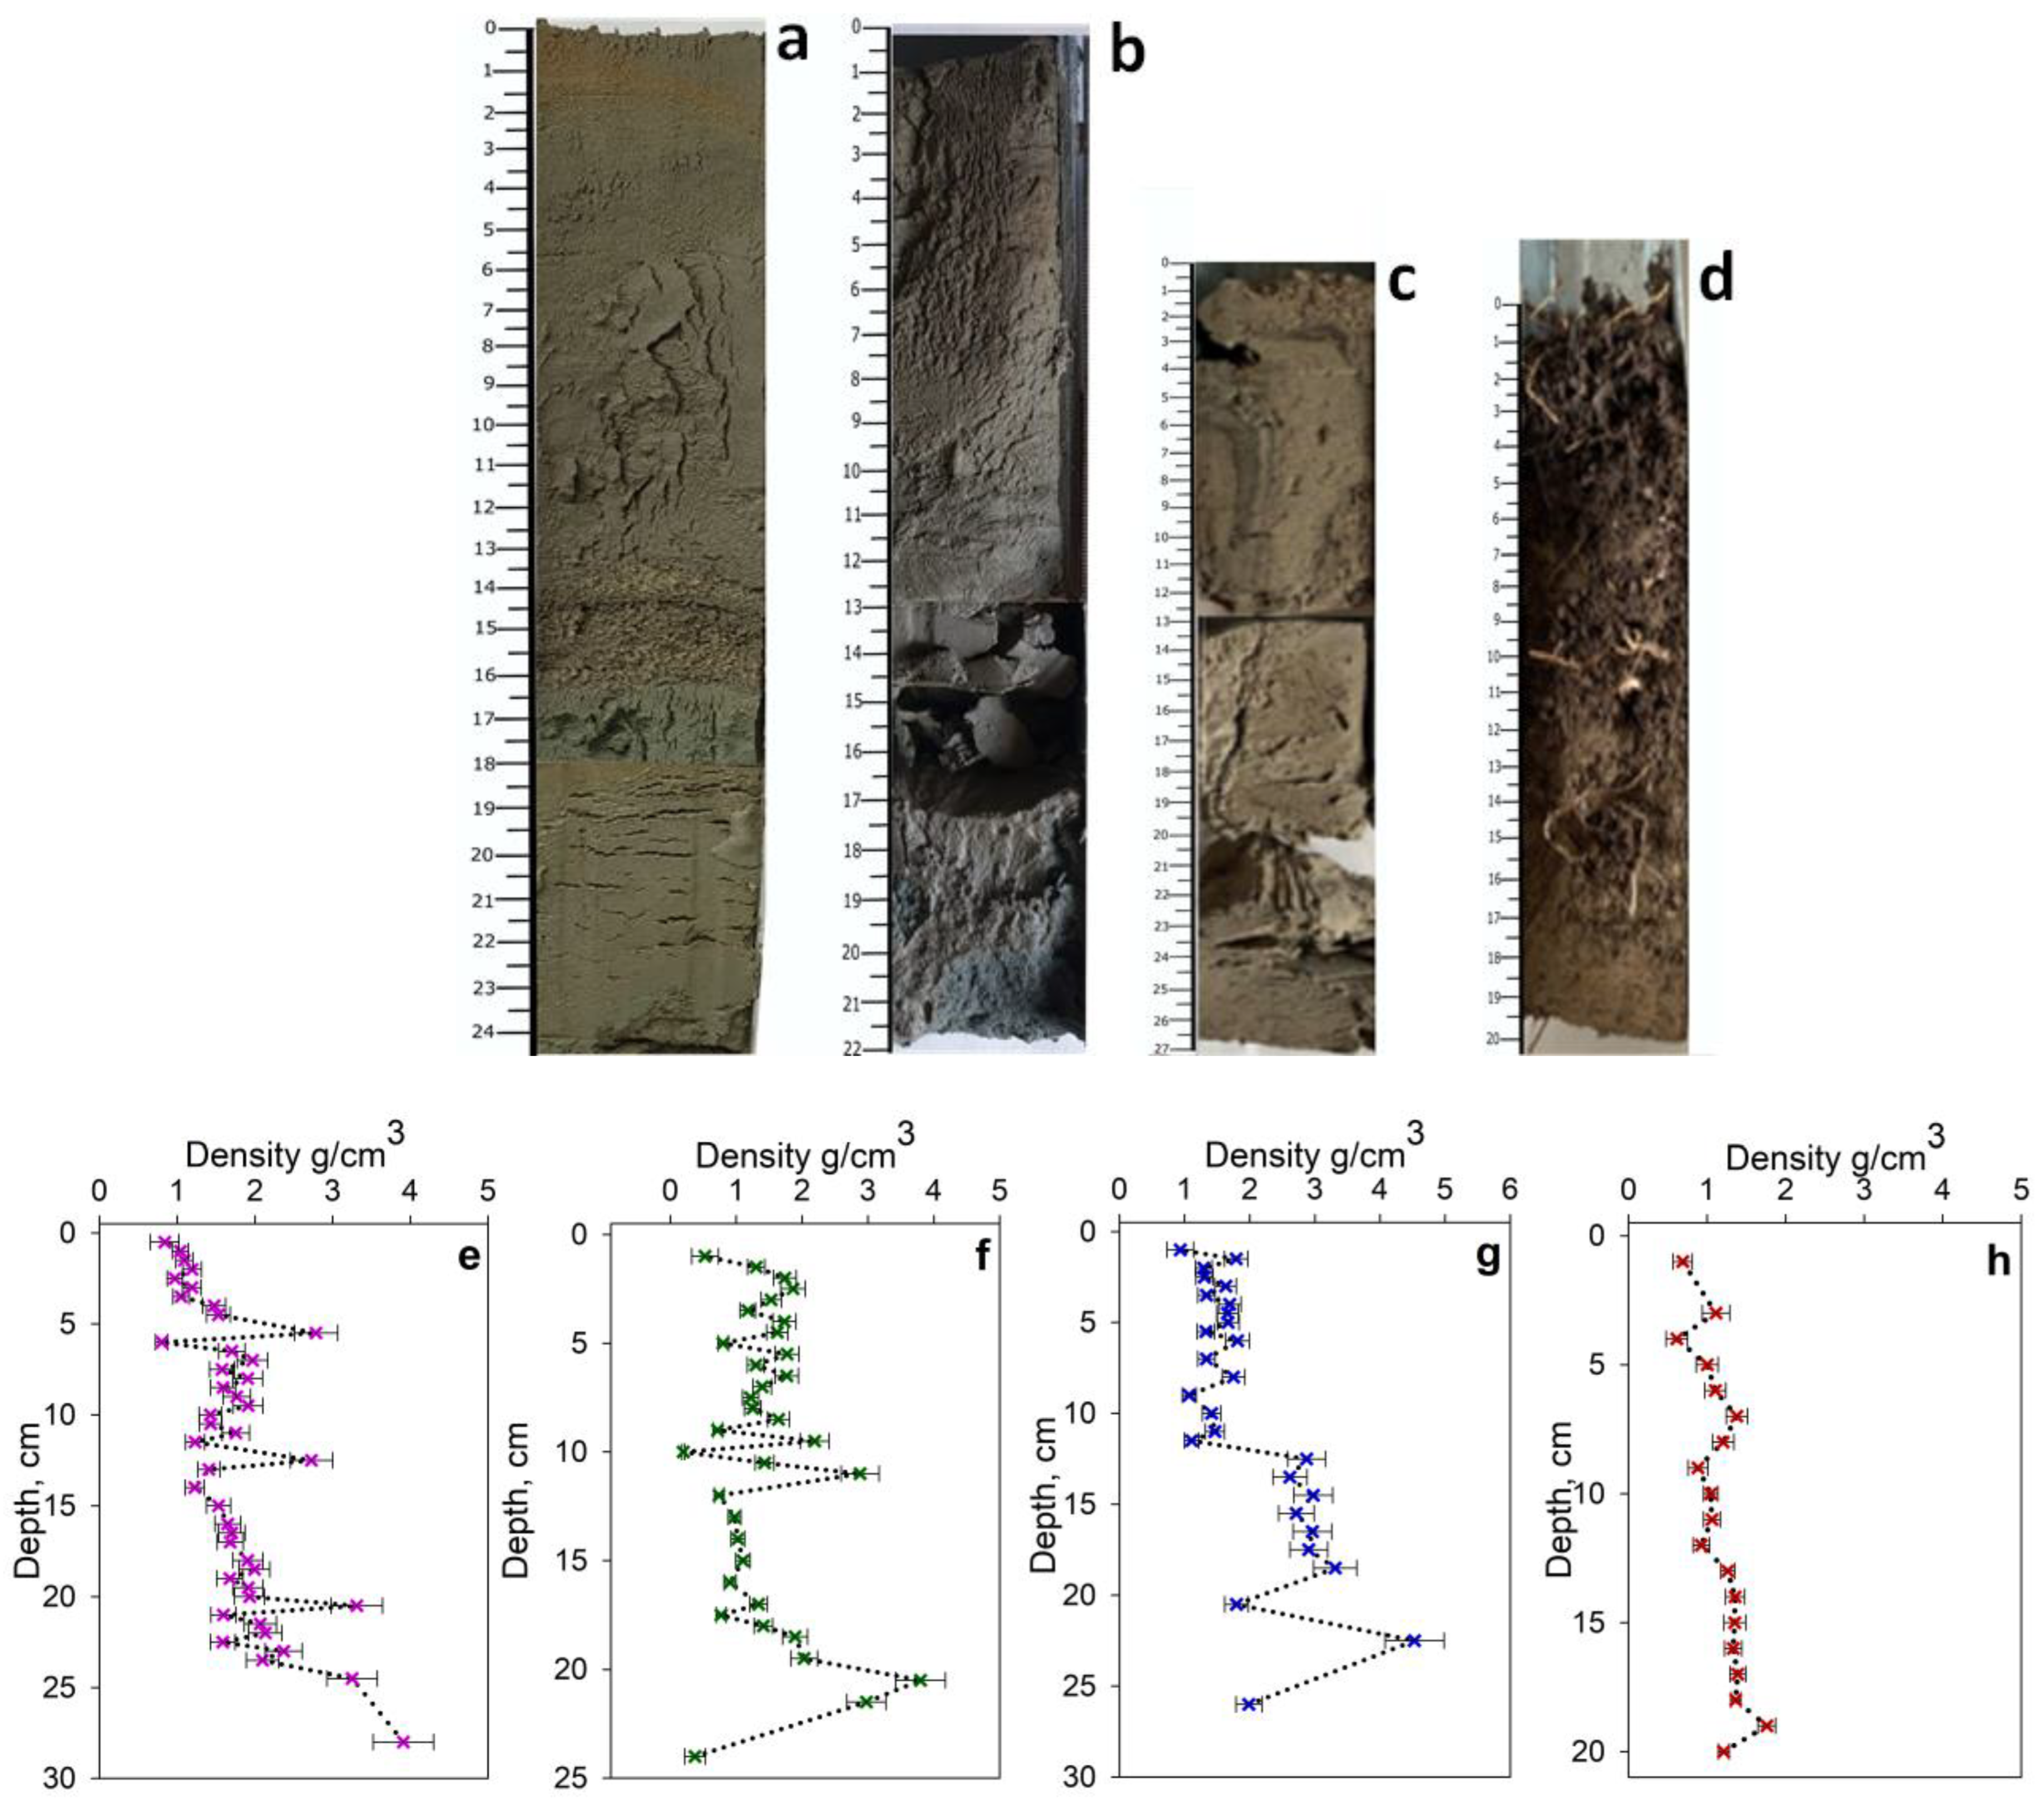
The cores collected in Peter the Great Bay are presented in the form of a mixture of sandy and chemogenic (clay) deposits, while the latter are predominant in the waters of Amur Bay (
Figure 1), which is reflected in the oiliness of the samples and a pungent smell of hydrogen sulfide. Visually, the composition of BS can be divided into several horizons. In particular, the BS-1 and BS-2 samples (
Figure 1a,b) are characterized by an increased content of sapropel, which begins with a dense compressed layer (0–7 cm), with a partial admixture due to the content of sand particles (7–17 cm), and the transition to clay-like sediments of light (17–22 cm) and heavy (22–40 cm) types. The BS-3 sample (
Figure 1c) was taken from Ussuri Bay and had a characteristic terrigenous origin, which is reflected in the predominance of fragmental rocks (0–10 cm) with a transition to heavy clay-like sediments (10–30 cm). The BS-4 sample (
Figure 1d) has a composition similar to the samples from Amur Bay except for the upper layer (0–5 cm), the composition of which is represented by calcareous clay silts due to the high content of bivalve mollusk remains. Annealing of various horizons of the BS profile to 650 °C was accompanied by a decrease of the sample mass by 3–7% (Ussuri Bay) and 9–13% (Amur Bay). A decrease of the sapropel content in BS-3 was accompanied by an increase in the density of horizons by 1.5–2 times, unlike other BS that had a value of about 1.2–1.5 g/cm
3 (
Figure 1g). Here, the sediment density is rather uniform throughout the profile, which indicates a uniform sedimentation and the absence of abnormal influence of natural or anthropogenic factors on this process.
Figure 2 shows the BS cores from Lake Khanka (Xingkai), as well as soils collected close to the coastline (
Figure 2d). Unlike the seawater BS, all samples from freshwater basins have a terrigenous origin and are presented in the form of compressed sand and thin clays, the layers of which are probably formed due to grain flows. All the BS samples are characterized by separation into layers of light brown sand (0–2 cm), dark gray clay (2–13 cm), dark clay (13–14 cm), coarse-grained sand with foreign inclusions (14–16 cm), and clay with iron oxide inclusions (16–25 cm). The L-2 sample (
Figure 2b) is characterized by an increased content of clays. It was found that the vertical sediment density increased with the transition to deeper horizons (
Figure 2e–g), which indicated an increase of the rate of sedimentation in recent decades due to the rise in water levels during increased precipitation, accompanied by the expansion of the wetland area adjacent to the lake. The proportion of the organic component established during the annealing process was 2–3% and 4% for the BS and soil, respectively. The collected sample belongs to the meadow texture-contrast soil. This type of soil is characterized by a powerful layer of organogenic horizon (up to 18 cm) of dark gray color of a strong fine-grained structure, abundantly permeated with grass roots and soil animal tracks. The boundary to the underlying horizon has a flowing shape. The next horizon demonstrates signs of gleization, in our case, it is slightly carbonaceous and of brownish-ochre color (
Figure 2d,h). The soil is rich in nutrients such as ozone and phosphorus.
3.1. Assessment of the Pollution Level
To establish the ecological state and the regional geochemical background, the average HM content in the upper layer of the sea (
Table 4) and freshwater BS (
Table 5) was calculated. The obtained values of the HM content in the upper 5 cm of an undisturbed BS profile were used for the calculation. The average values of concentration of metals in the sea sediments in the environment unaffected by economic activity at the station on Reyneke Island (Peter the Great Bay, Sea of Japan (
Figure 1,
Figure 2 and
Figure 3) for the period 1982–2002 [
34,
47] were used as background levels of the concentration of metals.
It was established that the concentration values of all HMs in the BS of Peter the Great Bay exceeded the background [
34,
47] and lithosphere [
43] values by two or more times (
Table 3). The average values of the concentration of elements decrease in the following row: Fe > Cu > Cr > Zn ≥ Pb > Mn > Ni.
Figure 3 shows a map of the estimated pollution sources established according to the calculated concentrations of HM. The greatest excess of concentration was recorded for Fe across the entire water body of the bay, the source of which is probably organic and inorganic suspensions in the composition of river drains (green area,
Figure 3: Artemovka river, Razdolnaya river, Amba river). When exposed to a medium with pH > 6 and an elevated salt background, iron is transferred into the corresponding hydroxide forms [Fe(OH)]
2+, [Fe(OH)
2]
+, [Fe(OH)
3]
0. In the above water basins, this process is reflected by the increased turbidity of water in coastal areas, which is additionally amplified by wind stirring. Only a small part of particularly fine suspensions reaches the open part of the sea, while most of the solids and solutes are retained in the barrier zone. Thus, a decrease of the Fe content in the BS samples from Amur Bay from the estuary part (
Figure 3 BS-1) to the bay mouth (
Figure 3 BS-2) indicates a decrease in the influence of terrigenous runoff. This fact is also reflected in a decrease of the Mn content in these samples, the source of which, like Fe, is a terrigenous runoff. In comparison with the background values, there are excess concentrations of Cu, Zn, and Pb by 55, 22, and 37 times, respectively, in Ussuri Bay. The excess content of these HM may be due to the sewage discharge from the city of Vladivostok, a number of large enterprises and factories located on the shore of the water area (
Figure 3, yellow areas), and extensive agricultural land (
Figure 3, orange areas). The following should be taken into account, particularly, a landfill of household waste located in the suburbs of Vladivostok and preserved in 2012 [
11,
12], and the BS-3 sampling points, capable of supporting the flow of HM entering seawater for many years with subsequent accumulation in BS. The 2–4-fold increased HM content in the BS-1 and BS-2 samples could be due to atmospheric precipitation, seasonal variability, and gradual self-cleaning of the bay, which has been observed over the past 20 years after the decline of industrial production [
26]. Despite the fact that the water area where the BS-4 sample was taken was more closed and had no river drains, there was an increased content of HM in the BS, which could be determined by both the absence of internal flow and corrosion of military shipwrecks.
Bottom sediments of Lake Khanka were not studied before, since it was impossible to perform sampling using standard oceanological equipment due to the shallow depth of the water body, the constant variability of the bottom, and specific atmospheric and water weather conditions. In this regard, the established values of the HM content in the BS were estimated against the background of the Clarke number of the lithosphere [
43]. As can be seen from the data presented in
Table 3, the concentration values of all HMs exceed the limit values of the lithosphere, which indicates anthropogenic impact. The average concentrations of elements decrease in the following row: Pb > Cu > Mn > Fe > Cr > Zn > Ni for the lake sediments, and Pb > Cu > Mn > Fe > Zn > Cr ≥ Ni for the coastal soil (
Table 5). A significant excess of Pb in the surface layer was earlier recorded in 2018 [
48]; however, the concentration values presented were 2-3-fold less than the present ones and amounted to about 10–50 mg/g. The source of pollution in this area can only be possible river tributaries that have connecting channels with lead smelting and recycling enterprises, but there is no published information about this. Here, the values obtained in the soil from the coast can serve as a basis for establishing other sources of pollution. The highest values of Mn, Fe, and Cu were established for the L-3 sample, which is associated with terrigenous flow and, probably, with abnormally rich deposits of tin ores (
Figure 4 red region) [
49], the main minerals of which are cassiterite (SnO
2) and stannine (tin pyrite, Cu
2FeSnS
4) containing up to 13% Cu and 28% Pb. Zn and Pb can also be present in the form of impurity metals. The Zn content in the BS is almost two times higher than the value obtained for the soil (L-4), which may be due to atmospheric precipitation during the transfer of dust particles from a zinc ore mining site (
Figure 4 purple area). In addition, in the east of Primorsky Krai, one of the largest deposits of lead-zinc ores in Russia is located, which can also have an anthropogenic impact and contribute to an increase in background concentrations of Pb and Zn in soil and water bodies by means of weathering and transfer of dust particles with subsequent accumulation in the BS.
According to the calculated values of the
Kc concentration coefficient (
Table 4 and
Table 5) and the geoaccumulation index I
geo (
Figure 5), BS of Peter the Great Bay in relation to Cr, Mn, Fe, and Ni belong to the class of unpolluted and are depleted by these elements, with the exception of iron. In
Figure 5, dotted lines indicate the boundaries of the division of classes of the geoaccumulation index [
44]. Despite the depletion of the BS in Cu and Zn, their class varies from unpolluted to strongly polluted, depending on the water area of the probe, which is probably closely related to the diversion of urban spillway plants. At the same time, in relation to Pb, BS of both the sea area (
Figure 5a) and Lake Khanka (
Figure 5b) exhibits strong pollution with directly proportional enrichment of sediments. A distinctive feature of freshwater sediments is the wide area of Mn distribution, which allows classifying these BS from unpolluted to strongly polluted. There is also a moderately strong pollution of sediments by Cu.
3.2. Assessment of HM Content in the Core Profile
If we neglect the process of desorption of HM from the BS back into the aqueous medium, then, the sediments can be considered as the final stage of migration of pollutants. In this case, the influence of the surrounding anthropogenic and natural factors on the process of migration, deposition, and concentration of HM can be traced by analyzing the vertical profile of the BS.
The sedimentation rate in the BS samples was estimated by measuring the activity of factory-made radionuclides
137Cs and
210Pb
ex by the core depth (the maximum activity corresponds to the time of the most intensive nuclear weapons tests in 1963). In earlier studies, it was found that the sedimentation rate in the northern part of Amur Bay was equal to 7.2 mm/year in 1996 [
50] and 3.6–5.2 mm/year in 2015 [
51]. We found that, for the central part of Amur Bay, the calculated values are 1.6 mm/year [
52]. For Ussuri Bay, the sedimentation rate decreased 2–3-fold compared to Amur Bay and amounted to 0.45 mm/year. This fact directly depends on the number and volume of freshwater reservoirs flowing into the water basin, which are an order of magnitude smaller in Ussuri Bay.
Figure 6 shows the dependencies of the HM concentration in the core profile, where the greatest changes were observed, from the depth of the underlying layer to in the waters of Ussuri Bay and Amur Bay. It was established that the values of Fe and Mn concentrations in Amur Bay’s profile (
Figure 6, BS-1/BS-2) did not undergo changes up to a depth of 50 cm (for point BS-2), which approximately corresponds to 300 years, while the maximum concentration reaches the values of 760 mg/kg (
Figure 6b,i) and 120 mg/kg (
Figure 6c,j), respectively. This fact indicates that, despite the seasonal change in the amount of precipitation, the terrigenous flow of these metals does not change and is in equilibrium. Additionally, it can be indirectly concluded that the mineral or organic phase of metals does not undergo significant changes over time, otherwise there would be a process of de-manganation and de-ironing accompanied by a change in the concentration of HM in the BS profile and water, as a result of changes in the physical–chemical properties of the aqueous medium (pH, concentration of free carbon dioxide, dissolved oxygen, redox potential, sulfides, organic substances, hardness, total mineralization, dissolved gases [
53]).
In Ussuri Bay’s profiles (
Figure 6, BS-3), during the transition from 22 cm to 10 cm, an increase of the concentration of all the studied HM by two to three times is observed, which could be related to the period of active development of the territories and local industry. The subsequent slowdown in the industrial development rate since the 1990s could contribute to a decrease of the level of environmental impact, which is reflected in a consistent decrease of the concentration of HM in the upper 10 cm layer of the BS [
17,
27].
It was found that, during the transition from the estuary (coastal) zone of the river flow of the Razdolnaya River (
Figure 3, BS-2) to the central zone (closer to the outlet to the ocean,
Figure 3, BS-1), the concentration of biogenic metals (Ni, Zn, Pb, Cu) in the whole profile decreased 2–4-fold (
Figure 6, BS-1, BS-2), probably, due to the formation of their hydroxides and carbonates ([Ni(CO
3)]
0, [Ni(OH)]
+, [Ni(OH)
2]
0, [Zn(OH)]
+, [Pb(CO
3)]
0, [Cu(CO
3)]
0, [Cu(OH)
2]
0) in the area of mixing of freshwater and seawater followed by sorption on suspensions that prevent the distribution of HM over long distances as a result of the BS formation. The highest concentrations of these metals were recorded at the profile level of 36–48 cm for the near-mouth core (BS-2) and 24 cm for the central part of the bay (BS-1), which is approximately in the same time ranges. Here, the difference in the depth of the layer is compensated by the sedimentation rate, which in the BS-1 sample is approximately 1.5–2 times less than in BS-2.
Figure 7 shows the dependence of the HM concentration on the depth of the underlying layer of the BS in the water basin of Lake Khanka (sample L-2) and the profile of the coastal soil (-4). The distribution and concentration of HM in the samples L-1 and L-3 have a comparable shape and values and, therefore, were not considered in detail. It was established that the sedimentation rate in the core sampling area was about 0.43–0.50 mm/year [
52].
Chaotic fluctuations of concentrations of Cr and Pb are observed in the BS: from 0 to 180 mg/k (
Figure 7a,g), which is also reflected in the soil profile (
Figure 7h,n) with the addition of Ni (
Figure 6k). The highest concentrations were recorded for Fe and Mn, which are evenly distributed over both profiles. Minor deviations are probably related to the geochemical position of certain soils in the core profile. Here, the increased Mn content is determined by the constant allochthonous runoff and the fact that it is a typomorphic element. High content of Fe in the entire profile indicates the predominant presence of a fine grain fraction, as well as the intensive sedimentation of the suspended matter during the entire time. The same trend is typical for Amur Bay.
Comparable values of Cr and Zn concentrations in the BS and soil profile indicate an increased content of elements in atmospheric precipitation and natural runoff.
In general, the concentration values of Mn, Fe, Cr, and Pb in the soil profile exceed 2–6-fold the values obtained for the BS, which contributes to the accumulation of HM in them, at intensive release from sub-positions. This type of HM migration is characteristic of transeluvial and subordinate landscapes, accompanied by the removal of HM from the soil profile. Metals migrate both in dissolved form with ground runoff and mechanically, moving to the final links of landscapes: swamps, lakes, and sea bays [
54]. It is reasonable to suggest that the flow of lead into the lake began about 100 years ago and that it was associated with anthropogenic impact. The same assumption can be made about Ni. A peak of Zn content was detected in the soil profile at a depth of 6–7 cm. This was probably the result of the same anthropogenic influence, but more local, which did not affect the flow of Zn into the bottom sediments of the lake.
3.3. Phase Composition of the BS
To establish regularities of the horizontal and vertical distribution of HM in the pre-studied waters, the phase composition of these sediments was studied.
Figure 8 shows X-ray images reflecting the phase composition of the BS collected in Amur Bay (BS-1, BS-2) and Ussuri Bay (BS-3). The X-ray patterns are provided only for the upper centimeter layer, since the qualitative analysis of the phase composition of subsequent horizons is comparable to horizon No. 1.
A common feature of all the X-ray patterns consists in clearly expressed reflexes corresponding to different phases of silicon oxide (quartz, chalcedony, moganite). The source of silicic-oxygen minerals, the total content of which in the samples is 30–50%, are both coastal sand rocks and a river stream containing BB. It is worth mentioning that the presence of silicates with a developed surface morphology can be accompanied by active adsorption processes and concentration of heavy metals present in the composition of the soil, from freshwater and seawater when entering the liquid phase. However, additional studies are required to assess the qualitative and quantitative characteristics of this transfer. A significant part of the sediments is also represented by minerals such as albite (Na[AlSi3O8]) with an admixture of calcium, calcite (CaCO3), and ankerite (Ca(Fe,Mg)(CO3)2), which could be related to the presence of bicarbonate and contribute to the accumulation of iron. Albite is the most common pore-forming mineral of magmatic origin belonging to the class of aluminosilicates, its source can include underwater and terrestrial volcanoes of the Far Eastern coast, and the waters of the Sea of Japan, in particular. The phase of calcium carbonate, which is probably related to aragonite, formed as a result of the destruction of mollusk shells and is a biogenic accumulator of HM. As the depth of the incision increases, a directly proportional increase in the intensity of the halos corresponding to the ankerite is observed, which also affects the increase in the Fe content in the studied sections of the BS-3 sample. In addition, there are reflexes corresponding to rock salt and halite with cubic syngony, the presence of which is associated with the sample preparation process that results in crystallization of NaCl contained in seawater.
A significant difference in the phase composition is observed in the samples BS-1 and BS-2 (
Figure 8a,b) at a profile depth corresponding to the range of 17–50 cm, where the predominant phases were established for such relic minerals as hematite and maghemite, least of all quartz and moganite. At a profile depth of 45 cm, the phase of iron sulfide (FeS
2) was also identified; its formation can be associated with redox processes of decomposition of organic residues of biota and metal structures undergoing corrosion. The predominance of iron oxide phases coincides with the results of the elemental analysis shown in
Figure 6, and, at the same time, an increase of the values of other HM is also observed, which could be related to increased sorption characteristics of hematite and maghemite [
55]. In this case, maghemite and hematite can interfere with the processes of diffusion of HM back into the water.
In addition to calcium carbonate, the samples from Amur Bay also contain a phase of calcium sulfate (gypsum) of biogenic origin. The initial samples of BS contained the remains of shells of bivalve mollusks of various species.
Figure 9 shows X-ray patterns reflecting the phase composition of Lake Khanka BS (L-1, L-2, L-3). The presented patterns are provided only for the upper centimeter layer, since the qualitative analysis of the phase composition of subsequent horizons is comparable to horizon No. 1.
The phase composition of all the samples is represented mainly by quartz as part of the sand. Just like in the seawater BS, a group of widespread aluminosilicates, feldspars of igneous origin, albite (Na[AlSi
3O
8]), and anorthite (Ca[Al
2Si
2O
8]) with high contents of K and Ca impurities were identified. With an increase in the depth of the section, the intensity of the corresponding reflexes decreases, which is probably the result of changes in natural conditions and cataclysms (floods, wind, earthquakes, etc.) having a major role in the process of transferring and concentrating components. The presence of a large variety of freshwater bivalves and other mollusks in the water body, as well as an increased content of carbonates leads to the formation of calcium carbonate polymorphs, calcite, and aragonite. Iron was identified in the phase composition of ankerite (Ca(Fe,Mg)CO
3)
2), as well as an uncharacteristic phase for this region, ferrisanidine (KNa[FeSi
3O
8]) with possible admixtures of Al, Ti, Mg, and Na. Its formation was probably caused by the water migration of factory-made iron involved in subsequent biogenic processes. Here, the percentage of iron-forming phases does not change with depth. An additional contribution of iron to the phase composition to the lake could be made by intraplate volcanites and intrusions of mixed magmatic series lying at a distance of 20–80 km from the southern and western shores of the water body [
56]. The composition of these rocks includes minerals such as basalt, andesites, dacites, rhyolites, and their tuff-sedimentary rocks containing from 1 to 10% of Fe
xO
y, depending on the type of mineral.
3.4. HM in the Liquid Phase
Since the migration of heavy metals in water bodies directly depends on the features and mechanisms of the two-way transition of elements in the water–bottom sediment system, the contents of the base (
Table 6) and heavy metals (
Table 7) in the investigated aqueous objects were studied. The values of the content of base metals (
Table 7) in the seawater and freshwater basins correlates to regional data for many years [
19,
20,
21,
25,
28,
57]. On the contrary, the values of the HM content (
Table 7) demonstrate an excess compared to previous years [
20,
21]. In comparison with the maximum permissible concentrations of the Russian Federation (MPC), the World Health Organization (WHO), the US Environmental Protection Agency (US EPA), and environmental protection agencies of China and Japan, Peter the Great Bay has an excess of Mn—2-fold, Fe—2-fold, and Zn—3-fold. The ratio of the HM concentration to MPC in Lake Khanka is even less favorable, in particular, the excess of Mn is 79-fold, Fe—35-fold, Cu—2-fold, and Zn—3–4-fold, which is clearly determined by the closeness of the water basin and the lack of water exchange.
Figure 10 shows the curves of the dependence of migration and accumulation of HM depending on the metal and the water basin.
The interpretation of lgKd is reduced to the fact that the greater its value, the more intense the process of metal migration from water to bottom sediments is observed. The use of this characteristic within one season enables one to judge the rate of accumulation of a particular metal. In cases when the limits of the seasonal dynamics of HM allows determining the periods of their maximum content in bottom sediments, it is possible to predict the influence of the studied factors on the migration processes of metals in the water–bottom sediments system, which will be carried out and presented in our next study.
Studies have shown that, along with an increase of the pH of the liquid medium (
Figure 10), the migration rate decreases with the inverse proportionality of an increase in the accumulation of Cr, Ni, Cu, Zn, and Pb into BS from the aqueous medium. Among other metals, Pb undergoes sedimentation processes into BS most intensively, and the rate generally decreases in the following row: Pb >> Mn ≥ Ni > Cu > Zn > Fe >> Cr. The observed migration pattern for Mn and Ni is moderate.
Despite the increased content of Fe in the seawater and freshwater basins, the distribution coefficient has an almost minimal value, which could indicate the course of competing processes accompanied by the reverse migration of metal from the BS into the water. One of the affecting factors could be a change of pH of the solution in the area of mixing (dilution) of freshwater and seawater, which leads to desorption of cationic forms of HM from the surface of solid particles of suspensions or BS followed by the entry of metals into the water. The greatest effect is observed for the sea samples of Ussuri Bay (
Figure 10, BS-3). In natural water, which is a complex multicomponent solution, pH does not depend on the dissociation of its own water molecules, but mainly on the ratio of the amount of carbonic acid and HCO
3−, CO
32−, and, to a lesser extent, other ions. It follows that, in addition to the effect of pH on the distribution of HM between components in aquatic ecosystems, the effect of carbonate and bicarbonate ions of natural water must also be taken into account, which requires additional experiments.
4. Conclusions
A correlation between the HM concentration in water, BS, and their migration over the territories under study has been established. It was found that, along with the increase of pH of the liquid medium (freshwater and seawater), the migration rate decreased in reverse proportionality to the accumulation of Cr, Ni, Cu, Zn, and Pb in BS from the liquid medium. The intensity of the deposition process decreases in the following row: Pb >> Mn ≥ Ni > Cu > Zn > Fe >> Cr. By means of elemental analysis of Lake Khanka coastal soil, multiple surpassing of the contents of some HMs was established that promotes intensification of metal migration into the water and their accumulation in Lake Khanka BS.
It has been determined that BS of both water basins, as well as the Lake Khanka coastal soil, are enriched with Pb and depleted with Cr, Ni, and Zn. In addition, BS of seawater basins are characterized with increased coefficients of Fe and Cu accumulation, unlike freshwater basins, in which the predominant element is Mn. The latter is not reflected in the HM distribution profile, which indicates constant hydrological changes.
The main BS phase composition was determined by the XRD method. It has been demonstrated that the presence of iron oxide in the forms of magnetite and hematite facilitates ‘rigid accumulation’ of HM preventing their diffusion back into the liquid phase. A direct proportional dependence of the increase of the Ni, Cu, Zn, Fe, and Cr contents on the fraction of iron-oxide and aluminosilicate and carbonate phases preserved over the whole core profile has been established. Analysis of surface BS of seawater areas has demonstrated that the spatial migration elements supplied from the coastal areas is limited and expressed in the decrease of HM concentrations along with removal from the coast. It was shown that, at the transition from the near-estuary (coastal seawater) area of the runoff of the Razdolnaya River to the central one (closer to the outflow to the ocean), the HM concentrations decrease 2–4-fold.
The ecological conditions of the territories under study have been analyzed. According to the calculated values of Kc and Igeo of BS of Peter the Great Bay, as regards Cr, Mn, Fe, and Ni, these belong to the class of non-polluted, just like those of Lake Khanka. The main contribution is provided: Cu (Kc ≤ 54.6), Zn (Kc ≤ 22.2), and Pb (Kc ≤ 37.2), whose source includes factory-made effects requiring special attention.
To sum up, the regularities of the spatial distribution of HM in the water areas of Peter the Great Bay and Lake Khanka related to the nonuniform accumulation of Fe and Mn in BS, whose phase carriers are clay fractions and aluminosilicate suspended particles as well as organic substances supplied by the terrigenic runoff, have been established. It has been demonstrated that one can judge, from the gradual increase of contents of Fe, Mn, etc., in BS samples from the near-estuary part to the bay narrow entrance, the effect of the terrigenic runoff on different parts of the water area, with the further determination of the boundaries of possible pollution.

 ,
, 


