1. Introduction
The SCS–CN method, developed by the U.S. Soil Conservation Service [
1], has been widely used in Korea for estimating the volume of effective rainfall or direct runoff [
2,
3,
4,
5]. The main parameter of the SCS–CN method is the curve number (CN), which represents the hydrologic infiltration characteristics of a basin. Additionally, the ratio between the initial abstraction and the maximum potential retention and the criteria for dividing the soil moisture condition are, importantly, also considered in the application of the SCS-CN method [
6,
7,
8].
Finding a representative value of CN has been a main issue in the application of the SCS-CN method [
9,
10,
11,
12]. Estimation of CN was especially tricky in a heterogeneous basin [
9,
13]; the variation in CN depending on the total rainfall amount as well as the soil moisture condition was also evaluated [
7,
8,
14]. Applications of the SCS-CN method to basins with somewhat different characteristics from ordinary basins have also been reported globally. Application of the SCS-CN method may be different in a steep mountain area [
15,
16,
17], in a dry region [
18,
19,
20], or in a volcanic area [
21,
22,
23,
24]. This study is related to this exceptional case, i.e., that of application of the SCS-CN method to the volcanic Jeju Island, Korea.
Recently, Kang and Yoo [
2] proposed a somewhat different setup for the application of the Soil Conservation Service–Curve Number (SCS–CN) method to Jeju Island. Based on the analysis of rainfall events observed in the Hanchun basin, Jeju Island, they showed that the application of the conventional approach outlined in the guidelines published by the Ministry of Environment [
3] could lead to an overestimation of effective rainfall. Kang and Yoo [
2] recommended using a new classification rule for the hydrologic soil group, as proposed by Lee et al. [
25]. This new classification rule was found to significantly decrease the CN, compared to previous rules such as those proposed by the Rural Development Administration (RDA) [
26]. Additionally, they recommended that 0.3 be considered the ratio between the initial abstraction and the maximum potential retention. More interestingly, the criteria for AMC (antecedent moisture condition) were determined using an antecedent five-day rainfall amount (P5) of 100 mm for the dry condition, and 400 mm for the wet condition.
In comparison with the newly set SCS-CN method by Kang and Yoo [
2], the guidelines of the Ministry of Environment [
3] are somewhat extraordinary. The guidelines for rainfall runoff analysis in Korea, published by the Ministry of Environment [
3], include a section for Jeju Island. Regarding the SCS-CN method, the guidelines recommend using the old classification rule for hydrologic soil groups (developed by the RDA) [
26], which provide a rather high CN value. On the other hand, a ratio of 0.4 between the initial abstraction and the maximum potential retention is proposed in order to compromise the large initial abstraction of Jeju Island. Finally, the guidelines recommend no use of the antecedent moisture condition (AMC) for adjusting the CN value. As a result, only the AMC-II condition is applied to any rainfall events, regardless of the soil moisture condition. This also serves to consider a rather low portion of the effective rainfall, regardless of most of the rainfall events being categorized into the AMC-III condition based on the generally accepted criteria for AMC in the inland area of Korea.
As the difference between Kang and Yoo [
2] and the Ministry of Environment [
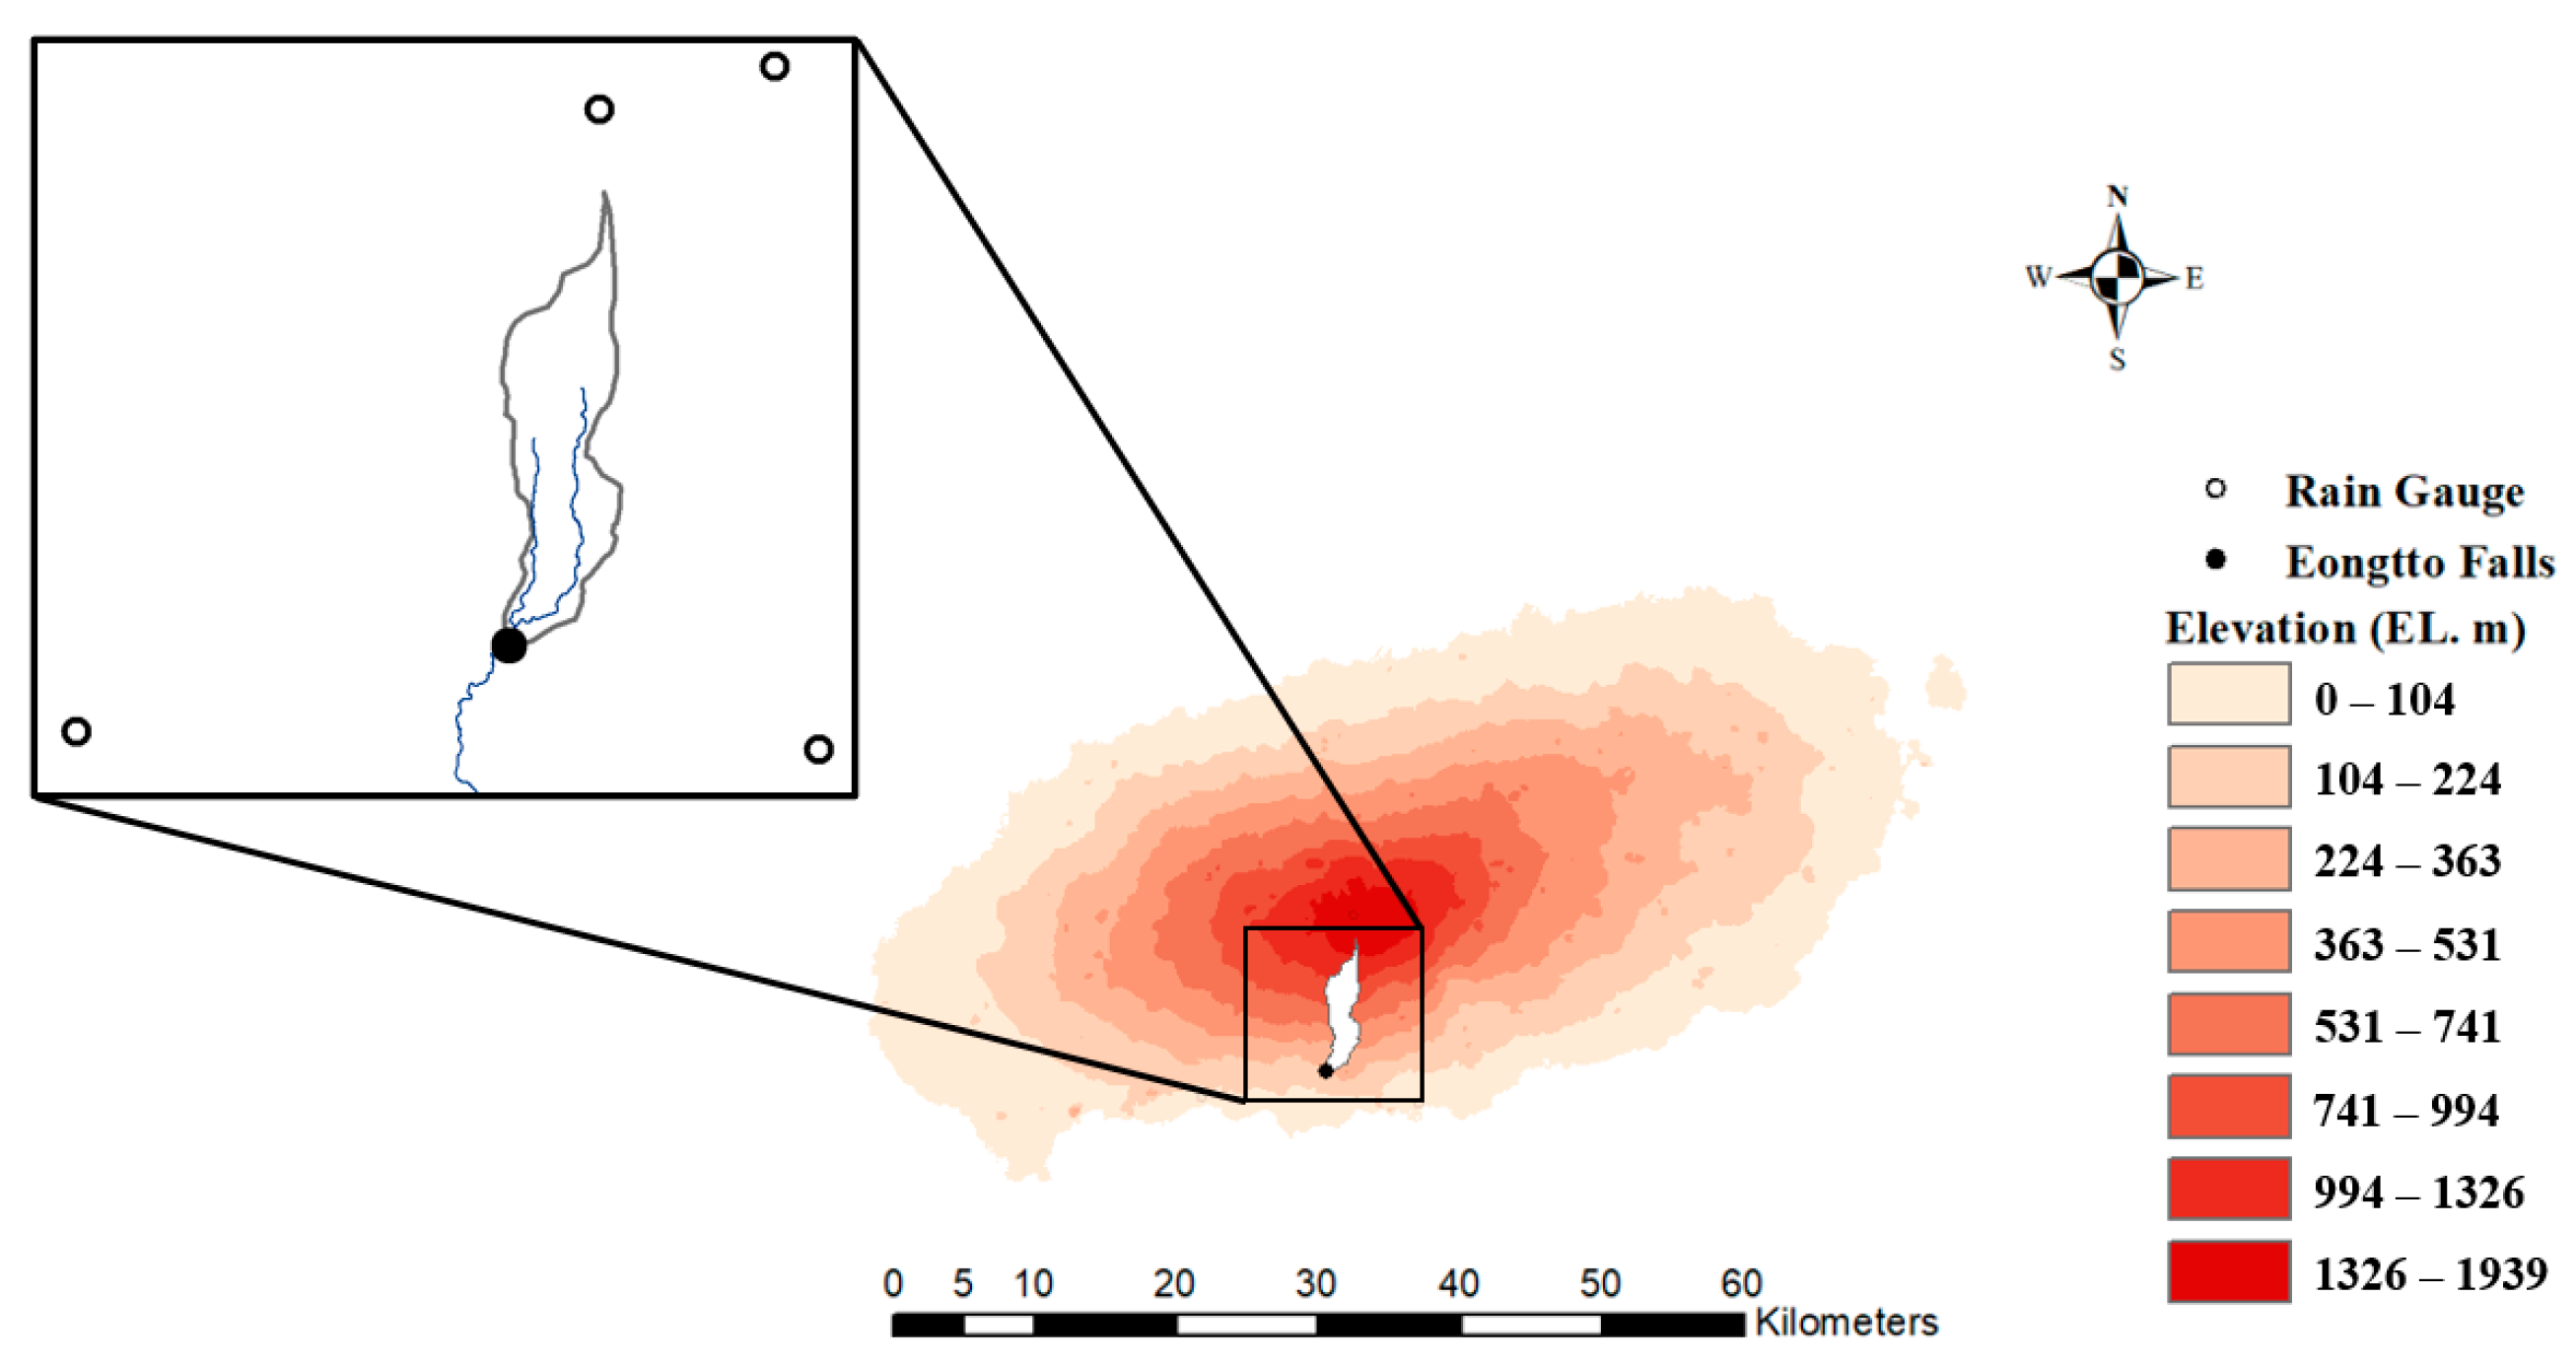
3] is so large regarding the application of the SCS-CN method, more application cases are required for their comparison. However, somewhat systematic and continuous runoff measurements applicable to this comparison were not available for Jeju Island. This limited measurement is partly due to the fact that most streams on Jeju Island are dry. Jeju Island is covered in porous basalt, which has a high infiltration capacity [
27,
28,
29]. The infiltrated water fills the groundwater, most of which flows out near the seashore. That is, the base flow is observed only in the downstream region near the seashore. In the upstream and midstream regions, runoff occurs only when the amount of rainfall is quite large [
29,
30].
As the upstream and midstream regions of Jeju Island are very steep and stepped, large waterfalls are sometimes formed during heavy rain [
31,
32]. Among them, the most famous is Eongtto Falls, which is located in the Akgeun stream. The Eongtto Falls waterfall occurs only when the rainfall amount is quite large; the tourist information board explanation is that the waterfall occurs only when the total rainfall amount is greater than 70 mm. No justification for this 70 mm threshold can be found, but the figure is assumed to be based on the long-term experience of the people living around the waterfall. No runoff data are available for the Akgeun stream, either.
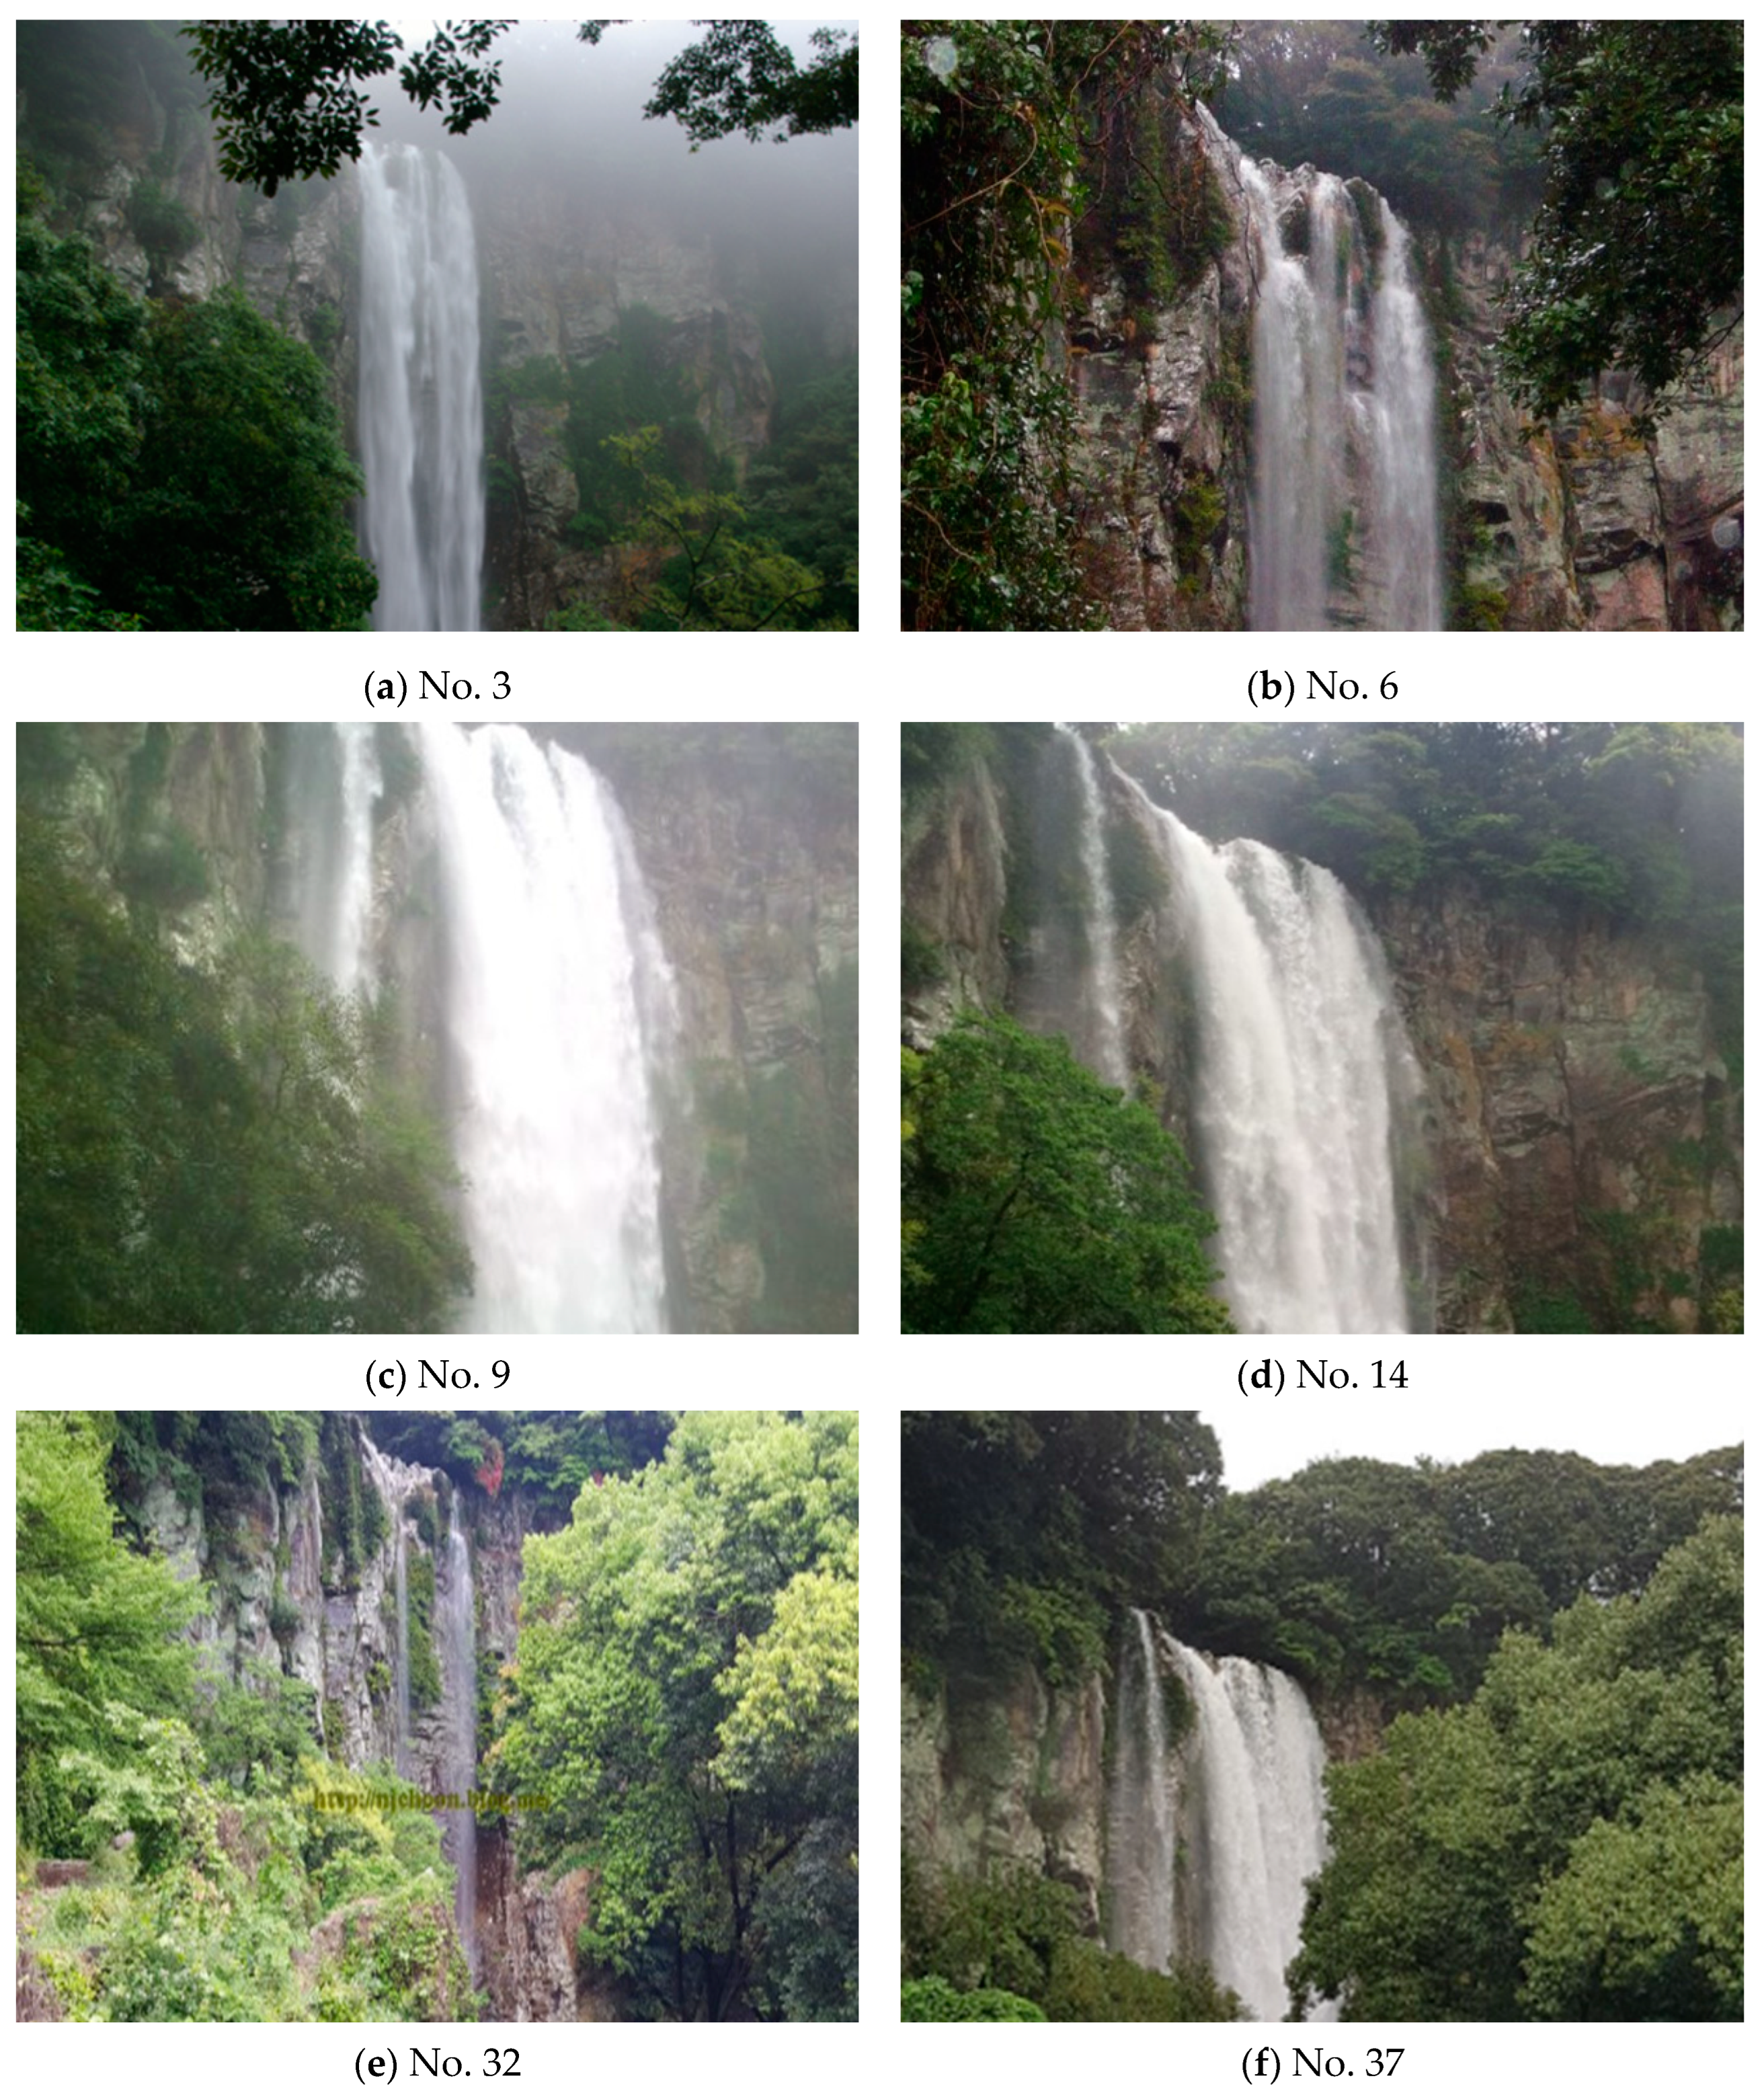
The authors could find somewhat different information about the runoff in the Akgeun stream, and there are various records on the occurrence of Eongtto Falls in the Akgeun stream. As it is one of the most popular tourist attractions on Jeju Island, many tourists visit and record Eongtto Falls whenever the falls occur. The sources of these records include newspapers, personal homepages, and various social network services such as Facebook, Twitter, and Instagram. While these records of the waterfall do not cover all the occurrences of the Eongtto Falls, they are valuable for evaluating the application of the SCS–CN method.
The objective of this study is straightforward; it is to compare the newly set SCS-CN method of Kang and Yoo [
2] with the conventional method of the Ministry of Environment [
2,
3] in their application to the occurrence problem of Eongtto Falls. For this objective, this study analyzes rainfall events from 2011 to 2019. In this analysis, the SCS-CN method is used only to check if effective rainfall occurs or not. Comparison of the application results is based the analysis of a contingency table, i.e., only a ‘pass’ or ‘fail’ in the prediction of the waterfall’s occurrence is considered in the evaluation. The accuracy, hit ratio, and false alarm ratio are used as measures to quantify the results of the contingency table.
2. The SCS–CN Method for Jeju Island
The US Soil Conservation Service (SCS) developed a method to estimate the effective rainfall amount by considering the characteristics of soil, vegetation, and land use [
1]. As the characteristics of soil, vegetation, and land use are quantified by the CN, this method is called the SCS–CN method. The CN ranges from 0 to 100, and its value represents the relative likelihood of effective rainfall being produced. That is, a CN of 100 indicates a condition in which the total amount of precipitation is converted into the effective rainfall, while a CN of 0 indicates that no effective rainfall is produced.
The SCS–CN method basically relies on the assumption that the ratio of actual retention to the maximum potential retention is identical to that of the effective rainfall to the total precipitation. Additionally, the initial abstraction was introduced to consider losses through processes such as interception and evapotranspiration. As a result, the effective rainfall is then calculated using the following equation:
where
is the total precipitation (mm),
is the direct runoff (mm),
is the maximum potential retention (mm), and
is the initial abstract (mm). In the above equation, the maximum potential retention is represented by the CN, and the initial abstraction is assumed to be proportional to the maximum potential retention. Although the ratio is generally accepted to be 0.2 [
1], various other ratios have also been reported worldwide [
33]. It should also be mentioned that the AMC has a significant effect on the CN, and for this purpose, three typical conditions (i.e., dry, normal, and wet) are considered.
As explained in the introduction section, the setup of the SCS–CN method of the Ministry of Environment [
3] is very different from that of Kang and Yoo [
2]. Kang and Yoo [
2] adopt the classification rule for hydrologic soil groups proposed by Lee et al. [
21]. They also consider 0.3 to be the ratio between the initial abstraction and maximum potential retention. The criterion for AMC is quite specific; the AMC-I condition should be applied when the antecedent five-day rainfall amount is less than 100 mm, and the AMC-III condition when it is more than 400 mm. On the other hand, the guidelines of the Ministry of Environment [
3] recommend the classification rule for hydrologic soil groups developed by the RDA [
22]. Their ratio between the initial abstraction and the maximum potential retention is 0.4. Additionally, the guidelines do not recommend the use of the AMC condition. That is, only the AMC-II condition is applied, regardless of the soil moisture condition. The differences between these two methods are summarized in
Table 1.
4. Results and Discussion
4.1. Comparison of Effective Rainfall
This study derived the effective rainfall by applying the two different setups, one from Kang and Yoo [
2] (Case 1), and the other from the guidelines of the Ministry of Environment (Case 2). The differences between these two cases can also be found in
Table 1. As a result, the maximum potential retention and the initial abstraction could be derived for the two different setups of the SCS–CN method that were considered in this study (see
Table 5). Due to the difference in CN and AMC consideration, the initial abstraction under the AMC-I condition of Kang and Yoo [
2] reached up to 92.2 mm; however, when applying the guidelines from the Ministry of Environment [
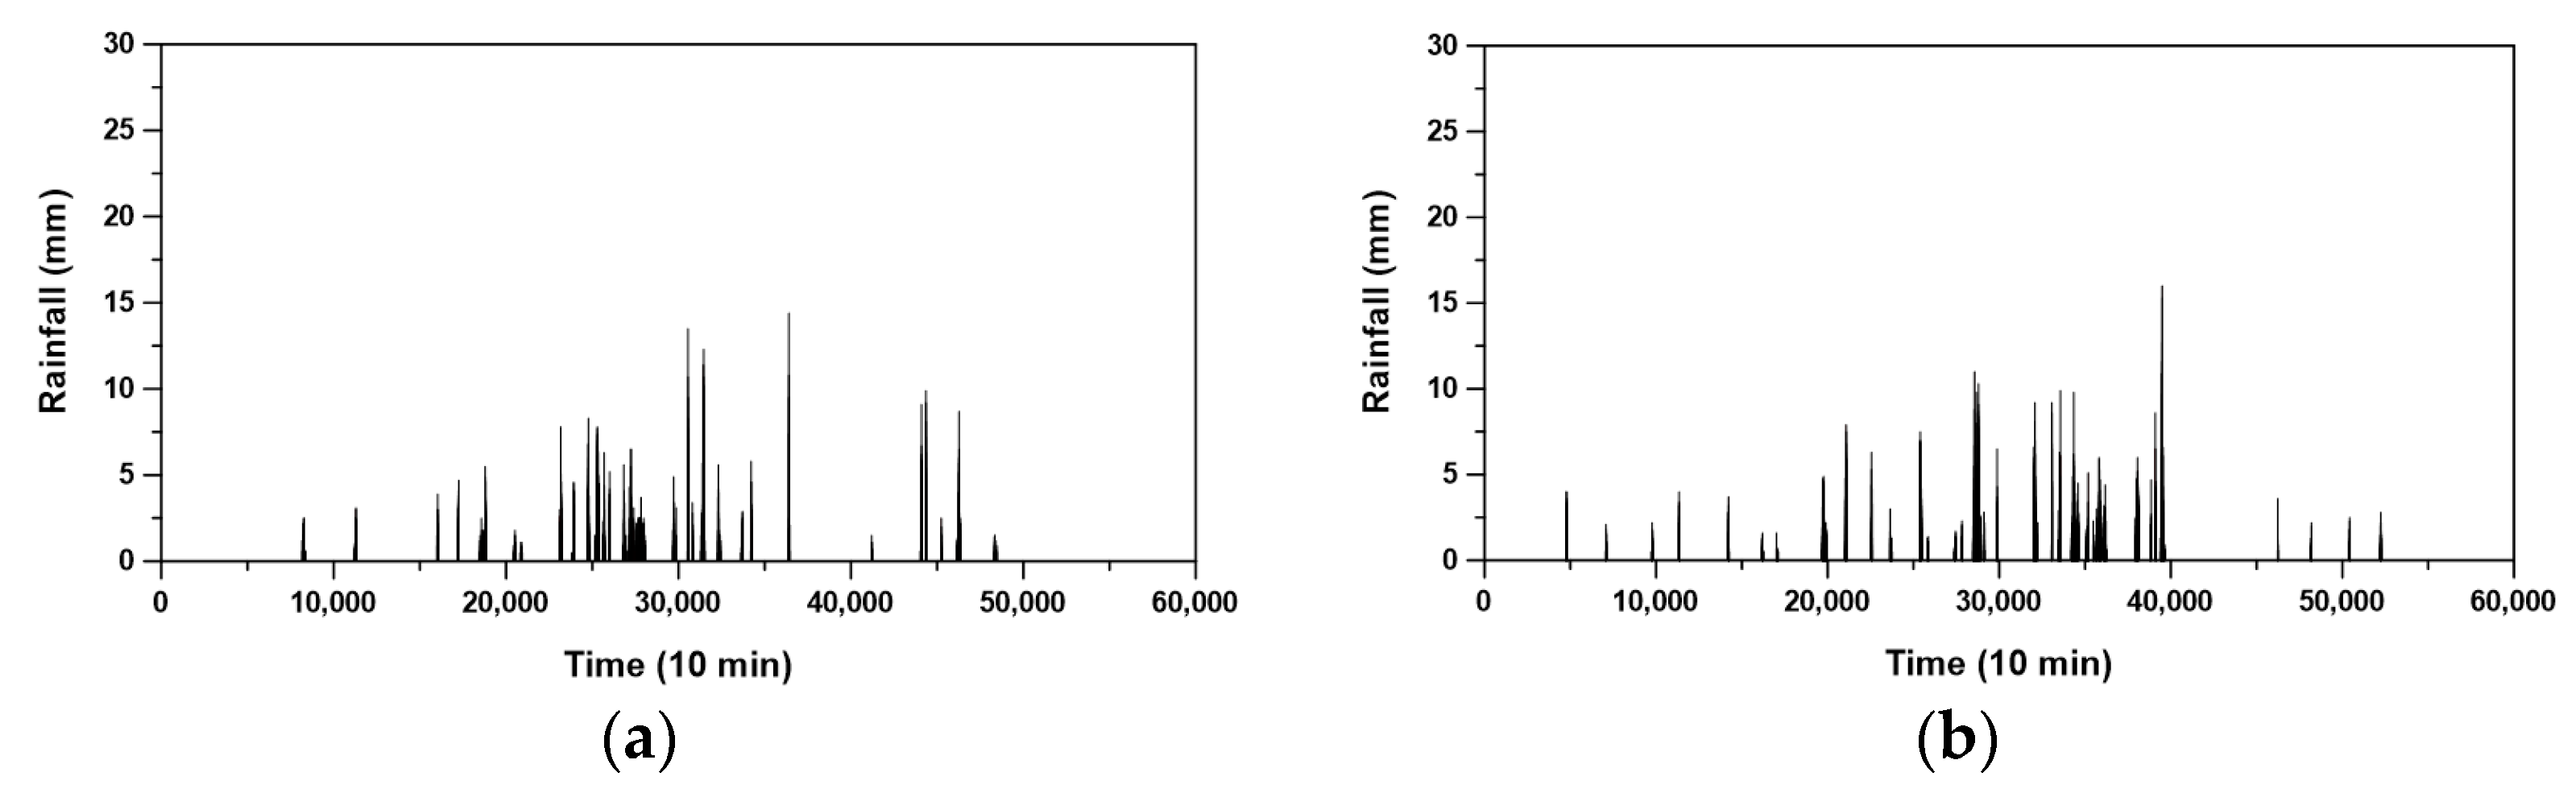
3], it reached just 29.0 mm. All of the rainfall events observed between 2011 and 2019 were considered in this part of the study. For reference, based on the AMC criteria of Kang and Yoo [
2], most of the rainfall events were categorized into the AMC-I condition. That is, a total of 284 events among 334 events were categorized as the AMC-I condition, 45 events as the AMC-II condition, and just 5 events as the AMC-III condition.
Due to the setups of the SCS–CN method, the resulting numbers of effective rainfall events were also very different. For example, when the setup of Kang and Yoo [
2] was applied (Case 1), the number of effective rainfall events was just 104; however, when the guideline of the Ministry of Environment was applied (Case 2), this number increased to 220. The number of effective rainfall events for Case 1 was just one third of the total rainfall events, while for Case 2, it was roughly two thirds. This obvious difference was mainly due to the difference in the consideration of the AMC. In particular, those rainfall events in the AMC-I category in Case 1 produced some effective rainfall, as only the AMC-II condition was applied in Case 2. Additionally, those small rainfall events in the AMC-II category produced some effective rainfall, as a higher CN was applied in Case 2. As mentioned earlier, this is because in Case 2, a different classification rule (that of the RDA [
26]) was considered. Due to this difference in the number of effective rainfall events, the basic characteristics of the effective rainfall events were estimated to be quite different. For example, in Case 1, the mean values were generally found to be higher, but in Case 2, the maximum values were found to be higher.
Table 6 summarizes these characteristics.
4.2. Comparison of Waterfall Occurrences
It is obvious that when applying different setups of the SCS–CN method, different effective rainfall values are derived. In this study, two different setups were considered to derive the effective rainfall in the Eongtto Falls basin on Jeju Island. If runoff measurements had been made during the data period of this study, the evaluation of the derived effective rainfall might have be straightforward. Unfortunately, runoff measurements from the Eongtto Falls basin were not available; however, a total of 43 waterfall records could be found between 2011 and 2019.
In fact, these records are far smaller than the number of effective rainfall events derived in Case 1, as well as in Case 2. However, as the number of waterfall records was very small, the occurrence of effective rainfall events did not always correspond with the waterfall records. Particularly, for Case 1, there were five mismatching cases (one in each year for 2012, 2014, 2015, 2016, and 2017). However, for Case 2, there were no exceptions. That is, when the effective rainfall was positively estimated, all the waterfall records were produced.
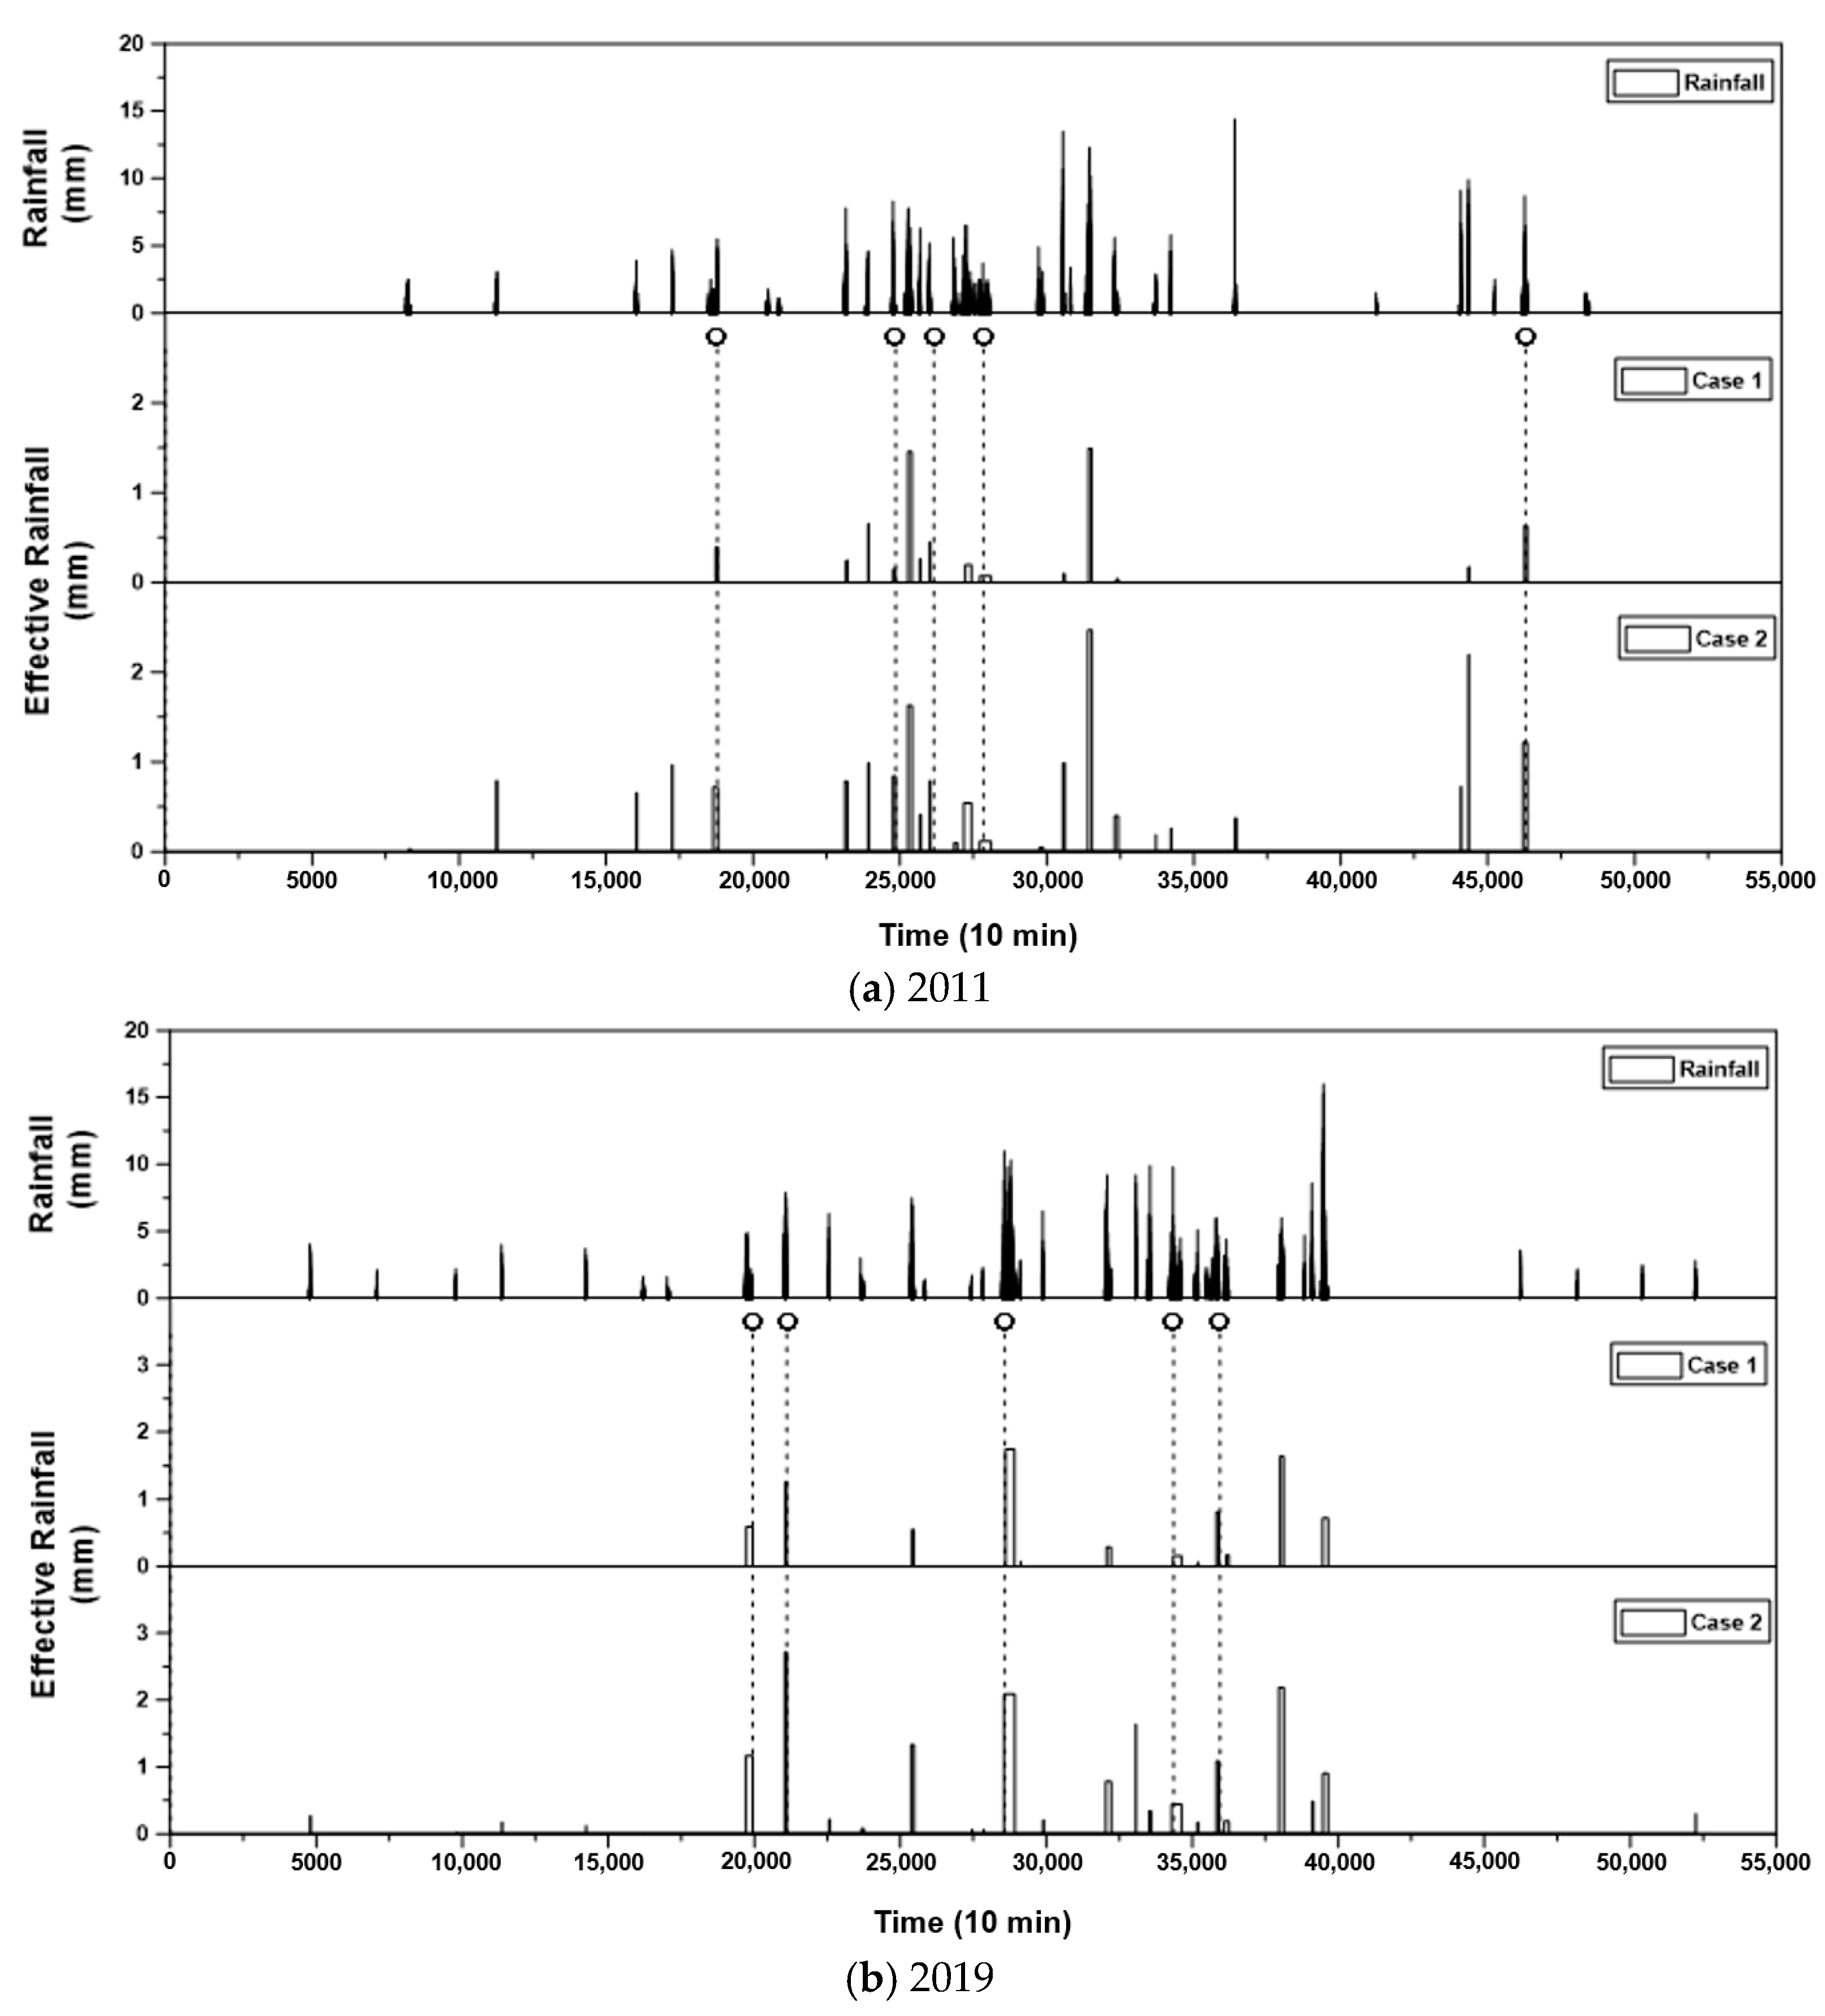
Figure 5 compares the occurrence of the effective rainfall events and waterfall records, as examples, in the years 2011 and 2019. The waterfall records are represented by empty circles in the time series plot of the effective rainfall events.
The consistency of the occurrence of effective rainfall events and the corresponding waterfall records was evaluated using a contingency table. Additionally, to quantify the results of the contingency table, the measures of accuracy, hit ratio, and false alarm ratio were used.
Table 7 summarizes the definitions of those measures used in this study.
Table 8 summarizes the evaluation results produced by the mentioned accuracy measures, based on the contingency tables derived every year. Due to the differences between the parameter sets applied, some measures may be controversial when compared with the others. For example, the hit ratio for Case 1 was estimated to be just 0.88, but for Case 2, it was 1.0. On the other hand, the false alarm ratio for Case 1 was 0.23, while that for Case 2 was higher, at 0.61. As a more comprehensive measure, the accuracy for Case 1 was 0.79, but that for Case 2 was just 0.47. Overall, it was evident that Case 1 showed more accurate results than Case 2. However, to verify the reason for this result, the five mismatching cases should be explained in more detail.
The first mismatching event occurred on 22 March 2012. The total rainfall was 93.0 mm, and the antecedent five-day rainfall amount was just 1.8 mm. As the soil was dry (to meet the AMC-1 condition_, when Case 1 was applied, the effective rainfall was estimated to be zero. On the other hand, as Case 2 did not consider the AMC condition, CN(II) was simply applied, resulting in a positive effective rainfall amount of about 30 mm. Unfortunately, the real waterfall was reported to contradict the hydrological condition, which indicates that effective rainfall occurred, even though its amount was small. A possible reason for the occurrence of this effective rainfall might be the spatial distribution of the storm. That is, the rainfall intensity around the storm center must be notably high. Even though the total rainfall amount is not significant, a localized storm event could produce this effective rainfall. In fact, this explanation could be confirmed by comparing the rainfall data. Simply put, the rainfall intensity measured at one rain gauge station (in this case, at Witsaeorum (gauge #871)) was much higher than that measured at other rain gauge stations.
Other events that occurred in 2014, 2015, 2016, and 2017 were also similar to the event in 2012. The total rainfall amounts were all less than 100 mm (i.e., 93.9, 91.6, 94.6, and 84.9 mm, respectively), while the antecedent five-day rainfall amounts were also all smaller than 100 mm, for inclusion in the AMC-I condition for Case 1 (i.e., 0.0, 39.7, 54.2, and 2.7 mm, respectively). Interestingly, these rainfall events were all located near the boundary of the effective rainfall occurring or not. As a result, these rainfall events might have resulted in the effective rainfall occurring locally; they could also have generated a small waterfall when the storm was small but intense. There were also several other events with a similar total rainfall amount, under the AMC-II or AMC-III condition; however, they were all found to result in effective rainfall, even though Case 1 was applied.
4.3. On the Waterfall Occurrence Guidelines (the Total Rainfall Amount of 70 mm) of Eongtto Falls
This study also evaluated the criterion accepted as a general guideline of the waterfall of Eongtto Falls, i.e., the total rainfall amount of 70 mm, or simply the initial abstraction of 70 mm.
Table 9 shows the contingency table derived by applying this simple condition; this was also compared with those of two cases with different setups of the SCS–CN method.
Table 9 shows that the application of the initial abstraction of 70 mm was found to produce very good results.
The total number of events with positive effective rainfall (that is, a total rainfall amount higher than 70 mm) was 121, which was a bit higher than Case 1 (i.e., 104), but far smaller than Case 2 (i.e., 220). When considering only those events with waterfall reported, the criterion of 70 mm was met in 41 events (higher than the 38 events of Case 1) among a total of 43 events. That is, the hit ratio based on analysis of the contingency table was estimated to be 0.95, which was a bit higher than Case 1 (i.e., 0.88), but a bit smaller than Case 2 (i.e., 1.0). The false alarm ratio was also estimated to be just 0.27, a bit higher than Case 1 (i.e., 0.23), but much smaller than Case 2 (i.e., 0.61). Finally, the accuracy was estimated to be good, at 0.75, a bit less than the 0.79 of Case 1, but much higher than the 0.47 of Case 2. This result indicates that the criterion of 70 mm, determined empirically by the residents living around the falls, was proven to be quite accurate and reasonable. In fact, this amount was also found to be more consistent with the initial abstraction of the newly set SCS CN method.
4.4. Parameter Sensitivity of the SCS–CN Method in the Estimation of Effective Rainfall
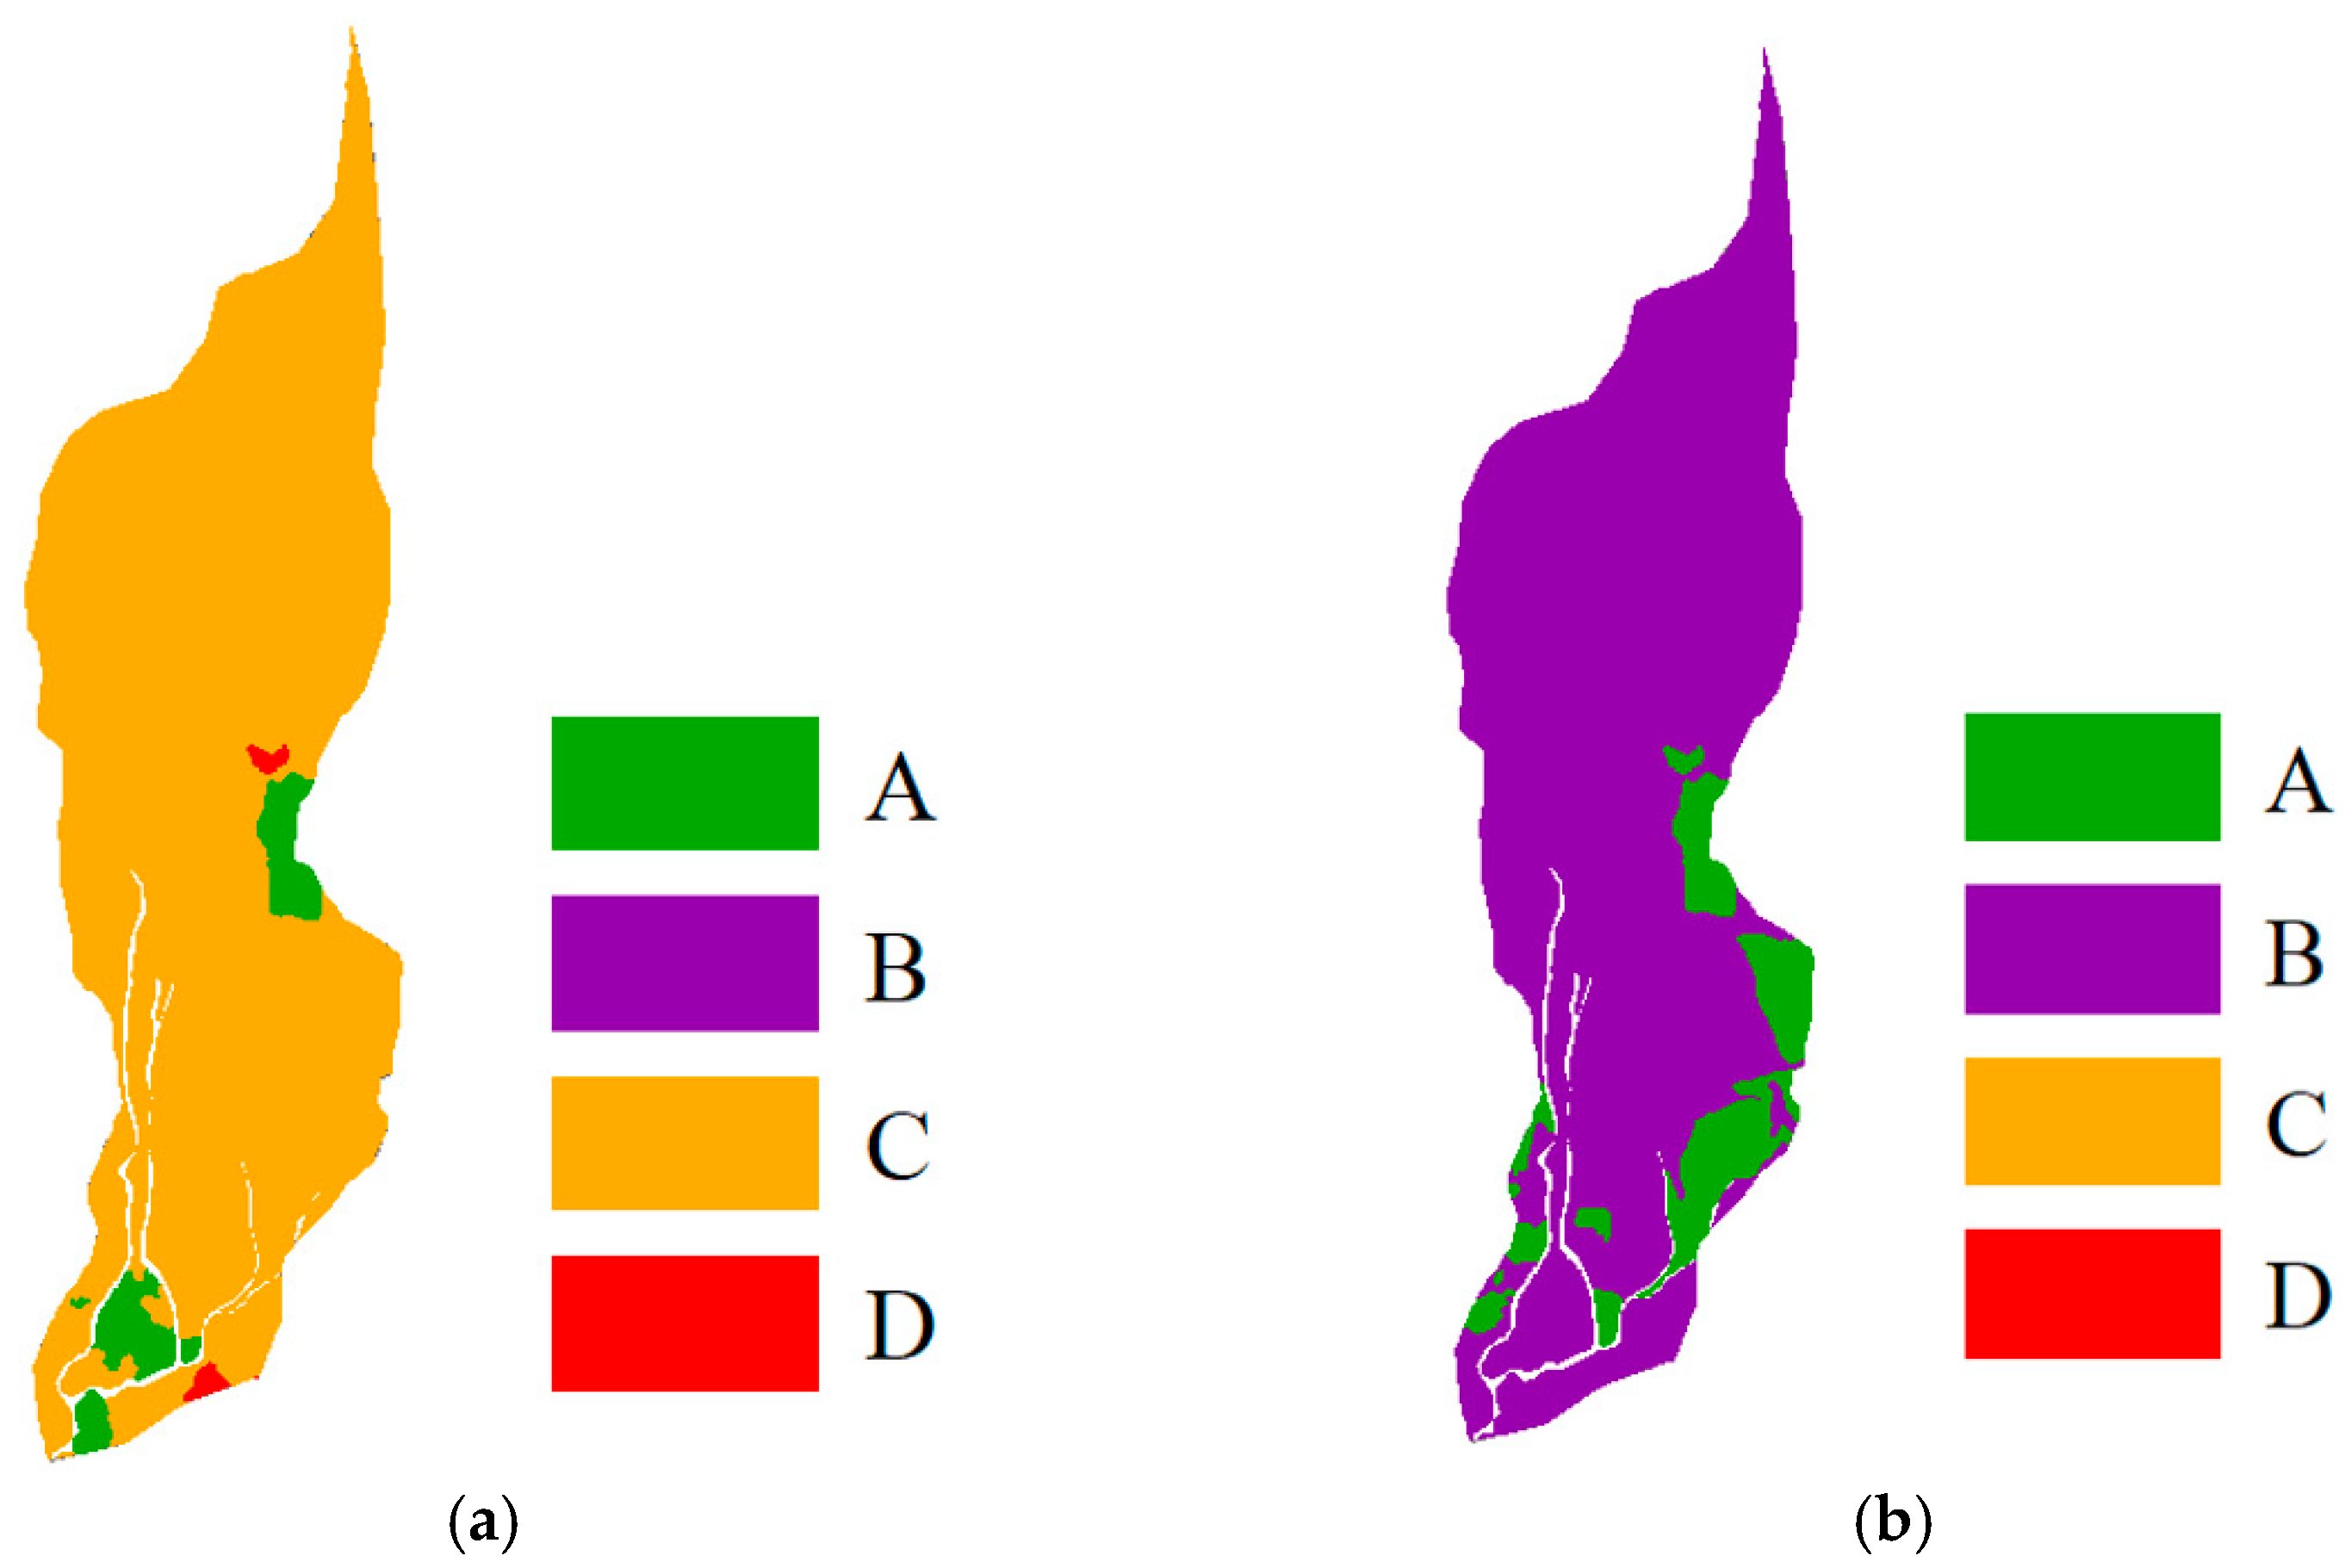
It is obvious that by applying different setups of the SCS–CN method, different effective rainfall values can be derived. This study performed a simple analysis of the sensitivity of the parameters of the SCS–CN method in the estimation of effective rainfall. The purpose of this sensitivity analysis was to find the most sensitive parameter for the estimation of effective rainfall. Among the parameters of the SCS–CN method, the following parameters were selected for evaluation: the classification rule of the hydrologic soil group, the ratio applied to estimate the initial abstraction, and the AMC. Among them, the classification rule of the hydrologic soil group is in line with the estimation of the CN.
As only two setups (i.e., parameter sets) of the SCS–CN method were compared in this study, new setups were also derived by combining the two.
Table 10 summarizes the setups to be considered in the sensitivity analysis. Among them, Case 1 is the setup by Kang and Yoo [
2], and Case 2 the setup from the guidelines of the Ministry of Environment [
3]. Case 1 was used as the base condition. Cases 3 and 4 may be assumed to be opposite combinations of the parameters of Kang and Yoo [
2] and the Ministry of Environment [
3]. That is, Case 3 used Lee et al. [
25]’s classification rule for hydrologic soil groups, and the ratio applied to the initial abstraction, but the Ministry of Environment [
3]’s AMC. On the other hand, Case 4 considered the RDA [
26]’s classification rule, but Kang and Yoo [
2]’s ratio applied to the initial abstraction, and their AMC. Although it was possible to separate the ratios applied to the initial abstraction and the AMC, this was not considered, as they are closely dependent on each other to derive the effective rainfall. On the other hand, the curve number should be pre-determined using soil, vegetation, and land use information before deriving the effective rainfall.
The sensitivity of the setup (i.e., the parameter set) of the SCS–CN method in effective rainfall estimation was evaluated using the same rainfall data used in previous sections. The number of occurrences of effective rainfall was then used for comparison.
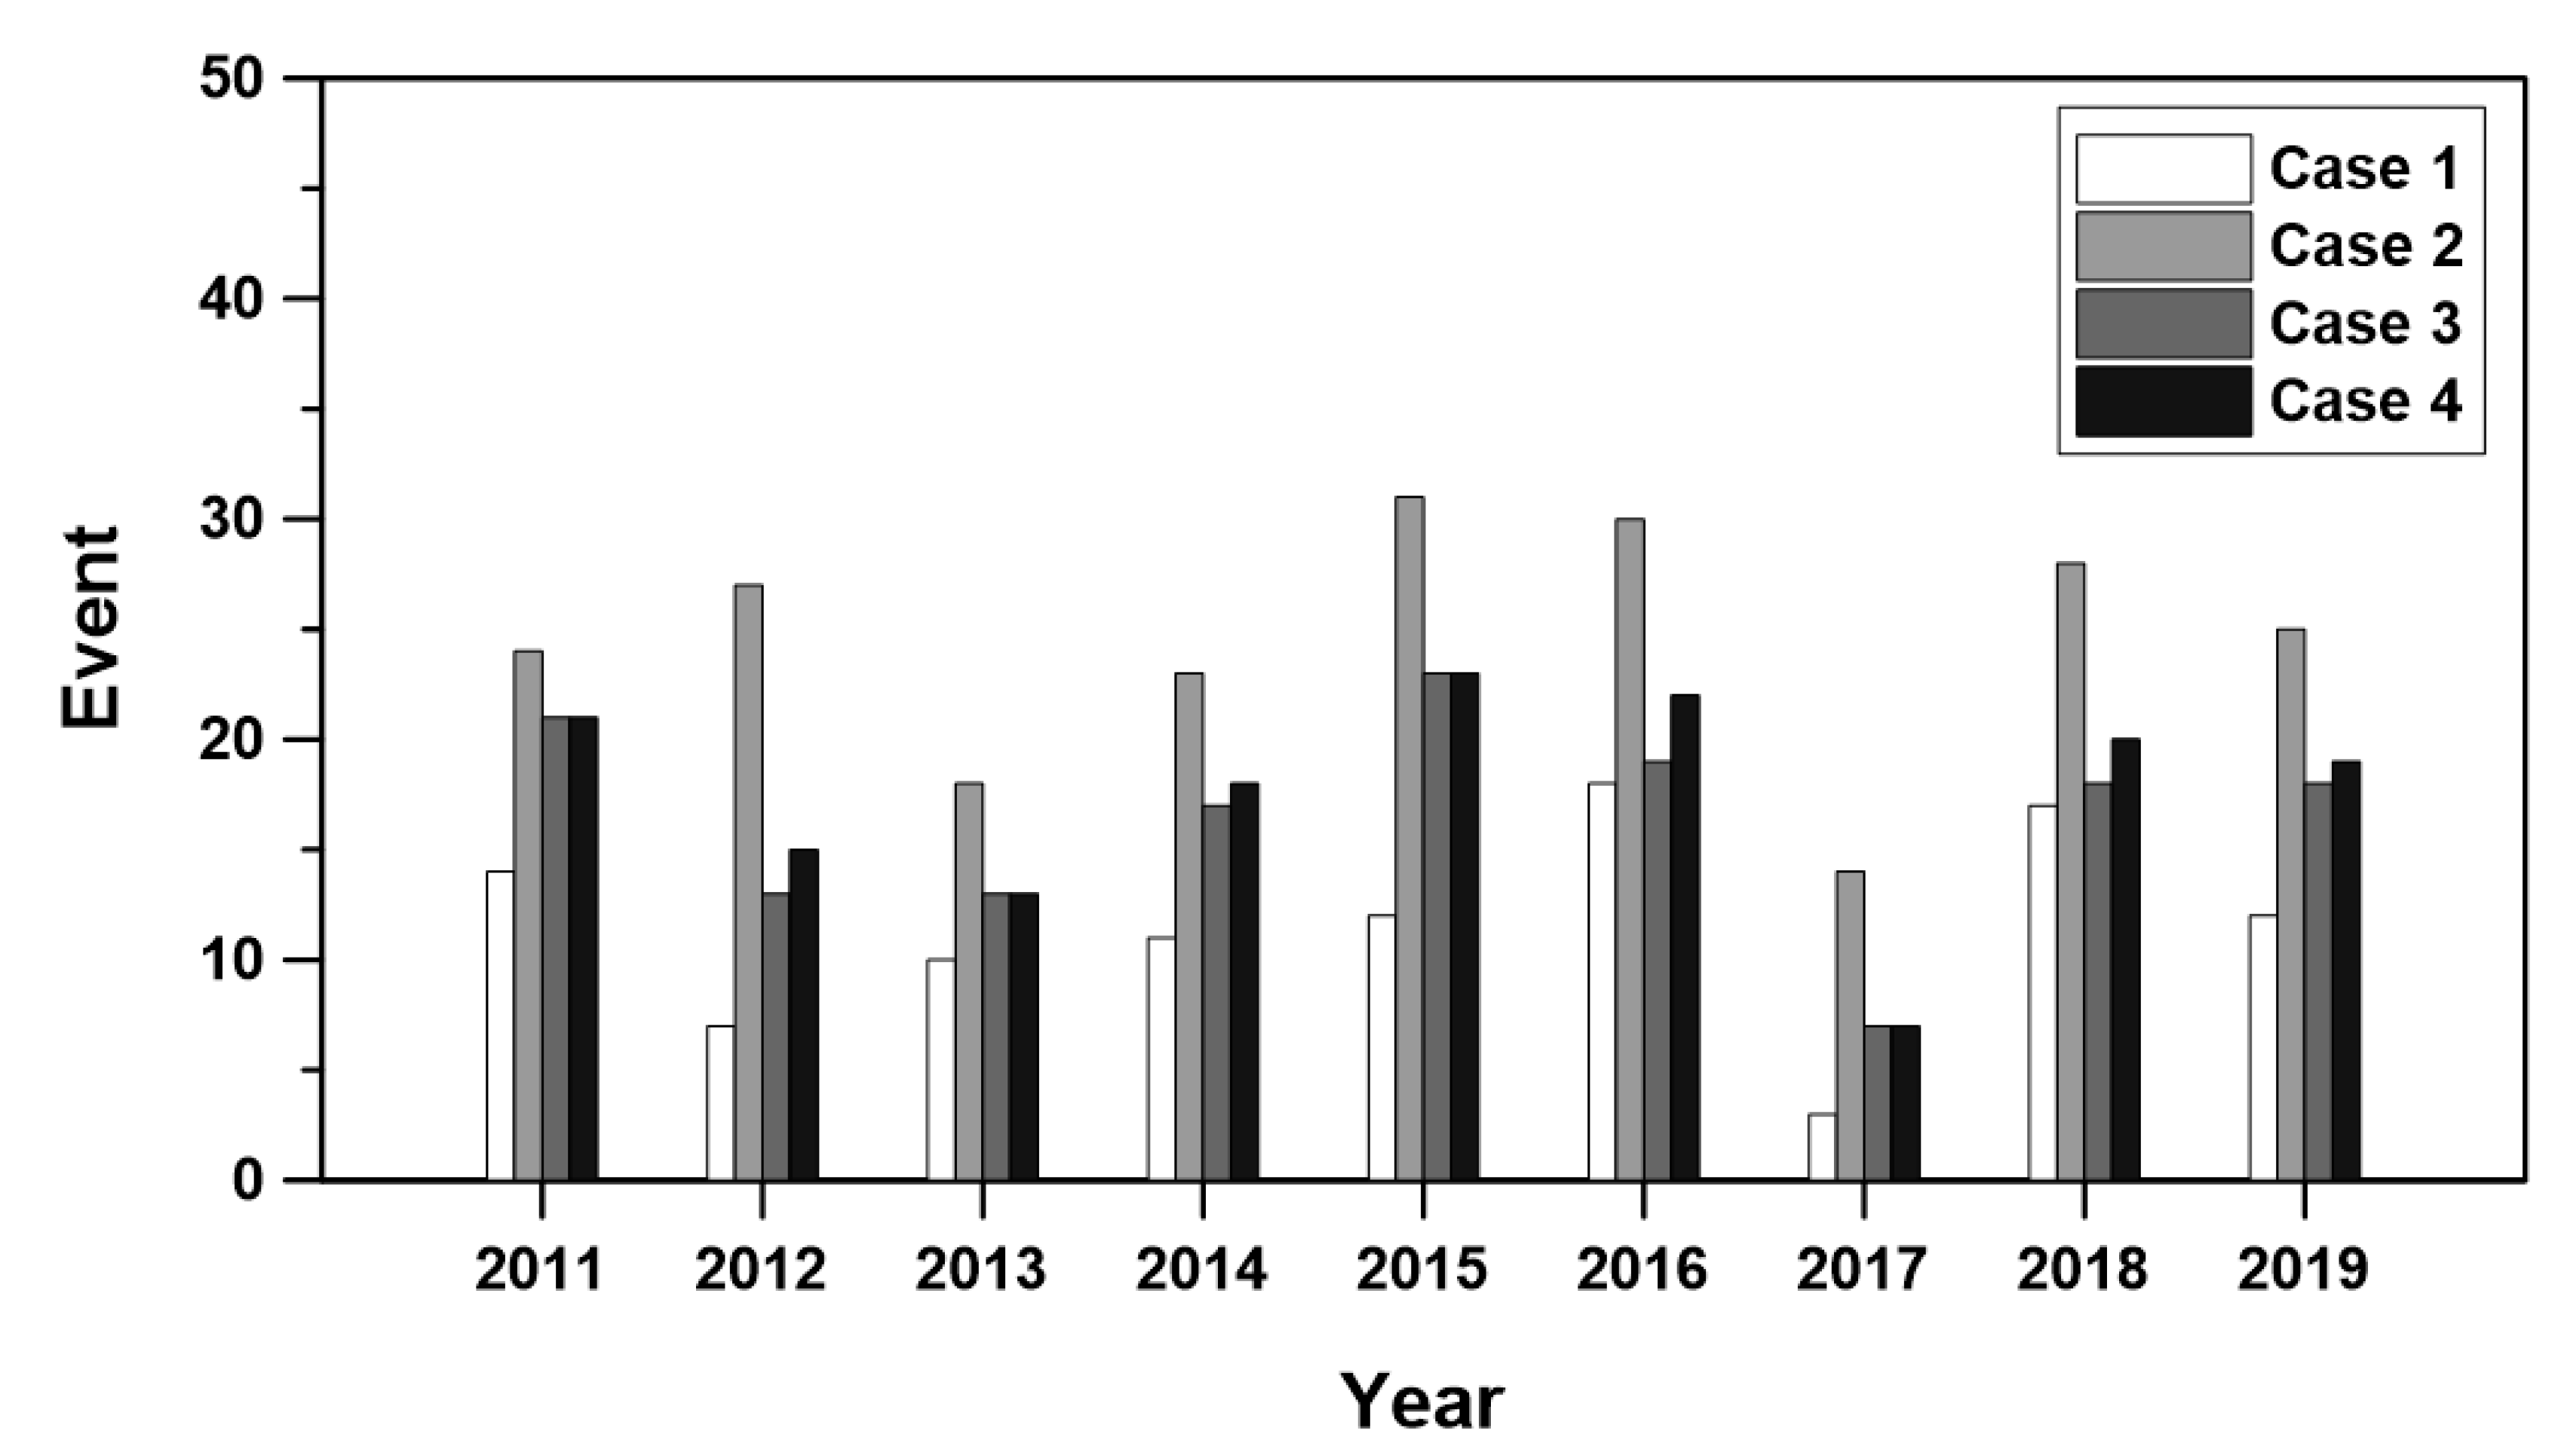
Figure 6 shows these comparison results from 2011 to 2019. Basically, the number of occurrences for Case 3 is higher than that for Case 1, while that for Case 4 is higher than that for Case 3. In particular, the gap between Cases 1 and 3 was found to be greater than that between Cases 3 and 4. That is, the number of occurrences of effective rainfall during the entire period of Case 1 was just 104, but for Case 3, then number increased to 149, and for Case 4 to 158. In simple terms, the effect of the classification rule for the hydrologic soil groups was found to be much more significant than that of the other two parameters. However, it is also important to remember that when applying the parameter set of the Ministry of Environment [
2], the number of occurrences of effective rainfall was 220. Use of both misleading parameters may result in totally different estimates of effective rainfall.
Analysis of the contingency table also confirms the above result.
Table 11 summarizes the results, using several accuracy measures, of evaluating the contingency tables, comparing the occurrence of effective rainfall and the waterfall record. The overall results are similar to those of the comparison of Cases 1 and 2 in the previous section. That is, the hit ratio for Case 1 was just 0.88, but for the other three cases, it was 1.0. When considering the other measure, the false alarm ratio, the exact opposite trend was found. That is, the false alarm ratio for Case 1 was estimated to be just 0.23, but for Cases 2, 3, and 4, it was 0.61, 0.36, and 0.40, respectively. Finally, as a more comprehensive measure, the accuracy for Case 1 was estimated to be 0.79, but for Cases 2, 3, and 4, it was just 0.47, 0.68, and 0.66, respectively. As can be seen in this result, Case 3 was found to be much more effective than Case 4. This means that the use of proper classification rules for hydrologic soil groups is more important than the other parameters, such as the ratio for determining the initial abstraction, and the criteria for AMC conditions.
5. Summary and Conclusions
Due to the limited official runoff data from Jeju Island, Korea, the validation of a newly set SCS-CN method for Jeju Island was practically impossible. Instead, this study used nonofficial data on the intermittent occurrence of Eongtto Falls, which is one of the famous tourist attractions on the island. Various records of the occurrence of Eongtto Falls could be found in newspapers, personal homepages, and on various social network services. In this study, the SCS-CN method was used to check if effective rainfall had occurred or not. This approach was especially effective in the case of Jeju Island, as most streams are fully dry during non-raining periods. This study analyzed all the rainfall events from 2011 to 2019. Evaluation of the application results was based on the analysis of a contingency table, which only considered the consistency of the occurrence of effective rainfall events and waterfall records.
This analysis was carried out using two different setups of the SCS-CN method. One was based on Kang and Yoo [
2], while the other was based on the conventional method in the guidelines of the Ministry of Environment [
3]. Simply comparing the two methods, first, Kang and Yoo [
2] used a new classification rule for hydrologic soil groups, as proposed by Lee et al. [
25], to consider the large infiltration capacity of the basalt soil of the volcanic Jeju Island. Compared to the previous rule from the RDA [
26], this new classification rule was found to decrease the CN significantly. Additionally, Kang and Yoo [
2] determined the ratio between the initial abstraction and the maximum potential retention to be 0.3. Finally, the criteria for AMC were an antecedent five-day rainfall amount of 100 mm for the dry condition, and 400 mm for the wet condition. On the other hand, the parameters from the guidelines published by the Ministry of Environment [
3] are quite different. That is, the classification rule for the hydrologic soil groups developed by the RDA [
26] is recommended. A 0.4 ratio of initial abstraction is recommended, and finally, the guidelines of the Ministry of Environment do not recommend the use of the AMC condition.
The results derived are as follows. First, due to the different setup of the SCS–CN method, the resulting numbers of effective rainfall events were also very different. For example, when the setup of Kang and Yoo [
2] was applied (Case 1), the number of effective rainfall events was just 104; however, when the guidelines of the Ministry of Environment were applied (Case 2), that number was increased to 220. For Case 1, the number of effective rainfall events was just one third of the total rainfall events, but for Case 2, it was roughly two thirds. This obvious difference was mainly due to the difference in the consideration of the AMC.
Second, the contingency table was used to evaluate the consistency of the occurrence of effective rainfall events and the waterfall records. Additionally, to quantify the results of the contingency table, the measures of accuracy, hit ratio, and false alarm ratio were used. For example, for Case 1, the hit ratio was estimated to be just 0.88, but for Case 2, it was 1.0. On the other hand, for Case 1, the false alarm ratio was 0.23, but for Case 2, it was high, at 0.61. For Case 1, a more comprehensive measure, the accuracy, was 0.79, but for Case 2, was just 0.47. Overall, it was obvious that Case 1 showed more accurate results than Case 2.
Third, this study evaluated the criterion generally accepted as the guideline for the waterfall of Eongtto Falls to appear, i.e., a total rainfall amount of 70 mm. The contingency table was derived by applying this simple condition, and was also compared with those of two cases with different setups of the SCS–CN method. The table showed that the application of this simple guideline (a total rainfall amount of 70 mm or simply an initial abstraction of 70 mm) was found to produce very good results. The total number of events with positive effective rainfall (that is, a total rainfall amount higher than 70 mm) was 121, which was a bit higher than Case 1 (i.e., 104), and far smaller than Case 2 (i.e., 220). When considering only those events with a waterfall reported, among the total of 43 events, this simple threshold was met in 41 events (higher than the 38 events of Case 1). The false alarm ratio was also just 0.27, a bit higher than that of Case 1 (i.e., 0.23), but much smaller than Case 2 (i.e., 0.61). This result indicates that the criterion of 70 mm as the total rainfall amount or the initial abstraction, which was determined empirically by the residents living around the waterfall, was proven to be quite accurate and reasonable.
Finally, this study performed a simple sensitivity analysis of the parameters of the SCS–CN method in estimating effective rainfall. The purpose of this sensitivity analysis was to find the most sensitive parameter for the estimation of effective rainfall. As a result, among the parameters of the SCS–CN method (the classification rule of the hydrologic soil groups, the ratio applied to estimate the initial abstraction, and the AMC), the classification rule of the hydrologic soil groups was found to be the dominant factor in reasonably determining the amount of effective rainfall.
The above results show that the setup proposed by Kang and Yoo [
2] is much better than that recommended in the guidelines published by the Ministry of Environment [
3]. Additionally, very interestingly, this study confirmed that the criterion of 70 mm as the initial abstraction, which was empirically determined by the residents living around Eongtto Falls, is quite accurate and reasonable.


