Article

Unveiling the Value of Nature: A Comprehensive Analysis of the Ecosystem Services and Ecological Compensation in Wuhan City’s Urban Lake Wetlands

by
Juan Du
1,2,3,
Rajendra Prasad Shrestha
1,*,
Vilas Nitivattananon
1,
Thi Phuoc Lai Nguyen
1 and
Amar Razzaq
4,5
1
Department of Development and Sustainability, School of Environment, Resources and Development, Asian Institute of Technology, Pathumthani 12120, Thailand
2
Sixth Geological Brigade of Hubei Geological Bureau, Xiaogan 432000, China
3
Hubei Key Laboratory of Resources and Eco-Environmental Geology, Xiaogan 432000, China
4
Business School, Huanggang Normal University, Huanggang 438000, China
5
College of Economic and Management, Huazhong Agricultural University, Wuhan 430070, China
*
Author to whom correspondence should be addressed.
Water 2023, 15(12), 2257; https://doi.org/10.3390/w15122257
Submission received: 16 March 2023 / Revised: 7 June 2023 / Accepted: 9 June 2023 / Published: 16 June 2023

Abstract

:
Urban lake wetlands play an essential role in providing ecological services, promoting urban sustainability, and enhancing the quality of urban life. This study quantitatively assesses the ecosystem services value (ESV) of the Zhangdu, East, and Ziyang urban lake wetlands in Wuhan, China, based on primary survey data and methodologies, including the market price, shadow engineering, and travel cost methods. The ESV is categorized into direct use value (DUV), indirect use value (IUV), and non-use value (NUV). Our findings reveal that the non-use value proportion is significant, amounting to 1.569 × 10⁸ CNY × yr−1 for Zhangdu Lake, 1.527 × 10⁸ CNY × yr−1 for East Lake, and 1.060 × 10⁸ CNY × yr−1 for Ziyang Lake. This indicates a high willingness to pay among respondents, reflecting a recognition of the value of wetland services. In addition to the non-use value, this study underscores the considerable material production, water conservation, and leisure tourism value that these urban lake wetlands provide. The assessment of ESV delivers a scientific basis for the management and protection of urban lake wetlands. It also highlights the challenges faced, such as pollution and fragmented management approaches due to unclear property rights and insufficient funding. This study concludes by emphasizing the need for future research to explore mechanisms that promote social participation in wetland management, with the aim of enhancing the overall ecological health of urban lake wetlands.

1. Introduction

Wetlands refer to natural or artificial, permanent or temporary swamps, wetlands, peatlands, or water areas with static or flowing, or fresh, brackish, or salty water bodies, including shallow waters with a depth of not more than 6 m at low tide [1]. Wetlands are distributed between terrestrial and aquatic ecosystems, but wetlands have many features that distinguish them from terrestrial and marine ecosystems. The most notable features include the appearance of stagnant water during parts of the growing season, unique soil conditions, vegetation tolerance, and adaptability to saturated soil [2].
Wetlands are one of the most critical environments for human survival, with biologically important habitats, ecosystem types, and natural landscapes with the richest biodiversity [3]. They have a variety of service functions, such as providing food and fiber, regulating floods, conserving water sources, improving climate, consolidating soil and fertilizing, purifying the environment, and maintaining biodiversity [4]. They are also the “gene pool of species” and “paradise for birds” [5].
The evaluation of the wetland ecosystem service function value is the foundation of wetland protection and rational utilization [6]. A scientific and rational assessment of the functions of various wetlands is conducive to improving the level of wetland research, monitoring, protection, and utilization and is the basis for wetland protection planning [7]. The rational use of wetland ecological resources provides a scientific basis, which is of great significance for improving the quality of the ecological environment and ensuring regional ecological security [8].
The global wetland area is about 7–9 million km2, which is 4–6% of the earth’s land surface [9]. However, wetlands have suffered the most serious damage from human activities in modern history. Wetlands have become the last frontier in terms of attention and conservation efforts, lagging behind other ecosystems such as agriculture, forestry, and deserts. In many developed and developing countries, wetland areas are disappearing at an alarming rate. About 50% of wetlands in the continental United States have disappeared, and wetlands in Europe, parts of Australia, Canada, and Asia are disappearing much faster [10]. In the 30 years from 1978 to 2008, 33% of wetlands in China disappeared [11] due to reasons such as reclaimed land for settlements. This indicates that their function and value have not been properly recognized by humans for a long time. However, the gradual recognition of the importance of wetlands has attracted worldwide attention, and the research on wetland ecosystems has gradually increased [12].
China has a large wetland area, about 384,900 km2, including 362,000 km2 of natural wetlands, ranking first in Asia and third in the world after Canada and Russia [
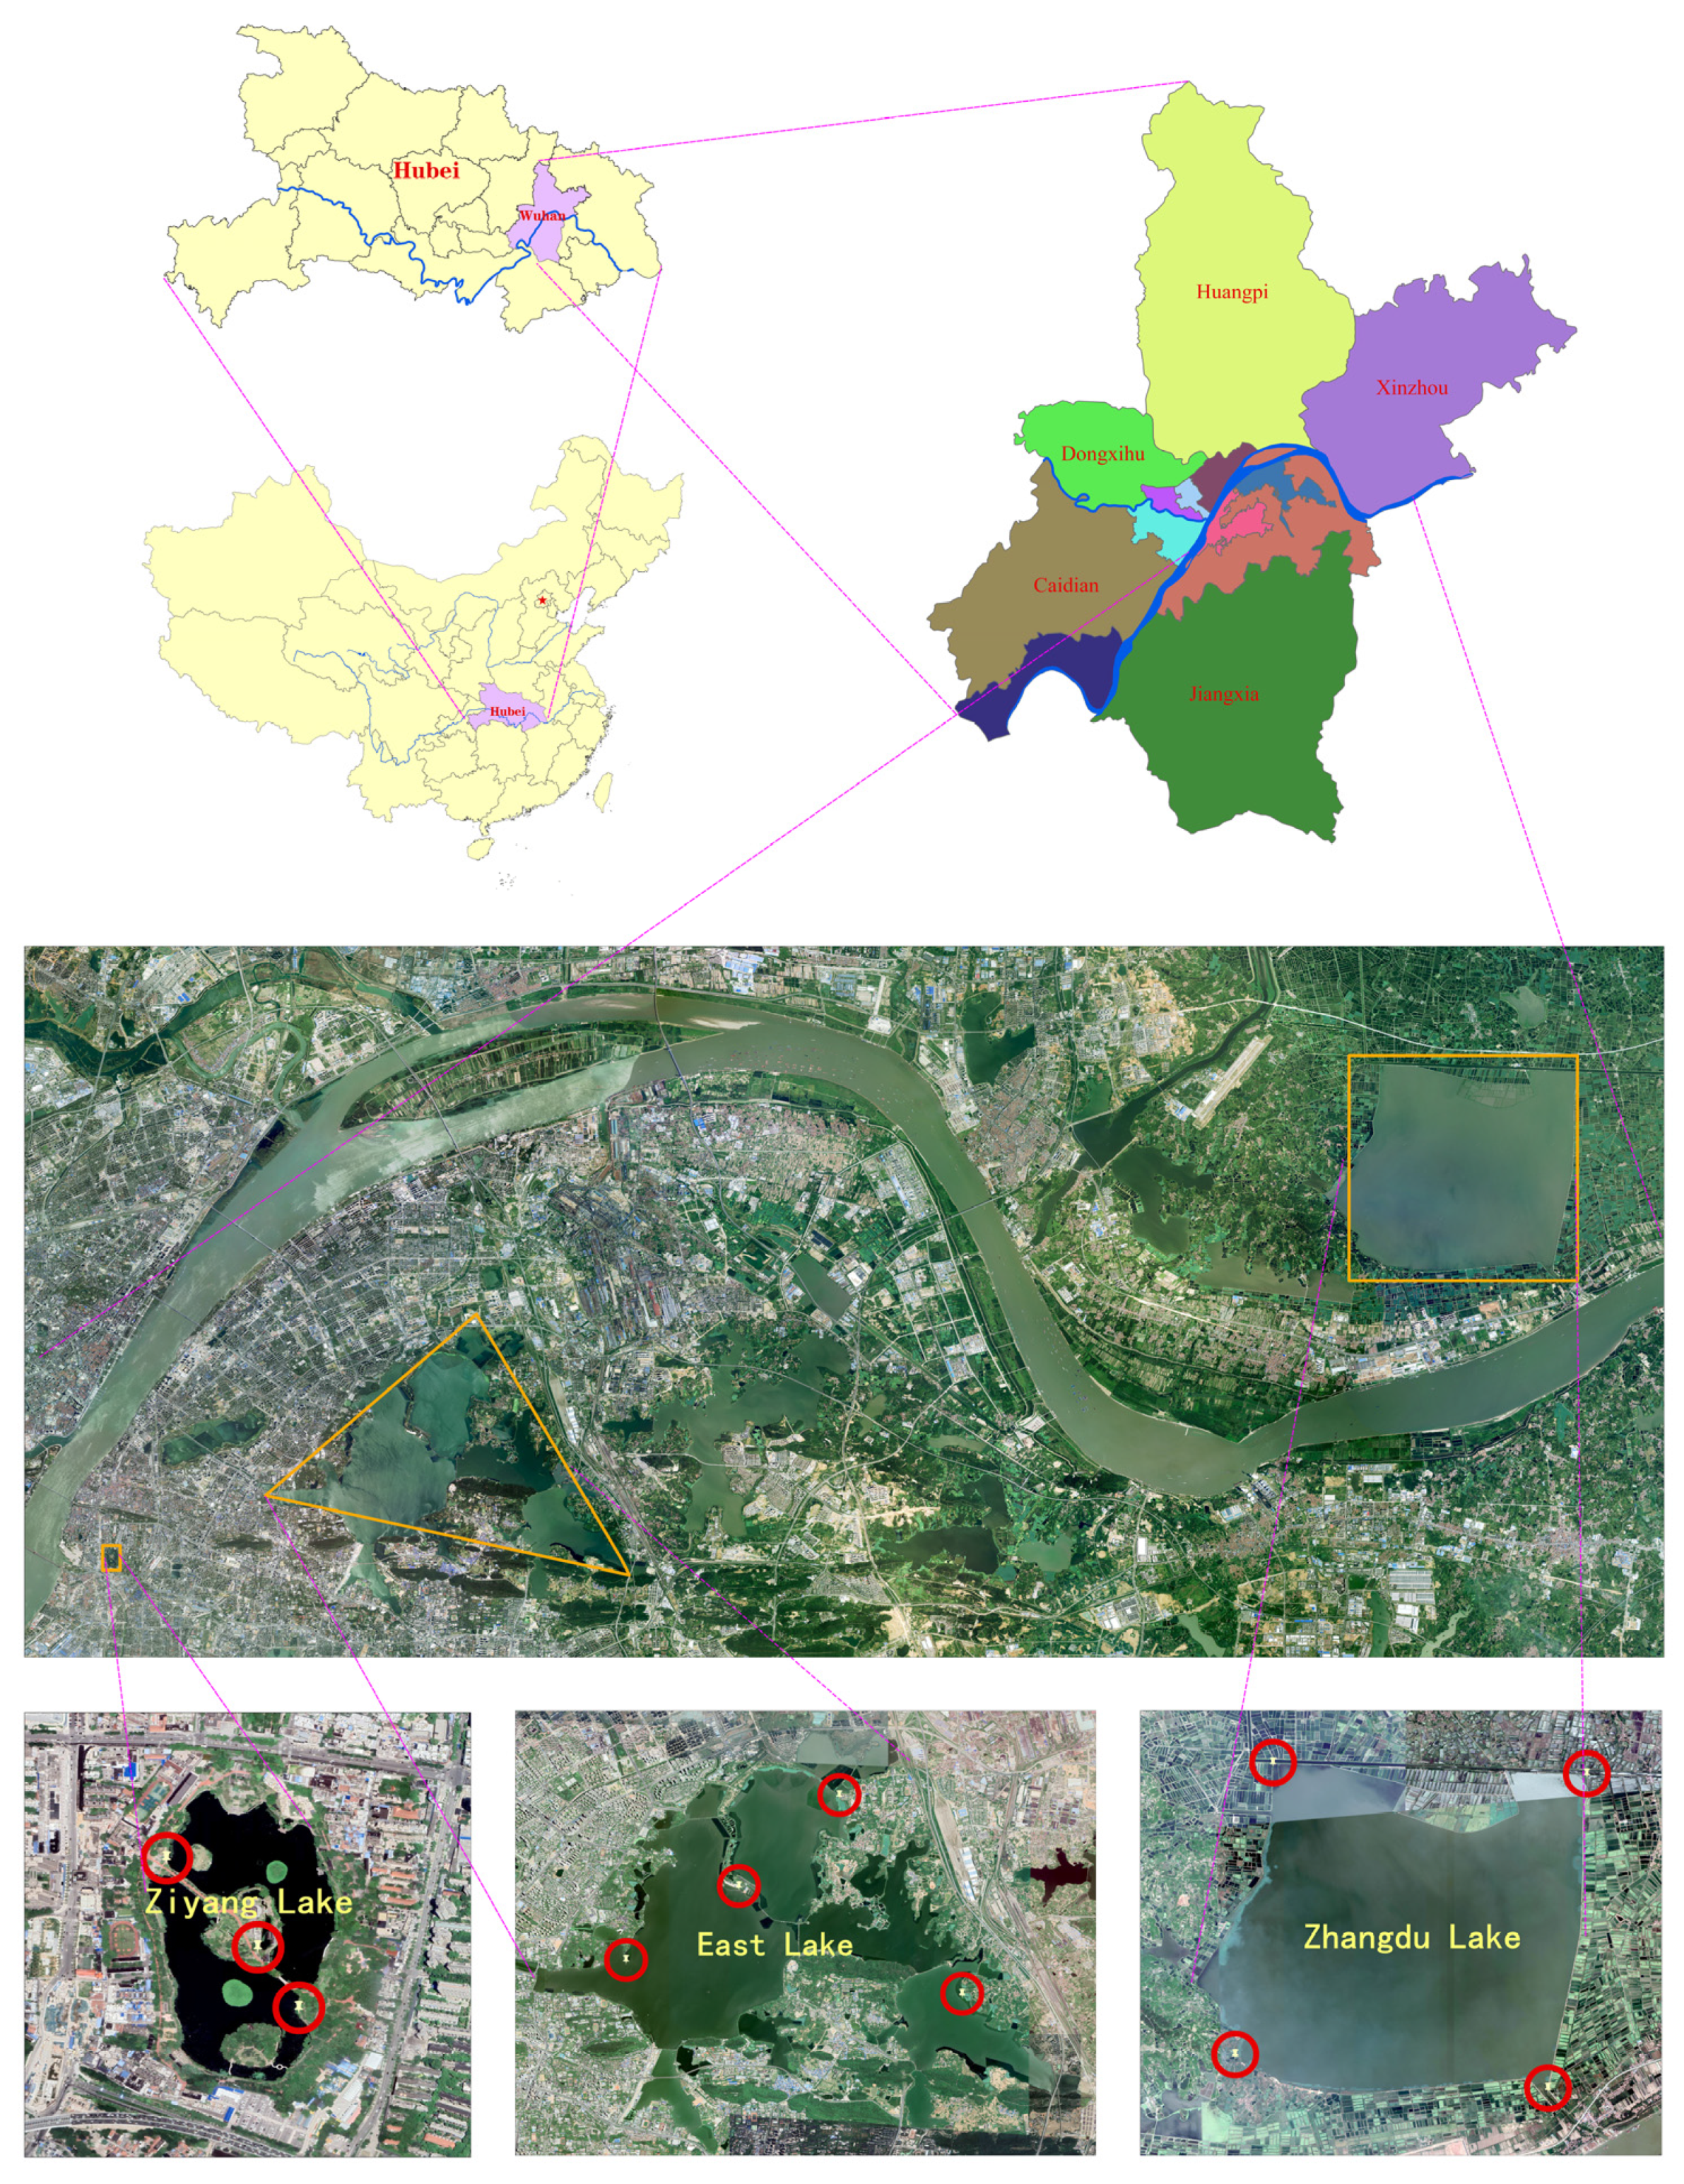
13]. Hubei Province is known as the “province of a thousand lakes” and is rich in wetland resources. The existing wetland covers an area of 1.6169 million hectares in five categories: river wetlands, lake wetlands, swamps, swampy meadow wetlands, and artificial wetlands (reservoir ponds) [14]. Wuhan, the capital of Hubei Province, is known as the city of rivers and the city of hundreds of lakes. A total of 165 rivers are crisscrossed; 16 lakes are dotted; the wetland area is 12,000 km2, accounting for 1.9% of Wuhan’s land area; and the wetland resources rank among the top 3 inland cities in the world [15]. Wuhan achieved a major milestone in June 2022, as it was successfully selected as part of the second cohort of international wetland cities. Additionally, the city is home to a renowned national wetland park in China. With the most surface water per capita, Wuhan ranks first in the world [16].
Wetland ecosystems, renowned for their unparalleled biodiversity, are undeniably fragile and necessitate diligent protection to preserve their unique characteristics [17]. Despite their richness and vital role, these wetlands confront numerous challenges, including pollution, fragmented management approaches, unclear property rights, and insufficient funding, all of which threaten their sustainability. In light of these issues, it becomes imperative to understand the ecosystem services provided by various wetlands [18]. This understanding is instrumental in establishing ecological compensation standards that aid in the protection and restoration of wetlands, thereby improving wetland ecology through rigorous scientific assessment. However, current studies have seldom applied a comprehensive approach to assessing the ecosystem service function values of urban wetlands.
There is an immediate need for research that sheds light on the value of these wetlands and elucidates strategies for their protection and enhancement. A noticeable research gap exists in the comprehensive evaluation of these wetlands’ ecosystem service function values and the calculation of their ecological compensation. This study aims to fill this void by contributing to the literature by applying the theories of eco-economics and resource economics to provide a comprehensive assessment of the ecosystem service function values of the Zhangdu, East, and Ziyang urban lake wetlands, including their resource function, environment function, and social function. Furthermore, we conducted a survey to analyze respondents’ environmental consciousness, the significance of the non-use value component, the frequency distribution of respondents’ willingness to pay (WTP), the per capita WTP value, and the total payment value. We also analyzed the characteristics of respondents’ WTP and the correlation between WTP and societal factors. These findings will provide valuable insights into the development of strategies to manage and protect these crucial wetlands.

2. Materials and Methods

2.1. Study Area

This study focuses on Wuhan, the capital city of Hubei province, located at the intersection of the Yangtze River and the Han River. Wuhan’s climate is subtropical monsoon with abundant rainfall and distinct seasons. Geomorphologically, the city is characterized by a flat center surrounded by hills and ridges in the south and low bristly mountains in the north (Figure 1) [19].
Wuhan city boasts a rich variety of wetland resources, including rivers, lakes, swamps, marsh meadows, pools, and paddy fields [20]. According to Pan [21], it mainly includes six types of wetlands: rivers, lakes, swamps, marsh meadows, pools, and paddy fields, among which shallow lake wetland systems (including lake wetlands, swamps, and marsh meadow wetlands). However, these wetlands have faced significant challenges due to erosion, reclamation, pollution, and residential encroachment, leading to a reduction in their area, biodiversity, and overall ecosystem function [22].
For this study, we chose three typical urban lake wetlands: Zhangdu Lake, East Lake, and Ziyang Lake, based on their size, location, and type. Surface water samples were collected from 11 sites across these lakes, with four in Zhangdu Lake, four in East Lake, and three in Ziyang Lake (Figure 1 and Table 1).

2.2. Data Collection

Our study combined primary and secondary data collection with several analytical approaches.

2.2.1. Primary Data Collection

Primary data were collected through key informant interviews and observations through field research. The details are described below:
Key Informant Interviews: Ten key informants (Table 2), including local government officials, local leaders, and general citizens, were interviewed to gain insights into the strengths and weaknesses of the study areas, the major threats to urban lake wetlands, and the benefits derived from them.
Observation/Field Research: Fieldwork was conducted to observe and collect information on people’s behavior; the actual condition of the field; the value of aquatic resources such as fish, crabs, and shrimp derived from the lakes; the benefits imparted by the wetlands; and the cost of living for the local populace.

Socio-Economic and Willingness to Pay (WTP) Surveys

We conducted a two-part survey from August 2021 to April 2022 to gather socio-economic data and evaluate the non-use value of lake wetlands. It should be noted that the response rate for this survey was high, at 96%, emphasizing the reliability of the collected data.
A structured questionnaire was administered through face-to-face interviews at the household level in 13 administrative districts under the jurisdiction of Wuhan. Using the equation suggested by Yamane [25], we required a sample size of 372 households (Table 3).
In this two-part survey, the first part focused on socio-economic data collection, while the second part was a willingness to pay (WTP) survey. For the WTP, we employed the Contingent Valuation Method (CVM) to evaluate the non-use value of lake wetlands. The pre-survey used an open-ended (OE) questionnaire to obtain core estimates for the second survey, which utilized a payment card (PC) approach.
The successful application of CVM depends on the accurate and reasonable design of the questionnaire. The core valuation guidance techniques of CVM include iterative bidding game (IB), open-ended (OE), payment card (PC), and dichotomous choice (DC) [26]. In this study, we used OE for the first pre-survey to obtain the core estimate and its interval for the second survey; thereafter, PC was used.
The questionnaire was comprised of seven parts:
  • Description of non-use value of lake wetland resources.
  • Respondents’ survey on environmental awareness of Wuhan Lake wetlands.
  • On-site photos and basic information introduction to Zhangdu Lake, East Lake, and Ziyang Lake.
  • Survey of respondents’ willingness to pay.
  • Identification of non-use value components (existence value, heritage value, and option value) the respondents are willing to pay for.
  • The respondents’ gender, age, occupation, education level, technical title, and annual income, among other social characteristics.
  • Guidance and suggestions for this CVM survey.

2.2.2. Secondary Data Collection

Secondary data were collected from various sources, including official documents, government reports, and data from organizations such as the Hubei Provincial Department of Water Resources Lake Division, the Hubei Environmental Monitoring Center, and the Hubei Statistics Bureau.

2.3. Analytical Approaches

2.3.1. Ecological Service Value Assessment

Using the environmental resource value theory, we divided the wetland value into use and non-use value. The use value further included direct use value (DUV) and indirect use value (IUV) [27]. We computed DUV based on the market price of ecosystem products, which included components such as aquaculture production, water conservation, and leisure tourism. Each component was assessed via different techniques: aquaculture production was evaluated by looking at the yield per unit area, the area of the lake wetland, and the market price of these products. The water conservation value was estimated based on the volumes of the urban lake wetlands at constant water levels and the construction cost of storage capacity per unit area. The leisure tourism value was gauged using the travel cost method, supplemented with questionnaire survey data.
IUV and non-use value (NUV) were estimated based on the willingness to pay (WTP) for utilizing an ecosystem service function. This involved calculating the sum of the values of carbon sequestration and oxygen release, transpiration and endothermic, water quality purification, flood control, biodiversity maintenance, and scientific research and education. Each component had its unique method for estimation: carbon sequestration and oxygen release were obtained by measuring these quantities in the aquatic vegetation of each lake and then monetizing them using the shadow price method. The transpiration value was calculated through monetization and transformation of the heat absorption function index. Water quality purification, flood control, and biodiversity maintenance values were estimated through a combination of measurement and monetization methods. The research and education value was calculated using the result reference method. Table A4, Table A5 and Table A6 in Appendix A provide a list of indicators and methods of ecosystem services valuation used in this study.
Non-use value (NUV) was estimated as the sum of existence, heritage, and option values. These components were estimated using the Contingent Valuation Method (CVM), which involved creating an open-ended (OE) questionnaire in the pre-survey stage to capture respondents’ willingness to pay, thereby indicating the perceived non-use value of the lake wetlands. A payment card (PC) approach was then used in the main survey to solidify these initial estimates.
Consequently, an array of methods, such as the market price, shadow engineering, travel cost, shadow price, efficiency alternative, pollution cost, result reference, and contingent valuation methods, were employed to evaluate various functional indicators of wetland ecosystems. The total economic value was calculated by the sum of direct, indirect, and non-use values.
Through the use of the Contingent Valuation Method (CVM), we established an index database to analyze respondents’ environmental consciousness, the significance of the non-use value component, the frequency distribution of respondents’ WTP, per capita WTP value, and total payment value. This method allowed us to directly measure respondents’ willingness to pay (WTP) values [28]. Additionally, the survey analyzed the correlation between WTP and societal factors.
In the analysis of the degree of importance of non-use value (NUV) indicators, a 4-point scale [29] was used to grade their significance: very important (3 points), important (2 points), average (1 point), and not important (0 points). The scores were then multiplied by the frequency of respondents’ evaluation of the importance of each non-use value component, and the average score was calculated to determine their order of importance. The total payoff value was calculated by multiplying the actual number of people WTP by the average total payoff value (Vwtp) of each lake [30]. The correlation analysis of respondents’ social characteristics on WTP and WTP value was tested by the p value size [31].

2.3.2. Water Quality Assessment

The water quality of the three lakes in Wuhan was assessed by measuring the levels of total nitrogen (TN); total phosphorus (TP); and several heavy metals, such as copper (Cu), zinc (Zn), lead (Pb), cadmium (Cd), arsenic (As), and mercury (Hg). In March 2022, 11 surface water samples from the selected lakes were collected and sent to the laboratory of No. 6 Geological Team of the Hubei Geological Bureau for analysis. This analysis provided crucial data for estimating the water purification values of the lakes.
The determination of TN and TP was carried out according to HJ 636-2012 and GB 11893-89 standards, respectively, using an LH-25A intelligent multi-parameter digestion device and a TU-1810D UV-visible spectrophotometer [32,33,34,35]. These standards are suitable for surface water, groundwater, industrial waste water, and domestic sewage. The detection limit for TN is 0.05 mg/L, and for TP, it is 0.01 mg/L.
For the determination of TN and TP, water samples were first digested using reagents P1 and P2 and potassium persulfate (SP). After digestion, the samples were colored with specific reagents, and their absorbance was measured using a spectrophotometer at specific wavelengths: 220 nm and 275 nm for TN and 700 nm for TP.
For heavy metal analysis, the procedure varied depending on the metal. For Cu, Zn, Cd, and Pb, unacidified samples were filtered and then measured using Inductively Coupled Plasma Atomic Emission Spectroscopy (ICP-AES) [36,37,38]. For Hg and As, the samples were subjected to acid digestion followed by measurement using an atomic fluorescence analyzer [39,40,41].
Quality control for total nitrogen (TN), total phosphorus (TP), copper (Cu), zinc (Zn), lead (Pb), cadmium (Cd), arsenic (As), and mercury (Hg) was conducted meticulously. Correlation coefficients of the calibration curves for all substances met the requirements. A parallel double sample was analyzed for each batch, ensuring the relative deviation was within the acceptable range. For each batch, a standard quality control sample was also tested, with results complying with the standard values. For Cu, Zn, Pb, Cd, Hg, and As, blanks were within standards, and certified standard samples were confirmed to fall within the uncertainty range. Intermediate point concentration was checked and met the requirements. All these steps ensured the precision and accuracy of our measurements.

3. Results

3.1. Results of Ecological Service Value Assessment

3.1.1. Direct Use Value (DUV)

Material Production Value (V1)

The material production value of the urban lake wetlands, classified as natural, semi-natural, or artificial, was assessed. The assessment involved evaluating all types of material products provided by these lakes, considering the yield per unit area, the area of the lake wetland, and the market price of these material products. The total material production value (Table 4) was determined to be 796.59 × 10⁴ CNY × yr−1. Among this total, natural lakes contributed 445.77 × 10⁴ CNY × yr−1, and semi-natural lakes contributed 350.82 × 10⁴ CNY × yr−1, while artificial lakes did not contribute. This indicates that natural lakes have the highest material production value, followed by semi-natural lakes, with artificial lakes not contributing to the material production value. Additional details regarding the formulae and definition of variables V1 to V9 are provided in Appendix A (Table A4, Table A5 and Table A6).

Water Conservation Value (V2)

Water conservation values were estimated based on the volumes of the urban lake wetlands at constant water levels and the construction cost of storage capacity per unit area. The total water conservation value (Table 4) was found to be 9702.35 × 104 CNY × yr−1. Natural lakes contributed 2784.63 × 104 CNY × yr−1, semi-natural lakes contributed 6905.28 × 104 CNY × yr−1, and artificial lakes contributed 12.44 × 10⁴ CNY × yr−1. While semi-natural lakes had the highest overall water conservation value, a different picture emerged when looking at the value per unit area, with natural lakes surpassing both semi-natural and artificial lakes.

Leisure Tourism Value (V3)

The leisure tourism value of the three different types of lakes was estimated using the travel cost method, supplemented with questionnaire survey data. The total leisure tourism value (Table 4) came to 73,821.00 × 104 CNY × yr−1. The breakdown of this total shows that the semi-natural East Lake contributed the majority, 71,940.00 × 104 CNY × yr−1, followed by the artificial Ziyang Lake, 1168.20 × 104 CNY × yr−1, and the natural Zhangdu Lake, 712.80 × 10⁴ CNY × yr−1. When comparing value per unit area, however, the artificial lake surpassed both the semi-natural and natural lakes.
In sum, the direct use value per unit area of urban lake wetlands is influenced by the extent of human intervention. The more significant the artificial influence, the higher the direct use value per unit area per year, while less artificial influence corresponds to a lower direct use value.

3.1.2. Indirect Use Value (IUV)

Carbon Sequestration and Oxygen Release Value (V4)

The carbon sequestration and oxygen release values were obtained by measuring these quantities in the aquatic vegetation of each lake and then monetizing them using the shadow price method. The total value of carbon sequestration and oxygen release (Table 5) for the three urban lakes amounted to 281.33 × 10⁴ CNY × yr−1. Zhangdu Lake, a natural lake, had the highest value, followed by the semi-natural East Lake and then the artificial Ziyang Lake.

Transpiration Value (V5)

The transpiration value, a key measure of the heat absorption function of urban lake wetlands, was calculated through monetization and transformation of the heat absorption function index. The total transpiration value (Table 5) across the three urban lake wetlands was 145,294.98 × 104 CNY × yr−1. The semi-natural East Lake contributed the most, 120,090.39 × 104 CNY × yr−1, followed by the natural Zhangdu Lake, 24,758.55 × 104 CNY × yr−1, and finally, the artificial Ziyang Lake, 446.04 × 10⁴ CNY × yr−1.

Water Purification Value (V6)

Water purification values were estimated by analyzing three different indexes of the water purification function for each type of lake and then monetizing the results. The laboratory testing results showed that the total nitrogen in the water bodies of the three studied lakes was 3.10 mg/L, 1.02 mg/L, and 0.72 mg/L, and the total phosphorus content was 0.39 mg/L, 0.05 mg/L, and 0.14 mg/L. The total value of water purification (Table 5) for the three urban lake wetlands was 94.00 × 10⁴ CNY × yr−1. The semi-natural East Lake had the highest water purification value, followed by the natural Zhangdu Lake and then the artificial Ziyang Lake.

Flood Control Value (V7)

The flood control values were derived by quantifying the homogenized flood function indices of the three targeted lakes and then monetizing the results. The total economic value of the flood control function (Table 5) across the three lakes was 4893.97 × 104 CNY × yr−1. The semi-natural East Lake contributed the most to this value, followed by the natural Zhangdu Lake and then the artificial Ziyang Lake.

Biodiversity Maintenance Value (V8)

The biodiversity maintenance values of the three lakes were obtained by following Costanza [42], and Chen and Zhang [43]. The total biodiversity maintenance value (Table 5) across the three lakes was 1845.88 × 104 CNY × yr−1. Here, too, the semi-natural East Lake contributed the most to the total value, followed by the natural Zhangdu Lake, and lastly, the artificial Ziyang Lake.

Research and Education Value (V9)

The research and education values of the three lakes were also calculated using the result reference method. The semi-natural East Lake had the highest value, followed by the natural Zhangdu Lake and, finally, the artificial Ziyang Lake.
The comparison of indirect use value per unit area of the three urban lake wetlands showed little difference, ranging between 20 and 23 CNY × m−2 × yr−1 (Table 5). This underlines the importance of urban lake wetlands and the need to protect them to ensure their sustainable existence, which plays a key role in enhancing the urban ecological environment.

3.1.3. Non-Use Value (NUV)

Respondents’ Environmental Awareness

Our survey on the importance of the non-use value (NUV) of Wuhan urban lakes and wetlands revealed that 88.2% of the respondents consider the NUV of Wuhan urban lakes as highly important, 9.7% are indifferent, and 2.1% view it as not essential. In terms of the current environmental quality of urban lakes and wetlands in Wuhan, 58.8% of the respondents believe that it is deteriorating, 25.8% opine that the overall quality remains unchanged, and 15.4% assert that it is improving.

Importance of NUV Components

When asked to evaluate the importance of the three components of the NUV of urban lake wetlands—existence value, bequest value, and option value—the respondents, on average, assigned the highest importance to existence value (2.509), followed by bequest value (2.188) and, finally, option value (1.692) (as shown in Figure 2).

Respondents’ Willingness to Pay (WTP) Per Capita

The statistical analysis of the survey samples indicated that the mean WTP in Zhangdu Lake is 114.57 CNY× yr−1. Applying the linear interpolation method to obtain the median value of 50%, the WTP per capita was found to be 48.4 CNY × yr−1. Similarly, the mean WTP values of East Lake and Ziyang Lake were 108.71 CNY × yr−1 and 100.38 CNY × yr−1, respectively, and the median WTP values obtained by the same method were 49.6 CNY × yr−1 and 44.0 CNY × yr−1, respectively (Figure 3).

Total Payment Value (Vwtp) and Its Decomposition

The median, as a positional mean, is often used to replace the arithmetic mean to calculate Vwtp to avoid large errors. According to the 2020 Wuhan Yearbook [19], the total population of Wuhan in 2018 was about 110,810,000 people. The Vwtp of each lake, as calculated with the median WTP of Zhangdu Lake, East Lake, and Ziyang Lake (70.78%, 70.09%, and 56.92%, respectively), was 2.85 × 10⁸ CNY × yr−1, 2.89 × 10⁸ CNY × yr−1, and 2.08 × 10⁸ CNY × yr−1, respectively. The respondents were willing to pay the highest proportion of existence value, which is more than 50% for each lake, followed by heritage value and option value (Figure 4).

Correlation Analysis between Social Characteristics of Respondents and WTP

An X2 analysis was conducted to examine the correlation between the respondents’ social characteristics and their willingness to pay (WTP). The results, summarized in Table 6, indicate that for Zhangdu Lake, the age of the respondents showed a significant influence on WTP. In contrast, factors such as gender, occupation, professional title, annual income, and education level had no notable effect.
The WTP for East Lake was significantly influenced by the respondents’ age and annual income, whereas gender, occupation, professional title, and education level showed no significant impact.
For Ziyang Lake, the respondents’ annual income and educational level had a considerable effect on WT#$P, while gender, age, occupation, and professional title had no significant influence. Furthermore, a higher proportion of respondents of older age, higher annual income, and higher education level expressed a willingness to pay.

Correlation Analysis between Social Characteristics of Respondents and Payment Value

Further analysis demonstrated that respondents’ social characteristics significantly influenced WTP values (Table 7). The Vwtp of Zhangdu Lake and East Lake were significantly influenced by the respondents’ annual income, professional title, and educational level. The factors that significantly influenced the Vwtp of Ziyang Lake were the respondents’ annual income and educational level. Gender, age, and occupation had no significant effect on Vwtp in the three lakes. In addition, respondents with higher annual income, higher education level, and higher professional titles expressed a higher willingness to pay.

3.2. Results of Water Quality Assessment

The water quality analysis of the three targeted lakes in Wuhan (Appendix A, Table A1, Table A2 and Table A3) reveals important insights into the respective water quality and purification values. The lakes exhibited varying nutrient levels, with Zhangdu showing the highest total nitrogen (TN) and total phosphorus (TP) concentrations, while East Lake displayed the lowest levels (Table A1). These differences in nutrient levels can significantly affect the lakes’ biological productivity and overall water quality.
In terms of heavy metal concentrations, Ziyang Lake had the highest average arsenic (As) concentration (Table A2). Traces of copper (Cu) were also detectable in both Zhangdu and East Lakes. Notably, while none of the lakes exceeded any dangerous threshold levels for the metals tested (including Cu, zinc (Zn), lead (Pb), cadmium (Cd), mercury (Hg), and As), the presence of these elements underscores the importance of ongoing monitoring.
The water purification values, estimated based on nutrient levels and each lake’s water volume, showed that East Lake exhibited the highest water purification value (Table A3). This is likely due to its larger water volume compared to the other two lakes. It is crucial to understand that the purification capacity of a lake is an invaluable ecosystem service, serving to naturally improve water quality.
These results shed light on the current state of these urban lakes in Wuhan, emphasizing the need for continued monitoring and management to maintain and improve their water quality and ecological health.

4. Discussion

Our findings have several implications for wetland management strategies and policy. The high non-use value (NUV) and willingness to pay (WTP) suggest that policies aimed at preserving and improving these wetlands would receive strong public support. Furthermore, this high non-use value points towards the importance of these wetlands in providing long-term, inherent benefits, such as biodiversity maintenance, carbon sequestration, and flood control. Therefore, management strategies should focus on the preservation of these inherent qualities of the wetlands. Finally, the issues related to pollution highlighted in our results suggest a need for policies and regulations that control and reduce pollution sources in and around these wetlands.
Another important finding of our study is the impact of current management issues on the ecological service function values and ecological compensation. Our research highlights that the lack of a well-established lake management system, fragmented approach to management, insufficient funding, and failure to involve beneficiary households have all contributed to the degradation of the wetlands. This degradation, in turn, reduces their ecological service function values, as the services they provide, such as water quality purification, flood control, and biodiversity maintenance, are diminished. As for ecological compensation, the aforementioned management issues make it difficult to maintain the wetlands and restore them if degraded, thus increasing the cost of ecological compensation. Therefore, improving the management of these wetlands would not only increase their ecological service function values but also reduce the cost of ecological compensation.
The water quality analysis revealed notable differences in the nutrient levels and heavy metal concentrations among the three lakes, emphasizing the need for ongoing monitoring and management. The higher concentrations of total nitrogen (TN) and total phosphorus (TP) in Zhangdu Lake and the detection of copper (Cu) in both Zhangdu and East lakes underline the importance of regulating sources of these pollutants. On the other hand, the higher arsenic (As) concentration in Ziyang Lake calls for a more thorough investigation into potential pollution sources.
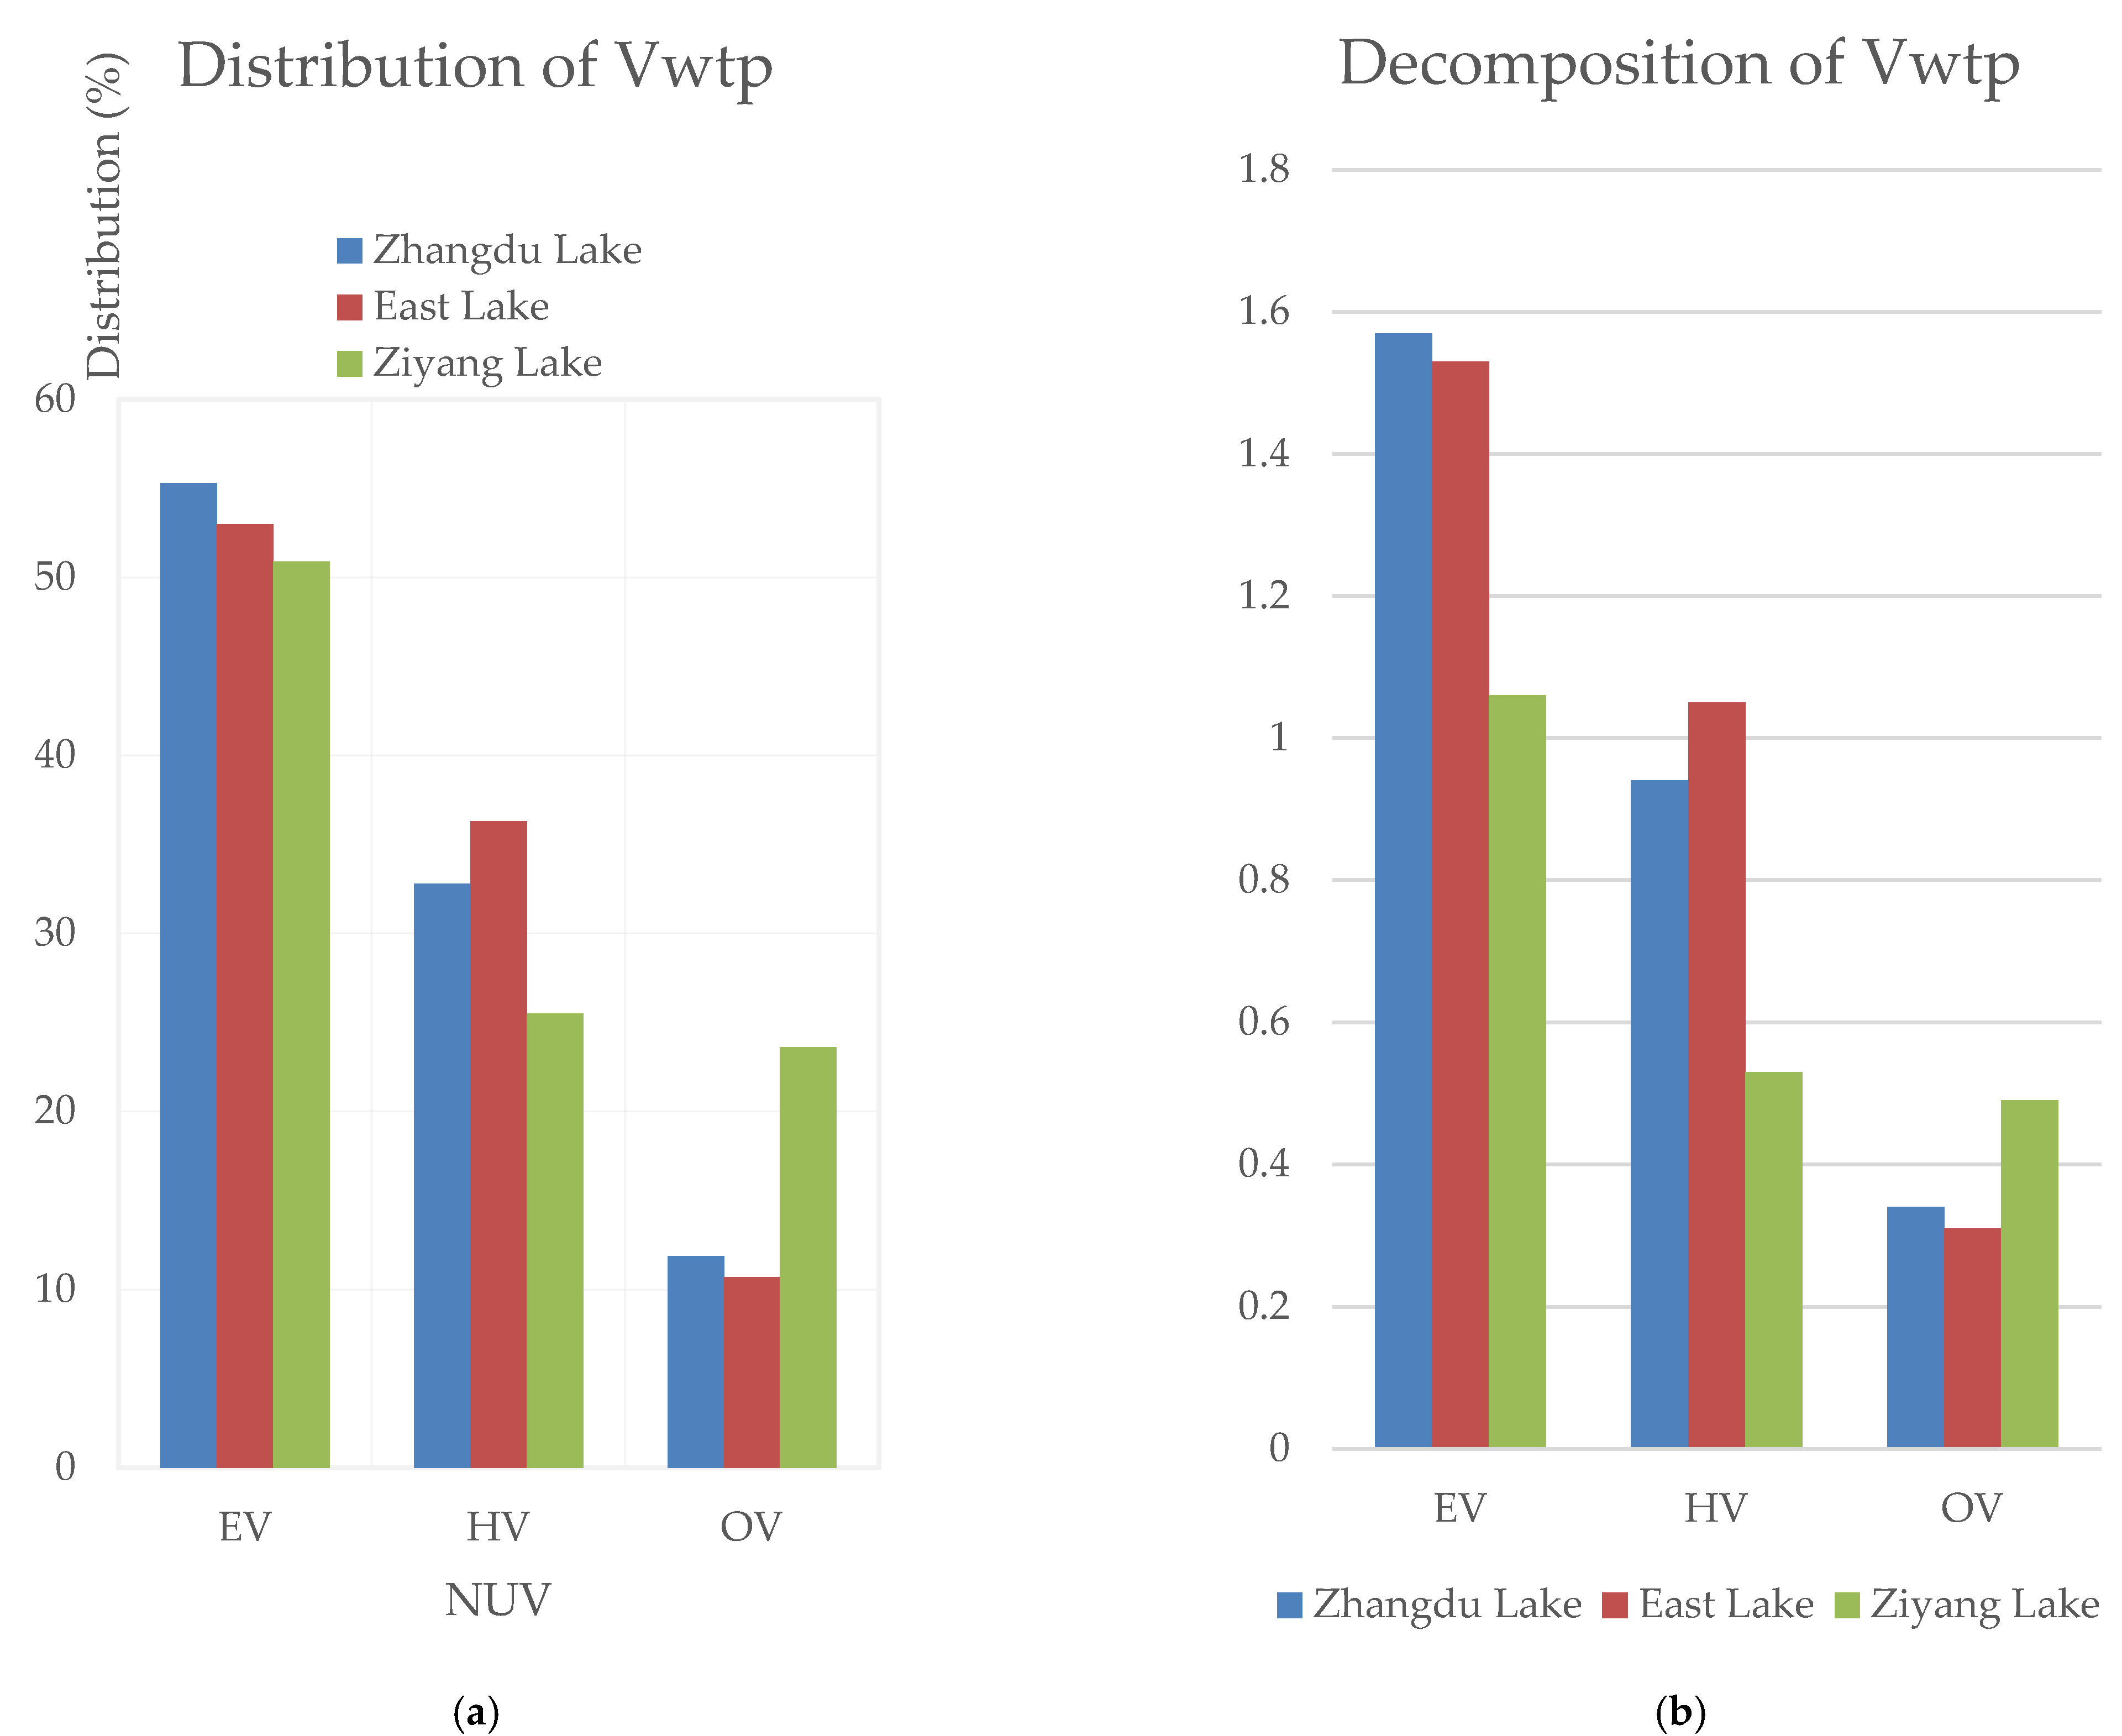
The results of IUV provide valuable insights into the public’s perception of the non-use value of urban lakes and wetlands in Wuhan. The considerable proportion of the non-use value, when compared to the direct and indirect use value, indicates a strong societal recognition of the inherent and long-term benefits of these wetlands, even when they are not directly used.
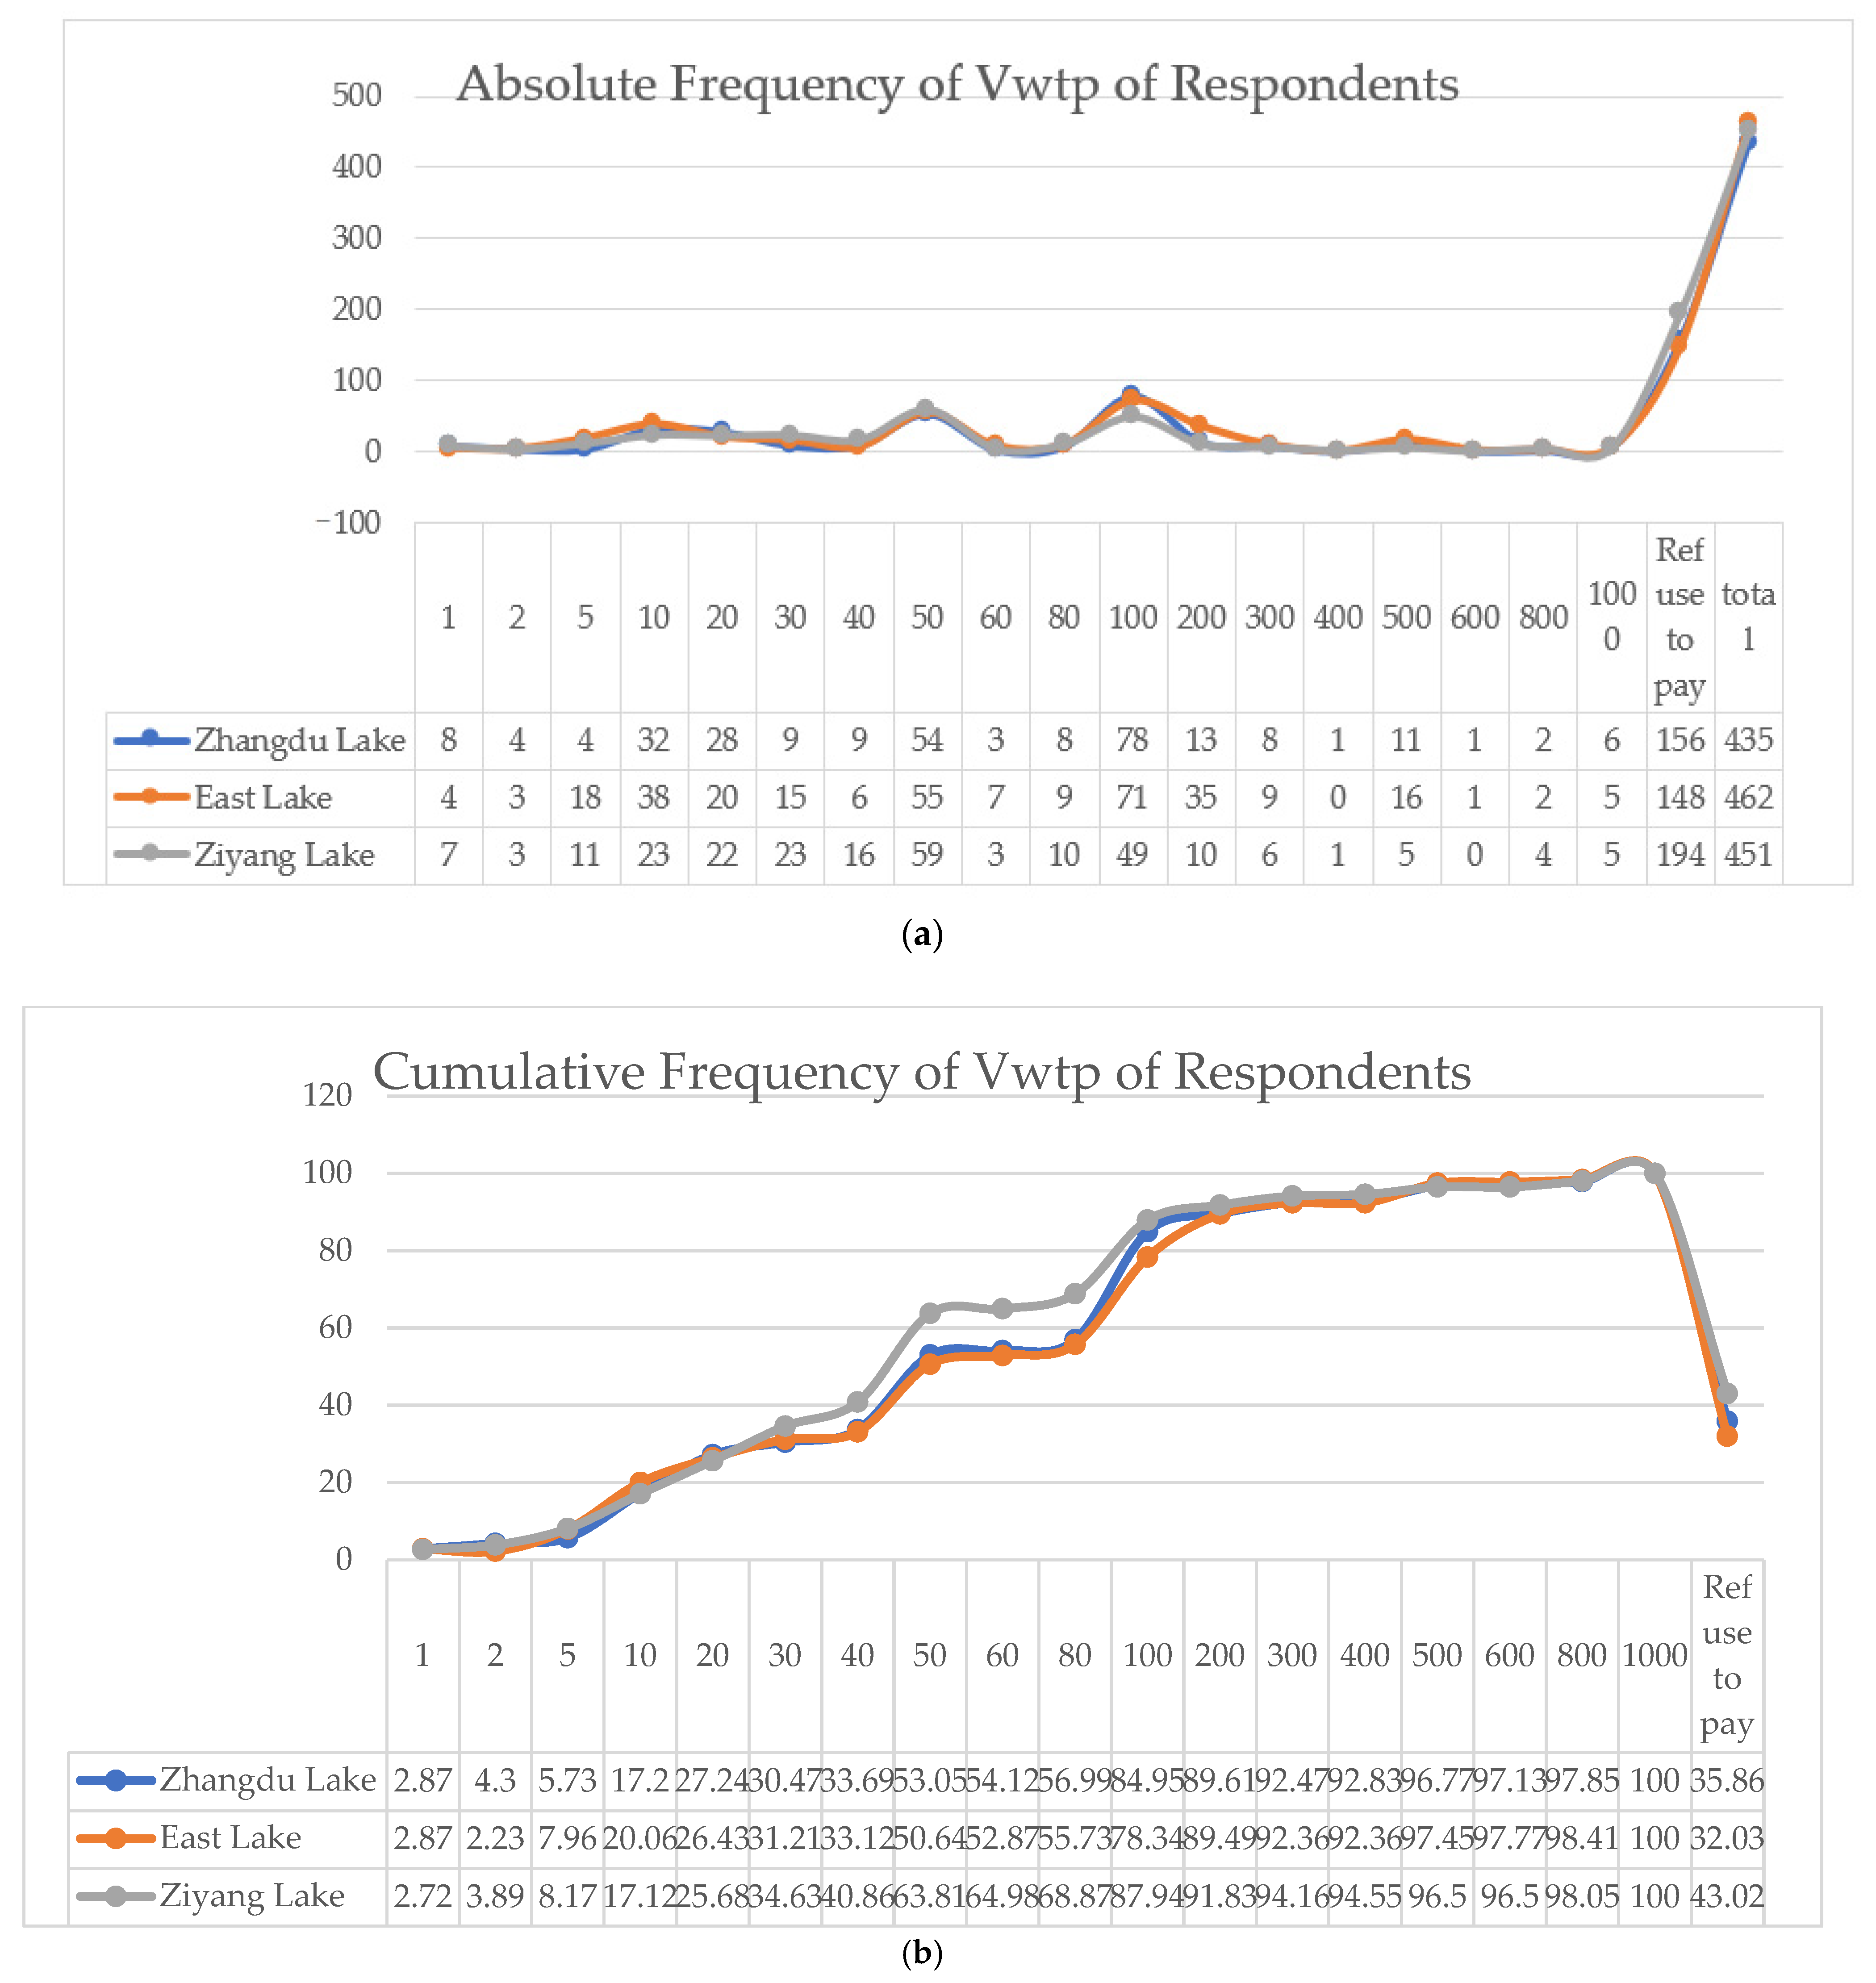
Interestingly, a high level of willingness to pay was observed among the respondents. This suggests strong public support for the preservation and improvement of these wetlands. However, it is also evident that there is a lack of practical understanding and concern about the current status and issues of urban lake wetlands. This calls for more extensive awareness campaigns to foster informed participation in conservation efforts.
A notable point of discussion is the role of social characteristics in shaping individuals’ willingness to pay. The survey results suggest that higher income levels, advanced education, and professional titles are positively associated with a higher willingness to pay. This could potentially guide targeted educational and awareness initiatives.
The higher WTP per capita for East Lake, despite respondents’ dissatisfaction with its development and degree of interference, is intriguing. It could be attributed to the lake’s status as a national scenic area, which possibly raises its perceived value. Similarly, the relatively high payment values for the more natural lake, Zhangdu Lake, could be attributed to a preference for less-disturbed ecosystems.
However, it is also important to note that the size of the lakes did not significantly influence their Vwtp. This suggests that the perceived value of the lakes is not just about their size but other factors, such as their ecological health, accessibility, and amenity value. This finding underscores the importance of comprehensive lake management strategies that consider more than just the physical size of the water body.
The correlation between the paid value distribution and the importance evaluation of non-use value components of lakes underscores the consistency in respondents’ perceptions of these values. This consistency could be leveraged in future communication and awareness initiatives to emphasize the importance of preserving these ecosystems for their inherent non-use values.

5. Conclusions and Recommendations

5.1. Conclusions

This study, grounded in the theories and methods of eco-economics and resource economics, evaluated the wetland resources’ various functions, including resource, environment, and social functions. The water quality analysis of the three lakes in Wuhan revealed differences in nutrient levels and heavy metal concentrations, indicating the need for regular monitoring and targeted management strategies. The assessment of the value of ecosystem services also highlighted the significant role these lakes play in water purification. The findings also underscored the indirect use value (IUV) of wetlands as the most considerable, accounting for 43.47% of the total ecosystem service function value. This emphasizes the need to enhance the wetlands’ ability to improve the ecological environment. Conversely, the direct use value (DUV) was the least at 23.61%, indicating that the wetlands’ primary role is not merely human service.
The non-use value (NUV) of the wetlands, higher than both DUV and IUV and constituting 32.92% of the total value, demonstrated a willingness among people to invest in preserving wetlands for their environmental benefits. However, the absence of an efficient lake management system and the burden placed solely on industries have led to public pollution. This study underlines the need to consider the ecological and environmental benefits of urban lake wetlands in their preservation and management decisions. The results suggest that less human disturbance results in higher water conservation value in the wetlands.

5.2. Recommendations

Our findings underscore the need for several key strategies to ensure the sustained health and value of urban lake wetlands in Wuhan city. Chief among these is the continued monitoring and management of water quality. The variations in nutrient levels and heavy metal concentrations among the lakes highlight the necessity of regular monitoring and swift, targeted intervention when needed.
Moreover, public education and engagement are instrumental in preserving these natural resources. It is essential to foster an informed public that appreciates the importance of these wetlands and understands the role they can play in their conservation.
Regulations must be strengthened and enforced to control and prevent pollution in and around the wetlands. The introduction of stricter regulations for potential pollution sources, such as industrial activities, is of paramount importance.
Efforts to enhance the ecosystem services provided by these wetlands, such as increasing biodiversity and improving water purification capabilities, should be prioritized.
Finally, the insights derived from this study can inform policy decisions. Recognizing the economic value of these wetlands and society’s willingness to contribute to their preservation can help shape policies that prioritize and secure their conservation. The integration of this knowledge into policymaking can foster an environment that supports the sustainable management of these critical urban lake wetlands.

Author Contributions

Conceptualization, J.D. and R.P.S.; Data curation, J.D.; Formal analysis, J.D.; Investigation, J.D.; Methodology, J.D. and R.P.S.; Software, J.D.; Supervision, R.P.S.; Validation, R.P.S.; Writing—original draft, J.D.; Writing—review and editing, R.P.S., V.N., T.P.L.N., and A.R. All authors have read and agreed to the published version of the manuscript.

Funding

This research was funded by the Science and Technology Project of the Hubei Geological Bureau (Grant No. KJ2023-30).

Data Availability Statement

The data presented in this study are available on request from the corresponding author.

Acknowledgments

The authors would like to thank the Institute of Geology and Mineral Resources Development of the Sixth Geological Brigade of Hubei Geological Bureau for assisting in the survey and sampling for this project and the laboratory of the Sixth Geological Brigade of Hubei Geological Bureau for assisting in the water quality testing for this project.

Conflicts of Interest

The authors declare no conflict of interest.

Appendix A

Table A1. Total nitrogen (TN) and total phosphorous (TP) in the lakes of Wuhan.
Targeted LakesMean TN Value (mg/L)Mean TP Value (mg/L)
Zhangdu3.100.39
East1.020.05
Ziyang0.720.14
Table A2. Average heavy metal concentrations in the lakes of Wuhan.
Targeted LakesCu (mg/L)Zn (mg/L)Pb (mg/L)Cd (mg/L)As (μg/L)Hg (μg/L)
Zhangdu0.001250.0044750.0250.00052.03776850
East00.00470.01701.1342440
Ziyang0.0010.00450.02704.996786670.303
Table A3. Water purification values of the lakes of Wuhan.
Targeted LakesPtpPtnWater Volume (1010 L)Total Value (104 CNY yr−1)
Zhangdu2.51.50.4106672.31
East2.51.555.33534791.58
Ziyang2.51.50.0769230.11
Table A4. Indicators and methods for calculating direct use value (DUV = V1 + V2 + V3) of ecosystem services.
Value ComponentDefinition and FormulaMethodData Type
V1: Material Production ValueV1 = ΣSi × Yi × PMarket price method [27]Primary data: field survey in 2022—aquaculture product name, aquaculture area Si (m2), yield per unit area Yi (kg); secondary data: aquaculture company—market price P (CNY)
V2: Water Conservation ValueV2 = G = ΣXi (i = 1, 2, … n)Shadow engineering method [44]Primary data: field survey in 2022—the cost of storage ΣXi (CNY); secondary data: Wuhan Water Bureau—the average water level (m), the highest water level (m), the lowest water level (m), capacity per unit storage volume (m3)
V3: Leisure Tourism ValueV3 = ΣViTravel cost method [45]Primary data: questionnaire in 2022—tourism cost per capita Σvi (CNY), e.g., accommodation, food, transportation, entrance fee, etc.; secondary data: Wuhan Yearbook 2020—number of tourists (2 × 10⁴/yr), average daily wage per person (CNY 260), opportunity wage cost (CNY 260/3 = CNY 86)
Table A5. Indirect use value (IUV = V4 + V5 + V6 + V7 + V8 + V9) indicators and methods of ecosystem services values.
Value Component (DUV)Definition and FormulaMethodData Type
V4: Carbon Sequestration ValueV4 = Q × PShadow price method [46]Primary data: field survey in 2022—vegetation types (emergent, floating, and submerged), fresh weight (g), constant weight (g) (baked in an oven at 85 °C); secondary data: chemical equation of photosynthesis: CO2 + H2O → C6H12O6 + O2 → polysaccharide—1 g dry matter concentrate 1.63 g CO2 and 1.2 g O2; price CO2 absorption (afforestation cost: 250 CNY × t − 1); price O2 release (afforestation cost: 352.93 CNY × t − 1) [47]
V5: Transpiration ValueV5 = Σ (CMi∆Ti/3.6 × 106) × PEfficiency alternative method [44]Secondary data: Wuhan Environmental Protection Bureau and environmental monitoring station [48]—average temperature in Jul., Aug., and Sep. (30.0 °C, 29. 5 °C, 28. 5 °C), the evaporation volume (m3), the market price of residential electricity (CNY 0.57/kilowatt hour)
V6: Water Purification ValueV6 = M × PPollution cost method [49]Primary data: lab analysis in 2022—total phosphorus (mg/L), total nitrogen (mg/L), heavy metal operation (Cu, Zn, Cd, Pb, and Hg); secondary data: HJ 636-2012—total nitrogen ¥1.5 /kg, GB 11893-89—total phosphorus ¥2.5 /kg [50]
V7: Homogenized Flood Value V7 = G = ΣXi (i = 1,2,...n)Shad-ow engineering method [51]Primary data: field survey in 2022—the product of the amount of flood storage in flood season (kg); secondary data: the cost of storage capacity per unit storage volume (yuan), construction cost ¥0.67/ m3 [52]
V8: Biodiversity Maintenance ValueResult reference method [53] Secondary data: Costanza et al. [42], the wetland sanctuary value ($304 hm -2 yr-1) [18], biodiversi-ty value per unit area of global
wetland ecosystem species
V9: Scientific Research & Education Value Result reference method [54] Secondary data: average value of China’s wetland ecosystem per unit area, -the average value of Costanza et al.’s assessment [42], average value of cultural function of systematic scientific research (¥3,897. 80 /hm2) [55]
Table A6. Non-use value (NUV = V10 + V11 + V12) indicators and methods of ecosystem services values.
Value Component (NUV)Definition and FormulaMethodData Type
V10: Existence ValueVwtp = WTP × NContingent value method [56]Primary data: questionnaire in 2022—the Vwtp per person (CNY), the actual population willing to pay in the surveyed place (CNY)
V11: Heritage ValueVwtp = WTP × NContingent value method [56]Primary data: questionnaire in 2022—the Vwtp per person (CNY), the actual population willing to pay in the surveyed place (CNY)
V12: Election ValueVwtp = WTP × NContingent value method [56]Primary data: questionnaire in 2022—the Vwtp per person (CNY), the actual population willing to pay in the surveyed place (CNY)

References

  1. Goodwin, E.-J. Convention on Wetlands of International Importance, especially as Waterfowl Habitat 1971 (Ramsar). Multilateral Environmental Treaties, 2017. Available online: https://en.unesco.org/about-us/legal-affairs/convention-wetlands-international-importance-especially-waterfowl-habitat (accessed on 18 February 2022).
  2. Vepraskas, M.-J. Wetlands, Third Edition. J. Environ. Qual. 2002, 31, 979–1016. [Google Scholar] [CrossRef]
  3. Marconi, P.; Arengo, F.; Clark, A. The arid Andean plateau waterscapes and the lithium triangle: Flamingos as flagships for conservation of high-altitude wetlands under pressure from mining development. Wetl. Ecol. Manag. 2022, 30, 827–852. [Google Scholar] [CrossRef]
  4. Huang, Q.; Fang, C. Progresses of Wetland Ecosystem Field Monitoring in Nanji Wetland National Nature Reserve, South of Poyang Lake. Wetl. Sci. 2017, 6, 199–210. [Google Scholar]
  5. Daily, G.-C. Nature’s Services: Societal Dependence on Natural Ecosystems; Island Press: Washington, DC, USA, 1997. [Google Scholar]
  6. United Nations. Ecosystems and Human Well-Being: A Framework for Assessment; United Nations: New York, NY, USA, 2003. [Google Scholar]
  7. Marsh, G.P. Man and Nature; Charles Scribner: New York, NY, USA, 1864. [Google Scholar]
  8. Warde, P.; Sörlin, S. Road to survival. Soil Sci. 1948, 67, 75. [Google Scholar]
  9. King, R.-T. Wildlife and Man; New York State Conservation Department: New York, NY, USA, 1966. [Google Scholar]
  10. Holdren, J.-P.; Ehrlich, P.-R. Human population and the global environment. Am. Sci. 1974, 62, 282. [Google Scholar]
  11. Westman, W.E. How much are nature’s service worth? Science 1977, 197, 960–964. [Google Scholar] [CrossRef]
  12. Grand-Clement, E.; Anderson, K.; Smith, D.; Luscombe, D.; Gatis, N.; Ross, M.; Brazier, R.E. Evaluating ecosystem good and services after restoration of marginal upland peatlands in South-West England. J. Appl. Ecol. 2013, 50, 324–334. [Google Scholar] [CrossRef]
  13. Jenkins, W.A.; Murray, B.C.; Kramer, R.A.; Faulkner, S.P. Valuing ecosystem services from wetlands restoration in the Mississippi Alluvial Valley. Ecol. Econ. 2010, 69, 1051–1061. [Google Scholar] [CrossRef]
  14. Grossmann, M. Economic value of the nutrient retention function of restored floodplain wetlands in the Elbe River basin. Ecol. Econ. 2012, 83, 108–117. [Google Scholar] [CrossRef]
  15. Han, M.; Cui, J.; Hao, Z.; Wang, Y.; Wang, R. Eco-compensation of wetlands in Yellow River Delta of Shandong Province, China. Chin. Geogr. Sci. 2012, 22, 119–126. [Google Scholar] [CrossRef]
  16. Wong, C.P.; Jiang, B.; Kinzig, A.P.; Lee, K.N.; Ouyang, Z. Linking ecosystem characteristics to final ecosystem services for public policy. Ecol. Lett. 2015, 18, 108–118. [Google Scholar] [CrossRef] [Green Version]
  17. Cuperus, R.; Canters, K.J.; Piepers, A.A. Ecological compensation of the impacts of a road. Preliminary method for the A50 road link (Eindhoven-Oss, The Netherlands). Ecol. Eng. 1996, 7, 327–349. [Google Scholar] [CrossRef]
  18. Allen, A.-O.; Feddema, J.-J. Wetland loss and substitution by the Section 404 permit program in southern California, USA. Environ. Manag. 1996, 20, 263–274. [Google Scholar] [CrossRef]
  19. Wang, W. Wuhan Statistic Yearbook; China Statistics Press: Wuhan, China, 2020. [Google Scholar]
  20. Johst, K.; Drechsler, M.; Wätzold, F. An ecological-economic modelling procedure to design compensation payments for the efficient spatio-temporal allocation of species protection measures. Ecol. Econ. 2002, 41, 37–49. [Google Scholar] [CrossRef]
  21. Pan, W.; Tang, T.; Deng, H.; Cai, Q. Evaluation of Lake Ecosystem Services: A Case Study of Baoan Lake in Hubei Province. Chin. J. Appl. Ecol. 2012, 13, 1315–1318. [Google Scholar]
  22. Kleijn, D.; Berendse, F.; Smit, R.; Gilissen, N.; Smit, J.; Brak, B.; Groeneveld, R. Ecological Effectiveness of Agri-Environment Schemes in Different Agricultural Landscapes in The Netherlands. Conserv. Biol. 2004, 18, 775–786. [Google Scholar] [CrossRef]
  23. Ning, L.M.; Wang, X.L. A Study on the Change of Ecosystem Service Value in Wuhan City Based on RS and GIS. Ecol. Environ. 2006, 15, 637–640. [Google Scholar]
  24. Li, X.; Ren, L.; Liu, Y.; Craft, C.; Mander, Ü.; Yang, S. Evaluation of Wetland Ecosystem Service Value in the Yangtze River Estuary. Resour. Environ. Yangtze Basin 2013, 12, 411–416. [Google Scholar]
  25. Yamane, T. Statistics, An Introductory Analysis, 2nd ed.; Harper and Row: New York, NY, USA, 1967. [Google Scholar]
  26. Zhang, Z.Q. Evaluation of Restoration Value of Ecosystem Services in Zhangye City of the Heihe River Basin, China. J. Nat. Resour. 2014, 3, 230–238. [Google Scholar]
  27. Ren, Z.Y.; Li, J. Evaluation of the Ecological Function of Vegetation in the Mountains, Southern Shanxi. Acta Geogr. Sin. 2013, 58, 503–511. [Google Scholar]
  28. Rubec, C.D.A.; Hanson, A.R. Wetland mitigation and compensation: Canadian experience. Wetl. Ecol. Manag. 2009, 17, 3–14. [Google Scholar] [CrossRef]
  29. Jenkins, M.; Scherr, S.J.; Inbar, M. Markets for Biodiversity Services: Potential Roles and Challenges. Environ. Sci. Policy Sustain. Dev. 2004, 46, 32–42. [Google Scholar] [CrossRef]
  30. Sun, G.Y. Progress and Prospect of Wetland Science in China. Prog. Geogr. 2010, 15, 666–672. [Google Scholar]
  31. Sheng, G.; Chen, H.; Ferretti-Gallon, K.; Innes, J.L.; Wang, Z.; Zhang, Y.; Wang, G. Water Ecological Environment Value and Protection Countermeasures; Tsinghua University Press: Beijing, China, 2014. [Google Scholar]
  32. MoEP. Water Quality—Determination of Orthophosphate and Total Phosphorus—Continuous Flow Analysis (CFA) and Ammonium Molybdate (HJ 670—2013); National Environmental Protection Standards of the People’s Republic of China. Ministry of Environmental Protection: Beijing, China, 2013.
  33. Jianwei, L. Study on the influence factors of ammonium molybdate spectrophotometric determination of total phosphorus in water. China Resour. Compr. Util. 2022, 4, 20–22. [Google Scholar]
  34. Yunqi, H. Discussion on determination of total phosphorus in water by ammonium molybdate spectrophotometry. Biol. Chem. Ind. 2019, 5, 98–101. (In Chinese) [Google Scholar]
  35. Ruli, G. Analysis of factors affecting the determination of total nitrogen in water by potassium persulfate method. Water Saf. 2023, 5, 85–87. [Google Scholar]
  36. MoEP. Water Quality–Determination of 65 Elements. Inductively Coupled Plasma-Mass Spectrometry (HJ 700—2014); National Environmental Protection Standards of the People’s Republic of China. Ministry of Environmental Protection: Beijing, China, 2014.
  37. Lin, Y.; Zhiwei, W. Determination of Molybdenum, cobalt, beryllium, antimony, nickel, barium, vanadium, titanium and thallium in drinking water by ICP-MS. Spectr. Lab. 2011, 28, 1852–1855. [Google Scholar]
  38. Shuo, L.; Yuan, L. Determination of trace elements in Yellow River Water by inductively coupled plasma mass spectrometry. Gansu Sci. Technol. 2015, 31, 32–34. (In Chinese) [Google Scholar]
  39. MoEP. Water Quality–Determination of Mercury, Arsenic, Selenium, Bismuth and Antimony—Atomic Fluorescence Method (HJ 694–2014); National Environmental Protection Standards of the People’s Republic of China. Ministry of Environmental Protection: Beijing, China, 2014.
  40. Li, Y. Effect of potassium borohydride concentration on determination of arsenic, selenium and mercury in water by atomic fluorescence method. Environ. Sci. Technol. 2020, 26, 50–53. [Google Scholar]
  41. Xiaoqing, Z.; Weiwei, Z. Experimental study on determination of Arsenic, mercury and Selenium in Water by hydrogenation-atomic fluorescence method. J. Yunnan Norm. Univ. 2013, 33, 54–58. (In Chinese) [Google Scholar]
  42. Costanza, R.; d’Arge, R.; De Groot, R.; Farber, S.; Grasso, M.; Hannon, B.; Limburg, K.; Naeem, S.; O’neill, R.V.; Paruelo, J.; et al. The Value of the World’s Ecosystem Services and Natural Capital. Nature 1997, 387, 253–260. [Google Scholar] [CrossRef]
  43. Chen, Z.; Zhang, X. The Value of ecosystem Benefits in China. Chin. Sci. Bull. 2000, 45, 17–22. [Google Scholar]
  44. Yang, L.; Kong, F.L.; Xi, M.; Li, Y.; Wang, S. Evaluation of Environmental Economic Value of Constructed Wetland and Case Study. Res. Environ. Sci. 2015, 18, 70–73. [Google Scholar]
  45. Zhang, X.F.; Liu, Z.W.; Xie, Y.F.; Chen, G.R. Evaluation of Water Ecosystem Services in the Process of Urban Lake Degradation Evolution Assessment: A Case Study of the Fairy Lake in Zhaoqing, China. Acta Ecol. Sin. 2017, 27, 2349–2354. [Google Scholar]
  46. Duan, X.N.; Wang, X.K.; Ouyang, Z.Y. Ecosystem Services and Value Assessment of Wuliangsuhai Wetland. Resour. Sci. 2015, 27, 110–115. [Google Scholar]
  47. Sierra-Maldonado, R.; Russman, E. On the efficiency of environmental service payments: A forest conservation assessment in the Osa Peninsula, Costa Rica. Ecol. Econ. 2006, 59, 131–141. [Google Scholar] [CrossRef]
  48. Wuhan Environmental Monitoring Center. Wuhan River Water Quality. Wuhan Hydrol. Bull. 2020, 1, 45–53. [Google Scholar]
  49. Dietschi, S.; Holderegger, R.; Schmidt, S.G.; Linder, P. Agri-environment incentive payments and plant species richness under different management intensities in mountain meadows of Switzerland. Acta Oecologica 2007, 31, 216–222. [Google Scholar] [CrossRef]
  50. Bendor, T.; Brozovic, N. Determinants of Spatial and Temporal Patterns in Compensatory Wetland Mitigation. Environ. Manag. 2007, 40, 349–364. [Google Scholar] [CrossRef]
  51. Xue, D.Y.; Bao, H.S.; Li, W.H. Indirect Economic Value Assessment of Forest Ecosystem in Changbai Mountain Nature Reserve. China Environ. Sci. 2019, 19, 247–252. [Google Scholar]
  52. Liu, M.C.; Li, D.Q.; Wen, Y.M. Functional Evaluation of CO2 Emission from Vegetation Fixation in the Three-river Headwaters Region. Ecol. Environ. 2016, 15, 594–597. [Google Scholar]
  53. Costanza, R.; Norton, B.G.; Haskell, B.D. Ecosystem Health: New Goals for Environmental Management; Island Press: Washington, DC, USA, 1992. [Google Scholar]
  54. Ramsar Convention Bureau. The Ramsar Convention: Convention on Wetlands of International Importance Especially Waterfowl Habitat; Pamphlet; Rapport, D.J., Ed.; Dimensions of Ecosystem Health. Ecosystem Health Model; Ramsar Convention Bureau: Gland, Switzerland, 1971; pp. 34–40. [Google Scholar]
  55. Cuperus, R.; Canters, K.J.; Haes, H.A.U.D.; Friedman, D.S. Guidelines for ecological compensation associated with highways. Biol. Conserv. 1999, 90, 41–51. [Google Scholar] [CrossRef]
  56. He, G.Z.; Lv, Y.L.; Wang, X.L. Evaluation of Comprehensive Management of Wuli Lake in Wuxi City by Conditional Valuation Method. Acta Ecol. Sin. 2017, 27, 270–280. [Google Scholar]
Figure 1. Surface water sampling site of selected lakes.
Water 15 02257 g001
Figure 2. Frequency distribution of evaluation on importance and scores of NUV components of lakes.
Water 15 02257 g002
Figure 3. (a) Absolute frequency distribution of WTP value (Vwtp) of respondents; (b) cumulative frequency distribution of WTP value (Vwtp) of respondents.
Water 15 02257 g003
Figure 4. (a) Distribution of willingness to pay value (Vwtp); (b) decomposition of willingness to pay value (Vwtp).
Water 15 02257 g004
Table 1. Characteristics of selected urban lake wetlands in Wuhan [23,24].
Lake NameLake TypeGeographic LocationPrimary UseAdministrative District
Zhangdu LakeNatural113°34′–114°52′ E, 30°32′–30°45′ NLarge ecological landHuangpi
East LakeSemi-natural114°20′–114°55′ E, 30°33′–30°34′ NLake park/natural scenic areaWuchang and Hongshan
Ziyang LakeArtificial114°21′ E, 30°32′ NCity lake parkWuchang and Hongshan
Table 2. List and number of key informants interviewed.
Key Informant CategoryNumber of Informants
Study Area Leaders3
Government Officers2
Resident Representatives3
NGO Officers2
Total10
Table 3. Study lakes and corresponding sample sizes.
Study LakeNumber of HouseholdsSample Size
Zhangdu Lake1974140
East Lake2360167
Ziyang Lake92665
Total5260372
Table 4. Direct use value of urban lake wetlands in Wuhan (in 104 CNY × yr−1).
DUV ComponentsZhangdu LakeEast LakeZiyang Lake
Material production value445.77350.820
Water conservation value2784.636905.2812.44
Leisure tourism value712.8071,940.001168.20
Total DUV3943.2079,196.101180.64
Table 5. Indirect use value of urban lake wetlands in Wuhan (in 104 CNY × yr−1).
IUV ComponentsZhangdu LakeEast LakeZiyang Lake
Carbon Sequestration and Oxygen Release Value236.3744.430.53
Transpiration Value24,758.55120,090.39446.04
Water Purification Value2.3191.580.11
Flood Control Value838.284047.927.77
Biodiversity Maintenance Value315.711524.325.85
Research and Education Value487.682354.459.03
Total IUV26,638.90128,153.09469.33
Table 6. Correlation between WTP and social characteristics of respondents.
Social CharacteristicsGenderAgeOccupationProfessional TitleAnnual IncomeEducation Level
X2Degree of freedom (df)128243
Zhangdu Lake0.2385.234 **7.6141.0863.7992.301
East Lake0.8995.070 **6.6771.2995.788 *0.093
Ziyang Lake0.3390.0184.8362.38013.089 **4.023 *
Note: Significance level * p < 0.05, ** p < 0.01.
Table 7. Correlation between Vwtp and social characteristics of respondents.
Social CharacteristicsGenderAgeOccupationProfessional TitleAnnual IncomeEducation Level
X2Degree of freedom (df)36246129
Zhangdu Lake4.1295.80128.4718.98 *24.011 ***12.929 *
East Lake4.2118.0630.02911.729 **36.40 **13.578 *
Ziyang Lake1.8527.71929.5308.37123.541 ***20.559 **
Note: Significance level * p < 0.05, ** p < 0.01, *** p < 0.001.
Disclaimer/Publisher’s Note: The statements, opinions and data contained in all publications are solely those of the individual author(s) and contributor(s) and not of MDPI and/or the editor(s). MDPI and/or the editor(s) disclaim responsibility for any injury to people or property resulting from any ideas, methods, instructions or products referred to in the content.

