Article

Evaluation of Groundwater Quality for Drinking and Irrigation Purposes Using GIS-Based IWQI, EWQI and HHR Model

1
Yibin Research Institute, Southwest Jiaotong University, Yibin 644000, China
2
Faculty of Geosciences and Environmental Engineering, Southwest Jiaotong University, Chengdu 611756, China
3
Sichuan Institute of Geological Survey, Chengdu 610081, China
*
Author to whom correspondence should be addressed.
Water 2023, 15(12), 2233; https://doi.org/10.3390/w15122233
Submission received: 25 May 2023 / Revised: 7 June 2023 / Accepted: 12 June 2023 / Published: 14 June 2023
(This article belongs to the Topic Groundwater Pollution Control and Groundwater Management)

Abstract

:
Groundwater pollution has emerged as a significant water crisis in various regions around the globe. Groundwater serves as a crucial source of water for human consumption and agricultural activities in the Sichuan Basin where groundwater quality has yet to be concentrated. A total of 41 groundwater samples were collected from domestic wells in Suining city of the Sichuan Basin, which were used for analyzing the hydrogeochemical processes and suitability for irrigation and drinking purposes. In the study area, groundwater samples belonged to the HCO3-Ca type. Hydrochemical compositions were dominated by carbonate and silicate mineral dissolution with positive cation exchange. Agricultural activities and urban sewage were the primary sources of NO3 pollution. The irrigation water quality index (IWQI) was calculated using electronic conductivity (EC), Na+, Cl, HCO3, and sodium adsorption ratio (SAR). The IWQI values showed that the suitability of groundwater irrigation was generally good and presented the decreasing trend southeastwardly. According to the entropy-weighted water quality index (EWQI), the groundwater quality for drinking purposes was generally good. However, there were some local areas with poor water quality concentrated in the southeast part. According to the human health risk (HHR) model, the groundwater was deemed safe for adults and children. However, for infants, the nitrate level in the groundwater remained high and posed potential health risks. The combined IWQI and EWQI evaluation served as a valuable reference for the utilization of the groundwater resource in the Sichuan Basin, as well as other comparable regions worldwide.

1. Introduction

Groundwater is a valuable natural resource that is crucial to numerous human activities [1]. Groundwater has become the primary water source for industry and agriculture in the world, due to its extensive coverage area, large storage capacity, excellent water quality, stable flow, and strong resistance to external pollution factors [2,3,4,5,6,7]. The world’s population has been growing exponentially in recent years, posing a significant threat to the quality of groundwater worldwide [8,9,10,11]. The occurrence of many serious water pollution incidents around the world has caused major environmental and health problems [12,13]. In situations where groundwater pollution is extensive, the agricultural industry’s continued use of low-quality groundwater for irrigation can result in soil pollution. This can cause deterioration to the soil’s physical and chemical properties, ultimately leading to a reduction in its fertility [14]. Contaminated groundwater used for domestic and drinking purposes will generate both carcinogenic and non-carcinogenic health risks to humans [15]. Thus far, nitrate, arsenic, and fluoride have been the primary pollutants responsible for groundwater contamination [16].
The suitability of groundwater for irrigation is determined by the mineral elements present in the water and their impact on the soil and crops [17,18]. The quality of groundwater for irrigation is evaluated based on the concentration of anions and cations. Common indicators for evaluating groundwater irrigation quality include the sodium adsorption ratio (SAR), sodium percentage (Na%), permeability index (PI), and residual sodium carbonate (RSC) [19,20,21,22,23]. The irrigation water quality index (IWQI) is a crucial and unique model for evaluating the suitability of groundwater for agricultural irrigation [24]. However, since each groundwater index has different dimensions and magnitudes, principal component analysis (PCA) is often used to simplify IWQI calculations by reducing dimensionality [25]. The entropy-weighted water quality index (EWQI) is a crucial tool for assessing the suitability of groundwater for drinking purposes. It assigns varying weights to different water chemistry parameters based on their characteristics, reducing the impact of subjective weight assignments on calculation results. This improves the accuracy of the evaluation and makes it more objective [26,27]. Nitrate pollution in drinking water has severe implications on human health. Long-term consumption of groundwater with excessive nitrate content can result in methemoglobinemia, digestive cancer, and blue baby syndrome [28]. To validate the sustainable utilization of groundwater resource, it is necessary to assess the groundwater quality for irrigation and drinking purposes.
The Sichuan Basin, located in southwestern China, possesses abundant groundwater resources. The Sichuan Provincial Government has prioritized the management and utilization of these resources. In recent years, numerous scholars have conducted groundwater surveys and evaluations of groundwater quality in the Sichuan Basin and its surrounding areas [24,29,30]. Despite the importance of groundwater resources for agricultural irrigation, studies analyzing and investigating these resources within the Sichuan Basin are scarce. Additionally, the long-time high-dosage nitrogen fertilizer uses and heavy reliance on agricultural fertilizers in the region has led to high levels of nitrate contamination in many areas [31,32,33,34]. This study aims to analyze the hydrochemical characteristics of groundwater and identify the factors dominating hydrochemistry in the Sichuan Basin. Additionally, the study will assess the suitability of groundwater for agricultural irrigation by utilizing the basic irrigation index and IWQI and evaluate the quality of groundwater for drinking purposes and health risk analysis (Figure 1). The findings of this evaluation can serve as a guide for similar areas, while also helping to prevent and manage groundwater resource pollution in the Sichuan Basin.

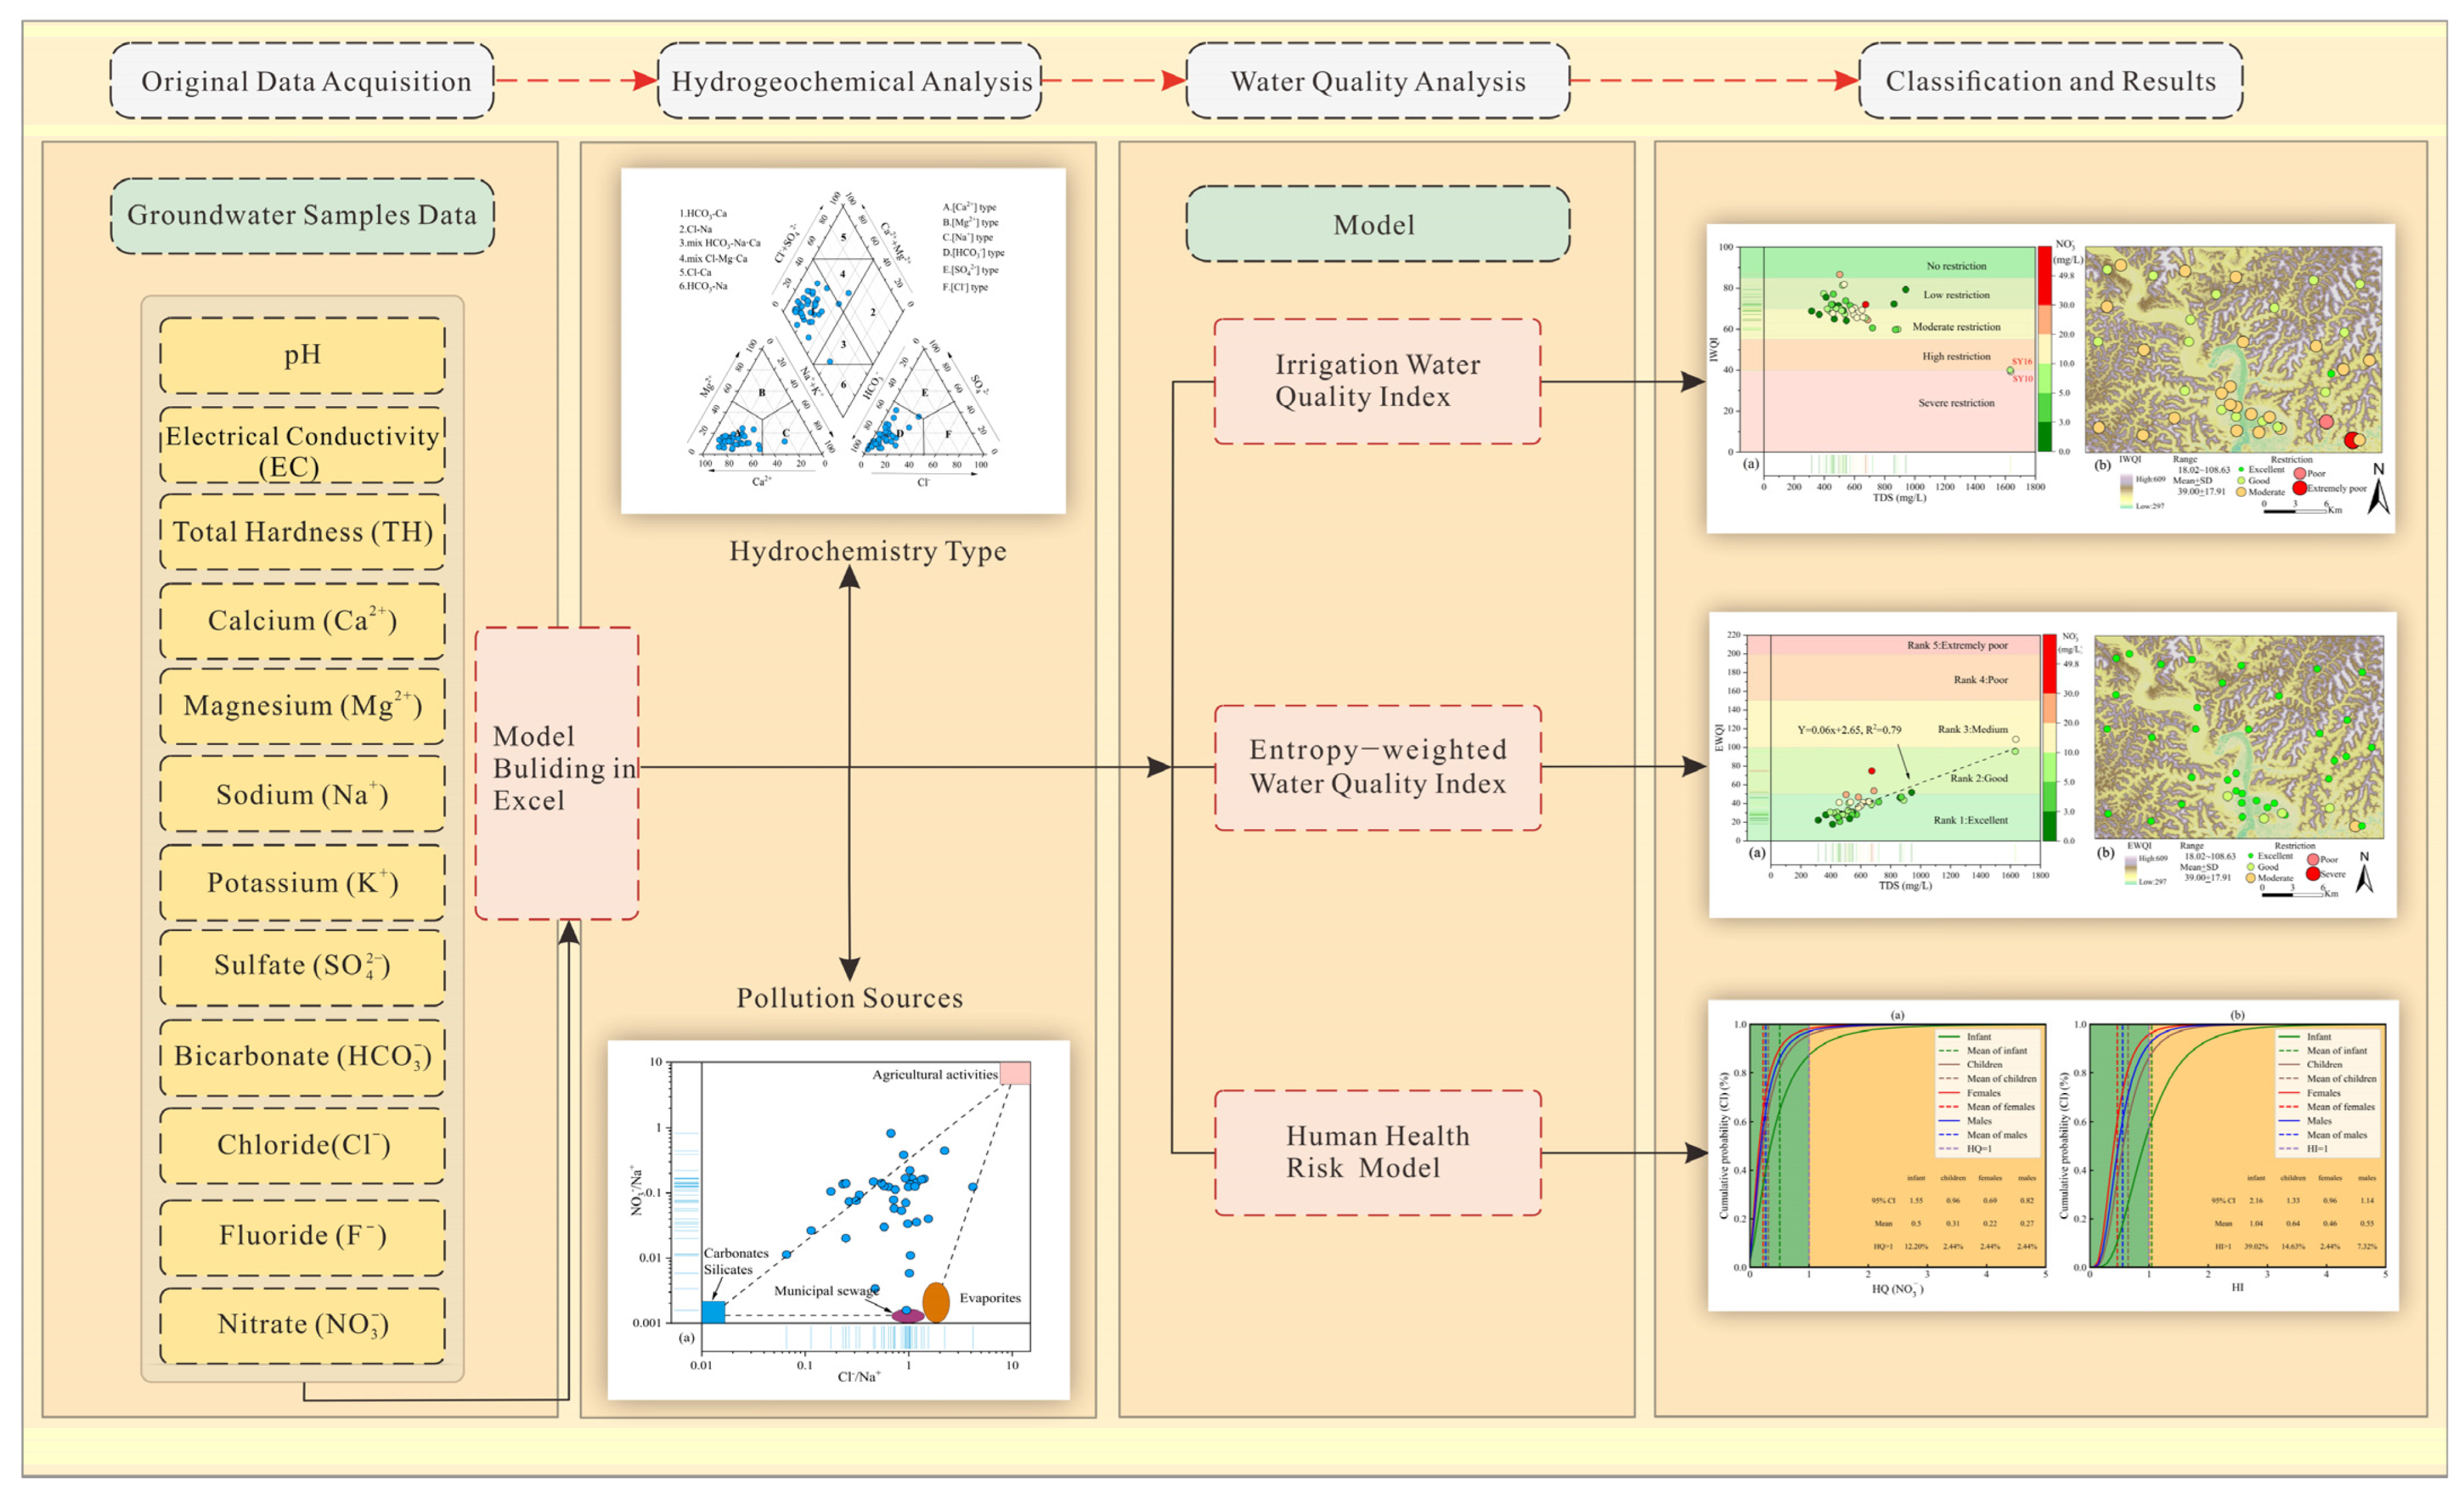
2. Materials and Methods
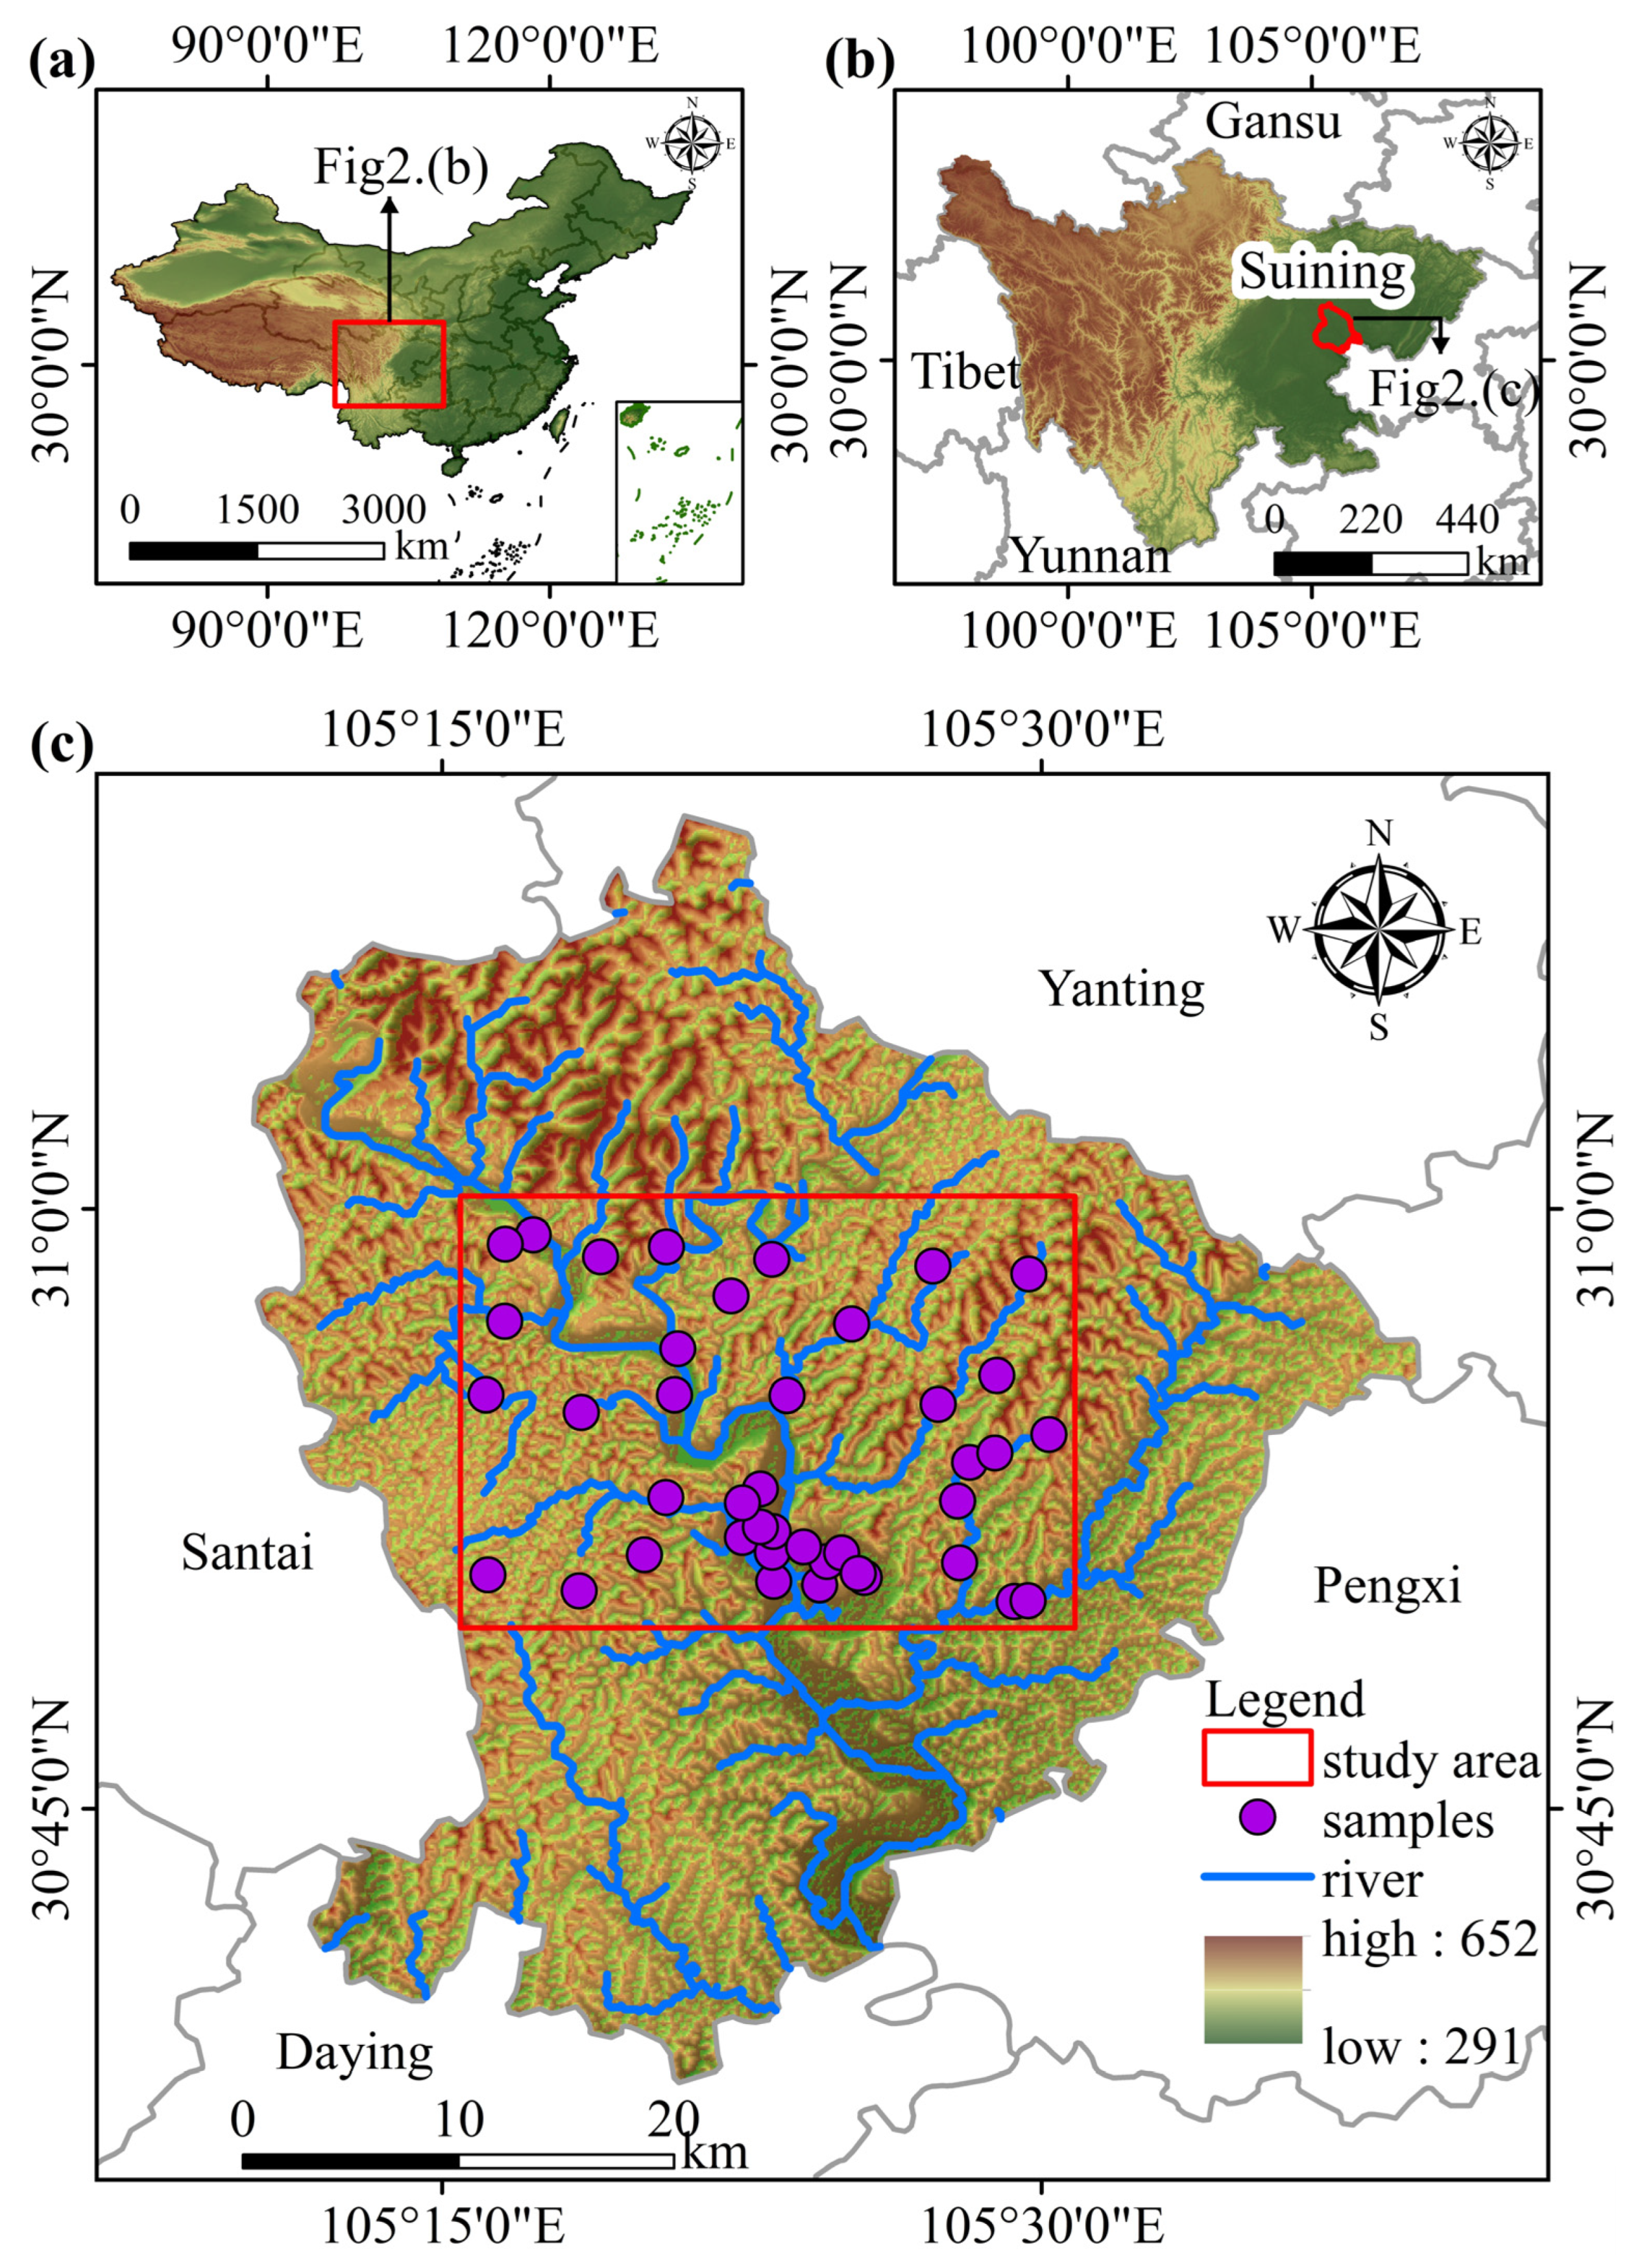
2.1. Study Area

The study area belongs to Suining city and is located in the central region of the Sichuan Basin, within the longitude of 105°10′–105°39′ E and the latitude of 30°40′–31°10′ N (Figure 2a,b). It is located in the transitional zone between the low mountains in the north and the hilly terrain in the south of Sichuan and is characterized by a typical low mountain and hilly terrain. The study area has higher elevations in the north and lower elevations in the south, with elevations of 291 to 652 m. The mountainous and hilly area within the county covers over 85% of the total land area, making it a major agricultural area [35]. The study area has a subtropical monsoon climate with an annual average temperature of 17.2 °C. The maximum temperature is 37.2 °C and the minimum temperature is −2.4 °C. The annual average precipitation is 887.3 mm, with a minimum of 660.7 mm and a maximum of 1389.2 mm. Abundant rainfall has resulted in the development of well-connected rivers and streams due to the low mountain and hilly terrain. This has led to a high overall river network density. The study area is primarily composed of sandstones and mudstones from the Jurassic and Cretaceous periods, with some areas of Quaternary sediments [36]. These sandstones and mudstones are mostly interbedded and include calcareous and feldspathic sandstones. Precipitation infiltration is the primary mode of groundwater recharge in the area, which is facilitated by the abundant precipitation.
The study area has a variety of soil types, such as purple soil, alluvial soil, yellow soil, and paddy soil. Among these, purple soil covers the largest portion of the mountainous hilly area, accounting for approximately 86.3% of the total land area [37]. This type of soil is mainly composed of purple clay and purple sandy soils with gravels, sands, and clays. However, it has poor water-holding capacity and weathering resistance. Although purple soils exhibit higher pH values and have a greater fertility status, their fertility primarily results from the extensive use of chemical fertilizers in the past. Nitrogen, potassium, and phosphorus fertilizers have been utilized to stabilize the soil’s nutrient content, while organic fertilizers and boron and zinc fertilizers can enhance soil fertility. Unfortunately, the excessive use of agricultural fertilizers and the illegal disposal of sludge in the name of “soil improvement” in the study area have seriously polluted the surrounding environment and led to serious groundwater contamination [34,38]. In addition to agriculture, the study area has experienced significant industrial growth in recent years. The factories are primarily located in the southern part of the study area, where the population is concentrated, as well as in the new industrial area in the southeast.

2.2. Methodology

2.2.1. Sampling and Analysis Methods

The study collected 41 groundwater samples from domestic tube wells and public water supply wells located in the central Sichuan Basin. The sampling points were illustrated in Figure 2c. The sampling depths were varied from 50 m to 100 m. To mitigate the potential impact of stagnant water in the pipeline during sampling, this study employed a technique of pumping more than three times the volume of the wells in each borehole. Prior to collecting the samples, the sampling bottles were thoroughly rinsed with the target water samples at least 3–5 times. The study measured geophysical–chemical parameters, such as pH, TDS, TH, and the concentration of major anions and cations. Sampling involved measuring physical and chemical properties in situ using a portable multimeter device (WTW multi 3400i), including pH, TDS, TH, and temperature. Groundwater samples were collected and sent to the Sichuan Geological Survey Institute for hydrochemical analysis. Anion content was determined using ion chromatography, while cation content was measured using atomic absorption spectrophotometry. To confirm the reliability of the chemical analysis of each sample, groundwater ion balance tests were performed using Equation (1) after excluding other ions below the test line. The calculated results were accurate as the water sample error was within the acceptable range of ±5% [39].
CBE = M g 2 + + C a 2 + + N a + + K + HC O 3 + S O 4 2 + N O 3 + C l + F M g 2 + + C a 2 + + N a + + K + + HC O 3 + S O 4 2 + N O 3 + C l + F

2.2.2. Principal Component Analysis (PCA)

Principal component analysis (PCA) is a multivariate statistical method that effectively identifies the factors controlling the hydrogeochemical compositions [40,41,42]. PCA on hydrogeochemical parameters can simplify intricate analytical metrics, reducing the dimensionality of the analysis and allowing for the preliminary identification of contaminant sources in groundwater [43,44]. To ensure comparability between the different indicators, z-score normalization was performed prior to conducting PCA. To determine the suitability of the dataset for PCA, KMO (Kaiser–Meyer–Olkin), and Bartlett tests were conducted. KMO measures the bias correlation between variables and indicators, and a value greater than 0.5 indicates that the data are suitable for factor analysis processing. Bartlett’s sphericity test measures the degree of correlation between each indicator variable, and a significance level ρ less than 0.05 indicates relevance between each variable indicator [45]. Only principal components with eigenvalues greater than 1 were included in the analysis. The PCA calculation was carried out using SPSS25.0 software.

2.2.3. Nitrate Pollution Index (NPI)

Nitrate pollution is a major contributor to groundwater contamination on a global scale. To quantify the extent of nitrate contamination in groundwater, a straightforward nitrate pollution index (NPI) is utilized. The value of NPI is calculated using Equation (2) [46]:
NPI = C m C s C s
The equation for determining NPI involves measuring the nitrate concentration (Cm) of water samples and comparing it to the threshold value (Cs) induced by human activities, which is recommended to be 10 mg/L [47]. The resulting NPI can then be classified into one of five levels [48], each with its corresponding grading as listed in Table 1.

2.2.4. Evaluation of Irrigation Water Quality Based on Hydrogeochemical Indexes

To ensure a comprehensive evaluation of irrigation water quality, it is crucial to utilize multiple indicators. This study specifically selected four indicators, including SAR, Na%, RSC, and PI, to fully interpret and evaluate the chemical properties of the water.
The SAR is an important measure of the concentration of Na+ in groundwater. A higher SAR value indicates a greater adsorption effect on Na+, which can alter the structure of soil agglomerates and reduce infiltration performance, ultimately leading to decreased drainage performance. These problems arise due to the replacement of exchangeable Ca2+ and Mg2+ ions in soil with Na+ ions, which leads to the dispersion of soil particles and the breakdown of soil structure. High SAR conditions lead to dry, compact, and hard soil, which in turn reduces air and water infiltration rates. This problem is influenced by various factors, such as soil type and salinity ratio. Therefore, it is essential to calculate SAR values before using water for agricultural irrigation. Wilcox proposed a calculation formula for SAR values, as shown in Equation (3) [22,46].
SAR = N a + C a 2 + + M g 2 + / 2
The %Na is a crucial factor in evaluating the appropriateness of irrigation water. If water contains high levels of sodium, it can react with carbonates and cause soil alkalinity to rise. Additionally, excessive amounts of sodium chloride can lead to soil salinization, which decreases soil permeability and hinders water flow through the soil, ultimately affecting crop growth. The formula for calculating the sodium percentage is presented in Equation (4) [19,49].
% N a + = N a + C a 2 + + M g 2 + + N a + + K + × 100 %
The suitability of irrigation water quality is evaluated based on the RSC parameter, which indicates the relationship between weak acids and alkaline earth minerals present in groundwater. RSC values can be calculated using Equation (5) [50]. High RSC values in irrigation water can negatively impact crop yields and cause severe alkali damage if used for prolonged periods. Therefore, it is important to consider RSC values when selecting water for agricultural irrigation.
RSC = HC O 3 + C O 3 2 C a 2 + + M g 2 +
The soil structure is significantly influenced by the PI parameter, which can also be utilized to evaluate if groundwater is appropriate for irrigation. The PI is determined by the correlation between cations and bases present in water. When specific ions, such as calcium, magnesium, sodium, and bicarbonate ions, are excessively present, they can harm the soil structure and decrease its permeability. This reduction in soil permeability can negatively affect the absorption of nutrients and crop growth. The PI can be calculated using Equation (6).
PI = N a + + HC O 3 C a 2 + + M g 2 + + N a + × 100 %
The ion units involved in the above formula are all meq/L.

2.2.5. Irrigation Water Quality Assessment Based on the IWQI

In order to determine the most influential factors affecting irrigation water quality, a PCA was conducted. The results of this analysis were used to select key parameters for calculating the IWQI using Equation (7) [22,51].
IWQI = i = 1 n q i w i
To calculate the IWQI, Equation (7) uses the variable n, which represents the number of parameters affecting the WIQI, as determined through PCA. The value of the ith parameter is indicated by qi, as calculated using Equation (8), while the weight of the ith parameter in the IWQI calculation is represented by wi, also calculated using Equation (9). Table 2 provides the recommended water quality parameters by the UCCC, along with the evaluation criteria established by Ayers and Westcot [52] for each parameter.
q i = q i max x i j x i n f × q i a m p x a m p
In Equation (8), (qi)max represents the highest value of qi within the grading range assigned to the ith parameter. The variable xij is the measured value of the jth sample for the ith parameter, and xinf represents the lower limit of the grading range assigned to the ith parameter. The term (qi)amp refers to the range of qi for the ith parameter, which is calculated as the difference between the highest and lowest values of qi within the grading range for that parameter. xamp is a term used to refer to the grading range for the ith parameter in xamp. It is calculated as the difference between the upper and lower limits of that grading range. However, if xij exceeds the maximum graded upper limit, xamp is computed as the difference between xij and the maximum graded upper limit.
w i = j = 1 k ( F j × | A i j | ) / j = 1 k m = 1 n ( F j × | A m j | )
In Equation (9), Fj represents the eigenvalue of the jth principal component, while Aij represents the eigenvector of the jth principal component corresponding to the ith parameter. The total number of principal components selected by PCA is denoted by k, and n represents the number of parameters used to calculate IWQI.

2.2.6. Entropy-Weighted Water Quality Index (EWQI)

The EWQI is a method of evaluating regional water quality by using the test results of multiple water quality parameters to represent it in a dimensionless value. The calculation of EWQI involves using entropy weight calculation to minimize the impact of subjective factors and improve the objective accuracy of the index. The following steps outline the calculation of EWQI [23,24]:
The first step in calculating the EWQI is to create an initial matrix that represents the water quality values. This is done by consolidating and displaying the data that has been sampled and monitored in the form of a matrix, as shown in Equation (10). The number of samples is denoted by m and the number of parameters by n, resulting in an initial matrix of water quality values denoted by X. Within the water quality matrix X, the measurement value of the jth evaluation index for the ith water sample is represented by Xij.
X = x 11 x 12 x 1 n x 21 x 22 x 2 n x m 1 x m 2 x mn
The second step involves the standardization of water quality data to account for differences in the scale and dimensions of the values for each evaluation index. This step helps to reduce the impact of human subjective factors. The standardization process is carried out using Equations (11) and (12), where (xij)max and (xij)min represent the maximum and minimum values of the evaluation variables in column j of the initial water quality numerical matrix, respectively. The resulting matrix, Y, is the standardized water quality numerical matrix.
y i j = x i j ( x i j ) m i n ( x i j ) m a x ( x i j ) m i n
Y = y 11 y 12 y 1 n y 21 y 22 y 2 n y m 1 y m 2 y m n
The third step is to determine the weight of each evaluation factor. To reduce the impact of subjective factors and improve the objectivity of the results, the entropy weighting method is employed to determine the weights of each evaluation factor. The entropy weight of the jth evaluation factor, denoted by wj, is calculated using Equations (13)–(15). Here, m represents the number of samples to be evaluated for water quality, and n represents the number of evaluation factors. Pij is the ratio of yij in the standardized water quality value matrix to the sum of the index values in the column while ej represents the information entropy of the jth evaluation factor. Finally, wj is the weight of the jth evaluation factor in the study.
p i j = y i j i = 1 m y i j
e j = 1 ln m i = 1 m P i j ln P i j
w j = 1 e j j = 1 n ( 1 e j )
The fourth step is to calculate the water quality ratio according to the evaluation criteria of each evaluation factor, as shown in Equations (16) and (17). Among them, Cij indicates the measured concentration value of the ith parameter in the data corresponding to the j evaluation factor, and Sj corresponds to the groundwater quality evaluation standard of the j evaluation factor.
q i j = C i j S j × 100
q pH = C pH 7 8.5 7 × 100 C pH > 7 7 C pH 7 6.5 × 100 C pH < 7
The fifth step is to calculate and classify the water quality index. After obtaining the weight wj of the jth indicator in the study and the water quality proportion qij, the water quality index (WQI) can be calculated, as shown in Equation (18). According to the calculated EWQI, groundwater can be classified into five groundwater categories (Table 1) [23,24,53].
EWQI = j = 1 n w j q i j

2.2.7. Human Health Risk Assessment

The methodology utilized for analyzing health risks is based on the health risk assessment model proposed by USEPA [54], which has been widely accepted and utilized by the academic community. The two primary pathways of human exposure to groundwater pollutants are through skin contact and oral ingestion. Previous studies have indicated that the main human health hazards arise from the oral ingestion of groundwater pollutants, rather than from dermal contact [55,56,57]. The study categorized the population into four groups based on age and gender: infants aged 0–6 months, children aged 7 months to 18 years, adult males over 18 years, and adult females over 18 years. The assessment methods and calculations used are presented in Equations (19)–(22). The study defined hazard index (HI) and hazard quotient (HQi) as measures of the potential non-carcinogenic risk posed by various groundwater contaminants and pollutants. The CDI refers to the daily exposure dose (mg·kg−1·d−1) when taken orally, while RfD pertains to the reference dose (mg·kg−1·d−1) of the corresponding contaminant when taken orally. Ci stands for the measured concentration of contaminant i in groundwater, IR represents the average daily drinking volume (L·d−1), EF and ED denote the exposure frequency (d·a−1) and annual exposure duration (a), respectively. BW is the average body weight of the inhabitants (kg), and AT is the average time (d).
H Q i = CD I i Rf D i
HI = H Q 1 + H Q 2 + + H Q i
CD I i · = C i × IR × EF × ED BW × AT
AT = ED × 365
The hazard index (HI) is used to evaluate and grade the potential risk of groundwater pollution. If the HI is less than 1, the potential risk is considered negligible. If HI falls between 1 and 4, the potential risk is moderate and requires groundwater pollution treatment based on the actual situation. If HI exceeds 4, the potential risk is high, and further groundwater treatment and control are necessary.

3. Results

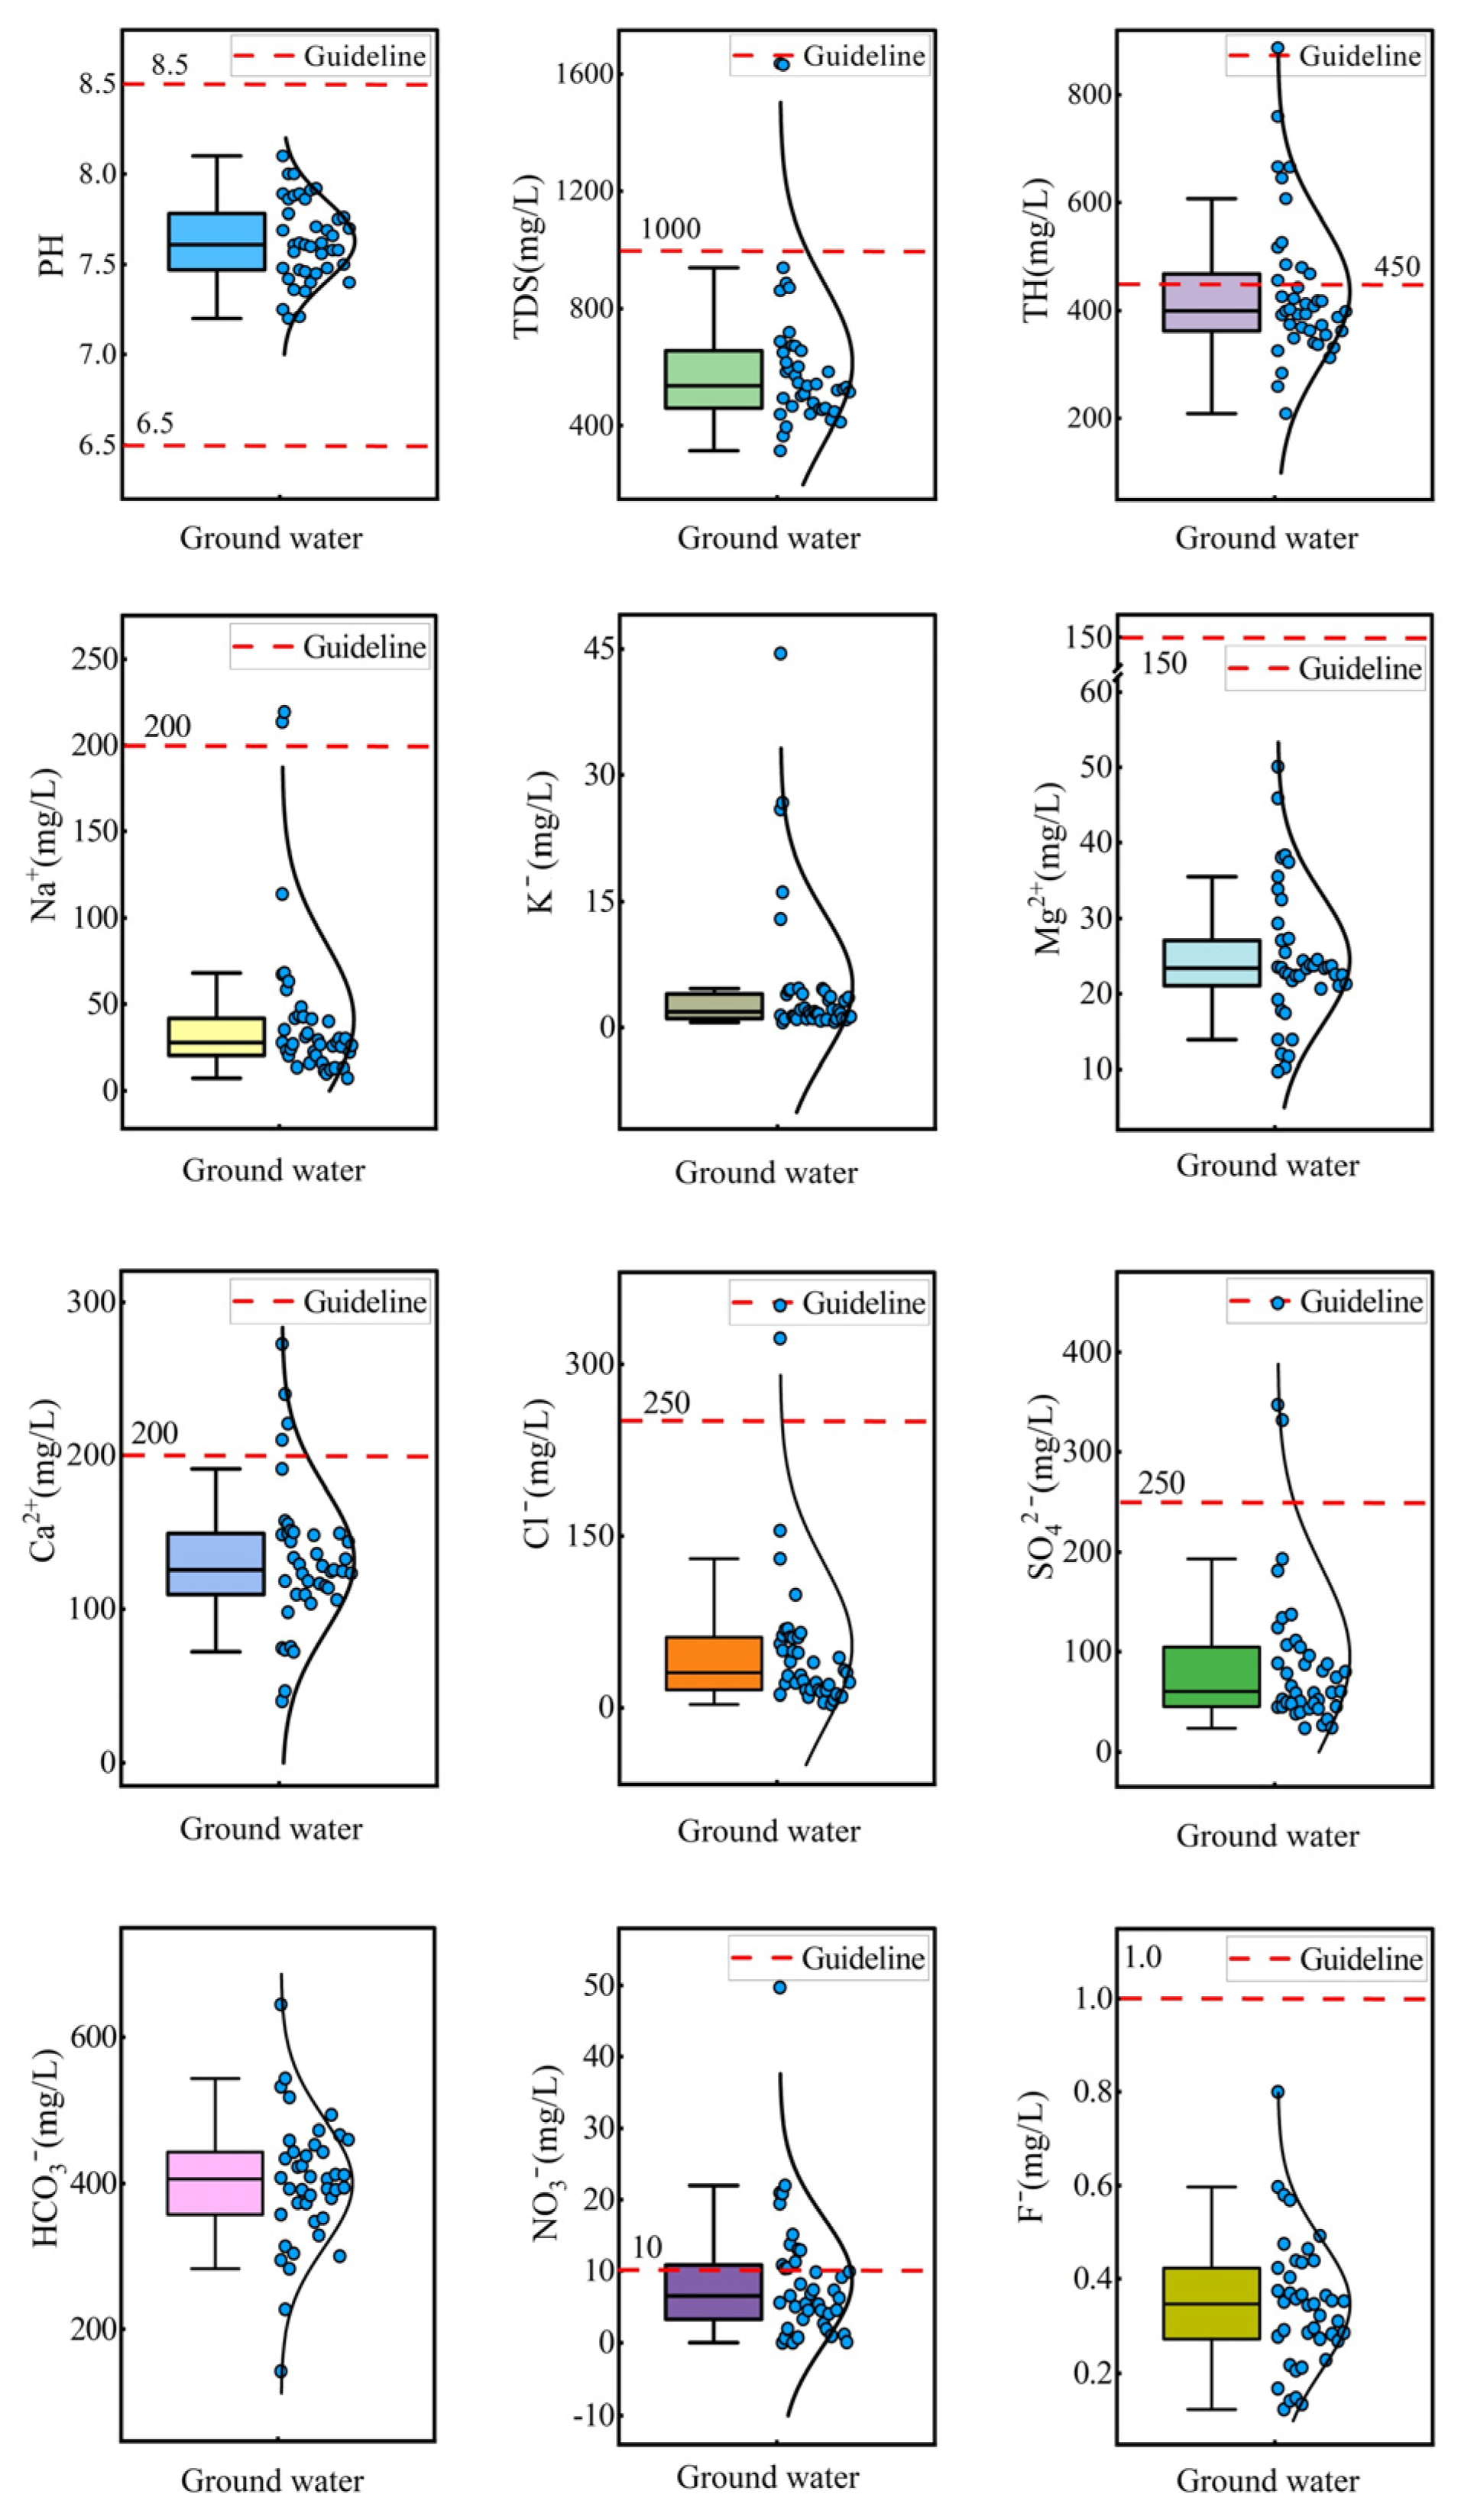
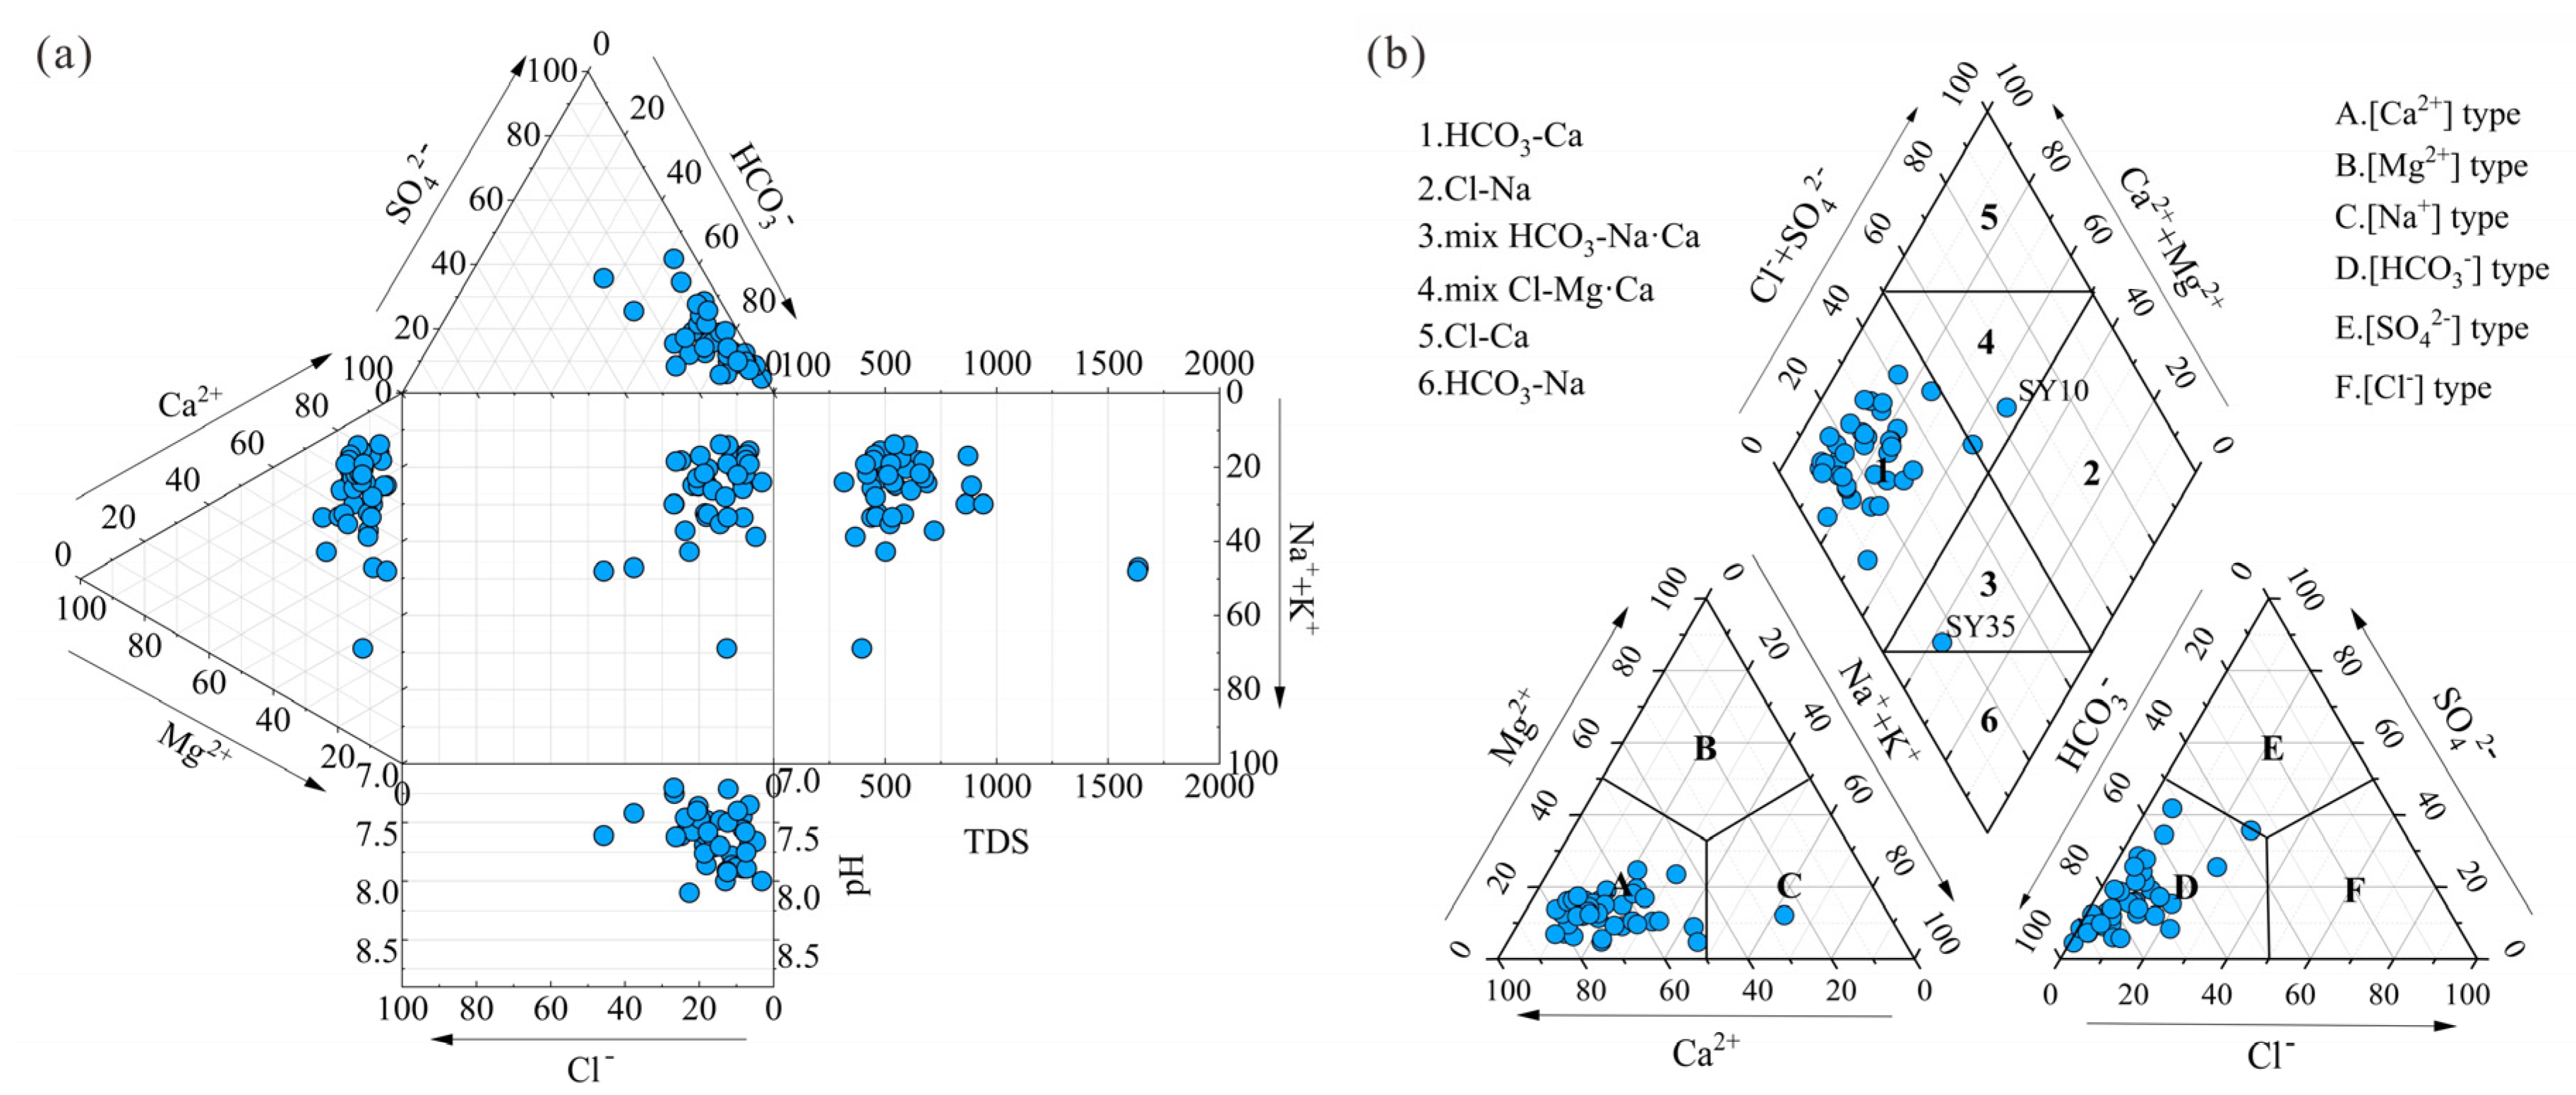
3.1. General Hydrogeochemical Characteristics

This study utilized quantitative analysis of various physical and chemical parameters to gain a better understanding of groundwater formation and its water quality. The hydrochemical data were analyzed using SPSS 25.0. Descriptive statistical analysis was conducted, including mean, minimum, maximum, standard deviation, and coefficient of variation. Table 3 presents the statistical analysis results of the exceedances of each component based on the standards set by the World Health Organization (WHO) [58] and the current situation in China [59] for drinking water purposes. Figure 3 presents a combination of a box plot and a normal distribution curve. This visual representation not only showcases the maximum value, mean, standard deviation, median, upper quartile, and lower quartile included in the box plot but also provides insight into the overall distribution of the data. The pH values of the sampled groundwater ranged from 7.2 to 8.1, while the TDS ranged from 316 to 1636 mg/L. It is worth noting that only two groundwater samples had TDS values higher than the permissible limit for drinking water (1000 mg/L). Based on the pH and TDS values, the study area can be inferred to have weak alkaline groundwater with low to medium mineralization. The groundwater hardness ranged from 208.94 to 887.63 mg/L, with an average of 435.96 mg/L. The study found that approximately 30% of water samples had exceeded the standard for hardness, indicating that the overall water quality is hard. The high total hardness (TH) values observed were attributed to the presence of Ca2+ and Mg2+ ions in the water [43], which are commonly associated with rocks rich in minerals such as calcite and dolomite found in the aquifers of the study area.
The study area exhibited a range of K+ concentration, from 0.62 to 44.47 mg/L, with an average value of 5.54 mg/L. The southwest region had higher K+ levels. This is possibly due to a significant amount of potassium feldspar sandstone. The study area’s soil is mainly purple soil, and the parent rocks of the soil have a relatively high K+ content. The samples had Na+ concentrations ranging from 7.31 to 219.34 mg/L, with an average value of 41.38 mg/L. Similarly, the Cl concentrations ranged from 3.05 to 351.50 mg/L, with an average value of 54.69 mg/L. The distribution of Cl concentration was found to be similar to that of Na+, indicating the presence of salt rock distribution in the study area. The study area exhibited a range of Ca2+ concentration from 40.28 to 272.83 mg/L, with an average of 132.08 mg/L. The Mg2+ concentration ranged from 9.75 to 50.10 mg/L, with an average of 24.59 mg/L. Additionally, the HCO3 concentration ranged from 144.29 to 644.86 mg/L, with an average of 400.68 mg/L. The Ca2+, Mg2+, and HCO3 concentrations are a result of carbonate mineral dissolution. The study found that the concentration of SO42− in the sampled water ranged from 28.83 to 449.40 mg/L, with an average of 83.52 mg/L. It was observed that the samples with high concentrations of SO42− also had high concentrations of Ca2+. This suggests a possible relationship between the dissolution of gypsum layers in the geological formations of the study area and the high levels of SO42− and Ca2+ found in the water samples. The concentration of NO3 in the water samples ranged from 0.02 to 49.70 mg/L, with 31.71% of the samples exceeding the allowable drinking limit of 10 mg/L. On the other hand, the concentration of F ranged from 0.12 to 0.80 mg/L, which is well below the recommended limit of 1 mg/L.
Based on the results presented in Table 3, it is evident that the major cations and anions exhibit a coefficient of variation greater than 10%, indicating significant spatial variability and heterogeneity in their distribution. Among the major cations and anions, K+, Cl, and Na+ show the most significant variation. On average, the cation content is highest for Ca2+, followed by Na+, Mg2+, and K+. Similarly, the anion content is highest for HCO3, followed by SO42−, Cl, NO3, and F. The water chemistry type of the sampled groundwater can be determined by using Piper’s trilinear diagram [24,30,60], which also reflects the relative content of major ions and general water chemistry characteristics in groundwater. The study found that the groundwater sampled was primarily of the HCO3 Ca type, as indicated in Figure 4. This is in line with the observation that Ca2+ and HCO3 are the dominant cations and anions in the region. However, some high salinity groundwater types, such as mix HCO3-Na·Ca and mix Cl-Mg·Ca, may be attributed to water–rock interactions in the study area. Based on the analysis of Table 3, it can be concluded that apart from TH and NO3, all other water chemistry parameters of the samples are within the permissible limits for drinking water. This suggests that the groundwater in the study area is a viable source of high-quality drinking water.

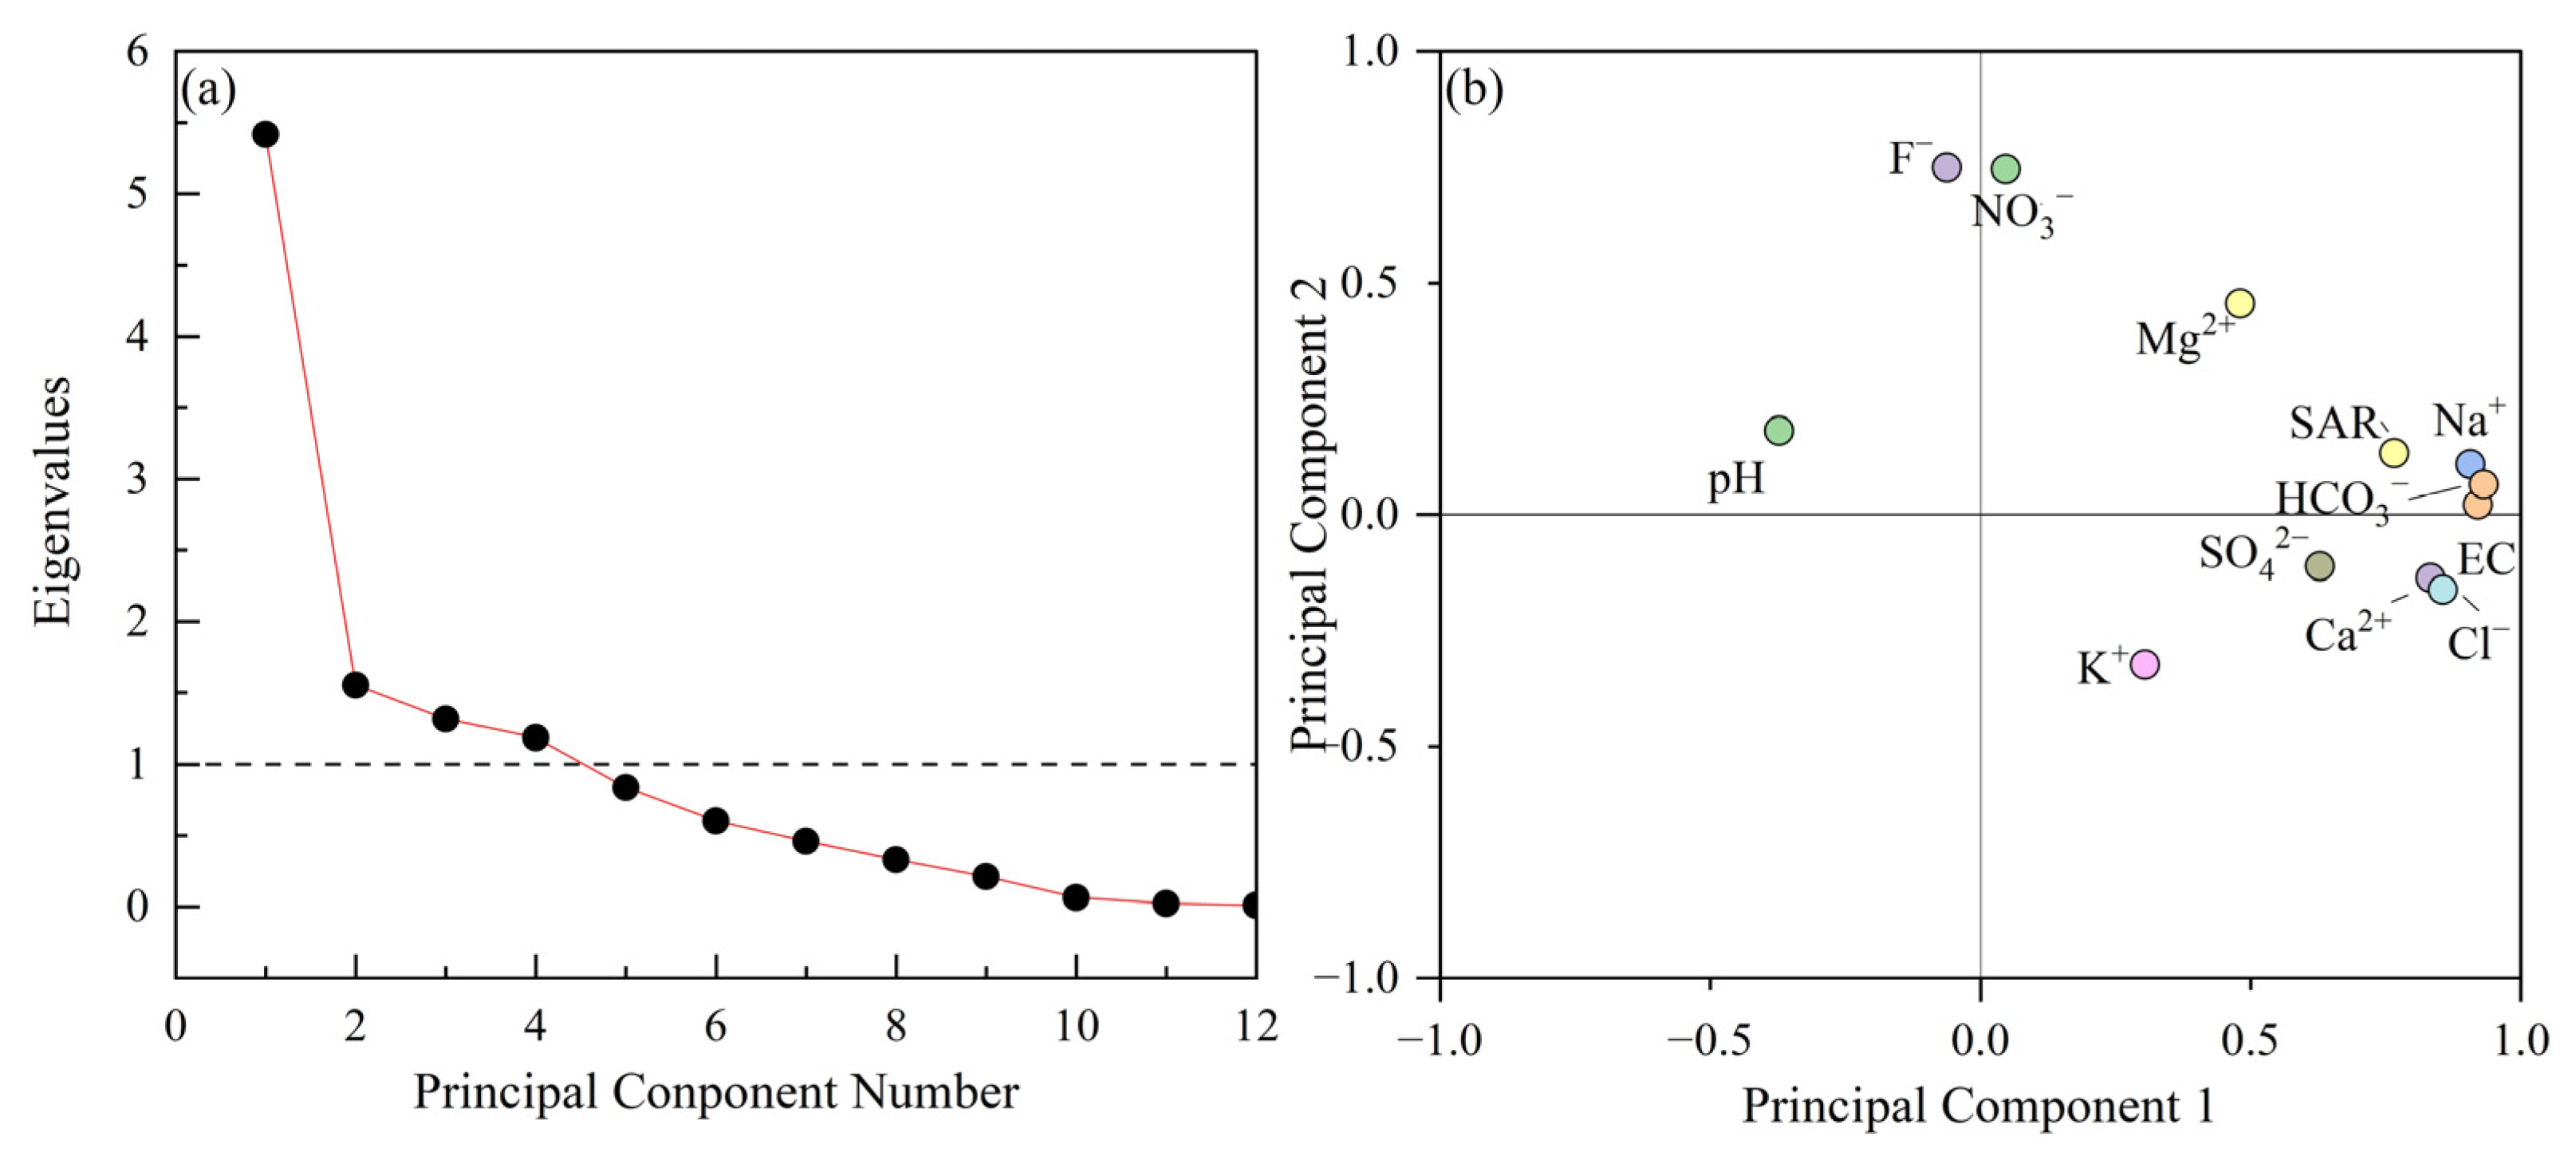
3.2. Principal Component Analysis (PCA)

This study utilized the PCA method to identify the main factors that influence the hydrochemical composition of groundwater in the study area. The data types included major ions such as K+, Na+, Ca2+, Mg2+, Cl, SO42−, HCO3, NO3, F, as well as pH, EC, and SAR. Prior to importing the hydrochemical parameters into SPSS 25 software for PCA, Z-score standardization was performed. PCA was utilized to reduce the dimensionality of the twelve parameters and expose their relationships. The KOM (KMO = 0.586 > 0.5) and Bartlett tests (ρ = 0.000 < 0.05) in this study showed that the above data were suitable for analysis using PCA. The findings of PCA are presented in both Table 4 and Figure 5.
Table 4 showcases the contribution of various parameters to the four principal components. The selected principal components, which had eigenvalues greater than 1, accounted for 78.91% of the total variance. PC1 had the highest percentage of variance, at 45.14%, and showed a strong load of EC, Ca2+, Na+, Cl, SO42−, and SAR. This suggests that natural mineral dissolution and precipitation processes have a dominant effect on these parameters. PC2 contributed to 12.95% of the total variance and exhibited strong loads of F and NO3. The absence of fluoride-containing minerals, such as fluorite, in the study area suggests that the F is likely a result of human activities. The presence of excessive NO3 in the study area may be attributed to human activities such as the construction of industrial parks and a prolonged history of agriculture. In order to identify the key parameters for the IWQI analysis, parameters with loadings greater than 0.35, such as EC, Na+, Cl, HCO3, and SAR, were selected as potential candidates [61,62].

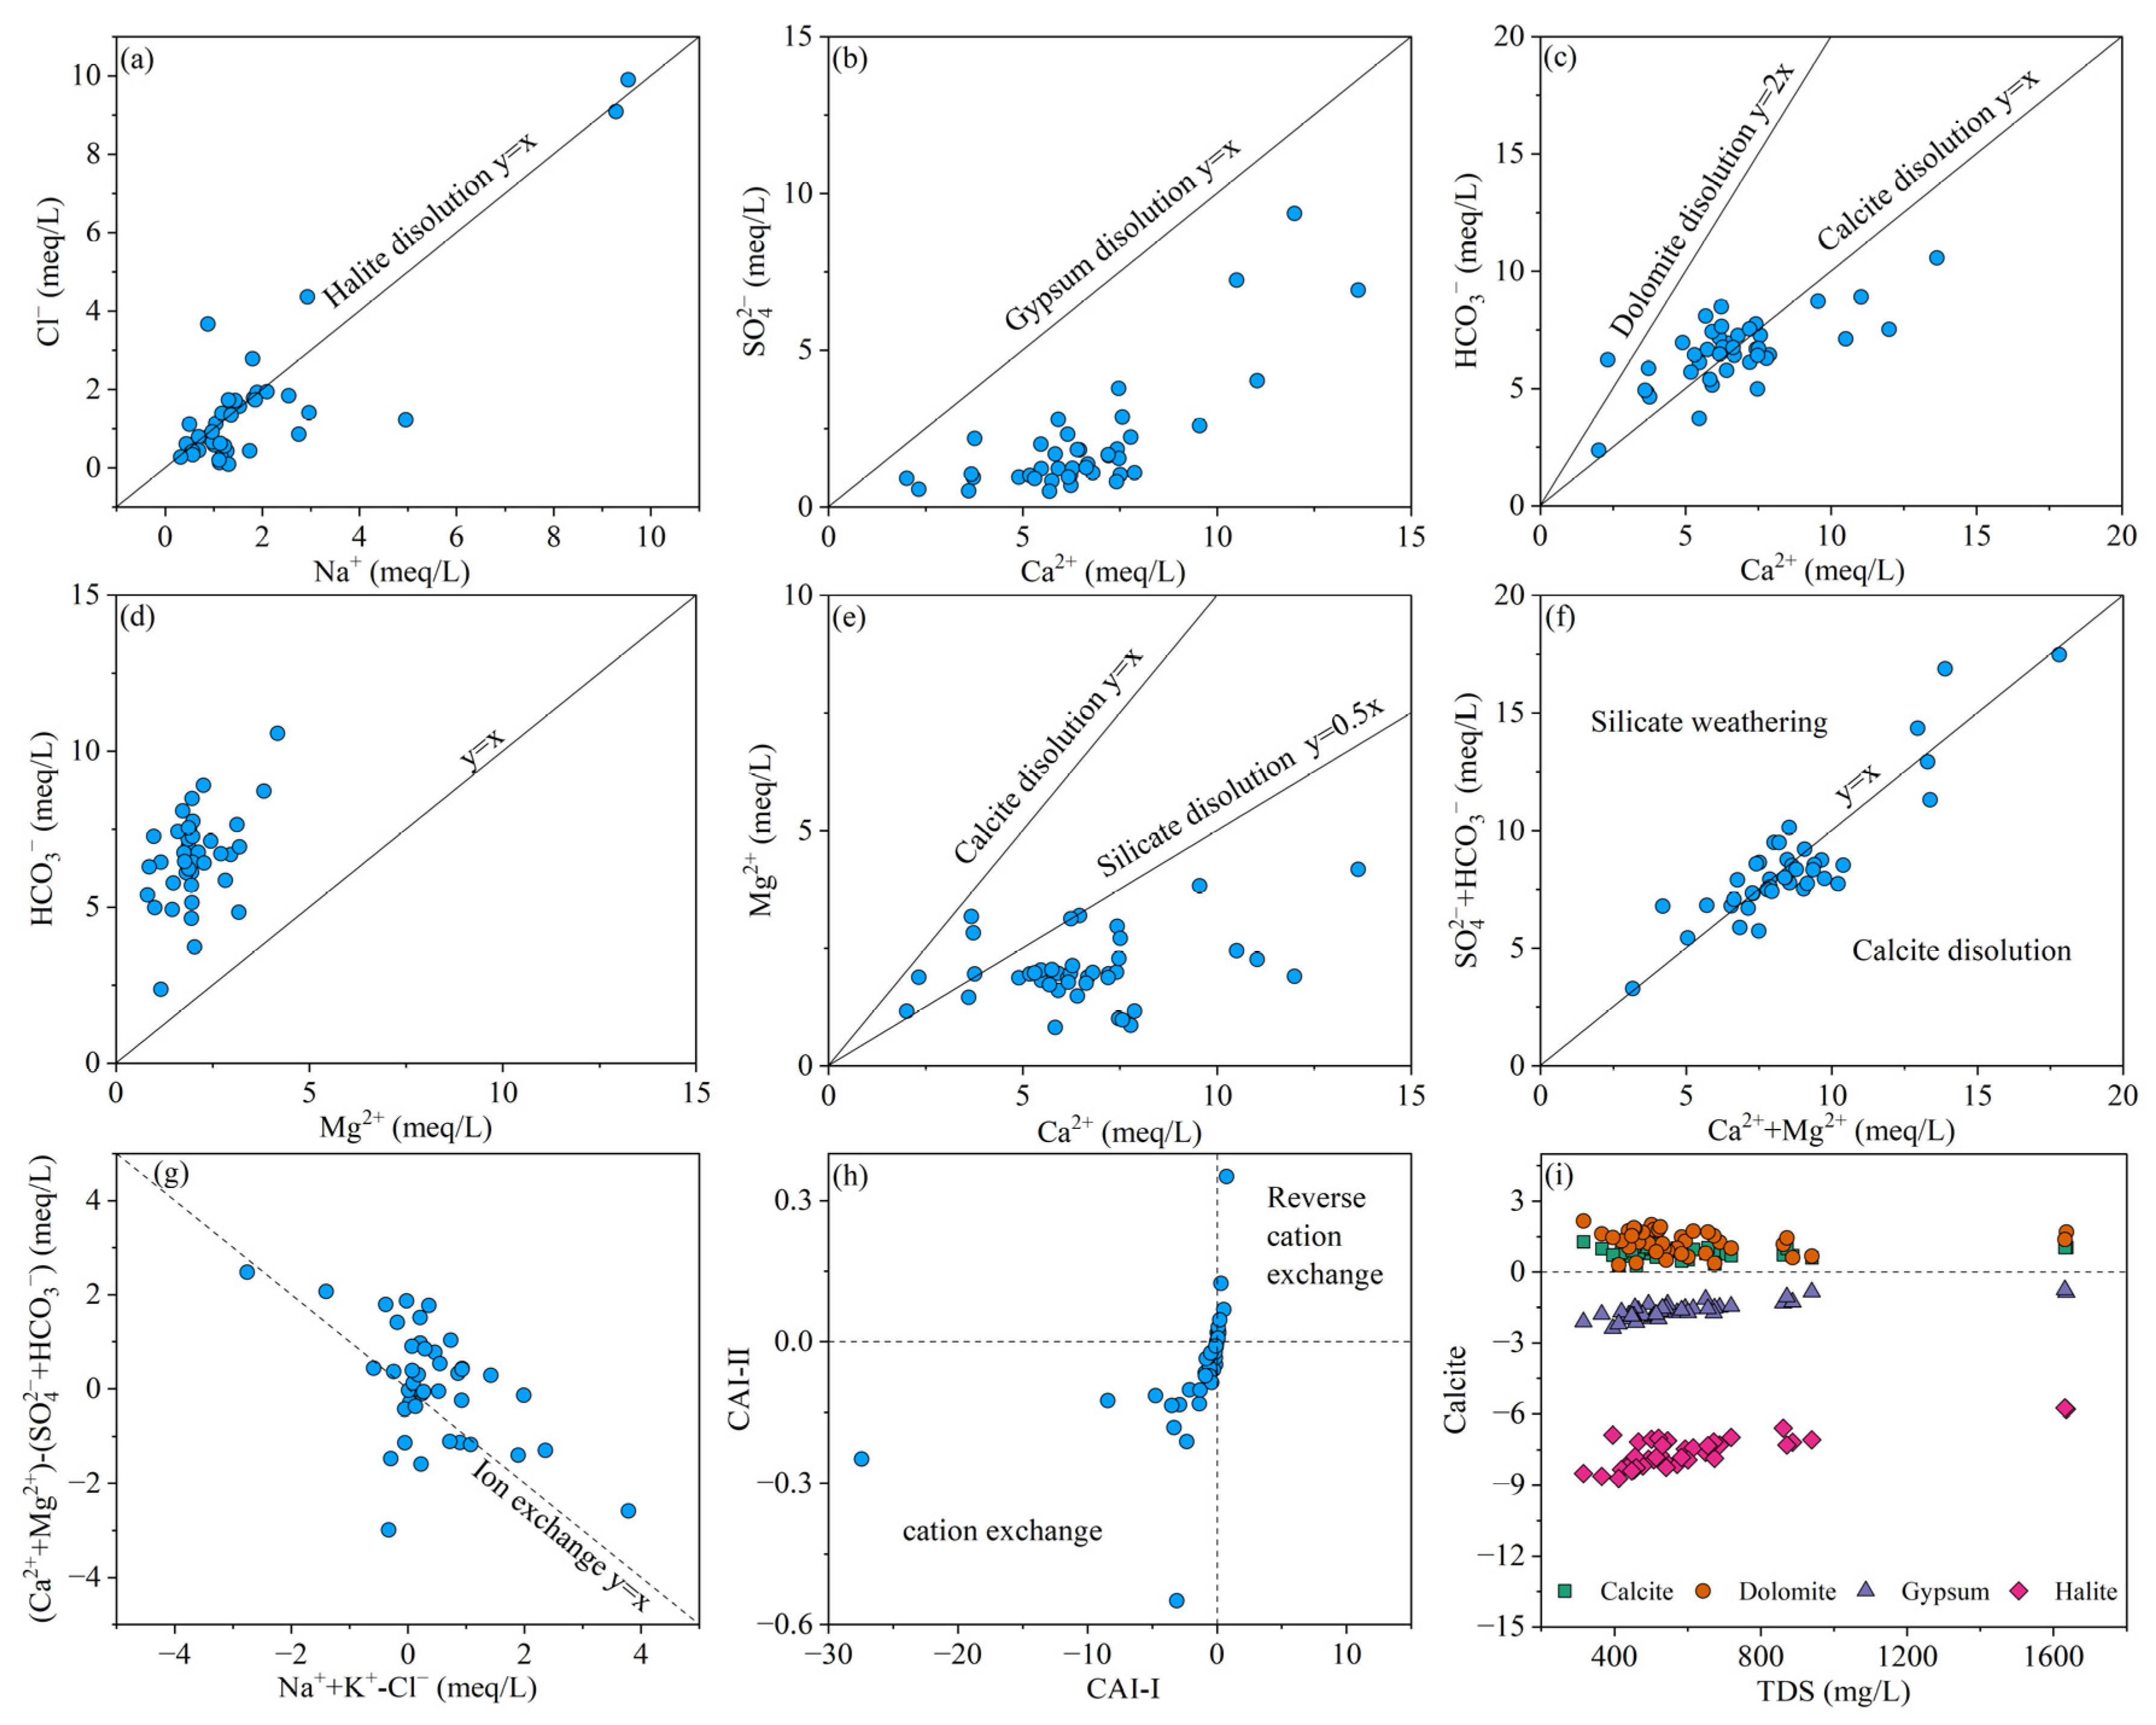
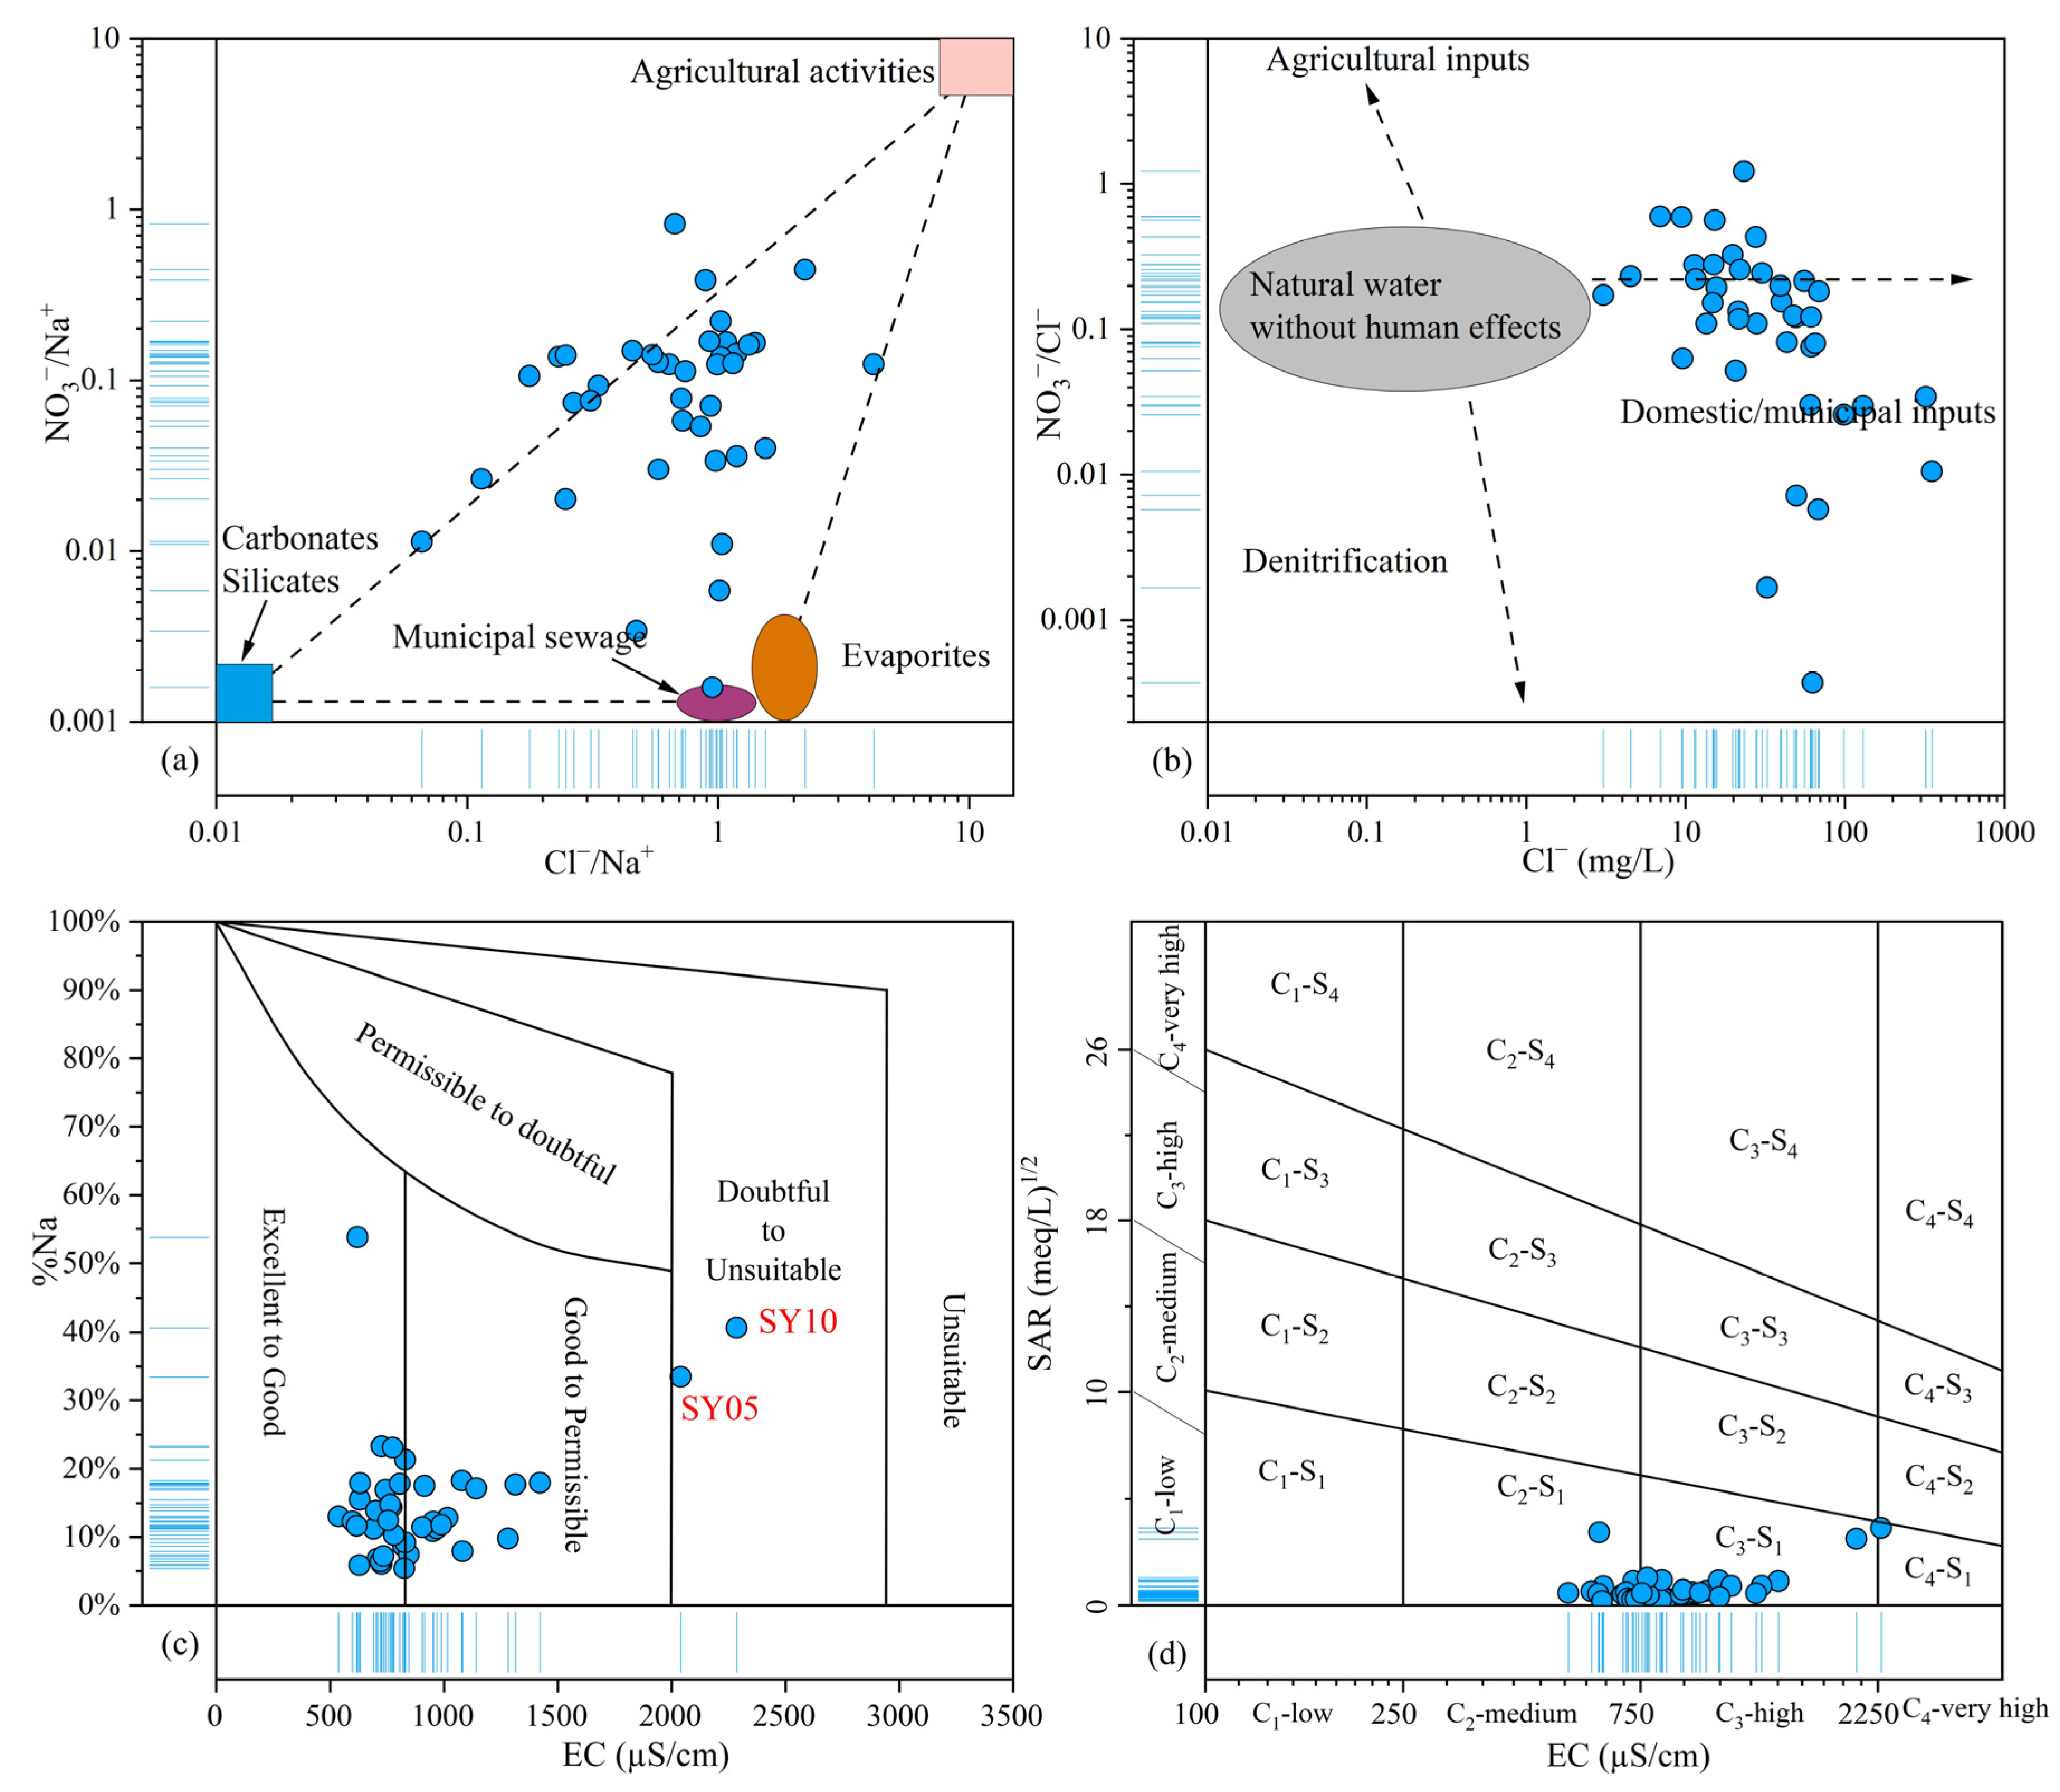
3.3. Ion Source Analysis

The Gibbs diagram is a useful tool for understanding the correlation between aquifer lithology and water composition [63]. It is divided into three distinct fields, namely evaporation-dominated, water–rock interaction-dominated, and precipitation-dominated. Figure 6 illustrates the Gibbs diagram of water samples from the study area. Upon plotting the Gibbs diagram points in Microsoft Excel, it is apparent that the total dissolved solids (TDSs) of the water samples fall mostly between the range of 100 and 1000 mg/L. Additionally, the ratios of Na+/(Na+ + Ca2+) and Cl/(Cl + HCO3) are observed to be predominantly within the range of 0–0.4. The Gibbs diagram suggests that water–rock interaction is the primary factor contributing to the formation of groundwater chemistry in the study area. The increasing trend of the cation weight ratio Na+/(Na+ + Ca2+) in Figure 6b indicates that cation exchange also plays a role in the hydrogeochemical composition.
Prior research has demonstrated that examining the proportion of major ions present in groundwater can be a valuable technique for detecting potential water–rock interactions within groundwater systems [24,30]. In relation to Figure 7a, if the concentrations of Na+ and Cl are obtained from salt dissolution, the molar ratio of Na+/Cl will be equivalent to 1, as indicated in chemical Equation (23). This study found that groundwater samples in the study area are distributed evenly around the y = x line, with the presence of salt rock in the aquifer, indicating that the Na+ and Cl concentrations are primarily derived from salt dissolution. The results also showed that some samples had higher Na+ concentrations, which could be attributed to cation exchange during groundwater runoff processes. This occurs when groundwater interacts with feldspar minerals in sandstone, leading to the dissolution of Na+ in minerals and its accumulation in groundwater. During runoff processes, Ca2+ in groundwater can undergo positive cation exchange with Na+ in surrounding soil, resulting in the distribution of groundwater samples on both sides of the y = x line.
In Figure 7b, it can be observed that gypsum dissolution releases equimolar amounts of Ca2+ and SO42− in groundwater, as shown in chemical Equation (24). The study area has gypsum thin layers in the aquifer. However, the ratio of SO42−/Ca2+ in the water samples is mostly less than 1, which suggests that the presence of Ca2+ in the water is not solely due to gypsum dissolution. It could also be a result of the dissolution of other carbonate minerals, such as calcite and dolomite. To determine the source of Ca2+ in the study area, Figure 7c,d were plotted. The Ca2+/HCO3 ratios for the dissolution of dolomite and calcite are 1:1 and 1:2, respectively. The findings from Figure 7c reveal that most of the samples in the study area are positioned between the y = x and y = 2x lines, indicating the presence of both dolomite and calcite dissolution. However, several samples fall below the y = x contour, implying the existence of other Ca2+ sources besides these two. This further supports the earlier mentioned source of gypsum dissolution. The results presented in Figure 7d indicate that all sample points are situated above the 1:1 HCO3 to Mg2+ ratio line, which confirms the occurrence of both calcite and dolomite dissolution. Additionally, the excess HCO3 is compensated for by other cations. Equations (25) and (26) represent the chemical equations for the dissolution of calcite and dolomite, respectively. The Ca2+/Mg2+ ratio depicted in Figure 7e is frequently utilized to distinguish between the dissolution of carbonate minerals and silicate minerals as sources of ions in groundwater. A Ca2+/Mg2+ ratio greater than 2 indicates silicate mineral dissolution, while a ratio between 1 and 2 suggests calcite dissolution. Dolomite dissolution results in a Ca2+/Mg2+ ratio of 1. The hydrochemical composition of groundwater in the study area is influenced by both carbonate and silicate mineral dissolution, as indicated by Ca2+/Mg2+ values greater than 1 in most groundwater samples, as shown in Figure 7e. The ratio shown in Figure 7f provides an explanation for the source of Ca2+ and Mg2+. As observed in the (Ca2+ + Mg2+) and (HCO3 + SO42−) binary diagram, the groundwater samples in Figure 7f are near the y = x line. This indicates that the primary source of ions in groundwater is due to the dissolution of calcite and silicate minerals.
NaCl N a + + C l
CaS O 4 2 H 2 O   C a 2 + + S O 4 2 + 2 H 2 O
CaC O 3 ( Calcite ) + H 2 C O 3 C a 2 + + 2 HC O 3
CaMg C O 3 2 ( Dolomite ) + 2 H 2 C O 3 C a 2 + + M g 2 + + 4 HC O 3
The occurrence of ion exchange reactions between groundwater and aquifers is commonly assessed by examining the relationship between the concentrations of Na+, K+, and Cl versus Ca2+, Mg2+, HCO3, and SO42− [64]. The distribution of groundwater samples above the y = x line suggests that major ions’ relative concentration in the groundwater system is affected by cation exchange reactions. Furthermore, the chloro alkaline indices index (CAI-I and CAI-II) can determine whether the cation exchange process is forward or reverse [65]. These indices are calculated using Equations (27) and (28), which involve ion concentrations expressed in meq/L. In Figure 7g,h, it can be observed that most groundwater samples exhibit negative CAI-I and CAI-II values. This suggests that forward cation exchange reactions are taking place, wherein Ca2+ and Mg2+ ions in the groundwater are being replaced by K+ and Na+ ions in the aquifer. In Figure 7i, the saturation indices (SI) of specific minerals (calcite, dolomite, gypsum, and halite) in the groundwater system were calculated using PHREEQC (Version 3) software to further determine their status. The presence of positive SI values in carbonate minerals (such as calcite and dolomite) suggests that the groundwater’s ion composition is linked to the dissolution of these minerals. On the other hand, the negative SI values observed in gypsum and halite indicate that these minerals are not in a saturated state in the groundwater system and therefore dissolve less in this area.
CAI - I = C l Na + + K + / C l
CAI - II = C l Na + + K + / HC O 3 + S O 4 2 + C O 3 2 + N O 3

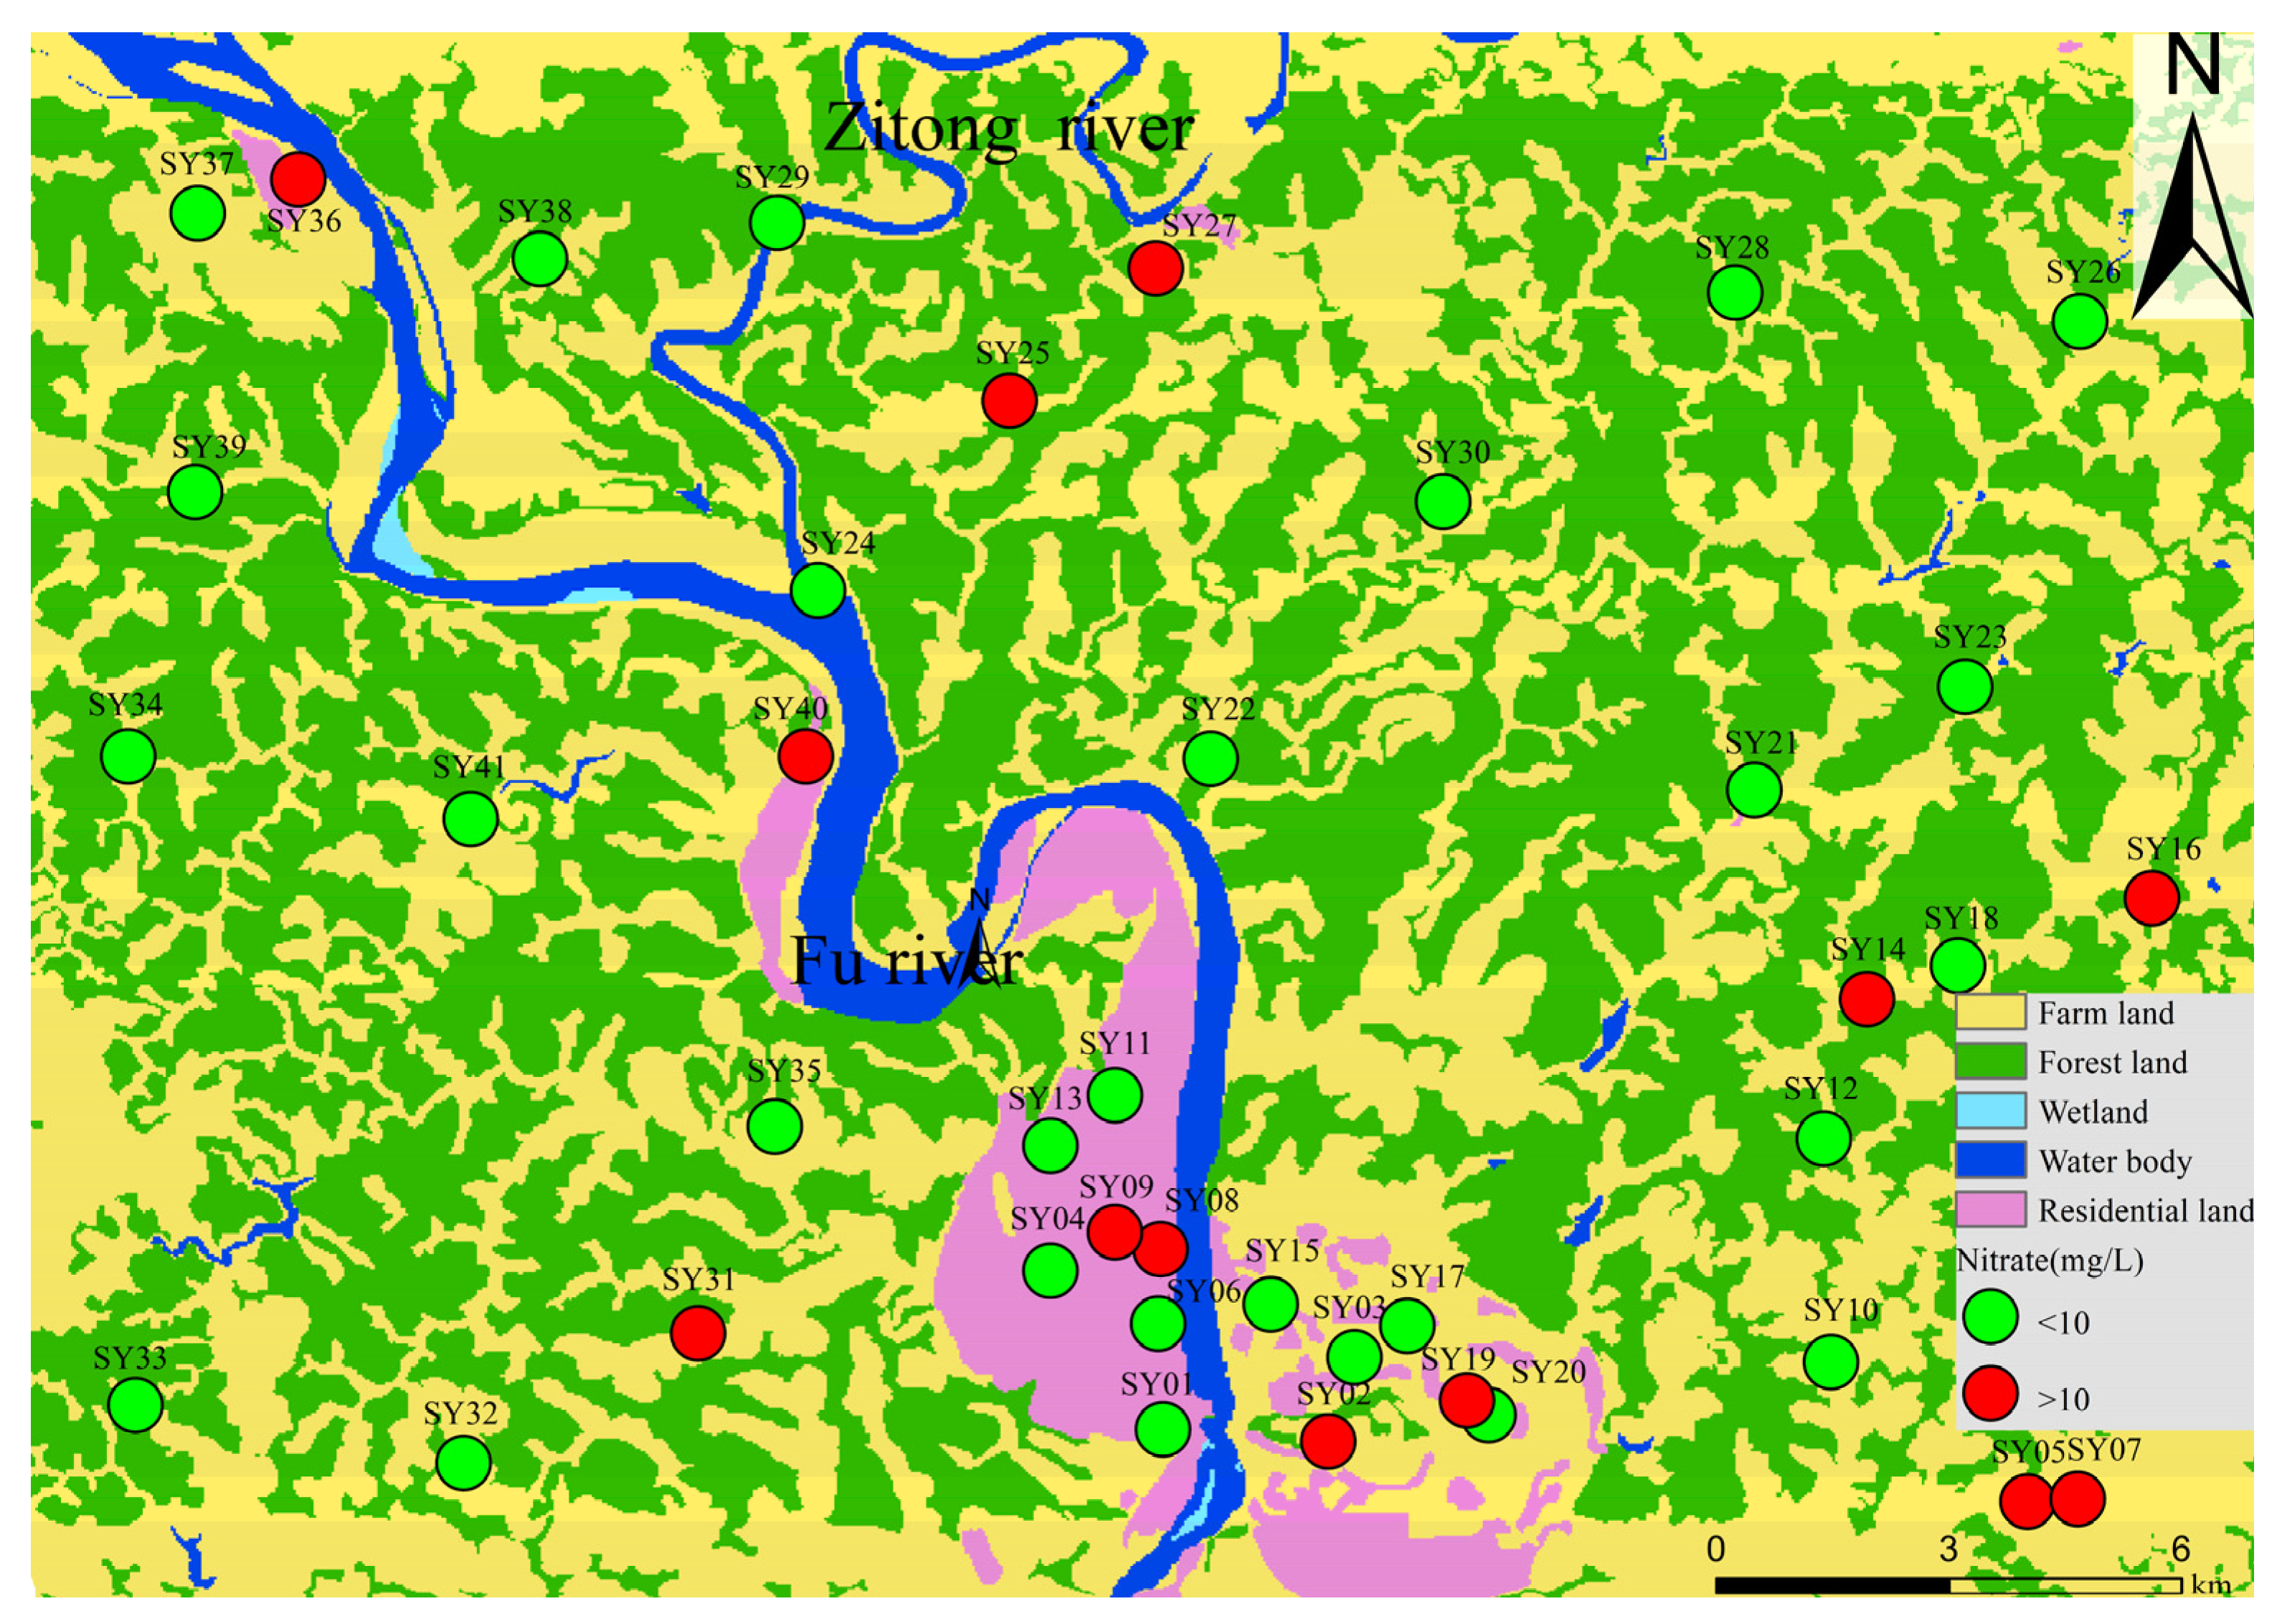
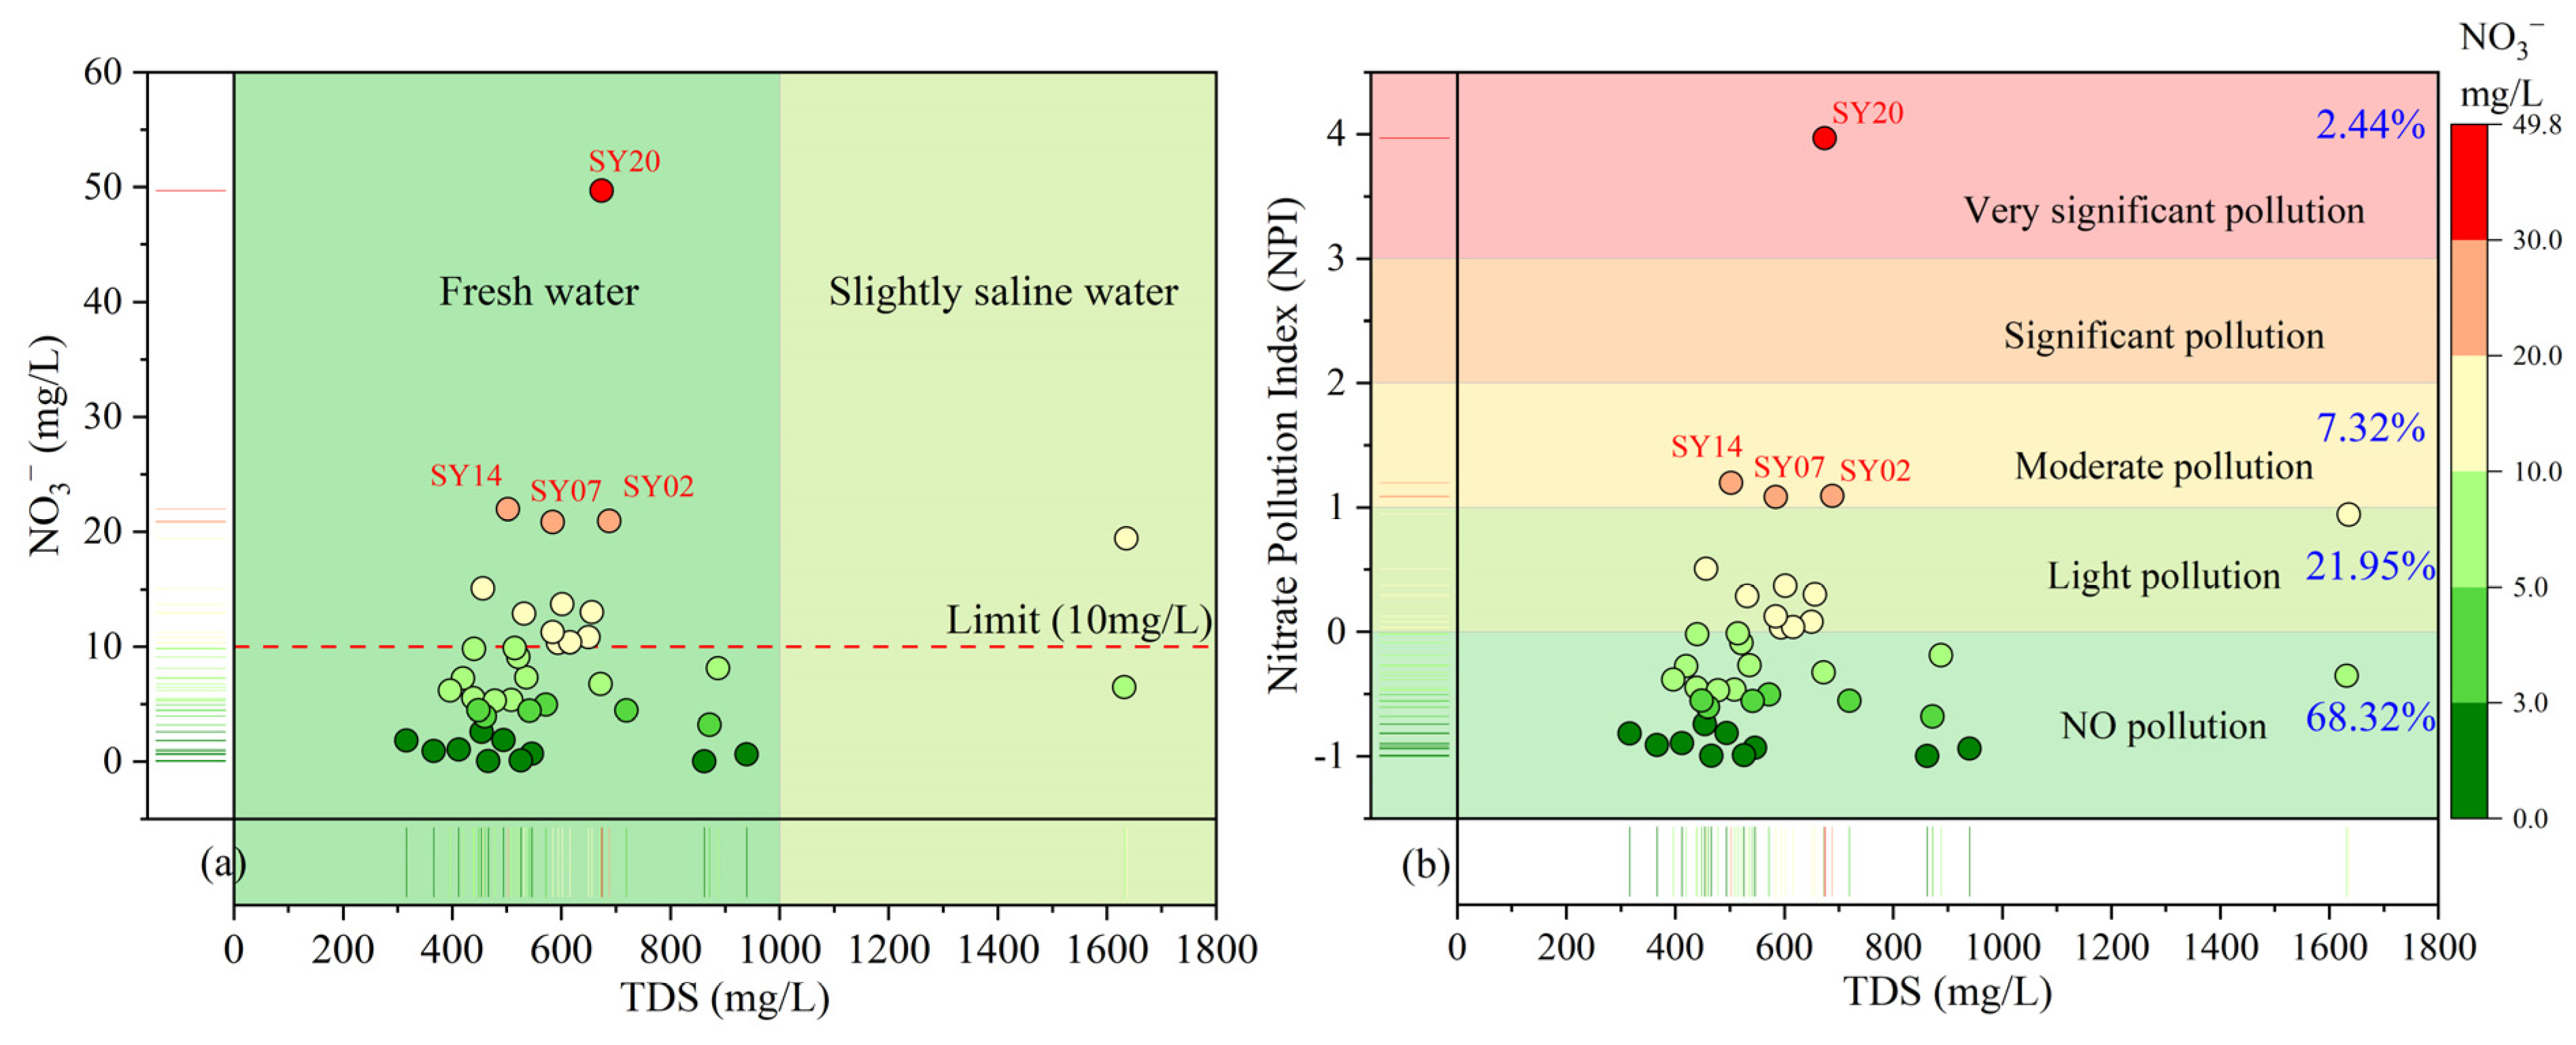
3.4. Nitrate Pollution Analysis

As mentioned in the previous section, the study area is mainly affected by excessive NO3 ions, which accounts for 31.71% of the total samples (Table 3). This section aims to analyze the sources of nitrate pollution. It has been established that human activities, including agricultural and industrial practices, as well as municipal wastewater, contribute significantly to NO3 pollution [58,59]. As depicted in Figure 8, the samples that surpass the acceptable limit are dispersed throughout agricultural and residential areas, providing evidence that the surplus of NO3 is predominantly a result of human activities.
The data presented in Figure 9a clearly shows that the NO3 content in a significant number of groundwater samples exceeded the natural limit of 10 mg/L, indicating that nitrate pollution is likely due to human activities. To better understand the extent of this pollution, the NPI was introduced, and further analysis was conducted on the groundwater samples in the study area. The NPI–TDS relationship graph (Figure 9b) illustrates that the groundwater samples collected from the study area exhibit a range of nitrate pollution levels, with some showing no pollution while others exhibit severe pollution. Mild pollution was detected in 21.95% of the samples, while highly polluted water samples (SY20, SY14, SY02) were found in areas where human habitation and agriculture are prevalent. This confirms that the excessive nitrate levels are primarily caused by human activities. The study found that areas with high nitrate concentrations also had higher concentrations of TDS, Ca2+, Mg2+, HCO3, Cl, and SO42−. This suggests that anthropogenic influences not only increase nitrate concentration, but also increase groundwater salinity.
Under natural conditions, the NO3 to Cl ratio in groundwater is generally small. However, human activities such as agricultural, household, and municipal pollutant inputs can influence this ratio [66,67]. The NO3 to Cl ratio in naturally sampled groundwater with no human influence typically falls between 0.05 and 0.22. The study revealed that the NO3/Cl ratio of groundwater ranged from 0.00 to 1.22, with 29.26% of the groundwater samples exceeding the natural upper limit of 0.22, accounting for 12 samples. This suggests that human activities in the area have a significant impact on the groundwater chemistry.
To better understand the sources of anthropogenic pollution that affect groundwater chemistry, correlations between Cl/Na+ and NO3/Na+ as well as between NO3/Cl and Cl were investigated. In Figure 10a, most groundwater samples were plotted near or on the y = x line, suggesting that the concentration of NO3 was influenced to some extent by agricultural activities and domestic wastewater. Figure 10b, on the other hand, shows that groundwater samples were primarily situated in areas where household/municipal inputs were dominant, with agricultural activities being a secondary factor contributing to NO3 levels exceeding the standard in the study area. According to Figure 9b and Figure 10a, the high levels of NO3 in the study area are primarily a result of urban wastewater discharge and, to a lesser extent, agricultural activities. This finding is consistent with the spatial distribution of nitrate-exceeding groundwater, which is mainly concentrated in the residential and agricultural areas of the study area, as shown in Figure 9. Thus, anthropogenic factors, such as urban sewage discharge and agricultural activities, are the main contributors to the excessive NO3 levels in the groundwater of the study area.

3.5. Evaluation of Irrigation Water Quality by Basic Hydrogeochemical Indexes

In this study, the suitability of groundwater for agricultural irrigation is determined by comparing the results of different indicator analyses with the corresponding irrigation water classification parameters provided in Table 1.

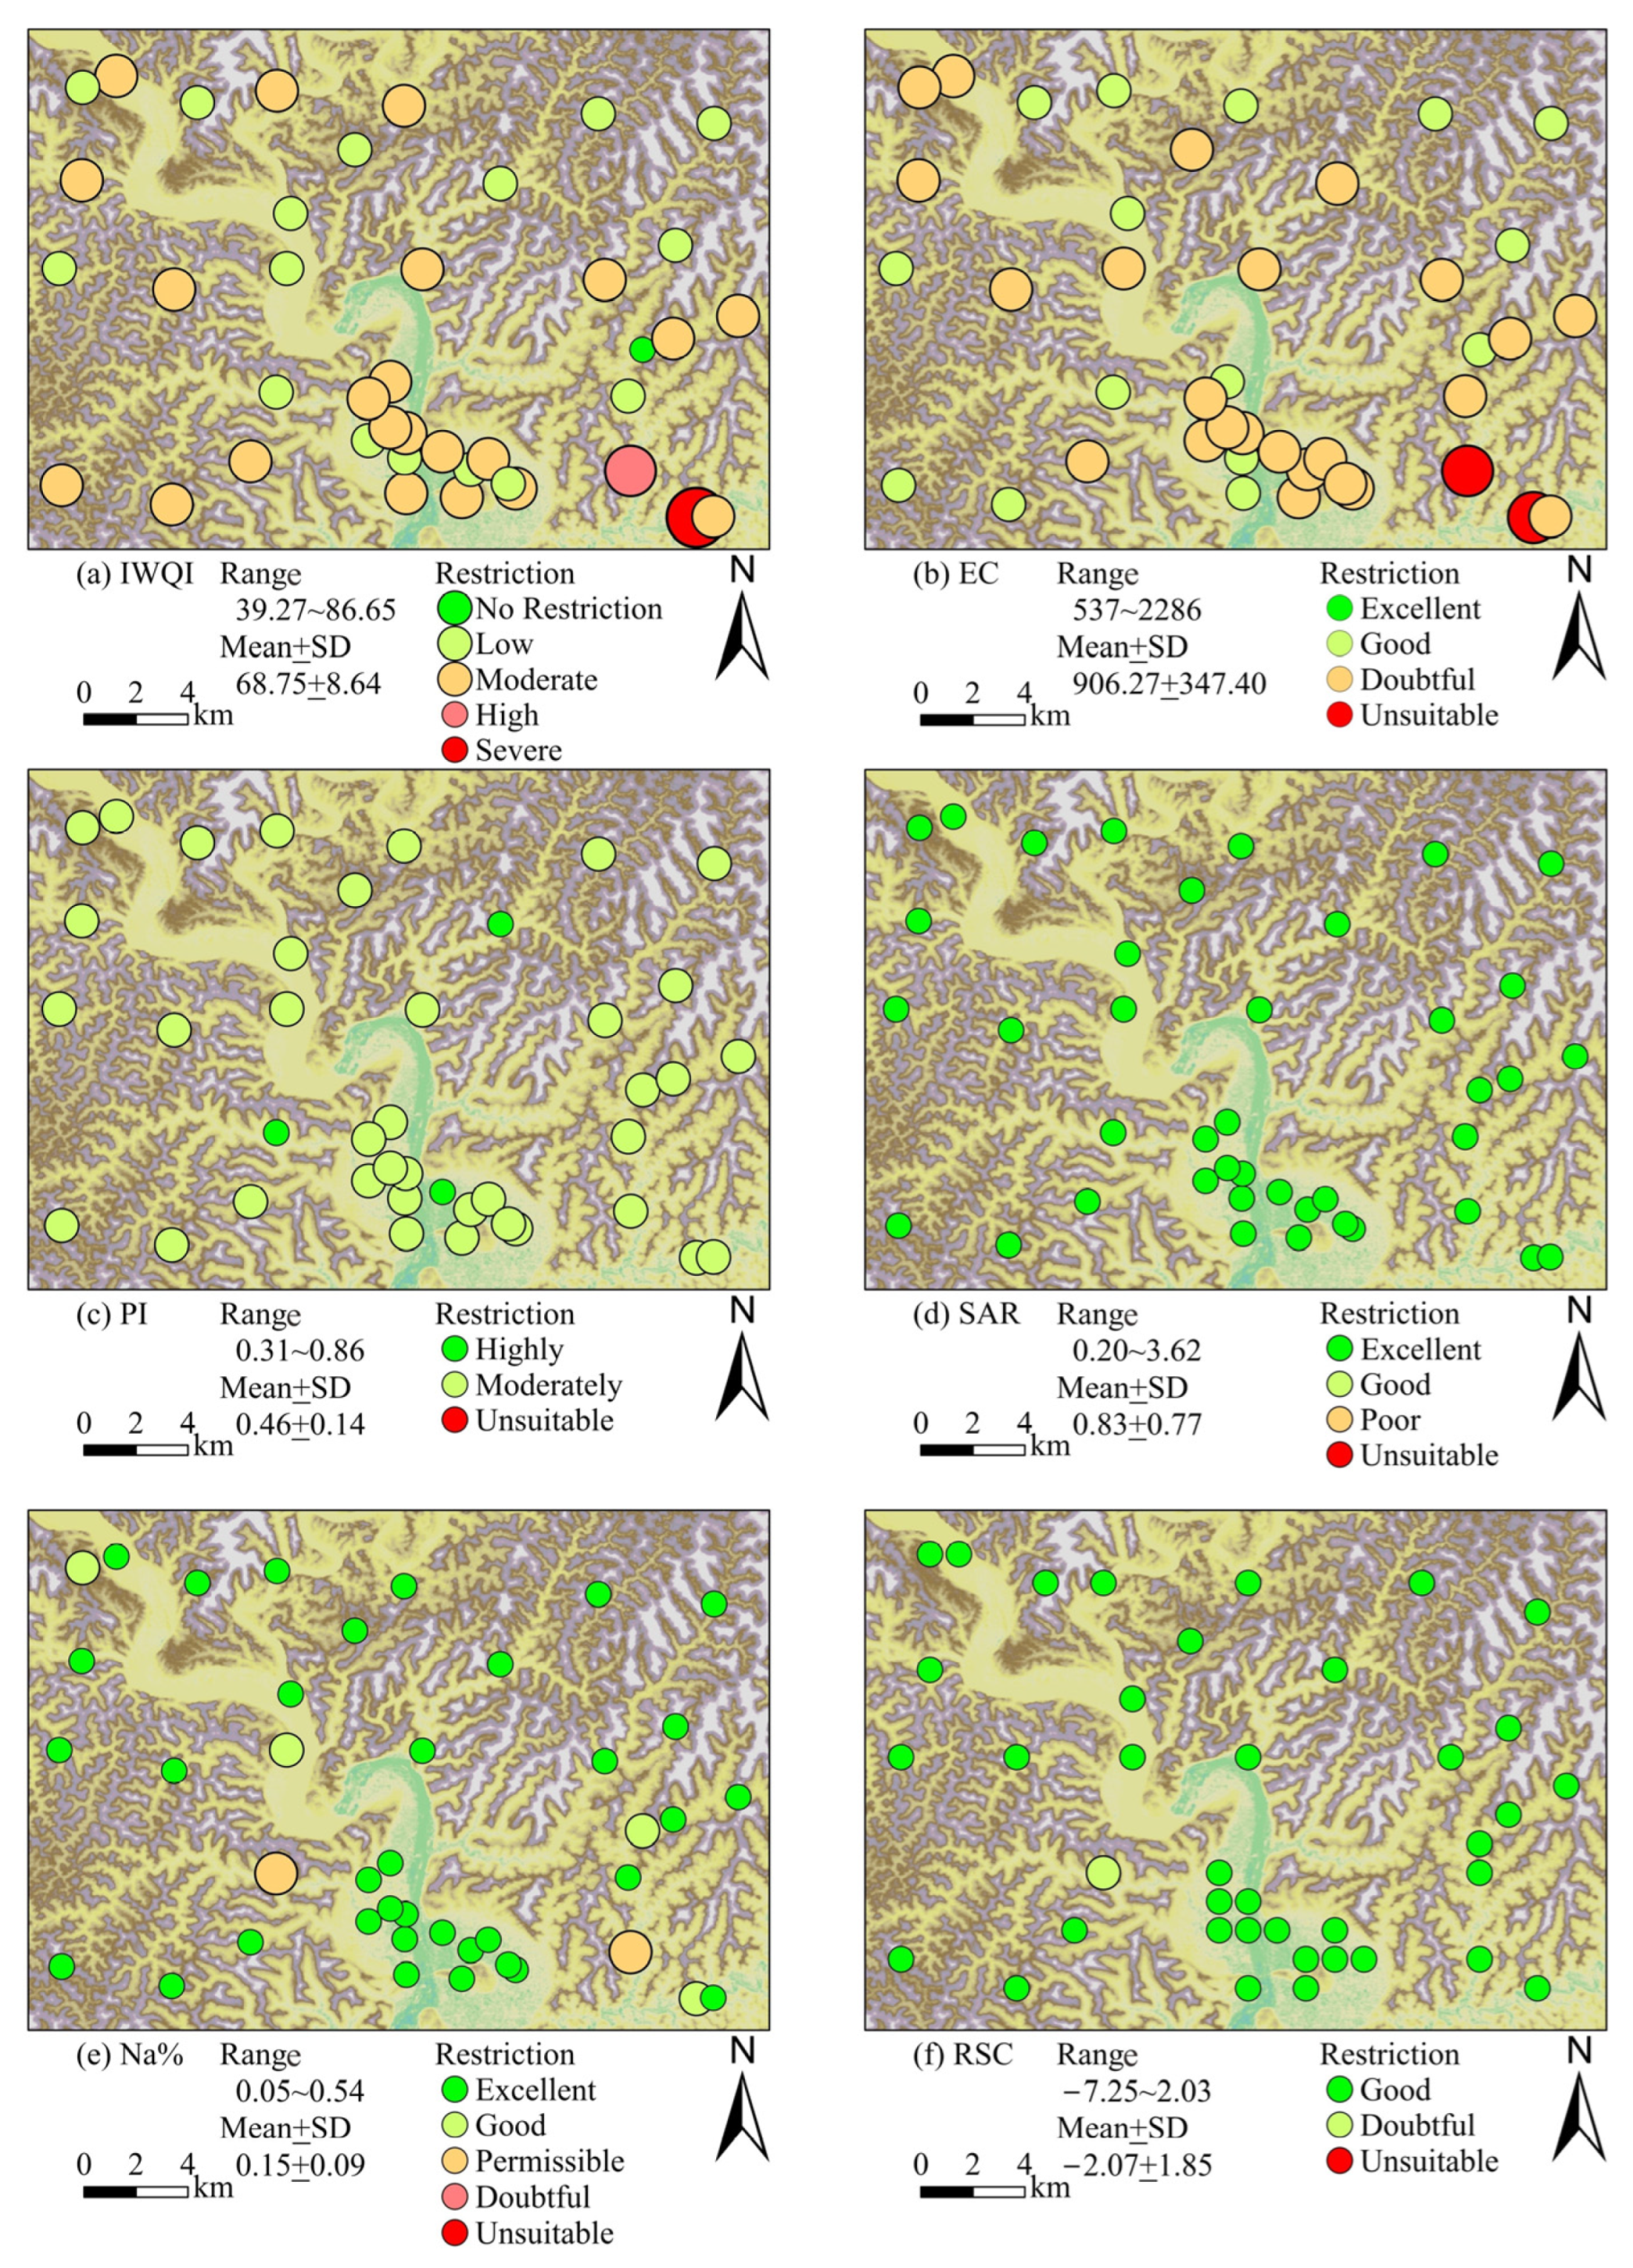
3.5.1. Salinity Hazard

Salinity is a crucial factor in determining the suitability of irrigation water, and it can be measured through conductivity (EC) or total dissolved solids (TDS). EC is an indicator of water conductivity and can reveal the harmful effects of salts on crops. In the study area, the EC values of groundwater samples ranged from 537 to 2286 µS/cm (with a mean of 906.27 µS/cm), as illustrated in Figure 11b. The salinity of groundwater in the study area increases from northwest to southeast. Only 36.58% of groundwater samples are suitable for irrigation without affecting crops. The irrigation suitability of 58.54% of groundwater samples is questionable, with EC values of two sample points exceeding 2000 µS/cm. If saline water is used for irrigation, the concentration of salts in the soil may rise to a harmful level and adversely affect the crops. The nutritional uptake and water retention of agricultural crops rely on the salt content in water, which means that each crop has a specific salinity limit. As a result, it is crucial to regulate the salinity of irrigation water when using groundwater for irrigation. In the southeast of the study area, groundwater can be utilized to irrigate crops that can tolerate high salinity levels, such as sunflowers, rye, wheat, and olives.

3.5.2. Sodium Hazard

The sodium adsorption ratio (SAR) is a useful indicator of sodium hazards in irrigation water. It is calculated by comparing the concentrations of Na+ to Ca2+ and Mg2+ [68]. SAR is related to salt absorption on soil surfaces and can be used to evaluate the extent of damage caused by Na+ in irrigation water. Additionally, Na+ in irrigation water can replace Ca2+ and Mg2+ in the soil, which can reduce soil permeability. The SAR values of all samples range from 0.20 to 3.62 meq/L. According to Table 1, all samples fall under the excellent category in the SAR classification of irrigation water. This suggests that the groundwater in the study area is appropriate for irrigating all soil types as long as the SAR is used as the evaluation index (Figure 11d).

3.5.3. Residual Sodium Carbonate (RSC)

RSC is a useful tool for assessing the negative impact of carbonate (CO32−) and bicarbonate (HCO3) on the quality of agricultural irrigation water. When the concentrations of CO32− and HCO3 ions in groundwater are higher than those of the Ca2+ and Mg2+ ions, the precipitation of Ca2+ and Mg2+ can occur. This can negatively affect soil permeability, cause soil compaction, and harm crop growth, rendering the groundwater unsuitable for irrigation purposes. Based on the guidelines provided by the US Salinity Laboratory, irrigation water quality can be categorized into three groups. Water sample with an RSC value of less than 1.25 meq/L is considered appropriate for irrigation. However, water with RSC values ranging from 1.25 to 2.5 meq/L may not be suitable for irrigation and requires further investigation. Water with RSC values exceeding 2.5 meq/L is deemed unsuitable for irrigation purposes. Figure 11f displays the RSC classification of irrigation water, indicating RSC values that range from −7.25 to 2.03 and an average value of −2.07. The Table 1 shows that 97.56% of groundwater samples were classified as suitable for irrigation, with only one sample being of doubtful suitability.

3.5.4. Permeability Index (PI)

The long-term use of irrigation water containing high levels of Na+, Mg2+, Ca2+, and HCO3 can have a significant impact on soil permeability. To assess the suitability of groundwater for irrigation, this study utilized the permeability index (PI). The PI was used to establish a correlation between the total ion concentration and irrigation water quality, which was categorized into three groups: excellent for PI > 75%, good for 25% < PI < 75%, and poor for PI < 25%. Based on the analysis and calculation of the permeability index of the samples, it was found that approximately 7.23% of the groundwater was of excellent quality for irrigation purposes, while approximately 92.86% of the groundwater was considered good for irrigation (Table 1). These findings suggest that the impact of irrigation water on soil properties is minimal. However, it is still recommended to monitor the long-term effects of groundwater and surface water irrigation on soil permeability in the study area.

3.5.5. Percentage of Sodium (%Na)

The %Na is a useful indicator for evaluating the potential damage of sodium to soil structure. The %Na is used to classify irrigation water quality into five categories. According to the sodium content, irrigation water quality can be categorized as excellent if %Na is less than 20, good if it falls between 20 and 40%, usable for irrigation when %Na is between 40 and 60, questionable if %Na ranges between 60 and 80, and not suitable for irrigation if the %Na is greater than 80. Therefore, for long-term agricultural irrigation, water with sodium content below 60% is considered suitable. Water with a sodium content higher than 60% is unsuitable for use as irrigation water as it can cause sodium hazards to the soil through long-term irrigation practices. In the study area, the sodium content of water samples ranged from 5.36% to 53.79%. The groundwater in the study area is suitable for irrigation as the %Na is below 60%. Further exploration was conducted to determine its suitability for irrigation based on the relationship between the EC and %Na ratio, as shown in Figure 10c.

3.5.6. Wilcox Diagram

The Wilcox diagram is a tool that can be used to assess the quality of irrigation water based on both %Na and EC [69]. By plotting water samples on a graph with EC as the horizontal axis and %Na as the vertical axis, the diagram can classify irrigation water quality into five categories: excellent, good, permissible, doubtful, and unsuitable. Water samples that fall within the excellent or good regions are deemed suitable for agricultural irrigation. However, if they fall within the usable region, there is a potential risk of alkali damage when utilized for irrigation. This risk, although relatively small, can be mitigated by implementing appropriate measures. Water located in the marginally usable region for irrigation presents a risk of both salt and alkali damage. Conversely, water located in the unsuitable region is not appropriate for irrigation and can cause severe salt and alkali damage. In this study, water samples were plotted on the Wilcox diagram (Figure 10c) to determine their suitability for irrigation.
Of all the groundwater samples analyzed, only two fell within the marginally usable range, while the remaining samples were categorized as either excellent or good. This indicates that most of the samples are suitable for irrigation purposes. Based on the findings presented in Figure 11b, it is evident that groundwater samples with electrical conductivity (EC) values exceeding 2000 μS/cm are predominantly located in the southeastern region of the study area. This can be attributed to the construction of the industrial zone in the area. As a result, it is recommended that groundwater from the southeastern area should be avoided when selecting water sources for irrigation purposes.

3.5.7. USSL Diagram

The U.S. Salinity Laboratory’s diagram (USSL diagram) was utilized to evaluate the groundwater’s suitability for irrigation by assessing its water quality in greater detail [70]. The irrigation water was classified into four categories (C1, C2, C3, and C4) based on the degree of salinization harm. These categories were determined by the water’s electrical conductivity, with ranges of less than 250, 250–750, 750–2250, and greater than 2250 μS/cm, respectively. The water was classified into four categories based on the degree of sodium (alkaline) hazard, namely S1 (low degree of alkaline hazard), S2 (moderate degree of alkaline hazard), S3 (high degree of alkaline hazard), and S4 (very high degree of alkaline hazard). These categories were determined based on the sodium adsorption ratio, with the ranges being <10, 10–18, 18–26, and >26, respectively. The USSL classification system can be used to categorize irrigation water into sixteen different categories. The groundwater samples in the study area were projected onto the USSL diagram and the results are displayed in Figure 10d.
The collected water samples are classified as S1 low-alkali damage water and are primarily found in the C2–S1 and C3–S1 areas, which are characterized by medium to high salinity and low-alkali damage water. The C3–S1 region has water samples with high salinity but relatively low alkali content, making it conducive to the growth of most salt-tolerant crops. On the other hand, the C2–S1 region has water samples with moderate salinity and low alkali content, making it suitable for the growth of all moderately salt-tolerant crops.
According to data from the USSL chart, groundwater samples collected from the Shehong area have been categorized as having medium to high salinity and low sodium hazard. As a result, the groundwater in this area is suitable for irrigating most soils, with the exception of those with a low salt tolerance. This makes it relatively harmless. However, it may require special management of the groundwater salinity, and salt-tolerant crops should be selected for cultivation.

4. Discussion

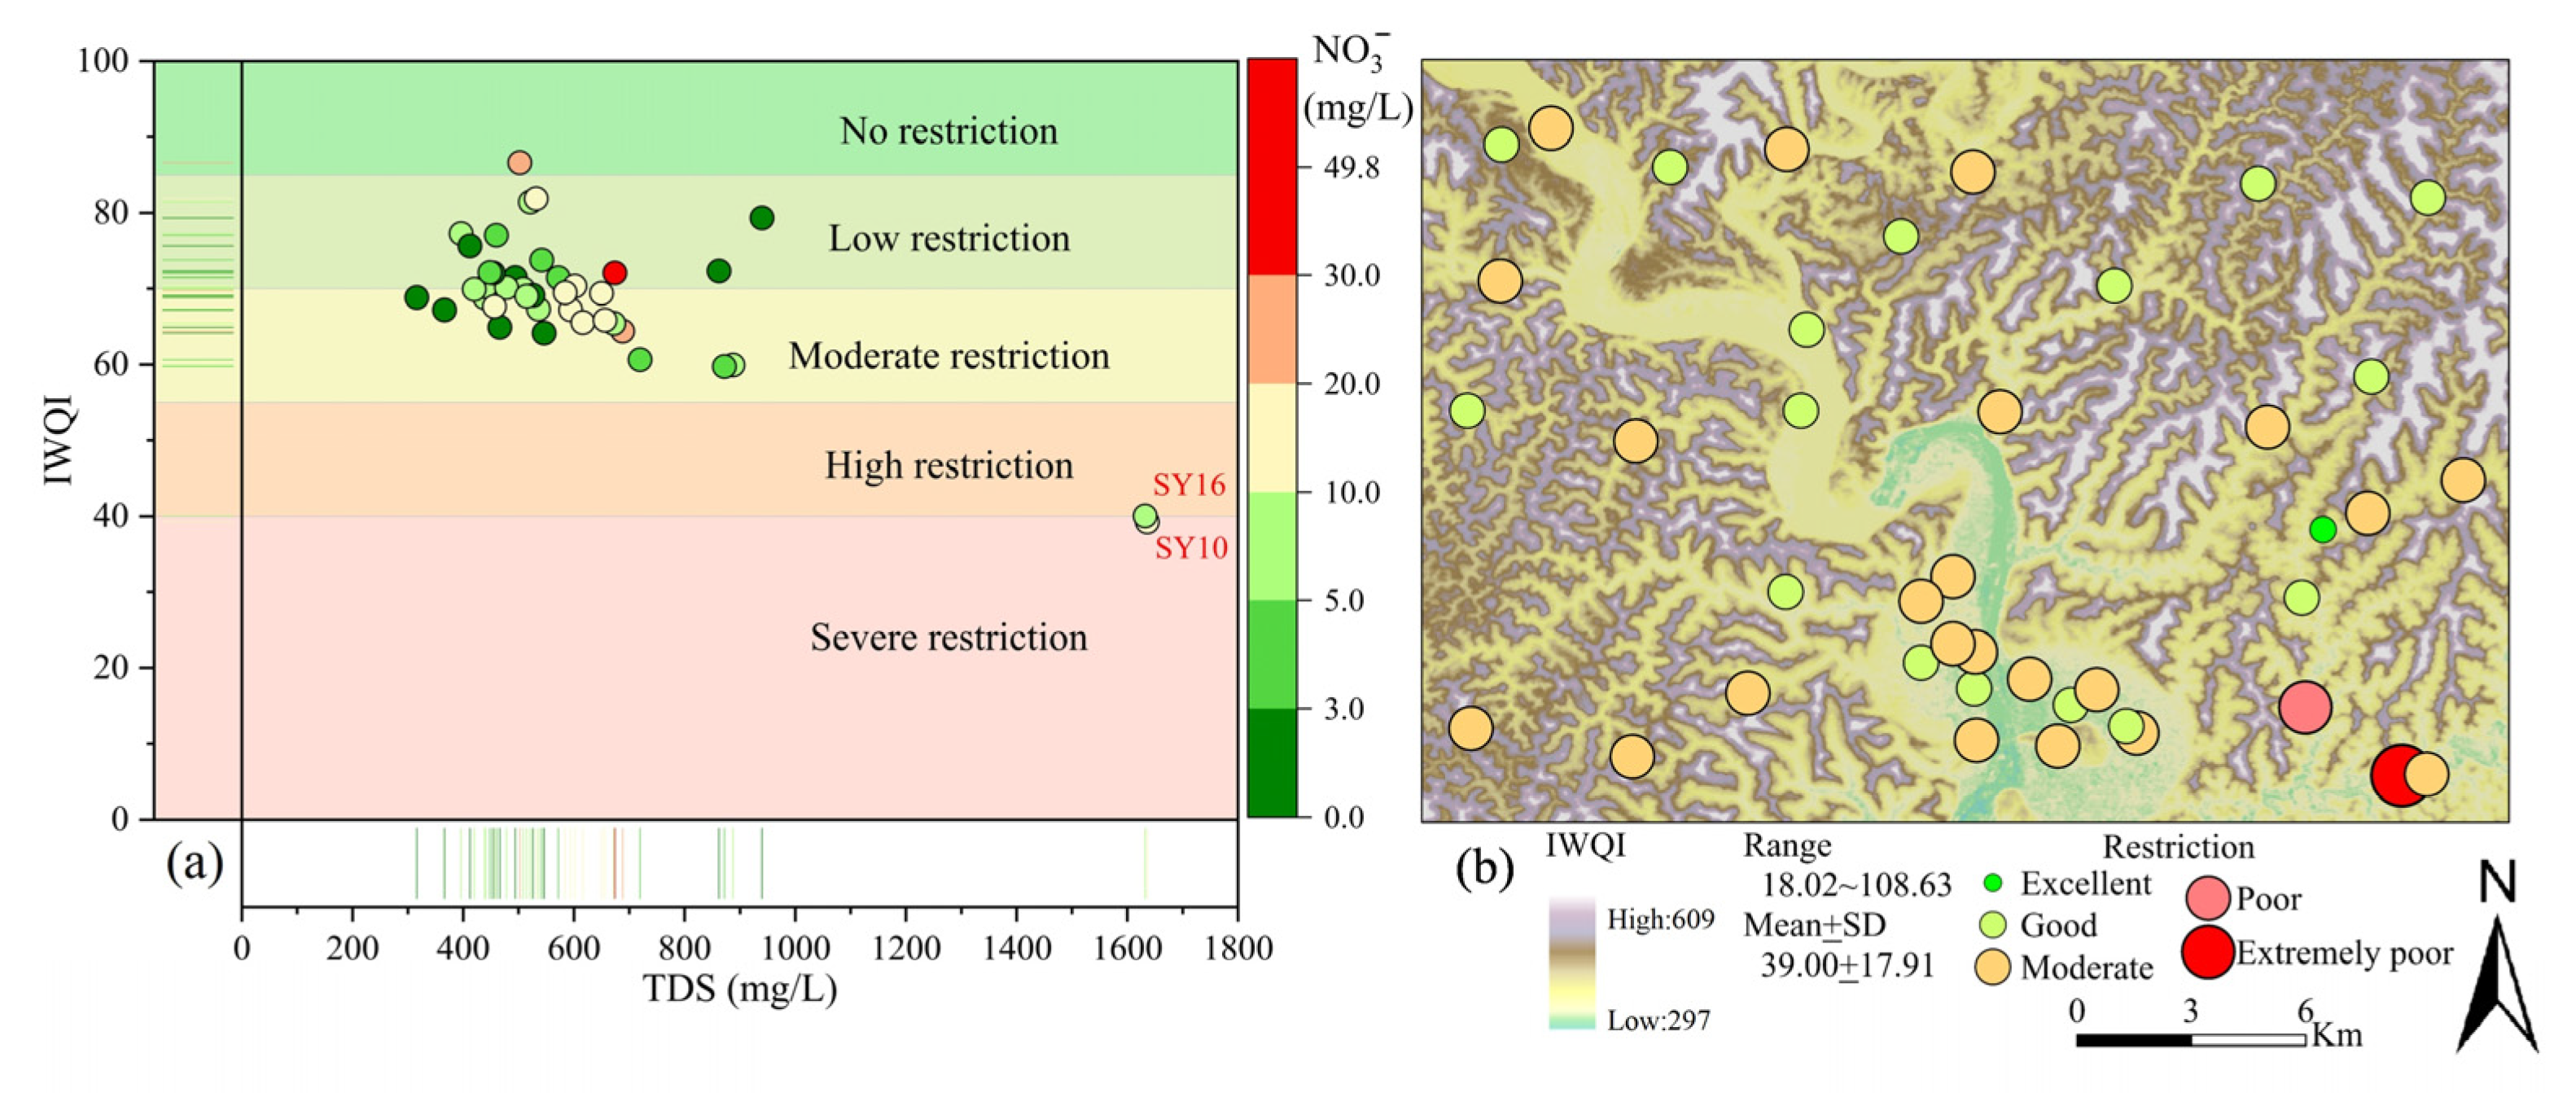
4.1. Irrigation Water Quality Index (IWQI)

After conducting PCA on a set of physicochemical parameters, four principal components were obtained. The components with relatively high loadings were EC, Na+, Cl, HCO3, and SAR, indicating their importance in water quality assessment. Therefore, these five parameters were selected as the main parameters for calculating the IWQI. Table 2, established by Ayers and Westcot [71], defines key parameters for irrigation water, which have been identified by UCCC [61]. Table 4 lists the normalized weights for these selected parameters.
The results presented in Table 1 and Figure 12a show that the use of groundwater for irrigation in the study area has negative impacts on soil and crops at all levels. Moderate restriction was found in most groundwater samples (53.66%), while one sample showed high restriction, and another showed severe restriction.
According to Figure 11b, only 2.44% of the groundwater in the study area is categorized as unrestricted, meaning it can be used for most plants or crops without significant issues of alkali or salt damage to soils (as shown in Figure 10b,d). Approximately 39.02% of the groundwater is categorized as low-restriction irrigation water, suitable for use in irrigating soils with predominantly sandy texture and moderate permeability. However, it is not recommended to use this type of water for soils with heavy texture and high clay content as it may result in alkali damage. The predominant soil type in the study area is light-textured calcareous purple soil, which makes the groundwater suitable for irrigation without much concern about alkali damage. However, salt-sensitive plants are at an increased risk when using this water for irrigation. Approximately 53.66% of the groundwater samples are classified as moderately restricted irrigation water, making moderately salt-tolerant plants more suitable for cultivation in this region. In soils with favorable leaching conditions and moderate to high permeability, utilizing groundwater for irrigation is advised to prevent soil alkalinity from rising. Additionally, it is recommended to flush out soil salts when using this groundwater for irrigation to avoid soil degradation. The study found that 4.88% of the groundwater in the area is classified as high-restriction irrigation groundwater due to the presence of one sample each of high and severe restriction types. This type of groundwater can only be used for soils with high permeability and no dense layer and is suitable only for plants with moderate to high salt tolerance.
The study reveals a decline in groundwater irrigation quality from the northwest to the southeast, which could be attributed to the topographical variation across the study area. The higher terrain in the northwest and lower terrain in the southeast may have led to the accumulation of salt and pollutants in the groundwater discharge region in the southeastern part of the study area. In addition, the study area includes the main urban area and industrial park of the study area, situated in the southern and southeastern parts, respectively. This may be a contributing factor to the observed trend of groundwater suitability for irrigation.

4.2. Irrigation Water Quality Assessment and Comments

This study utilized various indicators such as EC, SAR, Na%, RSC, PI, and IWQI to assess the appropriateness of groundwater in the study area of the Sichuan Basin as a source of irrigation water. The numerical values of each indicator were inputted into ArcGIS (10.8) software and the results were visualized through color-coded classifications for each sample, as shown in Figure 12. The study found that most of the groundwater in the area was suitable for irrigation when evaluated using SAR, Na%, RSC, and PI indicators. However, when EC and IWQI indicators were used, the quality of irrigation water decreased from northwest to southeast. The study found that groundwater in the northwest of the area was suitable for the irrigation of any crop and soil type. However, in the southeast, the groundwater was only suitable for crops with moderate to high salt tolerance and could only be used for soils with high permeability.
Therefore, rainwater collection systems can be constructed for agricultural irrigation to enhance crop productivity and prevent soil degradation in the study area. Additionally, it is suggested that artificial recharge techniques be implemented to combat high salinity and alkalinity in the region. When choosing an area for well irrigation, it is important to exercise caution and select an appropriate location. It is recommended to conduct groundwater extraction in the discharge area to improve the hydraulic gradient of groundwater and prevent salt accumulation. This can help to enhance the flow conditions of groundwater and ensure the success of the irrigation process [33,34,38,72]. To prevent soil degradation, it is essential to take measures to strengthen sewage treatment and reduce pollutant levels in the groundwater environment caused by human activities. Another important step is to adopt advanced irrigation methods such as sprinkler, micro-irrigation, and drip irrigation to minimize the impact of groundwater chemistry on soil. Lowering irrigation water pollution and soil degradation has the potential to improve crop yields and promote local economic development. To ensure the successful implementation of these methods, it is recommended to conduct an economic feasibility analysis within the current research field.

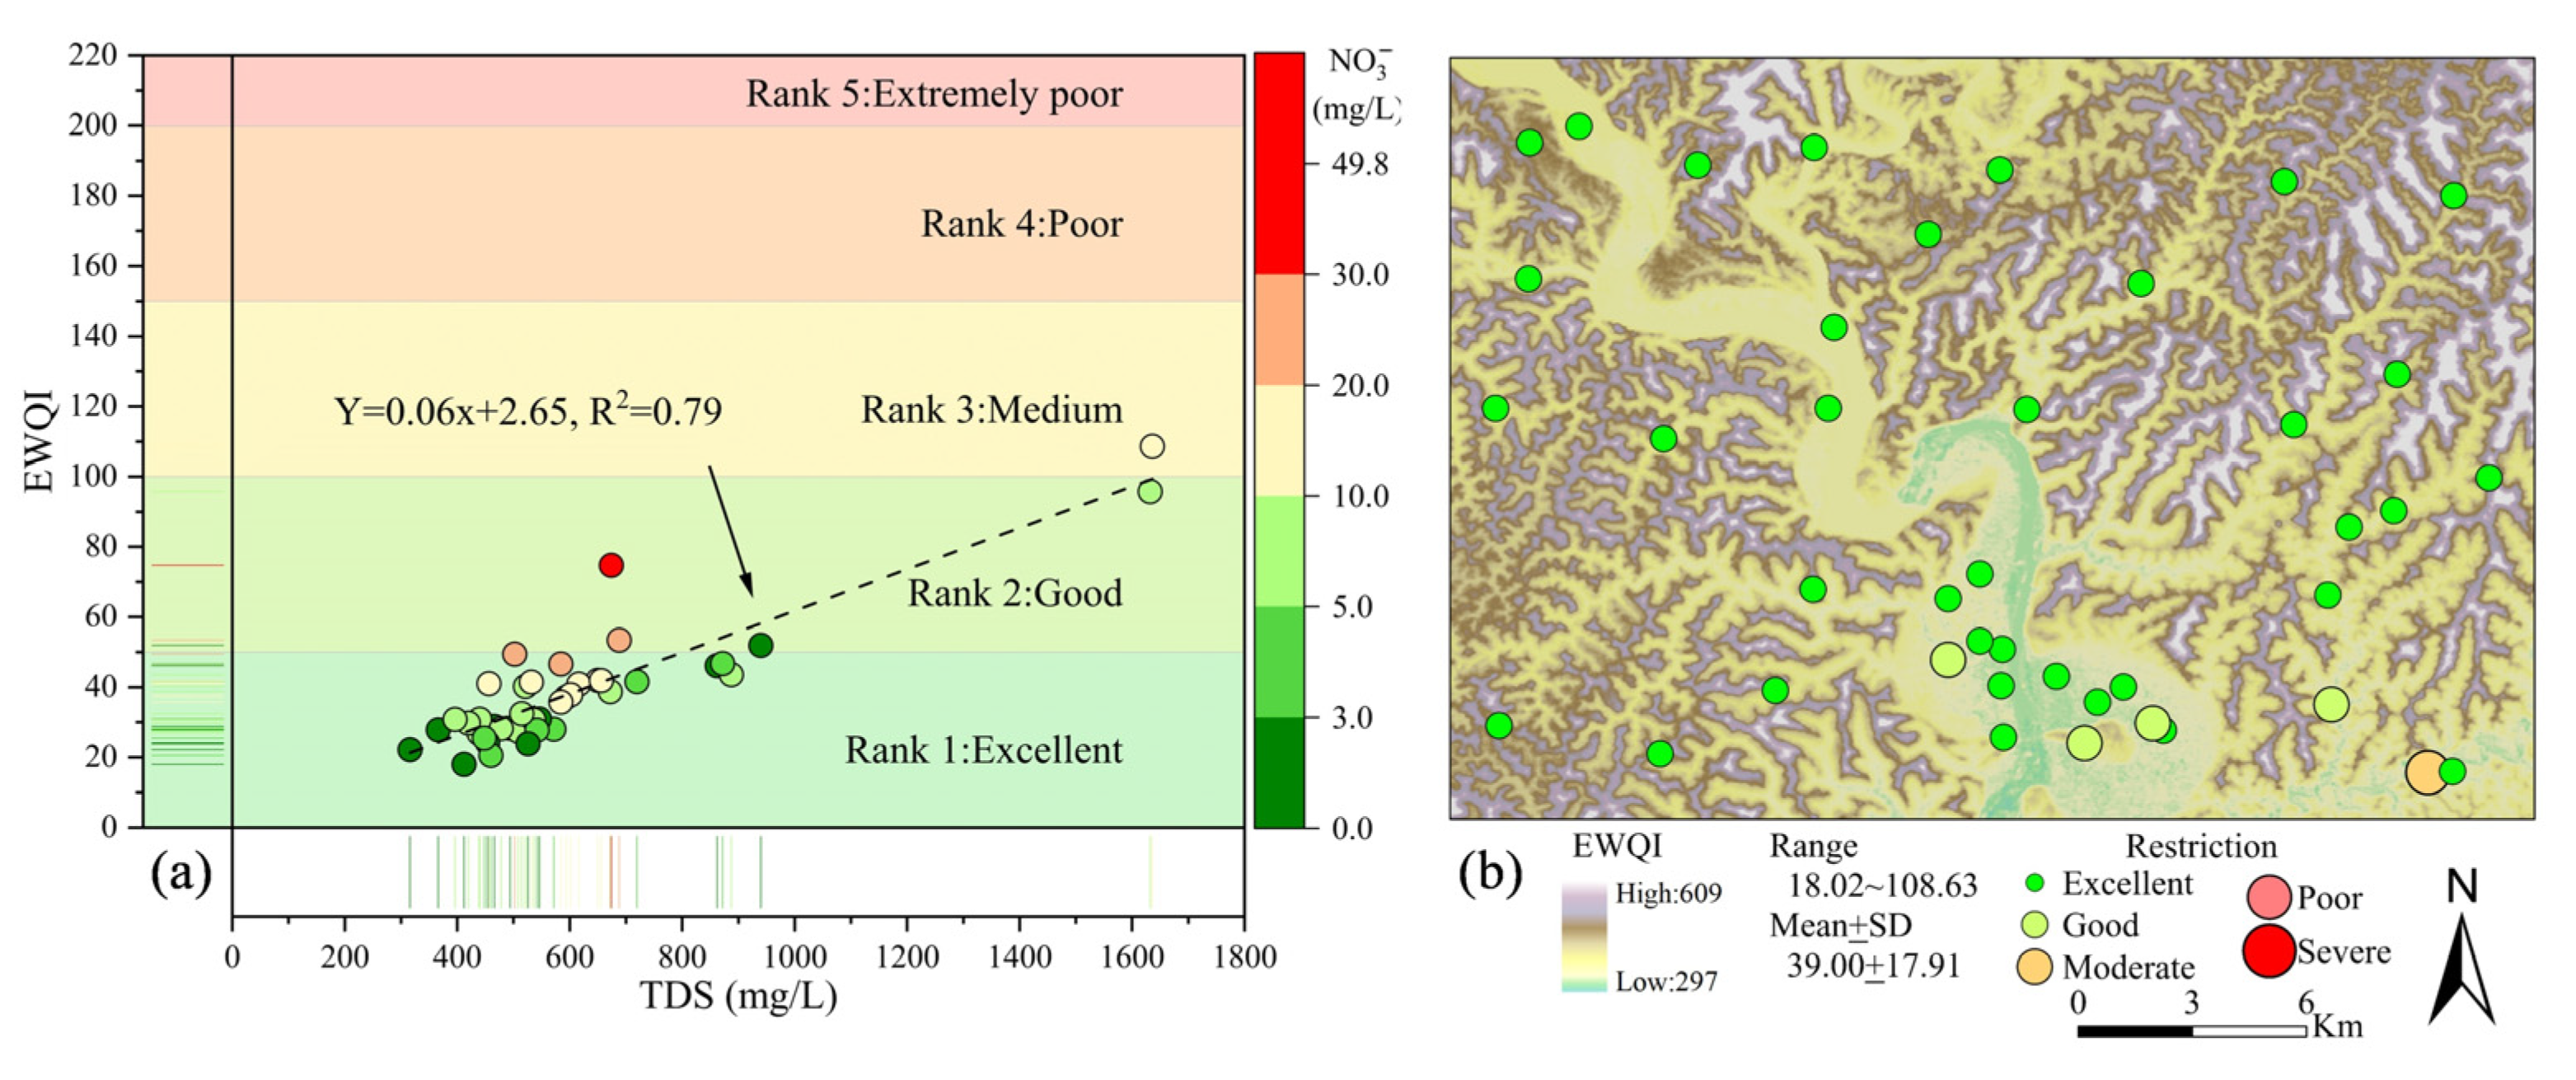
4.3. Entropy-Weighted Water Quality Index (EWQI)

In order to fully assess the quality of drinking water in the study area, 12 components, including cations, such as K+, Na+, Ca2+, Mg2+, and anions, such as Cl, SO42−, HCO3, NO3, F, as well as pH, TDS, and TH (expressed as CaCO3), were calculated using Equations (10)–(18) to obtain the EWQI. The study results, depicted in Figure 13, reveal that the groundwater quality in the area under investigation ranges from excellent to moderate. Notably, none of the samples indicated poor quality. A total of 97.56% of all samples (41 samples) were classified as level 1 or 2 (EWQI value < 100), and only one sample (SY05) was classified as level 3. The study found that the groundwater samples in levels 1 and 2 were safe for drinking, while the only the one remaining sample was not suitable [66,73]. However, it is worth noting that most of the groundwater samples analyzed in this study meet the quality requirements for drinking water.
In this study, the EWQI value and grade of groundwater samples in the study area were visualized using the interpolation method of geographic information system (GIS) and presented in Figure 13b. The figure shows that the quality of groundwater for drinking decreases from northwest to southeast in the study area. The study area depicts a decrease in groundwater quality for drinking from northwest to southeast. As a result, the groundwater in all regions except the southeast of the study area is suitable for direct use as a drinking water source. Nevertheless, it is imperative to focus on the industrial park of the study area, which is located in the southeast of the study area and improve the groundwater quality to ensure the well-being of local residents. The southeastern region has relatively high concentrations of NO3 and TDS, which contribute to high EWQI values. Figure 13a shows a strong positive correlation between TDS and EWQI values (Pearson correlation coefficient R2 = 0.79). Additionally, higher nitrate concentrations are associated with higher EWQI values, as indicated by the point colors. Therefore, it can be concluded that the levels of NO3 and TDS have a significant impact on the EWQI values in the area. While the overall water quality in the study area is good, there are certain locations with poor quality drinking water. However, the severity of the situation is not alarming. Proper management and the treatment of groundwater can lead to significant improvements in the water quality of the area.

4.4. Potential Health Risk Assessment

The USEPA’s health risk assessment model is commonly utilized to evaluate potential hazards [24,30]. In this study, nitrate pollution was chosen for a non-carcinogenic health risk assessment due to the prevalence of excessive nitrate concentrations in the study area’s groundwater. Long-term ingestion of groundwater with high nitrate concentrations can pose several health risks to humans, such as methemoglobinemia or blue baby syndrome, esophageal and stomach cancers, and thyroid hypertrophy [24,30,41,74]. To evaluate the non-carcinogenic health hazards for various groups, including adults, children, and infants, hazard quotient (HQ) values were computed. Table 5 illustrates the statistical features of HQNitrate and cumulative non-carcinogenic risk (HITotal) for each population group.
The HQ < 1 indicates that there is no potential non-carcinogenic health risk to humans [75]. Statistical analysis shows that the range of HQNitrate is between 0.00 and 1.29 and 0.00 and 1.54 for adult females and adult males, respectively. For children and infants, the range is between 0.00 and 1.80 and 0.00 and 2.91, respectively. The average HQNitrate values for adult females, adult males, children, and infants are 0.18, 0.22, 0.26, and 0.42, respectively. Notably, infants have the highest HQNitrate value among the four populations. In this study, the cumulative non-carcinogenic risks were found to range from 0.13 to 1.69 for adult females, 0.16 to 2.01 for adult males, 0.18 to 2.35 for children, and 0.30 to 3.8 for infants, with mean values of 0.42, 0.50, 0.58, and 0.94, respectively. Infants were found to have the highest health risk levels due to their sensitivity to nitrate poisoning and less developed enzyme metabolism, making them more susceptible to the harmful effects of nitrates from external sources [41,76].
This study utilized Monte Carlo simulation methods to evaluate the potential non-carcinogenic health hazards associated with drinking water in the area under investigation for various population groups, including infants, children, adult males, and adult females. Figure 14 displays the cumulative probability distribution of the potential non-cancerous health risks. Moreover, the 95th percentile is commonly used to ascertain whether the health risk of the indicator surpasses the acceptable limit for different populations, with the aim of mitigating the impact of extreme values on the assessment [76].
According to Figure 14, the 95% confidence interval for HQNitrate is greater than 1 for infants at 1.55. However, for children, adult males, and adult females, the 95% confidence interval for HQNitrate is less than 1 at 0.96, 0.82, and 0.69, respectively. The study found that NO3 poses the greatest non-carcinogenic health risk to infants in the area, with decreasing effects observed in children, adult males, and adult females. The cumulative non-carcinogenic health risks across the four populations followed a similar pattern to that of NO3.
To better comprehend the distribution of non-carcinogenic health hazards among various populations in the study area, the cumulative non-carcinogenic health risks were interpolated and presented in Figure 15. The sample points in the study area were categorized into different colors based on whether the HITotal of different groups exceeded 1. The red color in the figure indicates a higher level of health risk.
The findings in Figure 15 indicate that infants are at a higher health risk compared to adult females, adult males, and children. Furthermore, the results show that males have a greater health risk than females under similar conditions. The study found that areas with a higher HITotal for infants were prevalent throughout the study area, while those for the other three population groups were more sporadic and located in the southwest. This suggests that the health risks associated with NO3 are most severe for infants in the study area, and that the risk increases as one moves closer to the southeast of the study area. The proportion of groundwater samples with cumulative non-carcinogenic risk values greater than 1 is highest in infants at 39.02%, followed by children at 14.63%, adult males at 7.32%, and adult females at 2.43%. The study revealed that infants had the highest non-carcinogenic health risk compared to the other populations analyzed. The HITotal values for infants were almost 16.04, 5.33, and 2.67 times higher than adult females, adult males, and children, respectively. This emphasizes the urgency to take immediate action to decrease nitrate concentrations in groundwater sources in the study area.
Based on the study, it can be concluded that the potential health risk associated with excessive NO3 concentration is higher in infants and children as compared to adult males and females. The sources of this excessive concentration are mainly urban sewage and agricultural pollution. To mitigate human health risks caused by NO3, specific measures will be implemented to enhance the quality control of sewage discharge in the industrial new area located in the southwest of the study area. Additionally, the pollution of groundwater from agricultural activities will be addressed by reducing the usage of nitrogen fertilizer and implementing changes in irrigation methods. It should be noted that the adverse effects of nitrate pollution on human health are not limited to the study area and can be a global concern. To mitigate nitrate pollution in groundwater sources, it is imperative for governments and relevant agencies to implement effective monitoring and control measures, particularly in regions where groundwater serves as a primary source of drinking water. Furthermore, it is recommended that health education programs be established to increase awareness of the potential health hazards linked to nitrate pollution in drinking water, particularly among vulnerable populations, such as infants.

5. Conclusions

The main findings of the study are as follows:
  • The groundwater samples have a weakly alkaline nature with low to moderate mineralization and are categorized as HCO3-Ca type. On average, the cation content is in the order of Ca2+ > Na+ > Mg2+ > K+, while the anion content is in the order of HCO3 > SO42− > Cl > NO3 > F. With the exception of NO3, the ion concentrations in almost all samples were within the permissible limits for drinking purposes.
  • The groundwater’s major ion sources were found to be primarily from the dissolution of carbonate and silicate rocks, as indicated by principal component analysis, major ion ratios, and mineral saturation index. This process is related to cation exchange. The elevated levels of nitrate in the area are mainly attributed to agricultural activities and urban sewage.
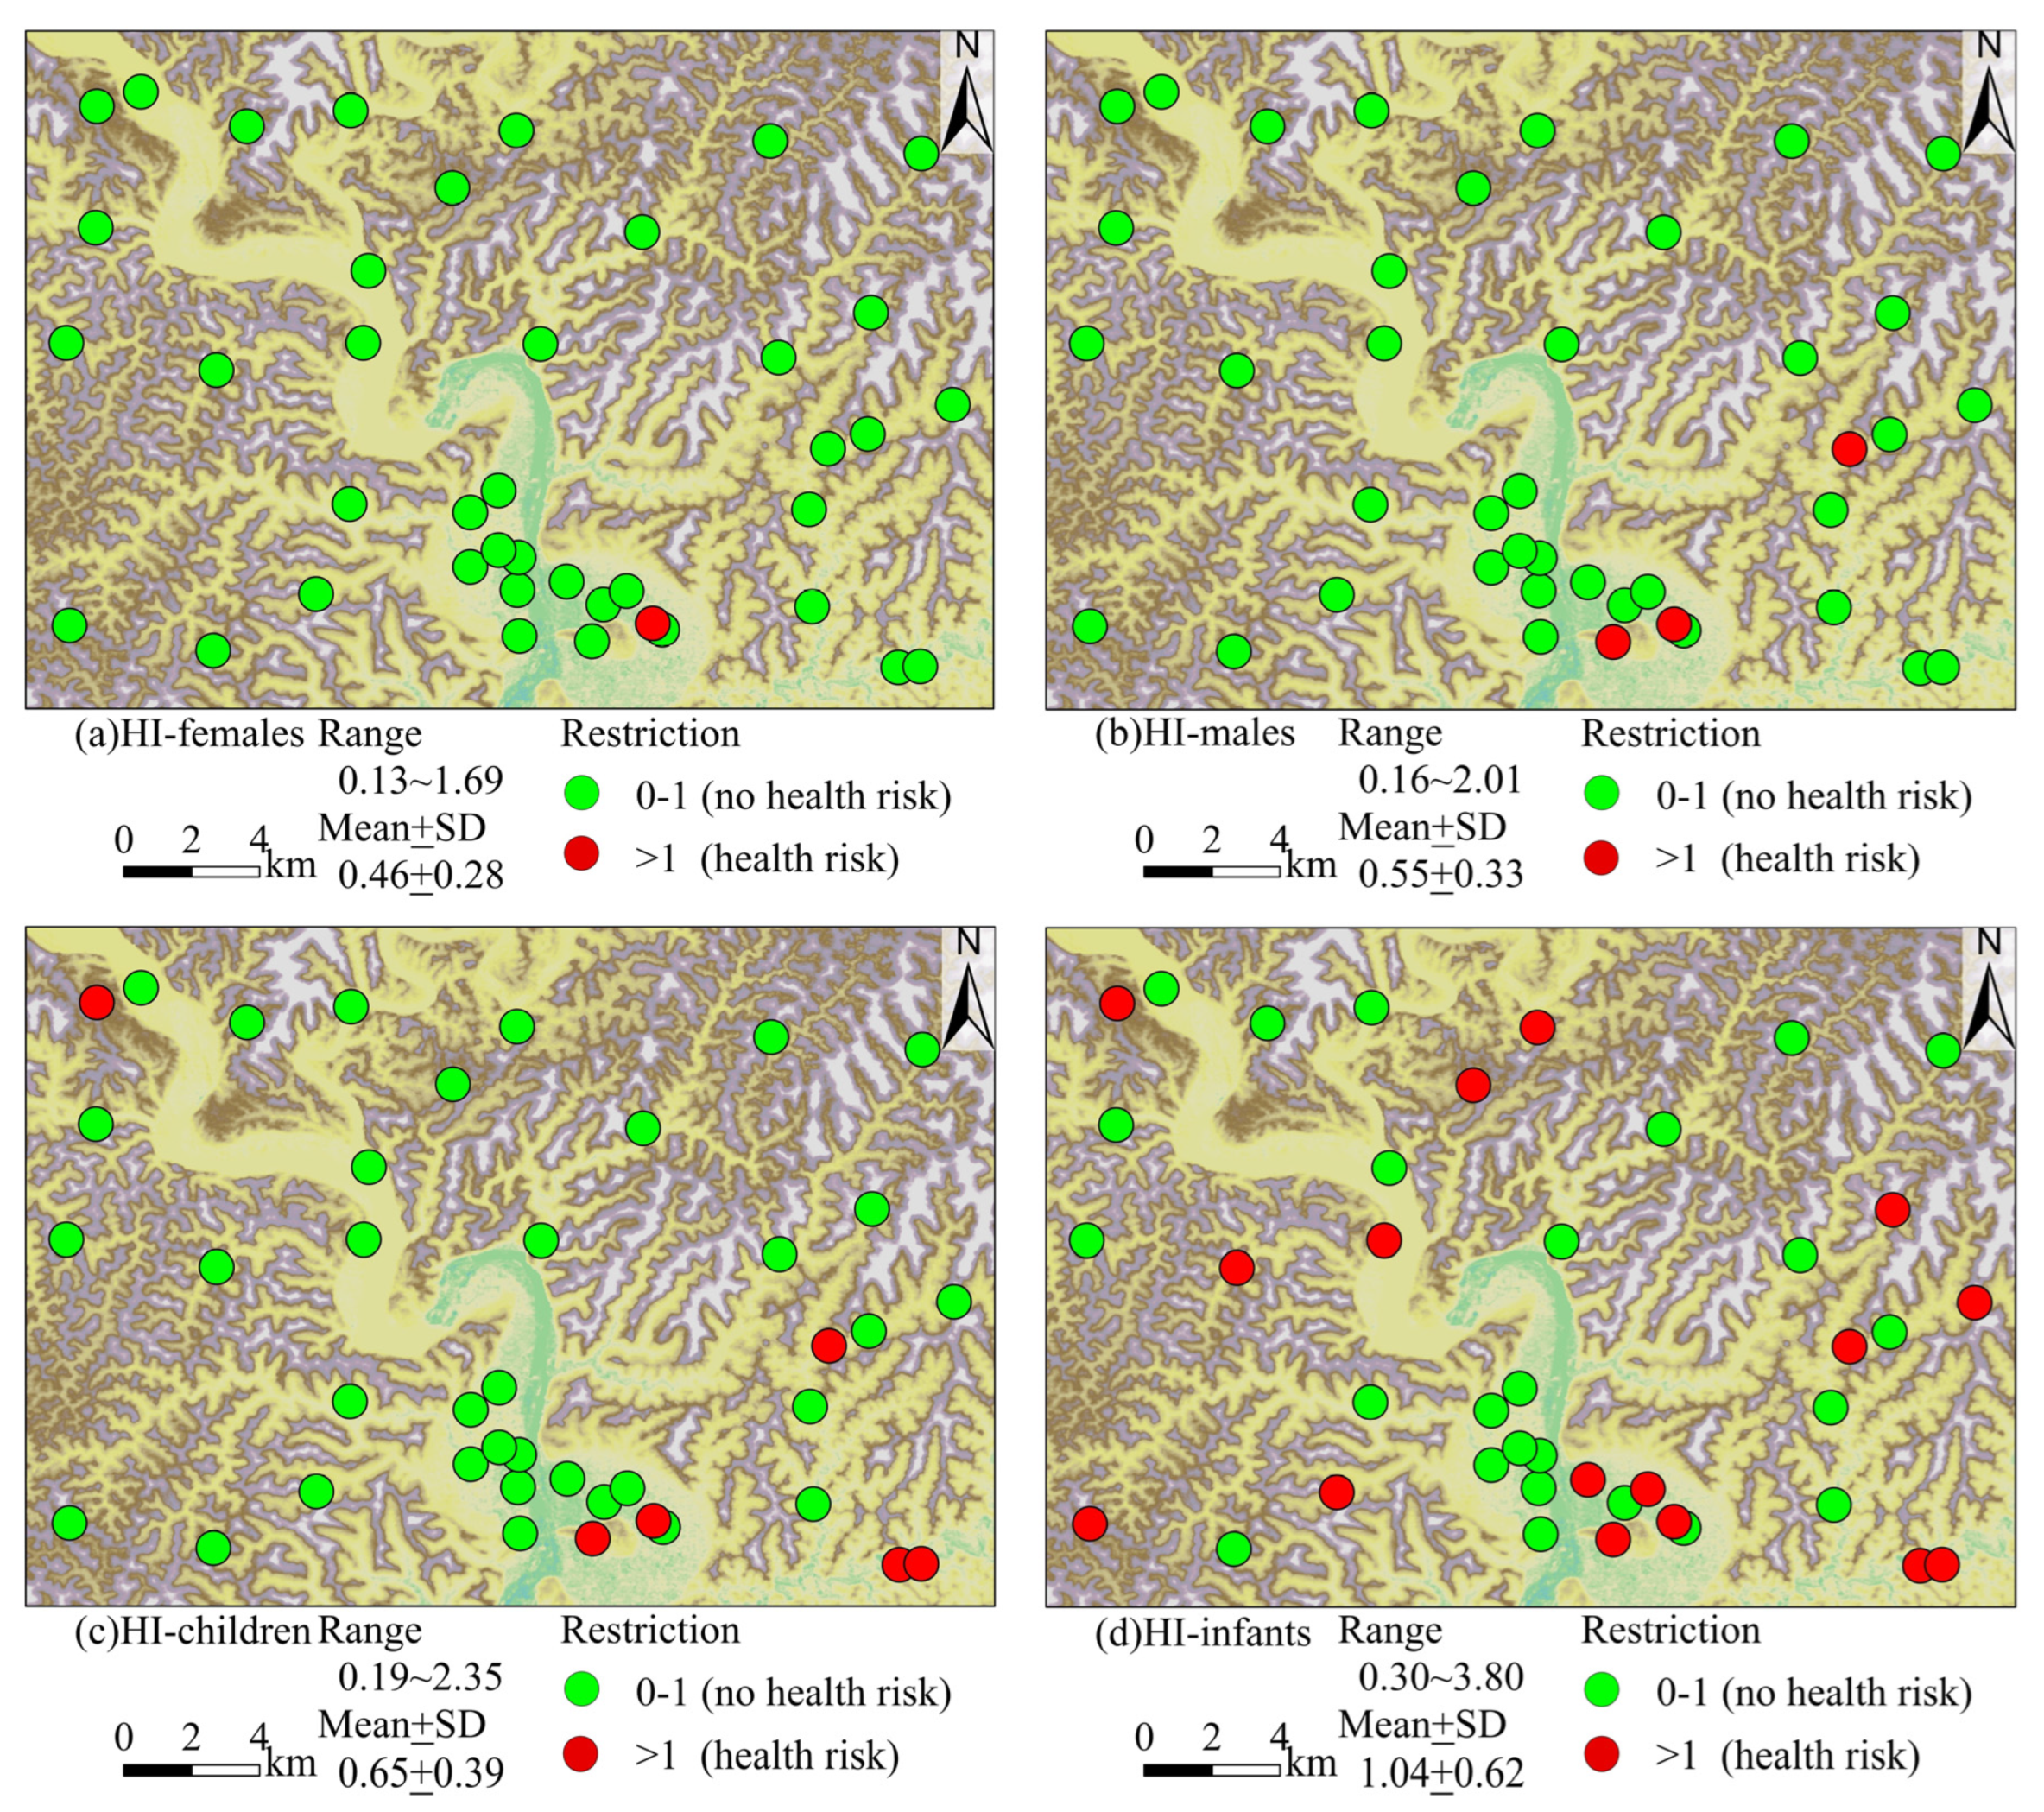
  • Based on the analysis of single irrigation indicators, such as the SAR, Na%, RSC, and PI, it can be concluded that most of the groundwater in the study area is suitable for irrigation purposes. The results of the IWQI study indicate that almost 50% of the groundwater in the area is classified as low to unrestricted when used for irrigation. The EWQI results suggest that except for one groundwater sample, all samples are suitable for drinking water. Additionally, the study found that the groundwater quality for both drinking and irrigation purposes follows a similar trend, decreasing from the northwest to the southeast of the study area. The utilization of groundwater resources should be noticed in the southeastern part.
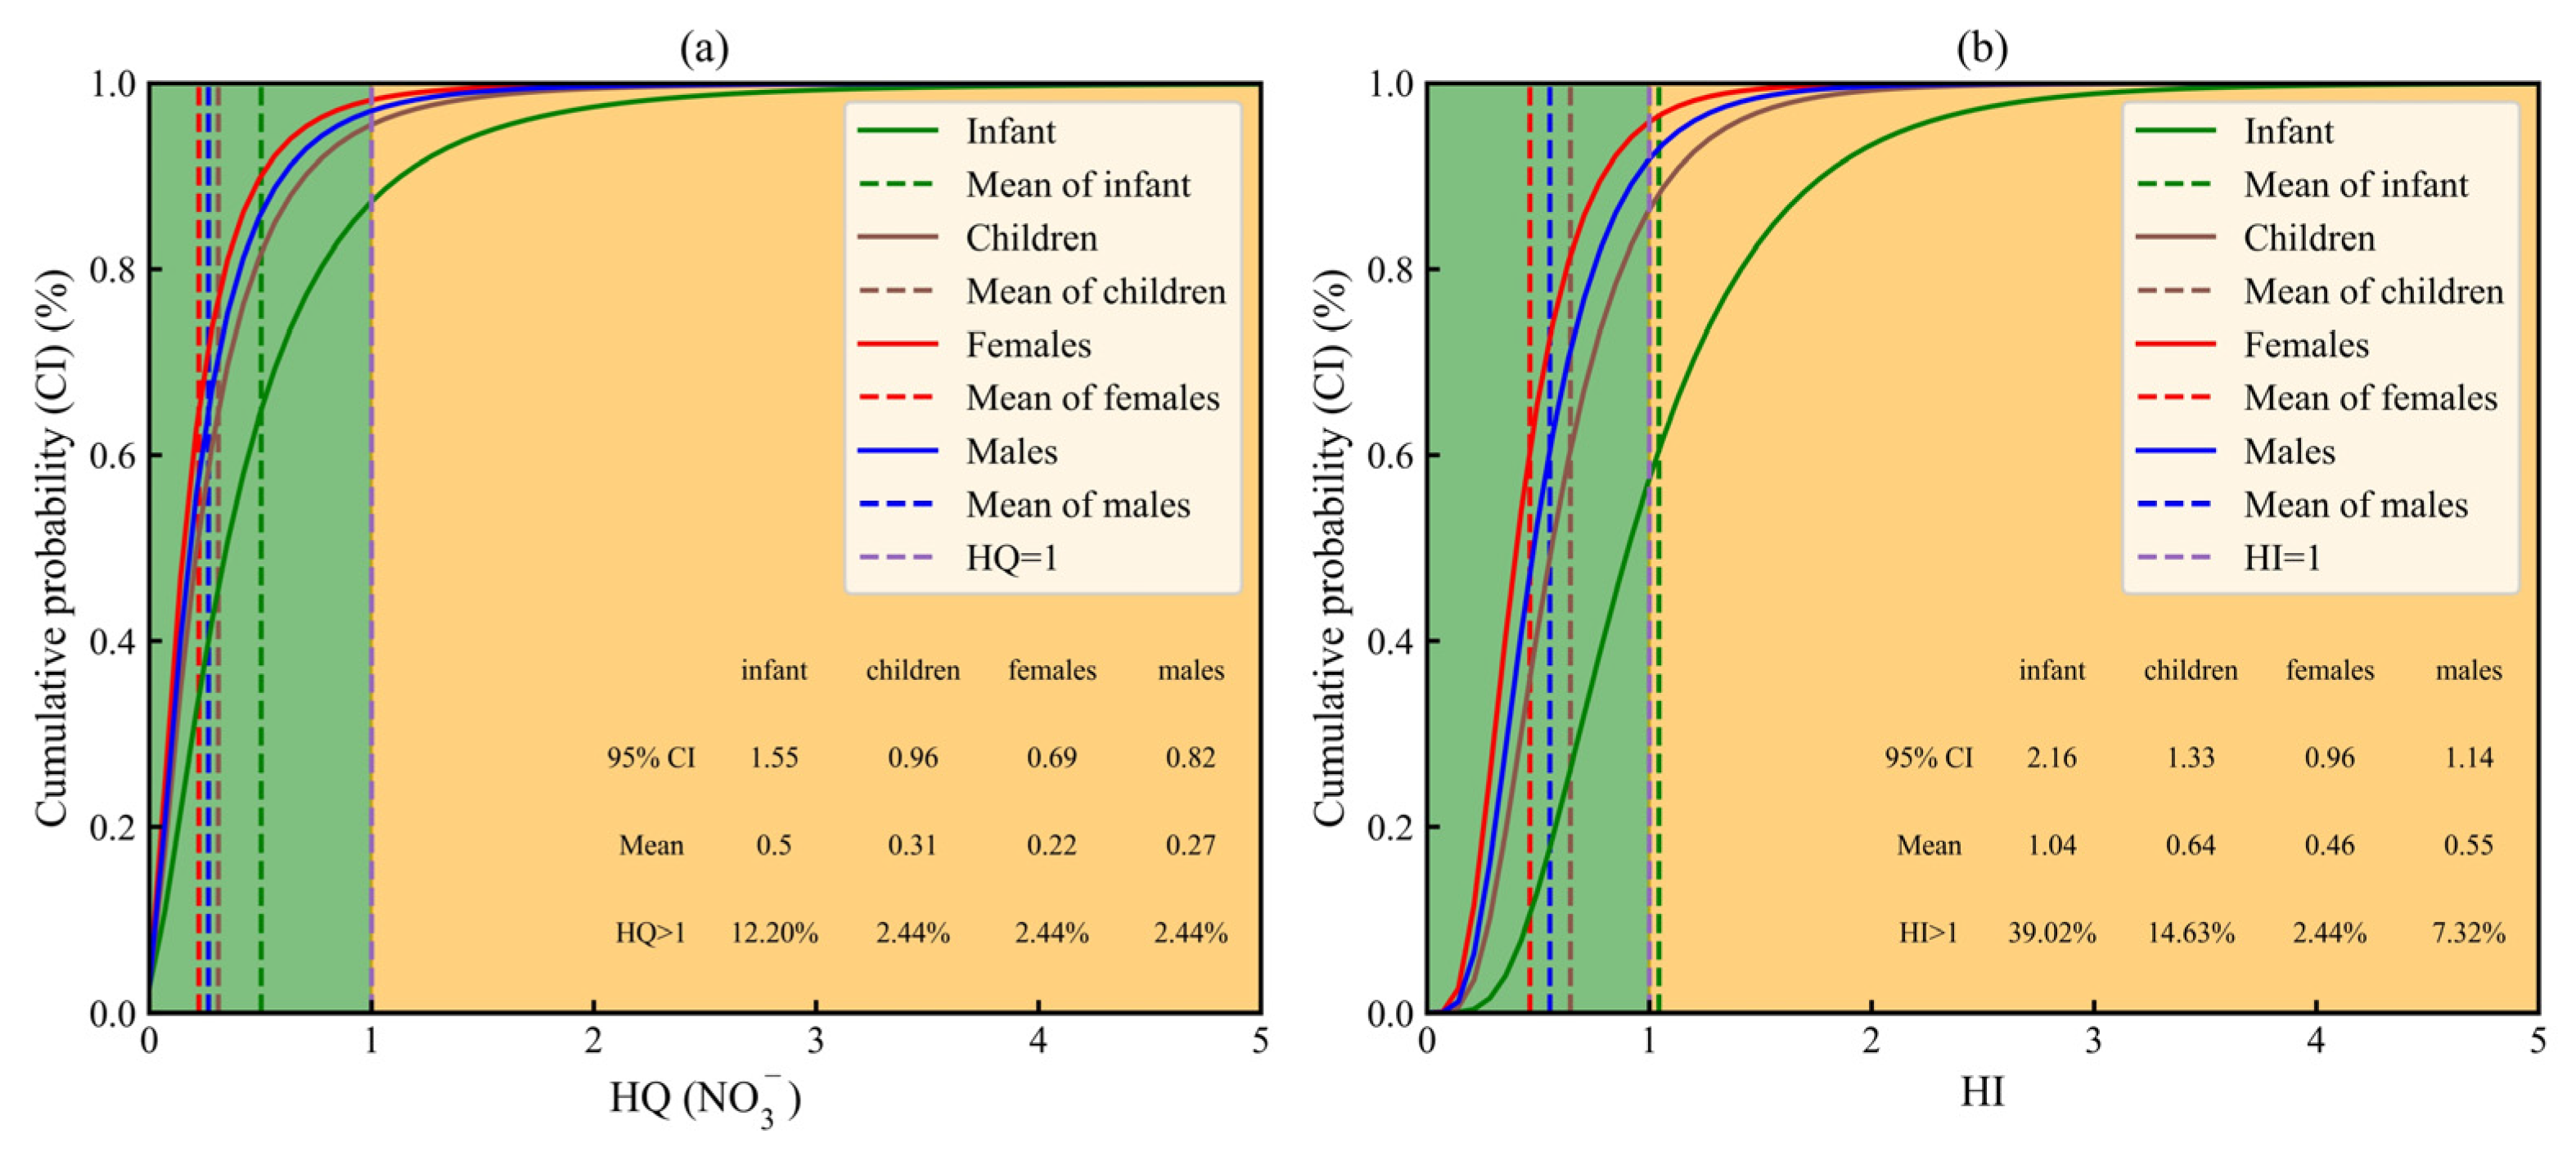
  • According to the health risk analysis, the risk level for infants is higher than that for children, adult males, and females. To reduce health risks for different groups of people, it is recommended to implement differentiated water supply and targeted water treatment, especially giving more attention to infants.

Author Contributions

Y.W.; writing—original draft preparation, methodology, software, R.L.; data curation, software, X.W.; formal analysis, validation, Y.Y.; data curation, C.W.; funding acquisition, M.L.; investigation, Y.X.; validation, Y.Z.; writing—review and editing, funding acquisition. All authors have read and agreed to the published version of the manuscript.

Funding

This research was funded by Scientific project of Yibin City (SWJTU2021020008).

Data Availability Statement

The data presented in this study are available on request from the corresponding author.

Acknowledgments

We thank two anonymous reviewers for their constructive suggestions which improved our manuscript.

Conflicts of Interest

The authors declare no conflict of interest.

References

  1. Abbasnia, A.; Yousefi, N.; Mahvi, A.H.; Nabizadeh, R.; Radfard, M.; Yousefi, M.; Alimohammadi, M. Evaluation of Groundwater Quality Using Water Quality Index and Its Suitability for Assessing Water for Drinking and Irrigation Purposes: Case Study of Sistan and Baluchistan Province (Iran). Hum. Ecol. Risk Assess. Int. J. 2018, 25, 988–1005. [Google Scholar] [CrossRef]
  2. Nyakundi, R.; Nyadawa, M.; Mwangi, J. Effect of Recharge and Abstraction on Groundwater Levels. Civ. Eng. J. 2022, 8, 910–925. [Google Scholar] [CrossRef]
  3. Chomba, I.C.; Banda, K.E.; Winsemius, H.C.; Eunice, M.; Sichingabula, H.M.; Nyambe, I.A. Integrated Hydrologic-Hydrodynamic Inundation Modeling in a Groundwater Dependent Tropical Floodplain. J. Hum. Earth Future 2022, 3, 237–246. [Google Scholar] [CrossRef]
  4. Basack, S.; Goswami, G.; Khabbaz, H.; Karakouzian, M. Flow Characteristics through Granular Soil Influenced by Saline Water Intrusion: A Laboratory Investigation. Civ. Eng. J. 2022, 8, 863–878. [Google Scholar] [CrossRef]
  5. Mukherjee, I.; Singh, U.K. Groundwater Fluoride Contamination, Probable Release, and Containment Mechanisms: A Review on Indian Context. Environ. Geochem. Health 2018, 40, 2259–2301. [Google Scholar] [CrossRef]
  6. Al-Mussawi, W. Assessment of Groundwater Quality in UMM ER Radhuma Aquifer (Iraqi Western Desert) by Integration Between Irrigation Water Quality Index and GIS. J. Babylon Univ. Eng. Sci. 2014, 22, 201–217. [Google Scholar]
  7. Pandey, K.; Kumar, S.; Malik, A.; Kuriqi, A. Artificial Neural Network Optimized with a Genetic Algorithm for Seasonal Groundwater Table Depth Prediction in Uttar Pradesh, India. Sustainability 2020, 12, 8932. [Google Scholar] [CrossRef]
  8. Ahmed, I.; Tariq, N.; Al Muhery, A. Hydrochemical Characterization of Groundwater to Align with Sustainable Development Goals in the Emirate of Dubai, UAE. Environ. Earth Sci. 2019, 78, 44. [Google Scholar] [CrossRef]
  9. Jwa, B.; Yza, B.; Hui, Z. Groundwater Chemistry and Groundwater Quality Index Incorporating Health Risk Weighting in Dingbian County, Ordos Basin of Northwest China. Geochemistry 2020, 80, 125607. [Google Scholar] [CrossRef]
  10. Mohammadi, A.; Ebrahimi, A.A.; Ghanbari, R.; Faraji, M.; Nemati, S.; Abdolahnejad, A. Data on THMs Concentration and Spatial Trend in Water Distribution Network (a Preliminary Study in Center of Iran). MethodsX 2019, 6, 760–763. [Google Scholar] [CrossRef]
  11. Siddiqi, S.A.; Al-Mamun, A.; Baawain, M.S.; Sana, A. Groundwater Contamination in the Gulf Cooperation Council (GCC) Countries: A Review. Environ. Sci. Pollut. Res. 2021, 28, 21023–21044. [Google Scholar] [CrossRef]
  12. Alexakis, D.E.; Kiskira, K.; Gamvroula, D.; Emmanouil, C.; Psomopoulos, C.S. Evaluating Toxic Element Contamination Sources in Groundwater Bodies of Two Mediterranean Sites. Environ. Sci. Pollut. Res. 2021, 28, 34400–34409. [Google Scholar] [CrossRef]
  13. Kafilat Adebola, B.-A.; Joseph Kayode, S.; Adebayo Akeem, O. Integrated Assessment of the Heavy Metal Pollution Status and Potential Ecological Risk in the Lagos Lagoon, South West, Nigeria. Hum. Ecol. Risk Assess. Int. J. 2018, 24, 377–397. [Google Scholar] [CrossRef]
  14. Mukherjee, I.; Singh, U.K. Assessment of Fluoride Contaminated Groundwater on Food Crops and Vegetables in Birbhum District of West Bengal, India. In Advance Technologies in Agriculture for Doubling Farmer’s Income; New Delhi Publishers: New Delhi, India, 2018; pp. 225–235. ISBN 978-93-86453-61-7. [Google Scholar]
  15. Adimalla, N.; Qian, H. Groundwater Quality Evaluation Using Water Quality Index (WQI) for Drinking Purposes and Human Health Risk (HHR) Assessment in an Agricultural Region of Nanganur, South India. Ecotoxicol. Environ. Saf. 2019, 176, 153–161. [Google Scholar] [CrossRef]
  16. Yousefi, M.; Ghoochani, M.; Hossein Mahvi, A. Health Risk Assessment to Fluoride in Drinking Water of Rural Residents Living in the Poldasht City, Northwest of Iran. Ecotoxicol. Environ. Saf. 2018, 148, 426–430. [Google Scholar] [CrossRef]
  17. Liu, Y.; Hu, G.; Cao, L.; Wang, X.; Chen, M.-H. A Comparison of Monte Carlo Methods for Computing Marginal Likelihoods of Item Response Theory Models. J. Korean Stat. Soc. 2019, 48, 503–512. [Google Scholar] [CrossRef]
  18. Rahmati, O.; Pourghasemi, H.R.; Melesse, A.M. Application of GIS-Based Data Driven Random Forest and Maximum Entropy Models for Groundwater Potential Mapping: A Case Study at Mehran Region, Iran. Catena 2016, 137, 360–372. [Google Scholar] [CrossRef]
  19. Arumugam, K.; Elangovan, K. Hydrochemical Characteristics and Groundwater Quality Assessment in Tirupur Region, Coimbatore District, Tamil Nadu, India. Environ. Geol. 2009, 58, 1509–1520. [Google Scholar] [CrossRef]
  20. Kopittke, P.M.; So, H.B.; Menzies, N.W. Effect of Ionic Strength and Clay Mineralogy on Na–Ca Exchange and the SAR–ESP Relationship. Eur. J. Soil Sci. 2006, 57, 626–633. [Google Scholar] [CrossRef]
  21. Saleh, A.; Al-Ruwaih, F.; Shehata, M. Hydrogeochemical Processes Operating within the Main Aquifers of Kuwait. J. Arid Environ. 1999, 42, 195–209. [Google Scholar] [CrossRef]
  22. Wang, L.; Long, F.; Liao, W.; Liu, H. Prediction of Anaerobic Digestion Performance and Identification of Critical Operational Parameters Using Machine Learning Algorithms. Bioresour. Technol. 2020, 298, 122495. [Google Scholar] [CrossRef]
  23. Paliwal, K.V.; Heine, R.W. Irrigation with Saline Water. Q. Rev. Biol. 1972, 4, 198. [Google Scholar] [CrossRef]
  24. Spandana, M.P.; Suresh, K.R.; Prathima, B. Developing an irrigation water quality index for vrishabavathi command area. Int. J. Eng. Res. Technol. 2013, 2, 821–830. [Google Scholar]
  25. Meireles, A.C.M.; de Andrade, E.M.; Chaves, L.C.G.; Frischkorn, H.; Crisostomo, L.A. A New Proposal of the Classification of Irrigation Water. Rev. Ciênc. Agron. 2010, 41, 349–357. [Google Scholar] [CrossRef] [Green Version]
  26. Xiao, Y.; Xiao, D.; Hao, Q.; Liu, K.; Wang, R.; Huang, X.; Liao, X.; Zhang, Y. Accessible Phreatic Groundwater Resources in the Central Shijiazhuang of North China Plain: Perspective From the Hydrogeochemical Constraints. Front. Environ. Sci. 2021, 9, 475. [Google Scholar] [CrossRef]
  27. Zhang, Y.; Dai, Y.; Wang, Y.; Huang, X.; Xiao, Y.; Pei, Q. Hydrochemistry, Quality and Potential Health Risk Appraisal of Nitrate Enriched Groundwater in the Nanchong Area, Southwestern China. Sci. Total Environ. 2021, 784, 147186. [Google Scholar] [CrossRef] [PubMed]
  28. Zhang, Q.; Wang, H.; Wang, L. Tracing Nitrate Pollution Sources and Transformations in the Over-Exploited Groundwater Region of North China Using Stable Isotopes. J. Contam. Hydrol. 2018, 218, 1–9. [Google Scholar] [CrossRef] [PubMed]
  29. Yao, R.; Yan, Y.; Wei, C.; Luo, M.; Xiao, Y.; Zhang, Y. Hydrochemical Characteristics and Groundwater Quality Assessment Using an Integrated Approach of the PCA, SOM, and Fuzzy c-Means Clustering: A Case Study in the Northern Sichuan Basin. Front. Environ. Sci. 2022, 10, 907872. [Google Scholar] [CrossRef]
  30. Zhang, Y.; He, Z.; Tian, H.; Huang, X.; Zhang, Z.; Liu, Y.; Xiao, Y.; Li, R. Hydrochemistry Appraisal, Quality Assessment and Health Risk Evaluation of Shallow Groundwater in the Mianyang Area of Sichuan Basin, Southwestern China. Environ. Earth Sci. 2021, 80, 576. [Google Scholar] [CrossRef]
  31. Zhang, T.; Chen, X.; Jiang, Z.; Lan, G. Characteristics and influencing factors of groundwater in the red layer area of Sichuan basin—A case study of Nanchong city. Acta Geol. Sichuan 2005, 2, 97–100. (In Chinese) [Google Scholar]
  32. Feng, W.; Fang, H.; Li, Y.; Bai, H. Hydrochemical Characteristics and Water Quality Evaluation of Shallow Groundwater in Red-Layer Area. Water Power 2020, 46, 12–16+84. (In Chinese) [Google Scholar]
  33. Shi, Z. Environmental Problems of Water Resources and Sustainable Development Management in Sichuan. Guangdong Sci. Technol. 2014, 23, 90–91. (In Chinese) [Google Scholar]
  34. He, X.; Long, X. Current Situation and Countermeasures of Agricultural Non-point Source Pollution in Suining City. Sichuan Agric. Sci. Technol. 2021, 4, 81–83. (In Chinese) [Google Scholar]
  35. Luo, S.; Ceng, F.; Yang, H. Analysis and reflection on the current situation of the construction of comprehensive agricultural development projects in Shehong County. Sichuan Agric. Sci. Technol. 2014, 7, 52–53. (In Chinese) [Google Scholar]
  36. Ceng, S.; Xu, M.; Luo, M.; Yang, Y.; Huang, S. Analysis of hydrochemical characteristics and main ion sources of red-bed groundwater in Suining area, central Sichuan. Resour. Environ. Yangtze Basin 2020, 29, 220–231. (In Chinese) [Google Scholar]
  37. Ni, J.; Yang, C.; Wu, Y. Evaluation Research on the Forestland Quality Rank of Shehong County Based on GIS. J. Sichuan For. Sci. Technol. 2014, 35, 57–61. (In Chinese) [Google Scholar] [CrossRef]
  38. Zhou, S.; Tang, F. Practice and Research on Water Pollution Control of Mingyue River in Suining City, Sichuan Province. China Flood Drought Manag. 2017, 27, 88–89+96. (In Chinese) [Google Scholar] [CrossRef]
  39. Deutsch, W.J. Groundwater Geochemistry: Fundamentals and Applications to Contamination; Lewis Publishers: Boca Raton, FL, USA, 1997. [Google Scholar]
  40. Li, P.; Tian, R.; Liu, R. Solute Geochemistry and Multivariate Analysis of Water Quality in the Guohua Phosphorite Mine, Guizhou Province, China. Expo. Health 2019, 11, 81–94. [Google Scholar] [CrossRef]
  41. Wu, J.; Li, P.; Qian, H.; Duan, Z.; Zhang, X. Using Correlation and Multivariate Statistical Analysis to Identify Hydrogeochemical Processes Affecting the Major Ion Chemistry of Waters: A Case Study in Laoheba Phosphorite Mine in Sichuan, China. Arab. J. Geosci 2014, 7, 3973–3982. [Google Scholar] [CrossRef]
  42. Wu, J.; Li, P.; Wang, D.; Ren, X.; Wei, M. Statistical and Multivariate Statistical Techniques to Trace the Sources and Affecting Factors of Groundwater Pollution in a Rapidly Growing City on the Chinese Loess Plateau. Hum. Ecol. Risk Assess. Int. J. 2020, 26, 1603–1621. [Google Scholar] [CrossRef]
  43. Sudheer Kumar, M.; Dhakate, R.; Yadagiri, G.; Srinivasa Reddy, K. Principal Component and Multivariate Statistical Approach for Evaluation of Hydrochemical Characterization of Fluoride-Rich Groundwater of Shaslar Vagu Watershed, Nalgonda District, India. Arab. J. Geosci. 2017, 10, 83. [Google Scholar] [CrossRef]
  44. Zhang, X.; Guo, Q.; Liu, M.; Luo, J.; Yin, Z.; Zhang, C.; Zhu, M.; Guo, W.; Li, J.; Zhou, C. Hydrogeochemical Processes Occurring in the Hydrothermal Systems of the Gonghe–Guide Basin, Northwestern China: Critical Insights from a Principal Components Analysis (PCA). Environ. Earth Sci. 2016, 75, 1187. [Google Scholar] [CrossRef]
  45. Kaiser, H.F. The Varimax Criterion for Analytic Rotation in Factor Analysis. Educ. Psychol. Meas. 1958, 23, 770–773. [Google Scholar] [CrossRef]
  46. Bahrami, M.; Zarei, A.R.; Rostami, F. Temporal and Spatial Assessment of Groundwater Contamination with Nitrate by Nitrate Pollution Index (NPI) and GIS (Case Study: Fasarud Plain, Southern Iran). Environ. Geochem. Health 2020, 42, 3119–3130. [Google Scholar] [CrossRef]
  47. Spalding, R.F.; Exner, M.E. Occurrence of Nitrate in Groundwater—A Review. J. Environ. Qual. 1993, 22, 392–402. [Google Scholar] [CrossRef]
  48. El Mountassir, O.; Bahir, M.; Ouazar, D.; Chehbouni, A.; Carreira, P.M. Temporal and Spatial Assessment of Groundwater Contamination with Nitrate Using Nitrate Pollution Index (NPI), Groundwater Pollution Index (GPI), and GIS (Case Study: Essaouira Basin, Morocco). Environ. Sci. Pollut. Res. 2022, 29, 17132–17149. [Google Scholar] [CrossRef]
  49. Todd, D.K.; Mays, L.W. Groundwater Hydrology, 2nd ed.; John Wiley & Sons: Hoboken, NJ, USA, 1980. [Google Scholar]
  50. Eaton; Frank, M. Significance of Carbonates in Irrigation Waters. Soil Sci. 1950, 69, 123–134. [Google Scholar] [CrossRef]
  51. Osta, M.E.; Masoud, M.; Alqarawy, A.; Elsayed, S.; Gad, M. Groundwater Suitability for Drinking and Irrigation Using Water Quality Indices and Multivariate Modeling in Makkah Al-Mukarramah Province, Saudi Arabia. Water 2022, 14, 483. [Google Scholar] [CrossRef]
  52. Ayers, R.S.; Westcot, D.W. The Water Quality in Agriculture, 2nd ed.; Campina Grande: UFPB. (Studies FAO Irrigation and drainage, 29); Food and Agriculture Organization: Rome, Italy, 1999. [Google Scholar]
  53. Luo, Y.; Xiao, Y.; Hao, Q.; Zhang, Y.; Dong, G. Groundwater Geochemical Signatures and Implication for Sustainable Development in a Typical Endorheic Watershed on Tibetan Plateau. Environ. Sci. Pollut. Res. 2021, 28, 48312–48329. [Google Scholar] [CrossRef] [PubMed]
  54. Means, B. Risk-Assessment Guidance for Superfund. Volume 1. Human Health Evaluation Manual. Part A. Interim Report (Final); Environmental Protection Agency: Washington, DC, USA, 1989.
  55. He, X.; Wu, J.; He, S. Hydrochemical Characteristics and Quality Evaluation of Groundwater in Terms of Health Risks in Luohe Aquifer in Wuqi County of the Chinese Loess Plateau, Northwest China. Hum. Ecol. Risk Assess. Int. J. 2019, 25, 32–51. [Google Scholar] [CrossRef]
  56. Bawa-Allah, K.A. Assessment of Heavy Metal Pollution in Nigerian Surface Freshwaters and Sediment: A Meta-Analysis Using Ecological and Human Health Risk Indices. J. Contam. Hydrol. 2023, 256, 104199. [Google Scholar] [CrossRef] [PubMed]
  57. Alexakis, D. Human Health Risk Assessment Associated with Co, Cr, Mn, Ni and V Contents in Agricultural Soils from a Mediterranean Site. Arch. Agron. Soil Sci. 2016, 62, 359–373. [Google Scholar] [CrossRef]
  58. World Health Organization. Guidelines for Drinking-Water Quality, 4th ed.; World Health Organisation: Geneva, Switzerland, 2011. [Google Scholar]
  59. GB/T 14848–2017; Gaqs. Standards for Groundwater Quality. General Administration of Quality Supervision: Beijing, China, 2017. (In Chinese)
  60. Piper, A. A Graphic Procedure in the Geochemical Interpretation of Water-Analyses. Eos Trans. Am. Geophys. Union 1944, 25, 914–923. [Google Scholar] [CrossRef]
  61. Mukherjee, I.; Singh, U.K.; Chakma, S. Evaluation of Groundwater Quality for Irrigation Water Supply Using Multi-Criteria Decision-Making Techniques and GIS in an Agroeconomic Tract of Lower Ganga Basin, India. J. Environ. Manage. 2022, 309, 114691. [Google Scholar] [CrossRef]
  62. Abbasnia, A.; Radfard, M.; Mahvi, A.H.; Nabizadeh, R.; Yousefi, M.; Soleimani, H.; Alimohammadi, M. Groundwater Quality Assessment for Irrigation Purposes Based on Irrigation Water Quality Index and Its Zoning with GIS in the Villages of Chabahar, Sistan and Baluchistan, Iran. Data Brief 2018, 19, 623–631. [Google Scholar] [CrossRef]
  63. Feth, J.H.; Gibbs, R.J. Mechanisms Controlling World Water Chemistry: Evaporation-Crystallization Process. Science 1971, 172, 870–872. [Google Scholar] [CrossRef] [Green Version]
  64. Ren, X.; Li, P.; He, X.; Su, F.; Elumalai, V. Hydrogeochemical Processes Affecting Groundwater Chemistry in the Central Part of the Guanzhong Basin, China. Arch. Environ. Contam. Toxicol. 2021, 80, 74–91. [Google Scholar] [CrossRef]
  65. Nesco, U. Groundwater studies. An international guide for research and practice. In Geochemistry of Groundwater; UNESCO: Paris, France, 1977. [Google Scholar]
  66. Adimalla, N. Application of the Entropy Weighted Water Quality Index (EWQI) and the Pollution Index of Groundwater (PIG) to Assess Groundwater Quality for Drinking Purposes: A Case Study in a Rural Area of Telangana State, India. Arch. Environ. Contam. Toxicol. 2021, 80, 31–40. [Google Scholar] [CrossRef]
  67. Adimalla, N.; Qian, H. Groundwater Chemistry, Distribution and Potential Health Risk Appraisal of Nitrate Enriched Groundwater: A Case Study from the Semi-Urban Region of South India. Ecotoxicol. Environ. Saf. 2021, 207, 111277. [Google Scholar] [CrossRef]
  68. Zhou, Y.; Li, P.; Xue, L.; Dong, Z.; Li, D. Solute Geochemistry and Groundwater Quality for Drinking and Irrigation Purposes: A Case Study in Xinle City, North China. Geochemistry 2020, 80, 125609. [Google Scholar] [CrossRef]
  69. Reeve, R.C.; Pillsbury, A.F.; Wilcox, L.V. Reclamation of a Saline and High Boron Soil in the Coachella Valley of California. Hilgardia 1955, 24, 4. [Google Scholar] [CrossRef] [Green Version]
  70. Richards, L.A. Diagnosis and Improvement of Saline and Alkali Soils. Soil Sci. 1954, 64, 290. [Google Scholar] [CrossRef]
  71. Bastiaanssen, W.; Loehr, R.A.; Ayers, C.R.; Westcot, D.W.; Barriuso, E.; Calvet, R.; Schiavon, M.; Soulas, G.; Gates, D.; Carvalho, D. Methods of Chemical Analysis of Water and Wastes; CRC Press: Boca Raton, FL, USA, 1999. [Google Scholar]
  72. Shu, L.; Zhang, Z.; Lv, J. Ecological environment monitoring and water quality pollution status evaluation of Suining section of Fujiang River Basin. Sichuan Environ. 2013, 32, 49–53. (In Chinese) [Google Scholar] [CrossRef]
  73. Amiri, V.; Rezaei, M.; Sohrabi, N. Groundwater Quality Assessment Using Entropy Weighted Water Quality Index (EWQI) in Lenjanat, Iran. Environ. Earth Sci. 2014, 72, 3479–3490. [Google Scholar] [CrossRef]
  74. Xiao, Y.; Liu, K.; Hao, Q.; Xiao, D.; Zhu, Y.; Yin, S.; Zhang, Y. Hydrogeochemical Insights into the Signatures, Genesis and Sustainable Perspective of Nitrate Enriched Groundwater in the Piedmont of Hutuo Watershed, China. Catena 2022, 212, 106020. [Google Scholar] [CrossRef]
  75. Ravindra, K.; Mor, S. Distribution and Health Risk Assessment of Arsenic and Selected Heavy Metals in Groundwater of Chandigarh, India. Environ. Pollut. 2019, 250, 820–830. [Google Scholar] [CrossRef] [PubMed]
  76. Naa, B.; Hui, Q.; Pla, B. Entropy Water Quality Index and Probabilistic Health Risk Assessment from Geochemistry of Groundwaters in Hard Rock Terrain of Nanganur County, South India. Geochemistry 2019, 80, 125544. [Google Scholar] [CrossRef]
Figure 1. The flowchart of the workflows in this study.
Water 15 02233 g001
Figure 2. Overview of the study area. (a,b) indicate the relative location of the study area, while (c) provides an overview of the area and displays the distribution of the 41 sampling sites.
Water 15 02233 g002
Figure 3. Distribution and exceedance of each physicochemical parameter in groundwater samples.
Water 15 02233 g003
Figure 4. (a) Durov diagram, (b) Piper trilinear diagram of samples in the study area.
Water 15 02233 g004
Figure 5. Results of principal component analysis. (a) Scree plot; (b) Factor loadings for PC1 and PC2.
Water 15 02233 g005
Figure 6. Hydrogeochemical processes based on Gibbs diagrams for (a) anions and (b) cations.
Water 15 02233 g006
Figure 7. Scatter plots of (a) Cl vs. Na+; (b) SO42− vs. Ca2+; (c) HCO3 vs. Ca2+; (d) HCO3 vs. Mg2+; (e) Mg2+ vs. Ca2+; (f) (HCO3 + SO42−) vs. (Ca2+ + Mg2+); (g) (Ca2+ + Mg2+) − (HCO3 + SO42−) vs. Na+ + K+ − Cl; (h) chloro alkaline indices CAI-I and CAI-II; (i) Saturation index of calcite, dolomite, gypsum, and halite.
Water 15 02233 g007
Figure 8. The different types of land use in the study area and the distribution of samples that have nitrate exceedances. It provides a visual representation of the relationship between land use and nitrate levels in the samples collected.
Water 15 02233 g008
Figure 9. Scatter plots of (a) NO3 versus TDS, and (b) nitrate pollution index versus TDS.
Water 15 02233 g009
Figure 10. Scatter plots of (a) NO3/Na+ varus. Cl/Na+; (b) NO3/Cl varus. Cl; (c) Wilcox diagram (d) USSL diagram.
Water 15 02233 g010
Figure 11. The overall decreasing suitability of groundwater indicators for irrigation from northwest to southeast, and their spatial distribution pattern: (a) IWQI, (b) EC, (c) PI, (d) SAR, (e) Na% and (f) RSC.
Water 15 02233 g011
Figure 12. (a) Scatter plot of irrigation water quality index (IWQI) versus TDS. (b) Spatial distribution of groundwater quality for irrigation purposes based on IWQI.
Water 15 02233 g012
Figure 13. (a) Scatter plot of entropy-weighted water quality index (EWQI) versus TDS. (b) Spatial distribution of groundwater quality for drinking purposes based on EWQI.
Water 15 02233 g013
Figure 14. Cumulative probability distribution curves: (a) Non-carcinogenic health risk of nitrate, HQNitrate; (b) Cumulative non-carcinogenic health risk, HITotal; Vertical dashed lines indicate mean.
Water 15 02233 g014
Figure 15. Spatial distribution of the HI Total of noncarcinogenic risk due to nitrate through drinking water pathway for (a) adult females, (b) adult males, (c) children, and (d) infants in the study area.
Water 15 02233 g015
Table 1. Study area water quality evaluation index classification and results statistics.
IndicesRangeClassificationDistribution%
Electrical
conductivity
(EC)
<250Excellent0.00%
250–750Good36.58%
750–2000Doubtful58.54%
>2000Unsuitable4.88%
Sodium
adsorption ratio (SAR)
<10Excellent100.00%
10–18Good0.00%
18–26Doubtful0.00%
>26Unsuitable0.00%
Residual
sodium carbonate (RSC)
<1.25Good97.56%
1.25–2.5Doubtful2.44%
>2.5Unsuitable0.00%
Permeability
index (PI)
Class I (>75%)Excellent7.32%
Class II (25–75%)Good92.68%
Class III (<25%)Poor0.00%
Irrigation
water quality
index (IWQI)
[85, 100]No restriction 2.44%
[70, 85]Low restriction 39.02%
[55, 70]Moderate restriction 53.66%
[40, 55]High restriction2.44%
[0, 40]Severe restriction2.44%
Nitrate Pollution
Index (NPI)
<0No pollution68.30%
[0, 1]Light pollution21.95%
[1, 2]Moderate pollution7.32%
[2, 3]Significant pollution0.00%
>3Very significant pollution2.44%
Entropy-weighted
Water Quality
index (EWQI)
<50Excellent87.80%
50–100Good9.76%
100–150Medium2.44%
150–200Poor0.00%
>200Extremely poor0.00%
Table 2. Parameter limiting values for quality measurement (qi) calculation.
qiEC (μS/m)SAR (meq/L)0.5rNa+rClrHCO3
85–100[200, 750)[0, 3)[2, 3)[0, 4)[1.0, 1.5)
60–85[750, 1500)[3, 6)[3, 6)[4, 7)[1.5, 4.5)
35–60[1500, 3000)[6, 12)[6, 9)[7, 10)[4.5, 8.5)
0–35EC < 200 or
EC > 3000
SAR ≥ 12rNa+ < 2 or rNa+ ≥ 9rCl ≥ 10rHCO3 < 1 or rHCO3 ≥ 8.5
Note: EC unit is μS/m, SAR unit is (meq/L)0.5, and other units are meq/L.
Table 3. Statistical analysis of hydro-chemical parameters of groundwater samples (units of all parameters are mg/L, except pH).
ParametersMaxMinMeanSDCVLimit% of SEL
pH8.107.207.640.223.00%6.5–8.5 *0.00
TDS1636.00316.00617.47272.8044.00%1000.00 *4.88
TH887.63208.94435.96134.2931.00%450.00 *29.27
K+44.470.625.098.64170%--
Na+219.347.3141.3844.88108%200.00 *7.32
Ca2+272.8340.28132.0846.5735%200.00 *9.76
Mg2+50.109.7524.598.8436%150.00 *0.00
Cl351.503.0554.6972.50133%250.00 *4.88
SO42−449.4023.8396.5289.6693%250.00 *7.32
HCO3644.86144.29400.6887.8722%--
NO349.700.028.578.90104%10.00 **31.71
F0.800.120.350.1440%1.00 *0.00
Note: SD, standard deviation; CV (%), coefficient of variation; % of SEL.% of samples exceeding acceptable limit; * WHO guideline; ** Chinese guideline.
Table 4. Factor loading matrix and EWQI weights for each parameter of PCA.
ParametersPC1PC2PC3PC4CommunalityWi
EC0.9210.021−0.099−0.2050.9000.204
pH−0.3720.181−0.4490.6510.796-
Ca2+0.833−0.1360.281−0.2230.842-
Mg2+0.4810.4560.3170.2970.628-
Na+0.9070.109−0.2890.1910.9540.215
K+0.305−0.3240.3380.3250.418-
HCO30.629−0.1120.5770.3210.8430.178
SO42−0.856−0.162−0.187−0.2600.861-
Cl0.9320.065−0.1760.0240.9040.205
NO30.0470.745−0.098−0.4150.740-
F−0.0620.7490.3890.0910.725-
SAR0.7660.133−0.4090.2940.8580.198
Eigenvalue5.4171.5541.3151.184--
Cumulative45.14458.09269.04678.911-1
Table 5. Statistics of health risks assessment results through drinking water intake.
ClassificationPopulationMaxMinMeanSD
HQNitrateInfants2.91 0.00 0.42 0.49
Children1.80 0.00 0.26 0.31
Females1.29 0.00 0.18 0.22
Males1.54 0.00 0.22 0.26
HITotalInfants3.80 0.30 0.94 0.60
Children2.35 0.18 0.58 0.37
Females1.69 0.13 0.42 0.27
Males2.01 0.16 0.50 0.32
Note: SD standard deviation.
Disclaimer/Publisher’s Note: The statements, opinions and data contained in all publications are solely those of the individual author(s) and contributor(s) and not of MDPI and/or the editor(s). MDPI and/or the editor(s) disclaim responsibility for any injury to people or property resulting from any ideas, methods, instructions or products referred to in the content.

