

Integrated Management and Environmental Impact Assessment of Sustainable Groundwater-Dependent Development in Toshka District, Egypt

 ,
,  and
and
Abstract
:1. Introduction
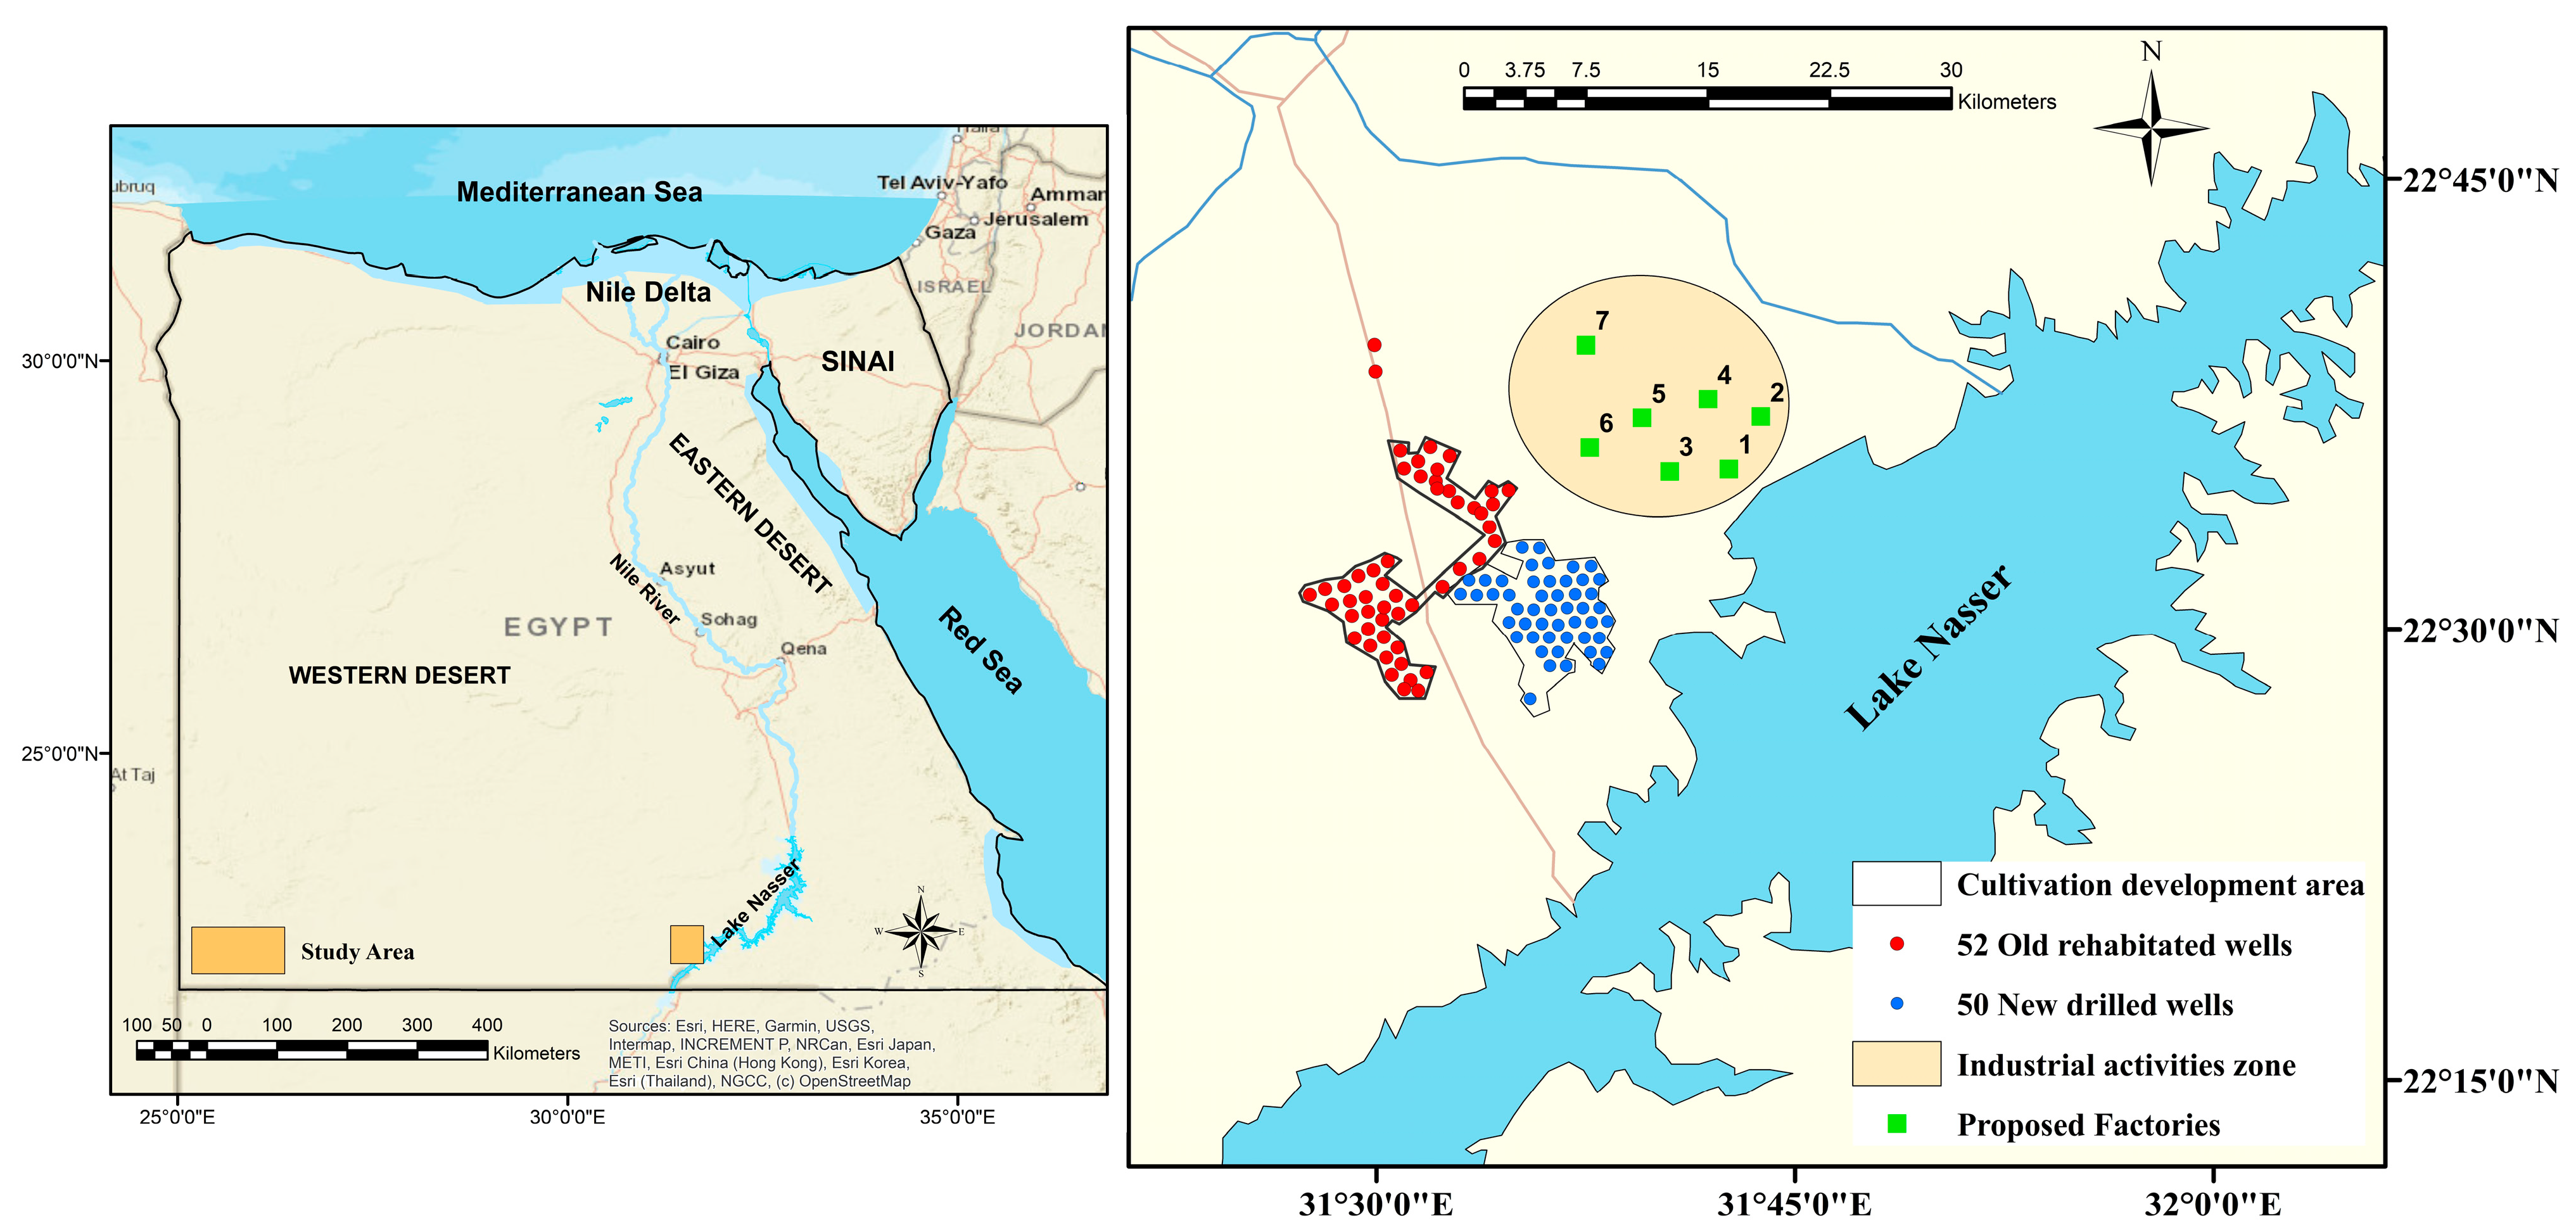
2. Study Area
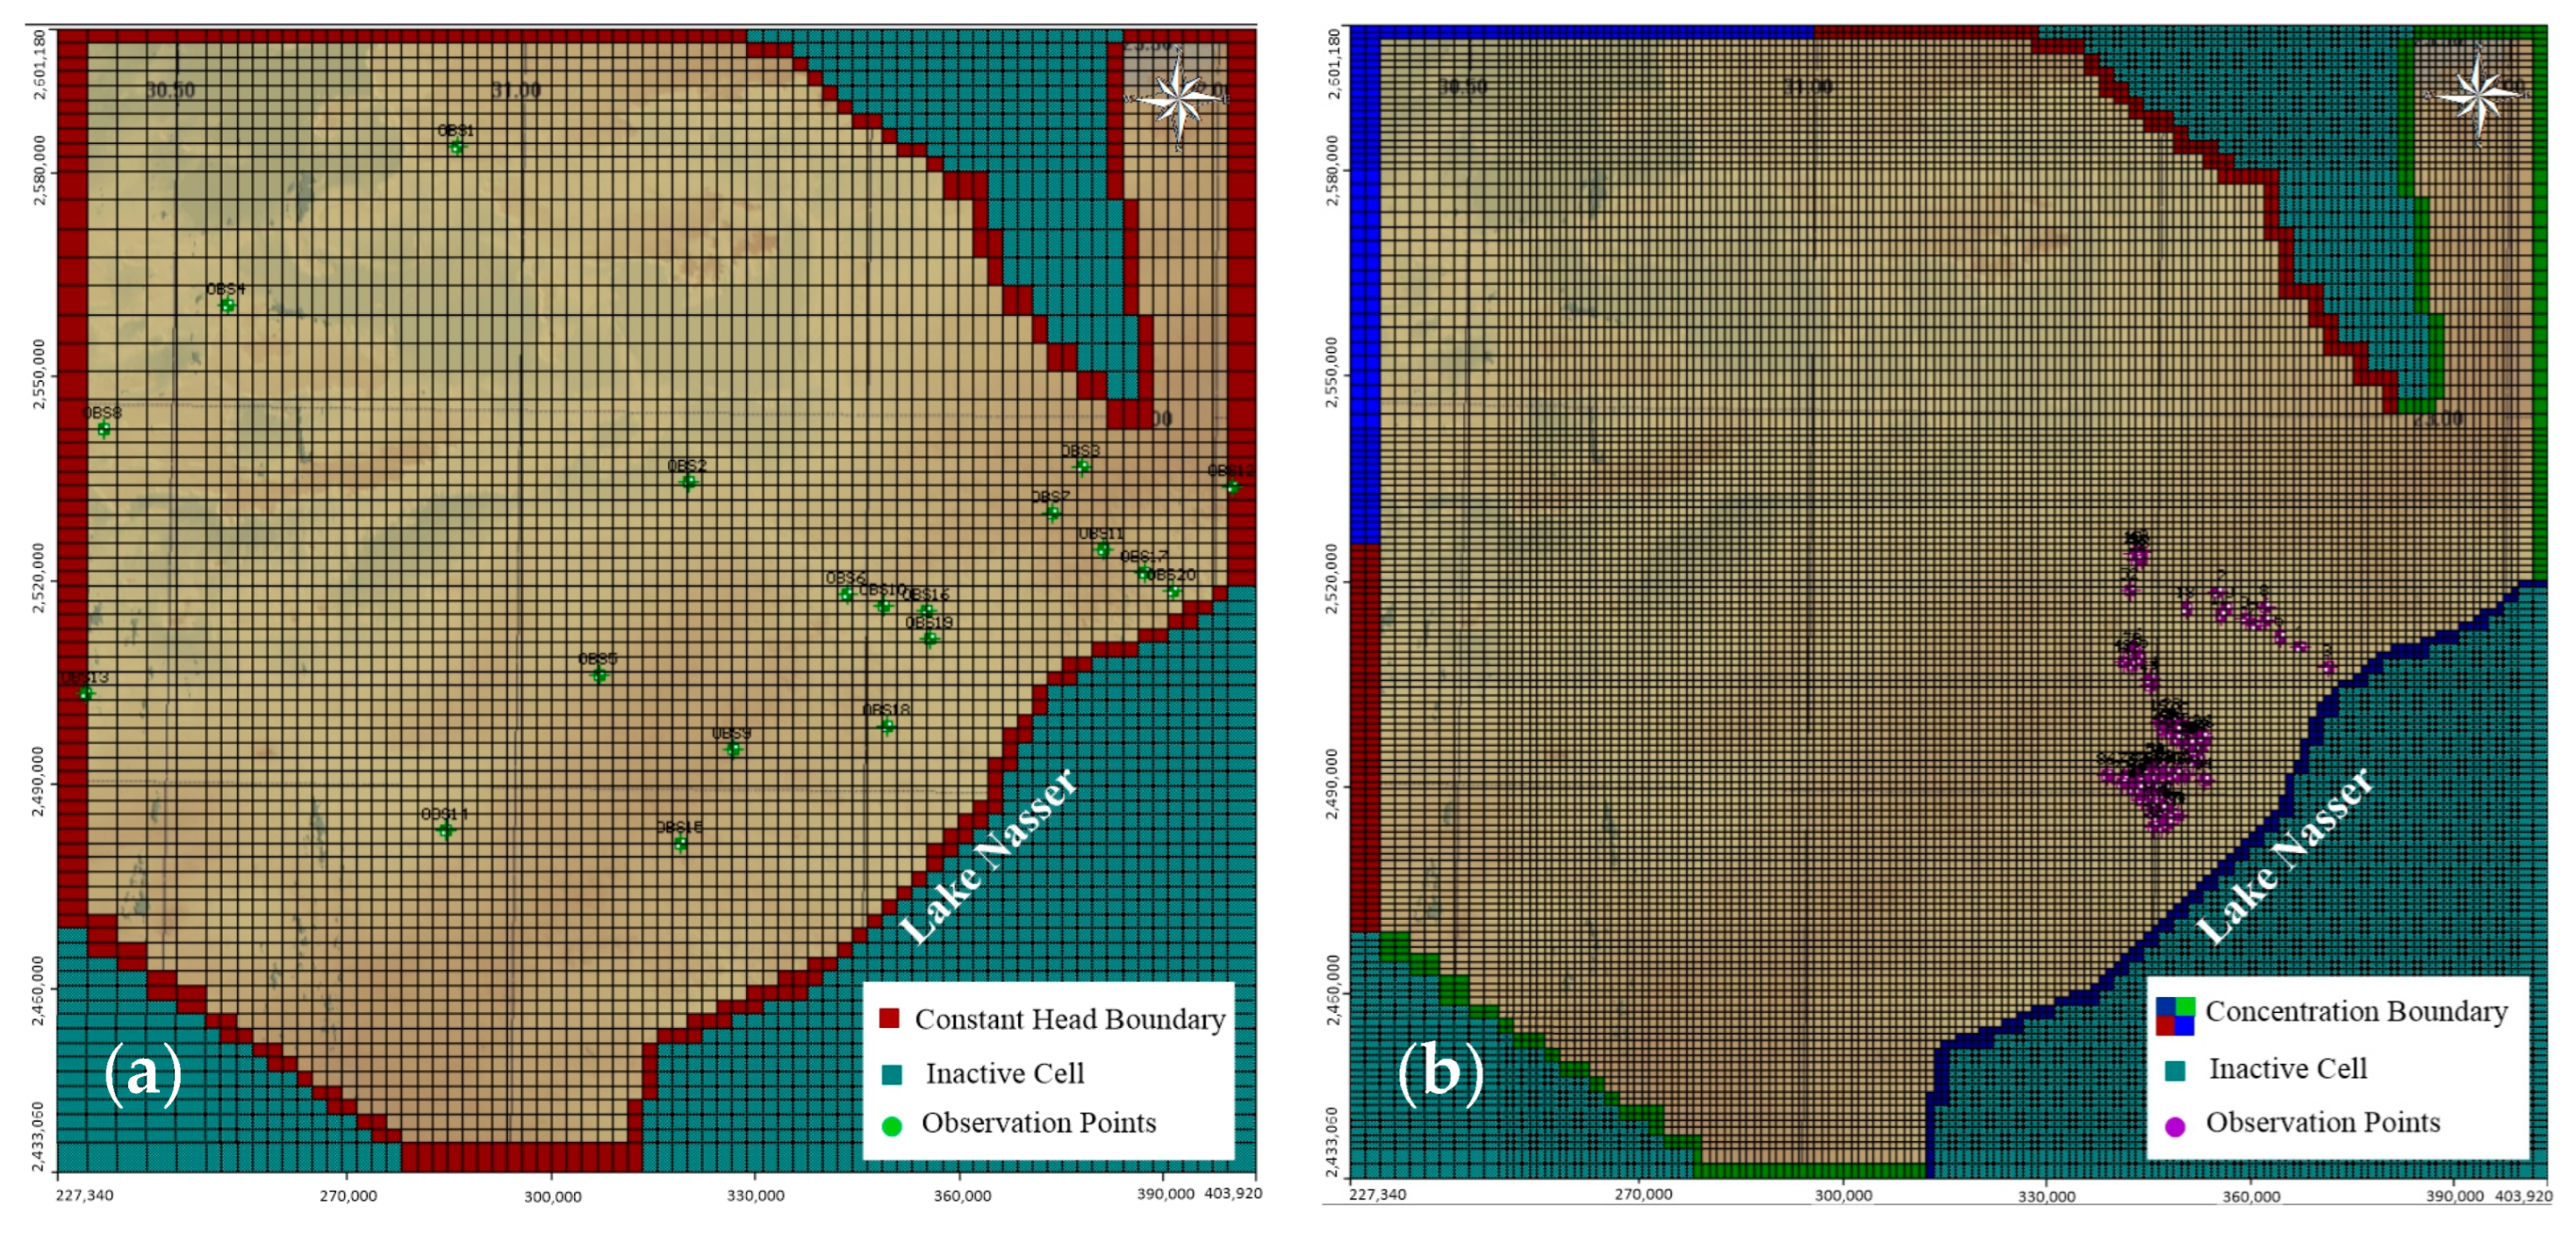
3. Conceptual Model Development
- Discretizing the model domain into a proper number of cells.
- Expanding the generated grids into three dimensions based on stratigraphy data.
- Characterizing the boundary conditions that control the flow and pollutant movement.
- Assigning the hydrogeological properties and heterogeneity parameters.
3.1. Groundwater Flow Model
3.2. Solute Transport Model
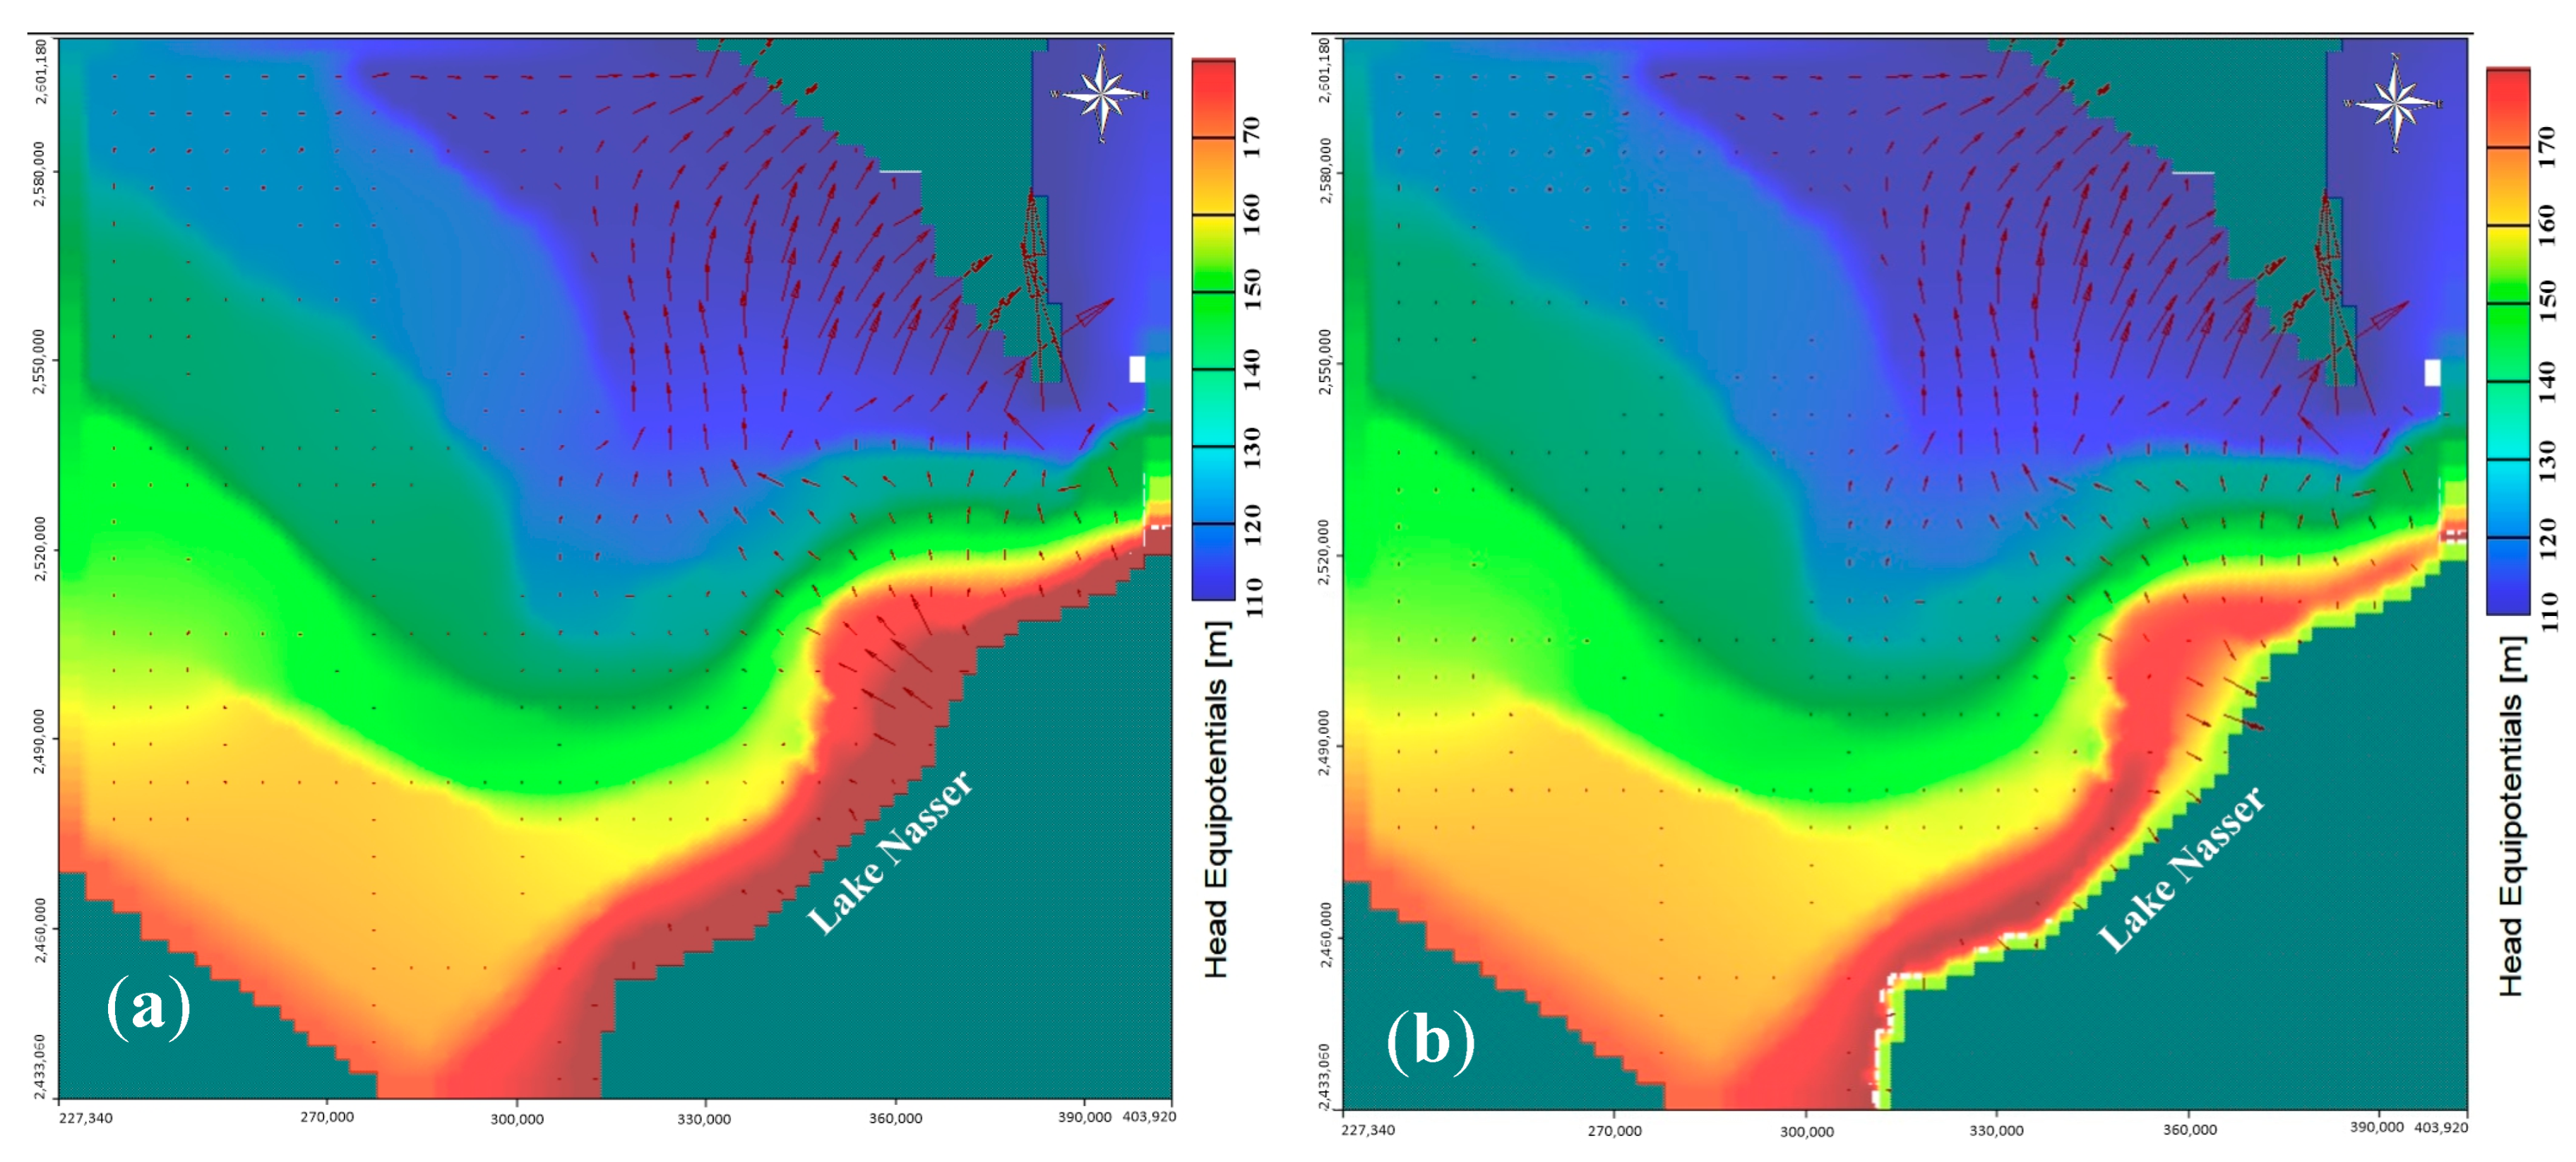
4. Flow Model Simulation
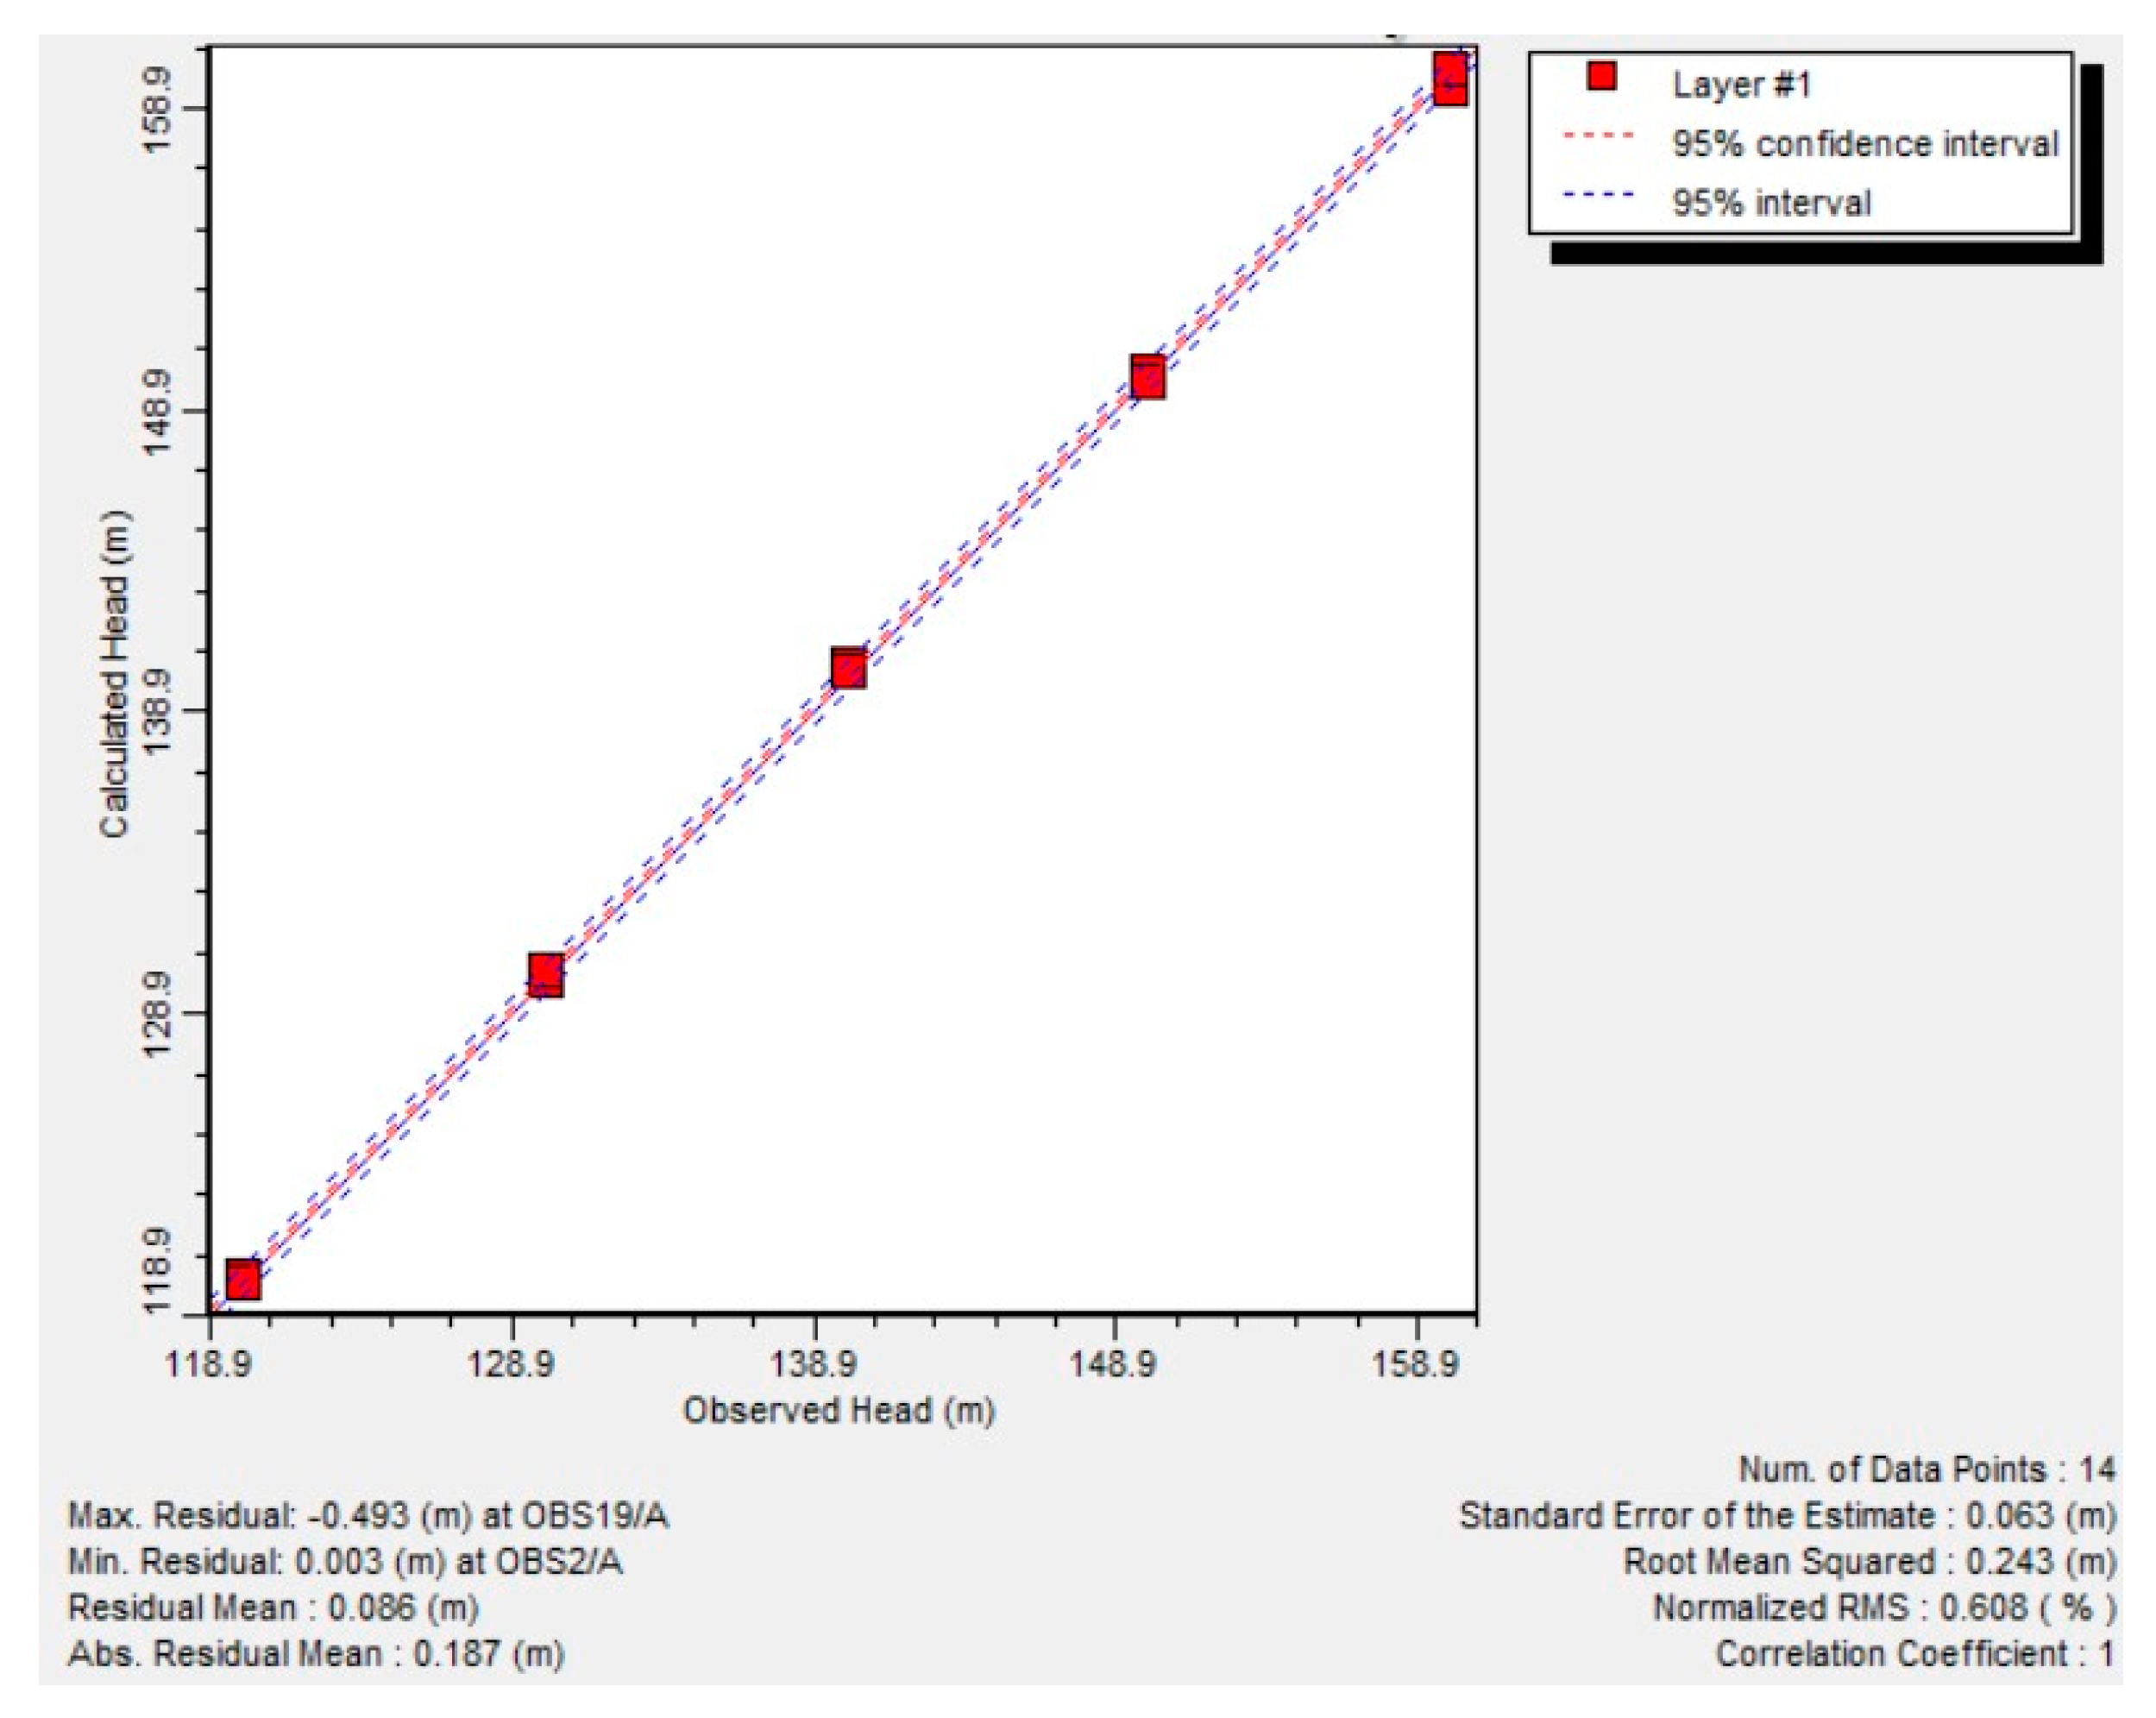
4.1. Model Calibration
4.2. Rural Development Plan
4.3. Future Challenge Implication
5. Transport Model Simulation
5.1. Model Calibration
5.2. Proposed Industrial-Activity-Induced Contamination
6. Results and Discussion
6.1. Flow Model Calibration for Aquifer’s Hydraulics
6.2. Management Pumping Scheme
6.3. Future Challenge Implication
6.4. Transport Model Calibration
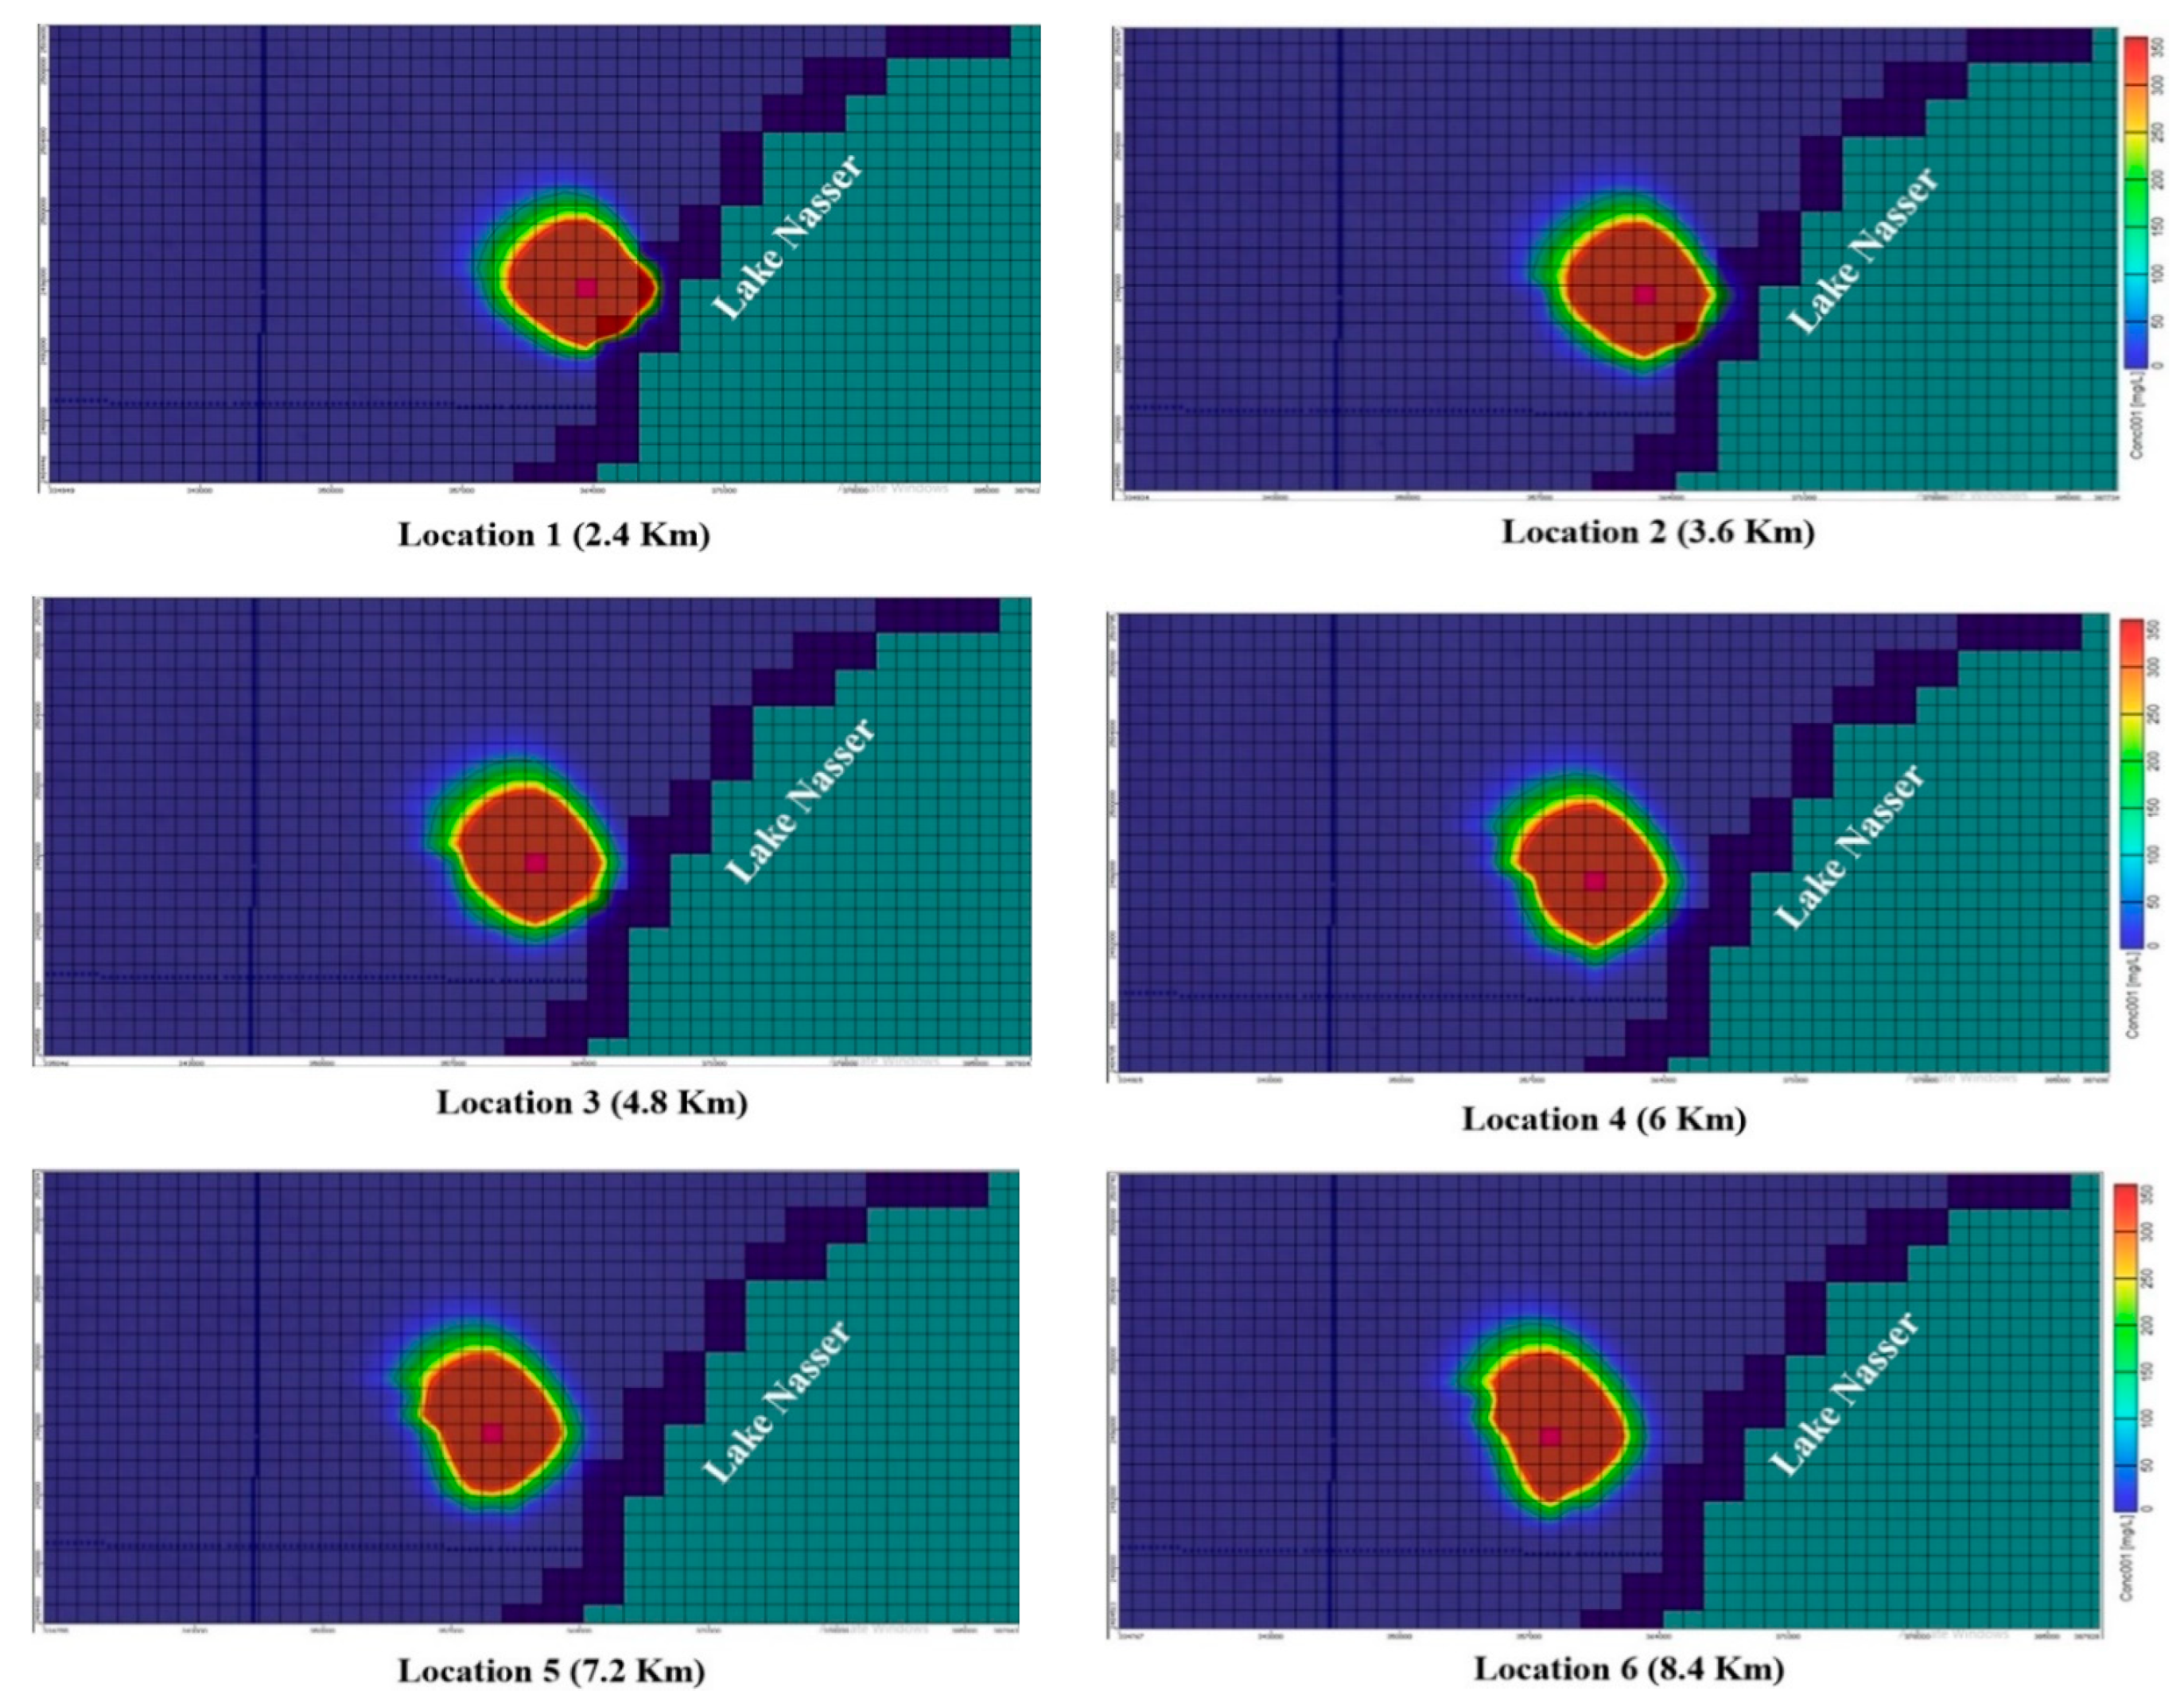
6.5. Proposed Industrial-Activity-Induced Contamination
7. Conclusions
Author Contributions
Funding
Data Availability Statement
Acknowledgments
Conflicts of Interest
References
- Frappart, F.; Ramillien, G. Monitoring groundwater storage changes using the Gravity Recovery and Climate Experiment (GRACE) satellite mission: A review. Remote Sens. 2018, 10, 829. [Google Scholar] [CrossRef] [Green Version]
- Razzaq, A.; Liu, H.; Xiao, M.; Mehmood, K.; Shahzad, M.A.; Zhou, Y. Analyzing past and future trends in Pakistan’s groundwater irrigation development: Implications for environmental sustainability and food security. Environ. Sci. Pollut. Res. 2023, 30, 35413–35429. [Google Scholar] [CrossRef] [PubMed]
- Closas, A.; Rap, E. Solar-based groundwater pumping for irrigation: Sustainability, policies, and limitations. Energy Policy 2017, 104, 33–37. [Google Scholar] [CrossRef]
- Awais, M.; Arshad, M.; Ahmad, S.R.; Nazeer, A.; Waqas, M.M.; Aziz, R.; Shakoor, A.; Rizwan, M.; Chauhdary, J.N.; Mehmood, Q.; et al. Simulation of Groundwater Flow Dynamics under Different Stresses Using MODFLOW in Rechna Doab, Pakistan. Sustain. 2023, 15, 661. [Google Scholar] [CrossRef]
- Rubio-Aliaga, Á.; Sánchez-Lozano, J.M.; García-Cascales, M.S.; Benhamou, M.; Molina-García, A. GIS-based solar resource analysis for irrigation purposes: Rural areas comparison under groundwater scarcity conditions. Sol. Energy Mater. Sol. Cells 2016, 156, 128–139. [Google Scholar] [CrossRef]
- Pandey, A.; Padhya, V.; Ganguly, A.; Chakra, S.; Deshpande, R.D. Surface water groundwater interaction in water-stressed semi-arid western India: Insights from environmental isotopes. J. Arid Environ. 2023, 208, 104879. [Google Scholar] [CrossRef]
- Rödiger, T.; Geyer, S.; Odeh, T.; Siebert, C. Data scarce modelling the impact of present and future groundwater development on Jordan multi aquifer groundwater resources. In Advances in Science, Technology & Innovation; Springer: Cham, Switzerland, 2023; Volume 870. [Google Scholar]
- Samani, S. Assessment of groundwater sustainability and management plan formulations through the integration of hydrogeological, environmental, social, economic and policy indices. Groundw. Sustain. Dev. 2021, 15, 100681. [Google Scholar] [CrossRef]
- Gabr, M.E. Land reclamation projects in the Egyptian Western Desert: Management of 1.5 million acres of groundwater irrigation. Water Int. 2023, 48, 240–258. [Google Scholar] [CrossRef]
- Selim, T.; Moghazy, N.H.; Elasbah, R.; Elkiki, M. Sustainable agricultural development under different climate change scenarios for El Moghra region, Western Desert of Egypt. Environ. Dev. Sustain. 2023. [Google Scholar] [CrossRef]
- Sayed, E.; Riad, P.; Elbeih, S.; Hagras, M.; Hassan, A.A. Multi-criteria analysis for groundwater management using solar energy in Moghra Oasis, Egypt. Egypt. J. Remote Sens. Space Sci. 2019, 22, 227–235. [Google Scholar] [CrossRef]
- Sayed, E.; Riad, P.; Elbeih, S.F.; Hassan, A.A.; Hagras, M. Sustainable groundwater management in arid regions considering climate change impacts in Moghra region, Egypt. Groundw. Sustain. Dev. 2020, 11, 100385. [Google Scholar] [CrossRef]
- Hejazi, M.; Santos Da Silva, S.R.; Miralles-Wilhelm, F.; Kim, S.; Kyle, P.; Liu, Y.; Vernon, C.; Delgado, A.; Edmonds, J.; Clarke, L. Impacts of water scarcity on agricultural production and electricity generation in the Middle East and North Africa. Front. Environ. Sci. 2023, 11, 1082930. [Google Scholar] [CrossRef]
- Shalby, A.; Emara, S.R.; Metwally, M.I.; Armanuos, A.M.; El-Agha, D.E.; Negm, A.M.; Gado, T.A. Satellite-based estimates of groundwater storage depletion over Egypt. Environ. Monit. Assess. 2023, 195, 594. [Google Scholar] [CrossRef]
- Emara, S.R.; Metwally, M.I.; Shalby, A.; El-agha, D.E.; Asaad, M.; Gado, T.A.; Negm, A. Optimum Strategies for Sustainable Fossil Groundwater Reserve Utilization in Egypt. In Proceedings of the Twenty-Third International Water Technology Conference, IWTC23, Port Said, Egypt, 9–11 March 2023; pp. 189–205. [Google Scholar]
- Baietti, A.; El Dia, Q.; Requena, S.A.; El Arabi, N.; Nassar, A.; Hamid, W.A.; Abu Taleb, M.F.; Salem, H.E.S.; Leon, P.-H. Conceptual Framework and Transaction Model for a Public-Private Partnership in Irrigation in the West Delta, Egypt; Ministry of Water Resources and Irrigation: Arab Republic of Egypt, 2005; p. 84. Available online: https://librarypppkl.assyst-uc.com/documents/1406?prevpage=home (accessed on 20 April 2022).
- El-Rawy, M.; Makhloof, A.A.; Hashem, M.D.; Eltarabily, M.G. Groundwater management of quaternary aquifer of the Nile Valley under different recharge and discharge scenarios: A case study Assiut governorate, Egypt. Ain Shams Eng. J. 2021, 12, 2563–2574. [Google Scholar] [CrossRef]
- Fang, Z.; Liu, Z.; Zhao, S.; Ma, Y.; Li, X.; Gao, H. Assessment of Groundwater Contamination Risk in Oilfield Drilling Sites Based on Groundwater Vulnerability, Pollution Source Hazard, and Groundwater Value Function in Yitong County. Water 2022, 14, 628. [Google Scholar] [CrossRef]
- Tirkey, P.; Bhattacharya, T.; Chakraborty, S.; Baraik, S. Assessment of groundwater quality and associated health risks: A case study of Ranchi city, Jharkhand, India. Groundw. Sustain. Dev. 2017, 5, 85–100. [Google Scholar] [CrossRef]
- Armanuos, A.M.; Allam, A.; Negm, A.M. Assessment of Groundwater vulnerability to pollution in the southern part of Nile Delta, Egypt. Int. Water Technol. J. IWTJ 2020, 2, 18–40. [Google Scholar]
- Sagharavni, S.R.; Mustapha, S.; Saghravani, S.F.; Ibrahim, S. Application of visual MODFLOW in simulation of contamination migration in an unconfined aquifer. IAHS-AISH Publ. 2011, 345, 249–252. [Google Scholar]
- Chintalapudi, P.; Pujari, P.; Khadse, G.; Sanam, R.; Labhasetwar, P. Groundwater quality assessment in emerging industrial cluster of alluvial aquifer near Jaipur, India. Environ. Earth Sci. 2017, 76, 8. [Google Scholar] [CrossRef]
- Kamel, N.H.; Sayyah, A.M.; Abdel-aal, A.A. Ground Water in Certain Sites in Egypt and Its Treatments Using a New Modified Ion Exchange Resin—Characterization of Water and Modified Ion Exchange. J. Environ. Prot. 2011, 02, 435–444. [Google Scholar] [CrossRef]
- Metwally, M.I.; Armanuos, A.M.; Zeidan, B.A. Comparative study for assessment of groundwater vulnerability to pollution using DRASTIC methods applied to central Nile Delta, Egypt. Int. J. Energy Water Resour. 2023, 7, 175–190. [Google Scholar] [CrossRef]
- Waseem, A.; Arshad, J.; Iqbal, F.; Sajjad, A.; Mehmood, Z.; Murtaza, G. Pollution Status of Pakistan: A Retrospective Review on Heavy Metal Contamination of Water, Soil, and Vegetables. BioMed Res. Int. 2014, 2014, 813206. [Google Scholar] [CrossRef] [PubMed]
- Negm, A.M.; Armanuos, A.M. GIS-Based spatial distribution of groundwater quality in the western Nile Delta, Egypt. Handb. Environ. Chem. 2017, 55, 89–119. [Google Scholar] [CrossRef]
- Hussein, E.E.; Fouad, M.; Gad, M.I. Prediction of the pollutants movements from the polluted industrial zone in 10th of Ramadan city to the Quaternary aquifer. Appl. Water Sci. 2019, 9, 20. [Google Scholar] [CrossRef] [Green Version]
- Foroushani, T.S.; Balali, H.; Movahedi, R.; Kurban, A.; Värnik, R.; Stamenkovska, I.J.; Azadi, H. Importance of good groundwater governance in economic development: The case of western Iran. Groundw. Sustain. Dev. 2023, 21, 100892. [Google Scholar] [CrossRef]
- Rojas, R.; Gonzalez, D.; Fu, G. Resilience, stress and sustainability of alluvial aquifers in the Murray-Darling Basin, Australia: Opportunities for groundwater management. J. Hydrol. Reg. Stud. 2023, 47, 101419. [Google Scholar] [CrossRef]
- Barbulescu, A. Assessing groundwater vulnerability: DRASTIC and DRASTIC-like methods: A review. Water 2020, 12, 1356. [Google Scholar] [CrossRef]
- Saranya, T.; Saravanan, S. Assessment of groundwater vulnerability using analytical hierarchy process and evidential belief function with DRASTIC parameters, Cuddalore, India. Int. J. Environ. Sci. Technol. 2023, 20, 1837–1856. [Google Scholar] [CrossRef]
- Shanmugamoorthy, M.; Subbaiyan, A.; Elango, L.; Velusamy, S. Groundwater susceptibility assessment using the GIS-based DRASTIC-LU model in the Noyyal river area of South India. Urban Clim. 2023, 49, 101464. [Google Scholar] [CrossRef]
- Norouzi Khatiri, K.; Nematollahi, B.; Hafeziyeh, S.; Niksokhan, M.H.; Nikoo, M.R.; Al-Rawas, G. Groundwater Management and Allocation Models: A Review. Water 2023, 15, 253. [Google Scholar] [CrossRef]
- Blin, N.; Suárez, F. Evaluating the contribution of satellite-derived evapotranspiration in the calibration of numerical groundwater models in remote zones using the EEFlux tool. Sci. Total Environ. 2023, 858, 159764. [Google Scholar] [CrossRef]
- Thangarajan, M. Groundwater models and their role in assessment and management of groundwater resources and pollution. In Groundwater; Springer: Dordrecht, The Netherlands, 2007; pp. 189–236. [Google Scholar] [CrossRef]
- Kresic, N. Hydrogeology and Groundwater Modeling, 2nd ed.; CRC Press: Boca Raton, FL, USA, 2006; ISBN 9780429122101. [Google Scholar]
- Sun, K.; Hu, L.; Sun, J.; Zhai, Y.; Zhang, S.; Cao, X. Quantifying the contribution of ecological water replenishment on aquifer recovery using a refined groundwater model. Sci. Total Environ. 2023, 857, 159216. [Google Scholar] [CrossRef]
- Eltarabily, M.G.; Negm, A.M.; Yoshimura, C.; Saavedra, O.C. Modeling the impact of nitrate fertilizers on groundwater quality in the southern part of the Nile Delta, Egypt. Water Sci. Technol. Water Supply 2017, 17, 561–570. [Google Scholar] [CrossRef]
- Rahnama, M.B.; Zamzam, A. Quantitative and qualitative simulation of groundwater by mathematical models in Rafsanjan aquifer using MODFLOW and MT3DMS. Arab. J. Geosci. 2013, 6, 901–912. [Google Scholar] [CrossRef]
- Banejad, H.; Mohebzadeh, H.; Ghobadi, M.H.; Heydari, M. Numerical simulation of groundwater flow and contamination transport in Nahavand plain aquifer, west of Iran. J. Geol. Soc. India 2014, 83, 83–92. [Google Scholar] [CrossRef]
- Sharaky, A.M.; El Abd, E.S.A.; Shanab, E.F. Groundwater Assessment for Agricultural Irrigation in Toshka Area, Western Desert, Egypt. In Handbook of Environmental Chemistry; Springer: Cham, Switzerland, 2019; Volume 74, pp. 347–387. [Google Scholar]
- Geriesh, M.H.; Abouelmagd, A.; Mansour, B.M.H. Major Groundwater Reservoirs of Egypt. In The Phanerozoic Geology and Natural Resources of Egypt; Springer: Cham, Switzerland, 2023; ISBN 9783030956370. [Google Scholar]
- Aly, M.M.; Sakr, S.A.; Fayad, S.A.K. Evaluation of the impact of Lake Nasser on the groundwater system in Toshka under future development scenarios, Western Desert, Egypt. Arab. J. Geosci. 2019, 12, 553. [Google Scholar] [CrossRef]
- Elsawwaf, M.; Feyen, J.; Batelaan, O.; Bakr, M. Groundwater-surface water interaction in Lake Nasser, Southern Egypt. Hydrol. Process. 2014, 28, 414–430. [Google Scholar] [CrossRef]
- Mohamed, A.F.; Mostafa, A.K. Physicochemical Characteristics of Water Quality in Lake Nasser Water. Glob. J. Environ. Res. 2009, 3, 141–148. [Google Scholar]
- Elewa, H.H. Water resources and geomorphological characteristics of Tushka and west of Lake Nasser, Egypt. Hydrogeol. J. 2006, 14, 942–954. [Google Scholar] [CrossRef]
- Refaat, A.A.; Hamdan, M.A. Mineralogy and grain morphology of the aeolian dune sand of Toshka area, southeastern Western Desert, Egypt. Aeolian Res. 2015, 17, 243–254. [Google Scholar] [CrossRef]
- Altorkomani, G. The geomorphology of Toshka area and its development potentialities (In Arabic). Geogr. Res. Ser. 1999, p. 240. Available online: https://www.noor-book.com/en/p2oaxc (accessed on 20 March 2023).
- Moneim, A.A.A.; Zaki, S.; Diab, M. Groundwater Conditions and the Geoenvironmental Impacts of the Recent Development in the South Eastern Part of the Western Desert of Egypt. J. Water Resour. Prot. 2014, 6, 381–401. [Google Scholar] [CrossRef] [Green Version]
- Abd Ellah, R.G. Morphometric analysis of Toshka Lakes in Egypt: A succinct review of geographic information systems & remote sensing-based techniques. Egypt. J. Aquat. Res. 2021, 47, 215–221. [Google Scholar] [CrossRef]
- Ghoubachi, S.Y. Impact of Lake Nasser on the groundwater of the Nubia sandstone aquifer system in Tushka area, South Western Desert, Egypt. J. King Saud Univ.-Sci. 2012, 24, 101–109. [Google Scholar] [CrossRef] [Green Version]
- Gao, S.; Zhu, Y.; Yan, K. Simulation and Prediction of Groundwater Pollution based on Modflow Model in a Certain Landfill. IOP Conf. Ser. Earth Environ. Sci. 2018, 189, 022030. [Google Scholar] [CrossRef]
- Xie, W.; Ren, B.; Hursthouse, A.S.; Wang, Z.; Luo, X. Simulation of manganese transport in groundwater using visual modflow: A case study from Xiangtan manganese ore area in central China. Pol. J. Environ. Stud. 2021, 30, 1409–1420. [Google Scholar] [CrossRef]
- Abd-Elaty, I.; Pugliese, L.; Zelenakova, M.; Mesaros, P.; Shinawi, A. El Simulation-based solutions reducing soil and groundwater contamination from fertilizers in arid and semi-arid regions: Case study the eastern Nile delta, Egypt. Int. J. Environ. Res. Public Health 2020, 17, 9373. [Google Scholar] [CrossRef] [PubMed]
- Mao, X.; Zhang, S.; Wang, S.; Li, T.; Hu, S.; Zhou, X. Evaluation of Human Health Risks Associated with Groundwater Contamination and Groundwater Pollution Prediction in a Landfill and Surrounding Area in Kaifeng City, China. Water 2023, 15, 723. [Google Scholar] [CrossRef]
- He, Z.; Han, D.; Song, X.; Yang, S. Impact of human activities on coastal groundwater pollution in the Yang-Dai River plain, northern China. Environ. Sci. Pollut. Res. 2020, 27, 37592–37613. [Google Scholar] [CrossRef]
- Moharram, S.H.; Gad, M.I.; Saafan, T.A.; Allah, S.K. Optimal groundwater management using Genetic Algorithm in El-Farafra Oasis, Western Desert, Egypt. Water Resour. Manag. 2012, 26, 927–948. [Google Scholar] [CrossRef]
- Samani, S.; Ye, M.; Zhang, F.; Pei, Y.Z.; Tang, G.P.; Elshall, A.; Moghaddam, A.A. Impacts of prior parameter distributions on Bayesian evaluation of groundwater model complexity. Water Sci. Eng. 2018, 11, 89–100. [Google Scholar] [CrossRef]
- Sultan, M.; Yan, E.; Sturchio, N.; Wagdy, A.; Gelil, K.A.; Becker, R.; Manocha, N.; Milewski, A. Natural discharge: A key to sustainable utilization of fossil groundwater. J. Hydrol. 2007, 335, 25–36. [Google Scholar] [CrossRef]
- EGDC. Egyptian Countryside Development Company. Available online: http://elreefelmasry.com (accessed on 20 April 2023).
- Omar, M.E.D.M.; Moussa, A.M.A.; Hinkelmann, R. Impacts of climate change on water quantity, water salinity, food security, and socioeconomy in Egypt. Water Sci. Eng. 2021, 14, 17–27. [Google Scholar] [CrossRef]
- Ramadan, E.M.; Negm, A.M.; Ramadan, S.M.; Smanny, M.; Helmy, A. Environmental Impacts of Great Ethiopian Renaissance Dam on The Egyptian Water Resources Management and Security. In Proceedings of the 23rd International Conference on: Environmental Protection is a Must, Alexandria, Egypt, 11–13 May 2013. [Google Scholar] [CrossRef]
- Nada, A.; Fathy, H. Effect of Different Scenarios of Filling the Grand Ethiopian Renaissance Dam (GERD) on River Nile Water Levels and Discharges Downstream of Aswan High Dam (In Arabic); Hydraulics Research Institute: El-Qanater, El-Kalubi, Egypt, 2014. [Google Scholar]
- Strzepek, K.; Mccluskey, A. The Impacts of Climate Change on Regional Water Resources and Agriculture in Africa; World Bank: Washington, DC, USA, 2007. [Google Scholar]
- Abd Ellah, R.G. Water resources in Egypt and their challenges, Lake Nasser case study. Egypt. J. Aquat. Res. 2020, 46, 1–12. [Google Scholar] [CrossRef]
- Shalby, A.; Elshemy, M.; Zeidan, B.A. Assessment of climate change impacts on water quality parameters of Lake Burullus, Egypt. Environ. Sci. Pollut. Res. 2020, 27, 32157–32178. [Google Scholar] [CrossRef]
- El-Mahdy, M.E.; Abbas, M.S.; Sobhy, H.M. Investigating the Water Quality of the Water Resources Bank of Egypt: Lake Nasser. In Handbook of Environmental Chemistry; Springer: Cham, Switzerland, 2019; Volume 74, pp. 639–655. [Google Scholar]
- Anwar, S.A.; Salah, Z.; Khald, W.; Zakey, A.S. Projecting the Potential Evapotranspiration of Egypt Using a High-Resolution Regional Climate Model (RegCM4). Environ. Sci. Proc. 2022, 19, 43. [Google Scholar] [CrossRef]
- Fakhari, M.; Raymond, J.; Martel, R.; Drolet, J.P.; Dugdale, S.J.; Bergeron, N. Analysis of Large-Scale Groundwater-Driven Cooling Zones in Rivers Using Thermal Infrared Imagery and Radon Measurements. Water 2023, 15, 873. [Google Scholar] [CrossRef]
- Ait Lemkademe, A.; Michelot, J.L.; Benkaddour, A.; Hanich, L.; Heddoun, O. Origin of Groundwater Salinity in the Draa Sfar Polymetallic Mine Area Using Conservative Elements (Morocco). Water 2023, 15, 82. [Google Scholar] [CrossRef]
- French, H.K.; Hansen, M.C.; Moe, K.G.; Stene, J. Modelling Plume Development with Annual Pulses of Contaminants Released from an Airport Runway to a Layered Aquifer, Evaluation of an In Situ Monitoring System. Water 2023, 15, 985. [Google Scholar] [CrossRef]
- Kong, Q.; Zhang, P.; Wang, H.; Lin, X.; Xu, J.; Zhang, B.; Zhang, Z.; Chen, H.; Yao, J. Adsorption Characteristics of Dodecamethylcyclohexasiloxane and Dodecamethylpentasiloxane from Landfill Leachate by Municipal Solid Waste under the Landfill Circumstance. Water 2023, 15, 102. [Google Scholar] [CrossRef]


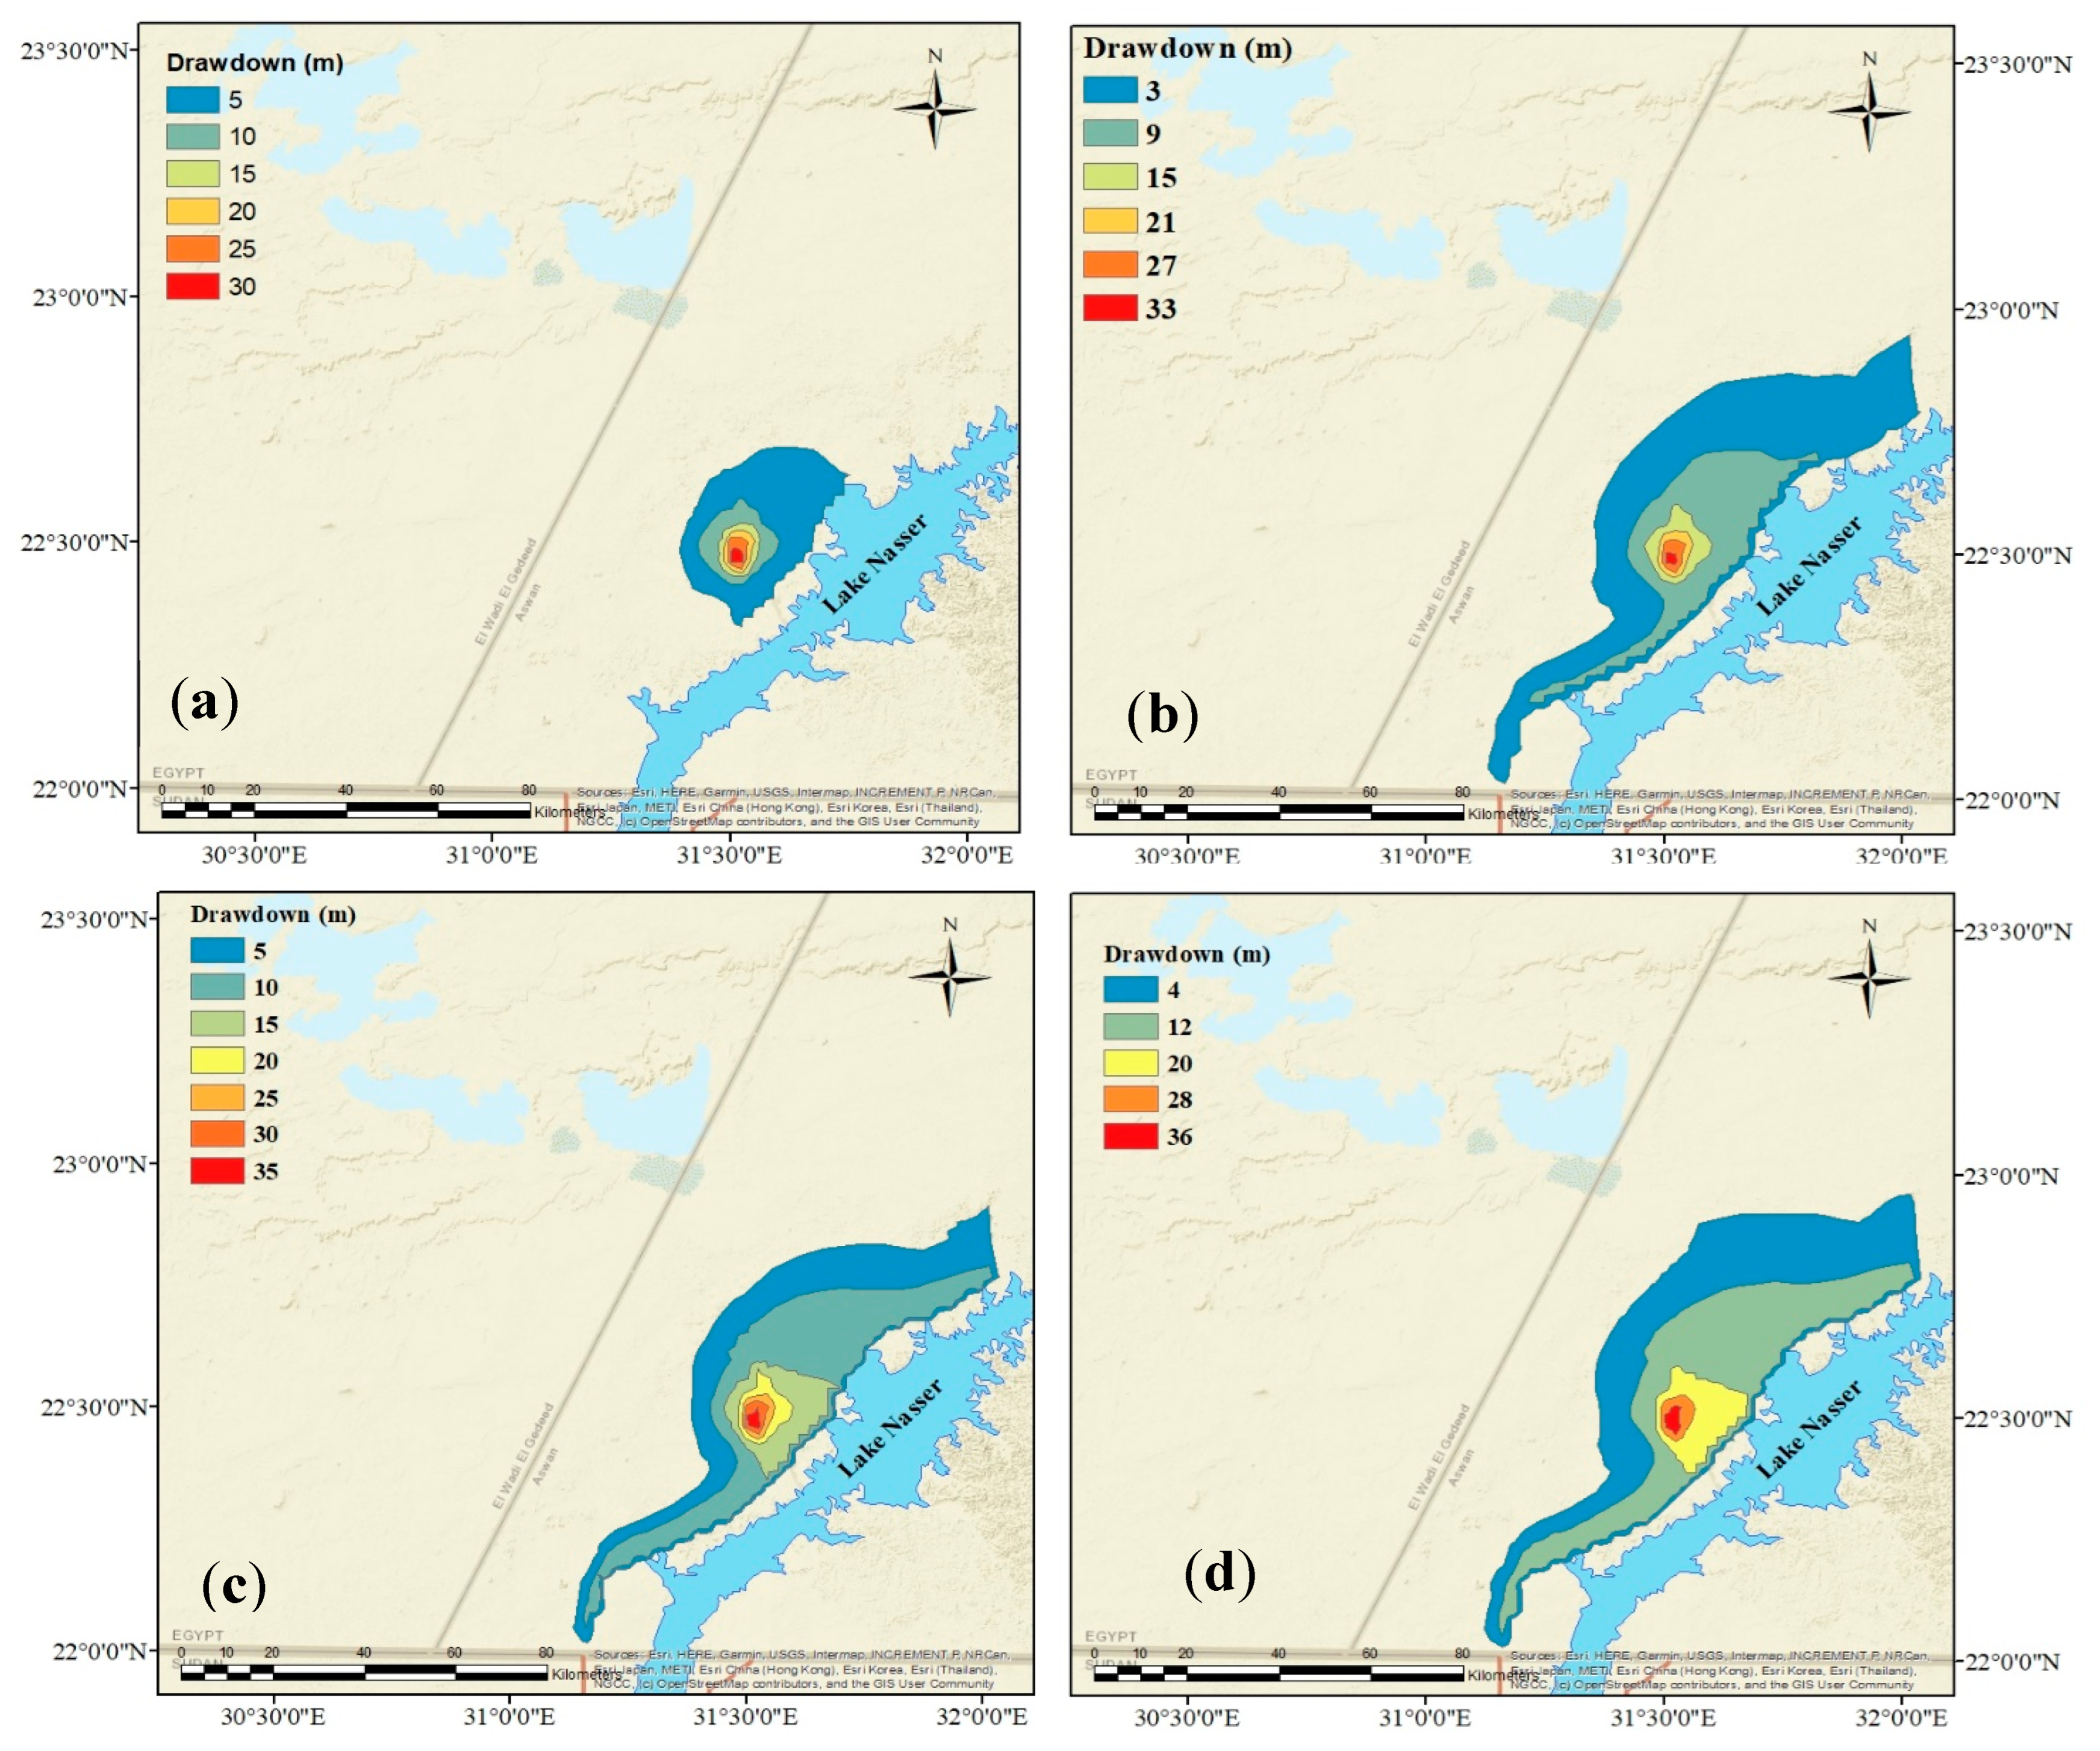
| Lake Water Level (m) | Maximum Drawdown (m) |
|---|---|
| 170 | 25 |
| 165 | 30 |
| 160 | 33 |
| 155 | 35 |
| 150 | 36 |
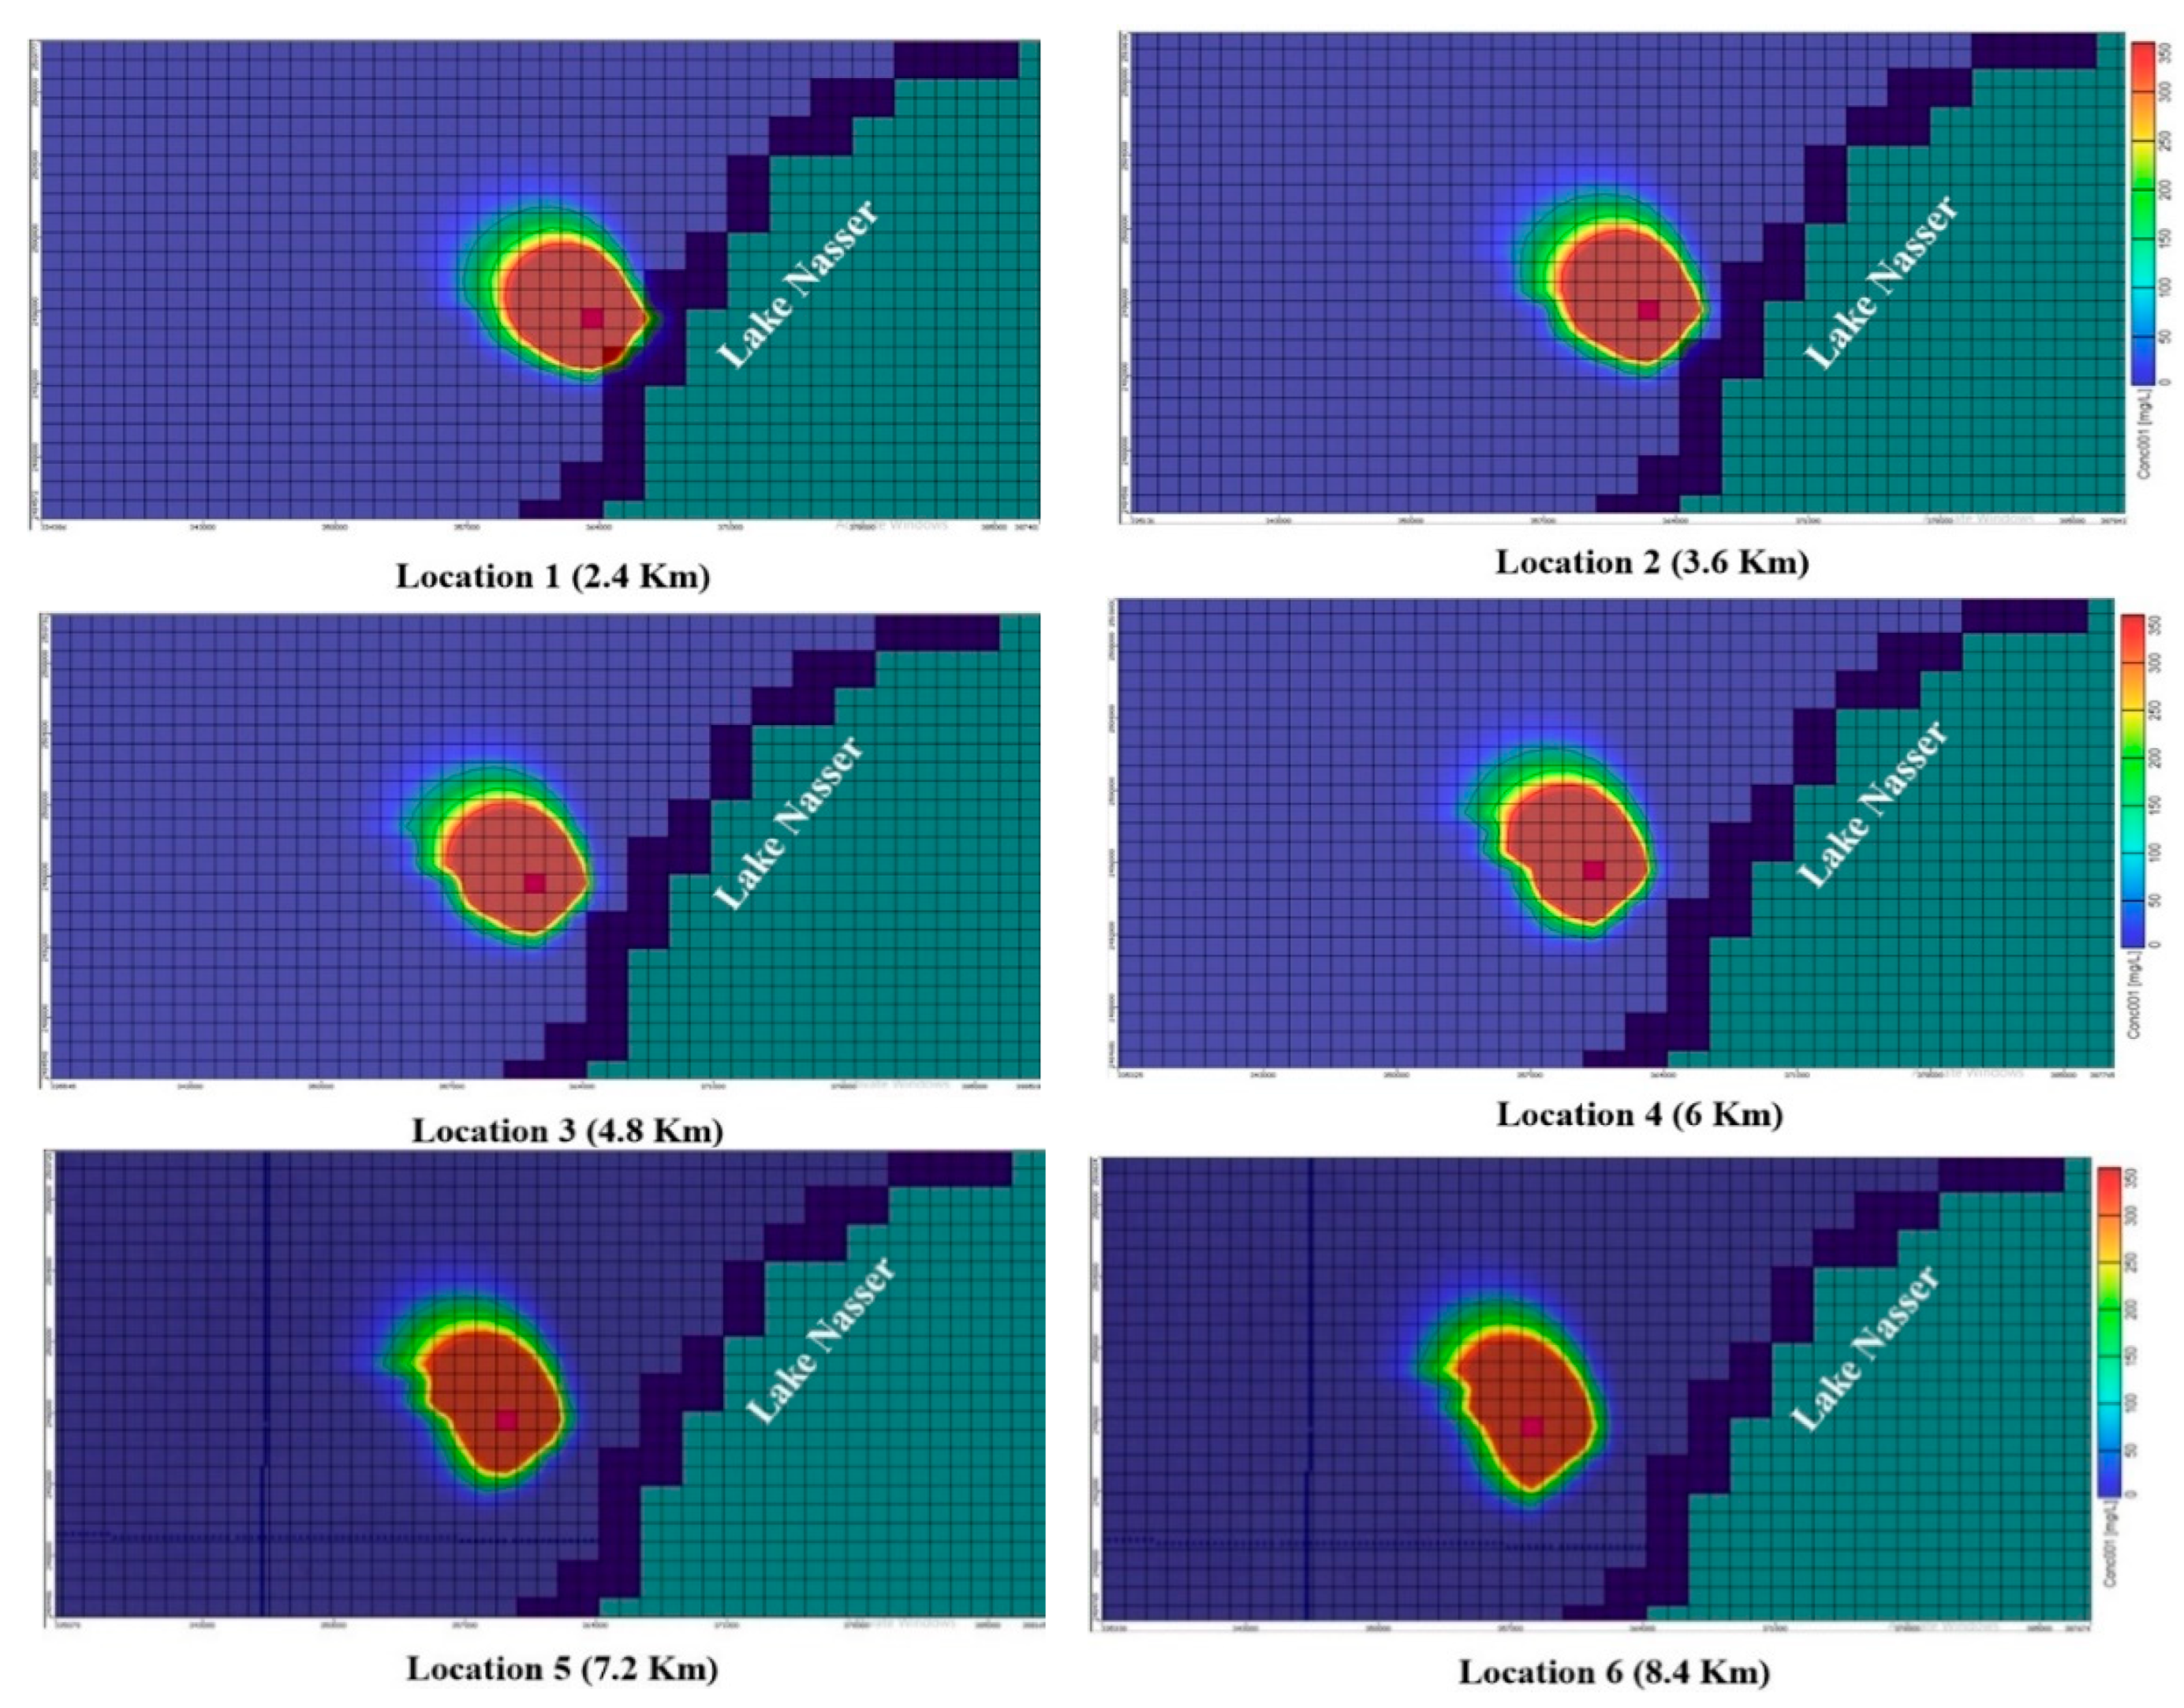
| Low Water Level (158 m) | Normal Water Level (170 m) | High Water Level (182 m) | |||||
|---|---|---|---|---|---|---|---|
| East | West | East | West | East | West | ||
| Location 1 (2.4 km) | After 10 years | 2.8 | 1.8 | 1.8 | 2.2 | 1.6 | 2.4 |
| After 50 years | 4.2 | 4.4 | 4.2 | 5.4 | 3 | 5.2 | |
| After 100 years | 4.2 | 6 | 4.2 | 6.6 | 4.2 | 6.6 | |
| Location 2 (3.6 km) | After 10 years | 2 | 1.8 | 1.8 | 2 | 1.8 | 3.6 |
| After 50 years | 4.2 | 4.2 | 3.4 | 4.8 | 3.2 | 7.2 | |
| After 100 years | 5 | 5 | 4.2 | 6.6 | 4.2 | 9.6 | |
| Location 3 (4.8 km) | After 10 years | 2.2 | 1.8 | 1.8 | 2.2 | 1.6 | 2.3 |
| After 50 years | 4 | 4.2 | 3.4 | 4.2 | 3 | 4.8 | |
| After 100 years | 5 | 5 | 4.8 | 6 | 3.6 | 6.6 | |
| Location 4 (6 km) | After 10 years | 2.2 | 1.8 | 1.8 | 1.8 | 1.6 | 1.8 |
| After 50 years | 4.2 | 3.8 | 3.6 | 4.2 | 3 | 4 | |
| After 100 years | 6.2 | 5.4 | 4.2 | 5.8 | 4 | 5.4 | |
| Location 5 (7.2 km) | After 10 years | 2.2 | 1.6 | 1.8 | 1.8 | 1.6 | 1.6 |
| After 50 years | 4.2 | 3.6 | 3.8 | 3.8 | 3 | 4 | |
| After 100 years | 5.4 | 4.8 | 4.2 | 5 | 4 | 5.4 | |
| Location 6 (8.4 km) | After 10 years | 2.4 | 1.2 | 2 | 1.4 | 1.6 | 1.6 |
| After 50 years | 4.6 | 3 | 4 | 3 | 3.4 | 3.6 | |
| After 100 years | 5.4 | 4.2 | 4.8 | 4.2 | 4.2 | 4.8 | |
Disclaimer/Publisher’s Note: The statements, opinions and data contained in all publications are solely those of the individual author(s) and contributor(s) and not of MDPI and/or the editor(s). MDPI and/or the editor(s) disclaim responsibility for any injury to people or property resulting from any ideas, methods, instructions or products referred to in the content. |
© 2023 by the authors. Licensee MDPI, Basel, Switzerland. This article is an open access article distributed under the terms and conditions of the Creative Commons Attribution (CC BY) license (https://creativecommons.org/licenses/by/4.0/).
Share and Cite
Aly, M.M.; Abd Elhamid, A.M.I.; Abu-Bakr, H.A.-A.; Shalby, A.; Fayad, S.A.K. Integrated Management and Environmental Impact Assessment of Sustainable Groundwater-Dependent Development in Toshka District, Egypt. Water 2023, 15, 2183. https://doi.org/10.3390/w15122183
Aly MM, Abd Elhamid AMI, Abu-Bakr HA-A, Shalby A, Fayad SAK. Integrated Management and Environmental Impact Assessment of Sustainable Groundwater-Dependent Development in Toshka District, Egypt. Water. 2023; 15(12):2183. https://doi.org/10.3390/w15122183
Chicago/Turabian StyleAly, Marwa M., Ahmed M. I. Abd Elhamid, Heba Abdel-Aziz Abu-Bakr, Ahmed Shalby, and Shymaa A. K. Fayad. 2023. "Integrated Management and Environmental Impact Assessment of Sustainable Groundwater-Dependent Development in Toshka District, Egypt" Water 15, no. 12: 2183. https://doi.org/10.3390/w15122183