
Association of Flood Risk Patterns with Waterborne Bacterial Diseases in Malaysia

 , , ,
, , ,  , and
, and
Abstract
:1. Introduction
2. Materials and Methods
2.1. Study Design
2.2. Study Area
2.3. Flood Risk Patterns Using Chemometrics Techniques
2.3.1. Data Collection of Hydrological Data
2.3.2. Data Analysis Using Chemometrics
- Factor Analysis (FA)
- Statistical Process Control (SPC)
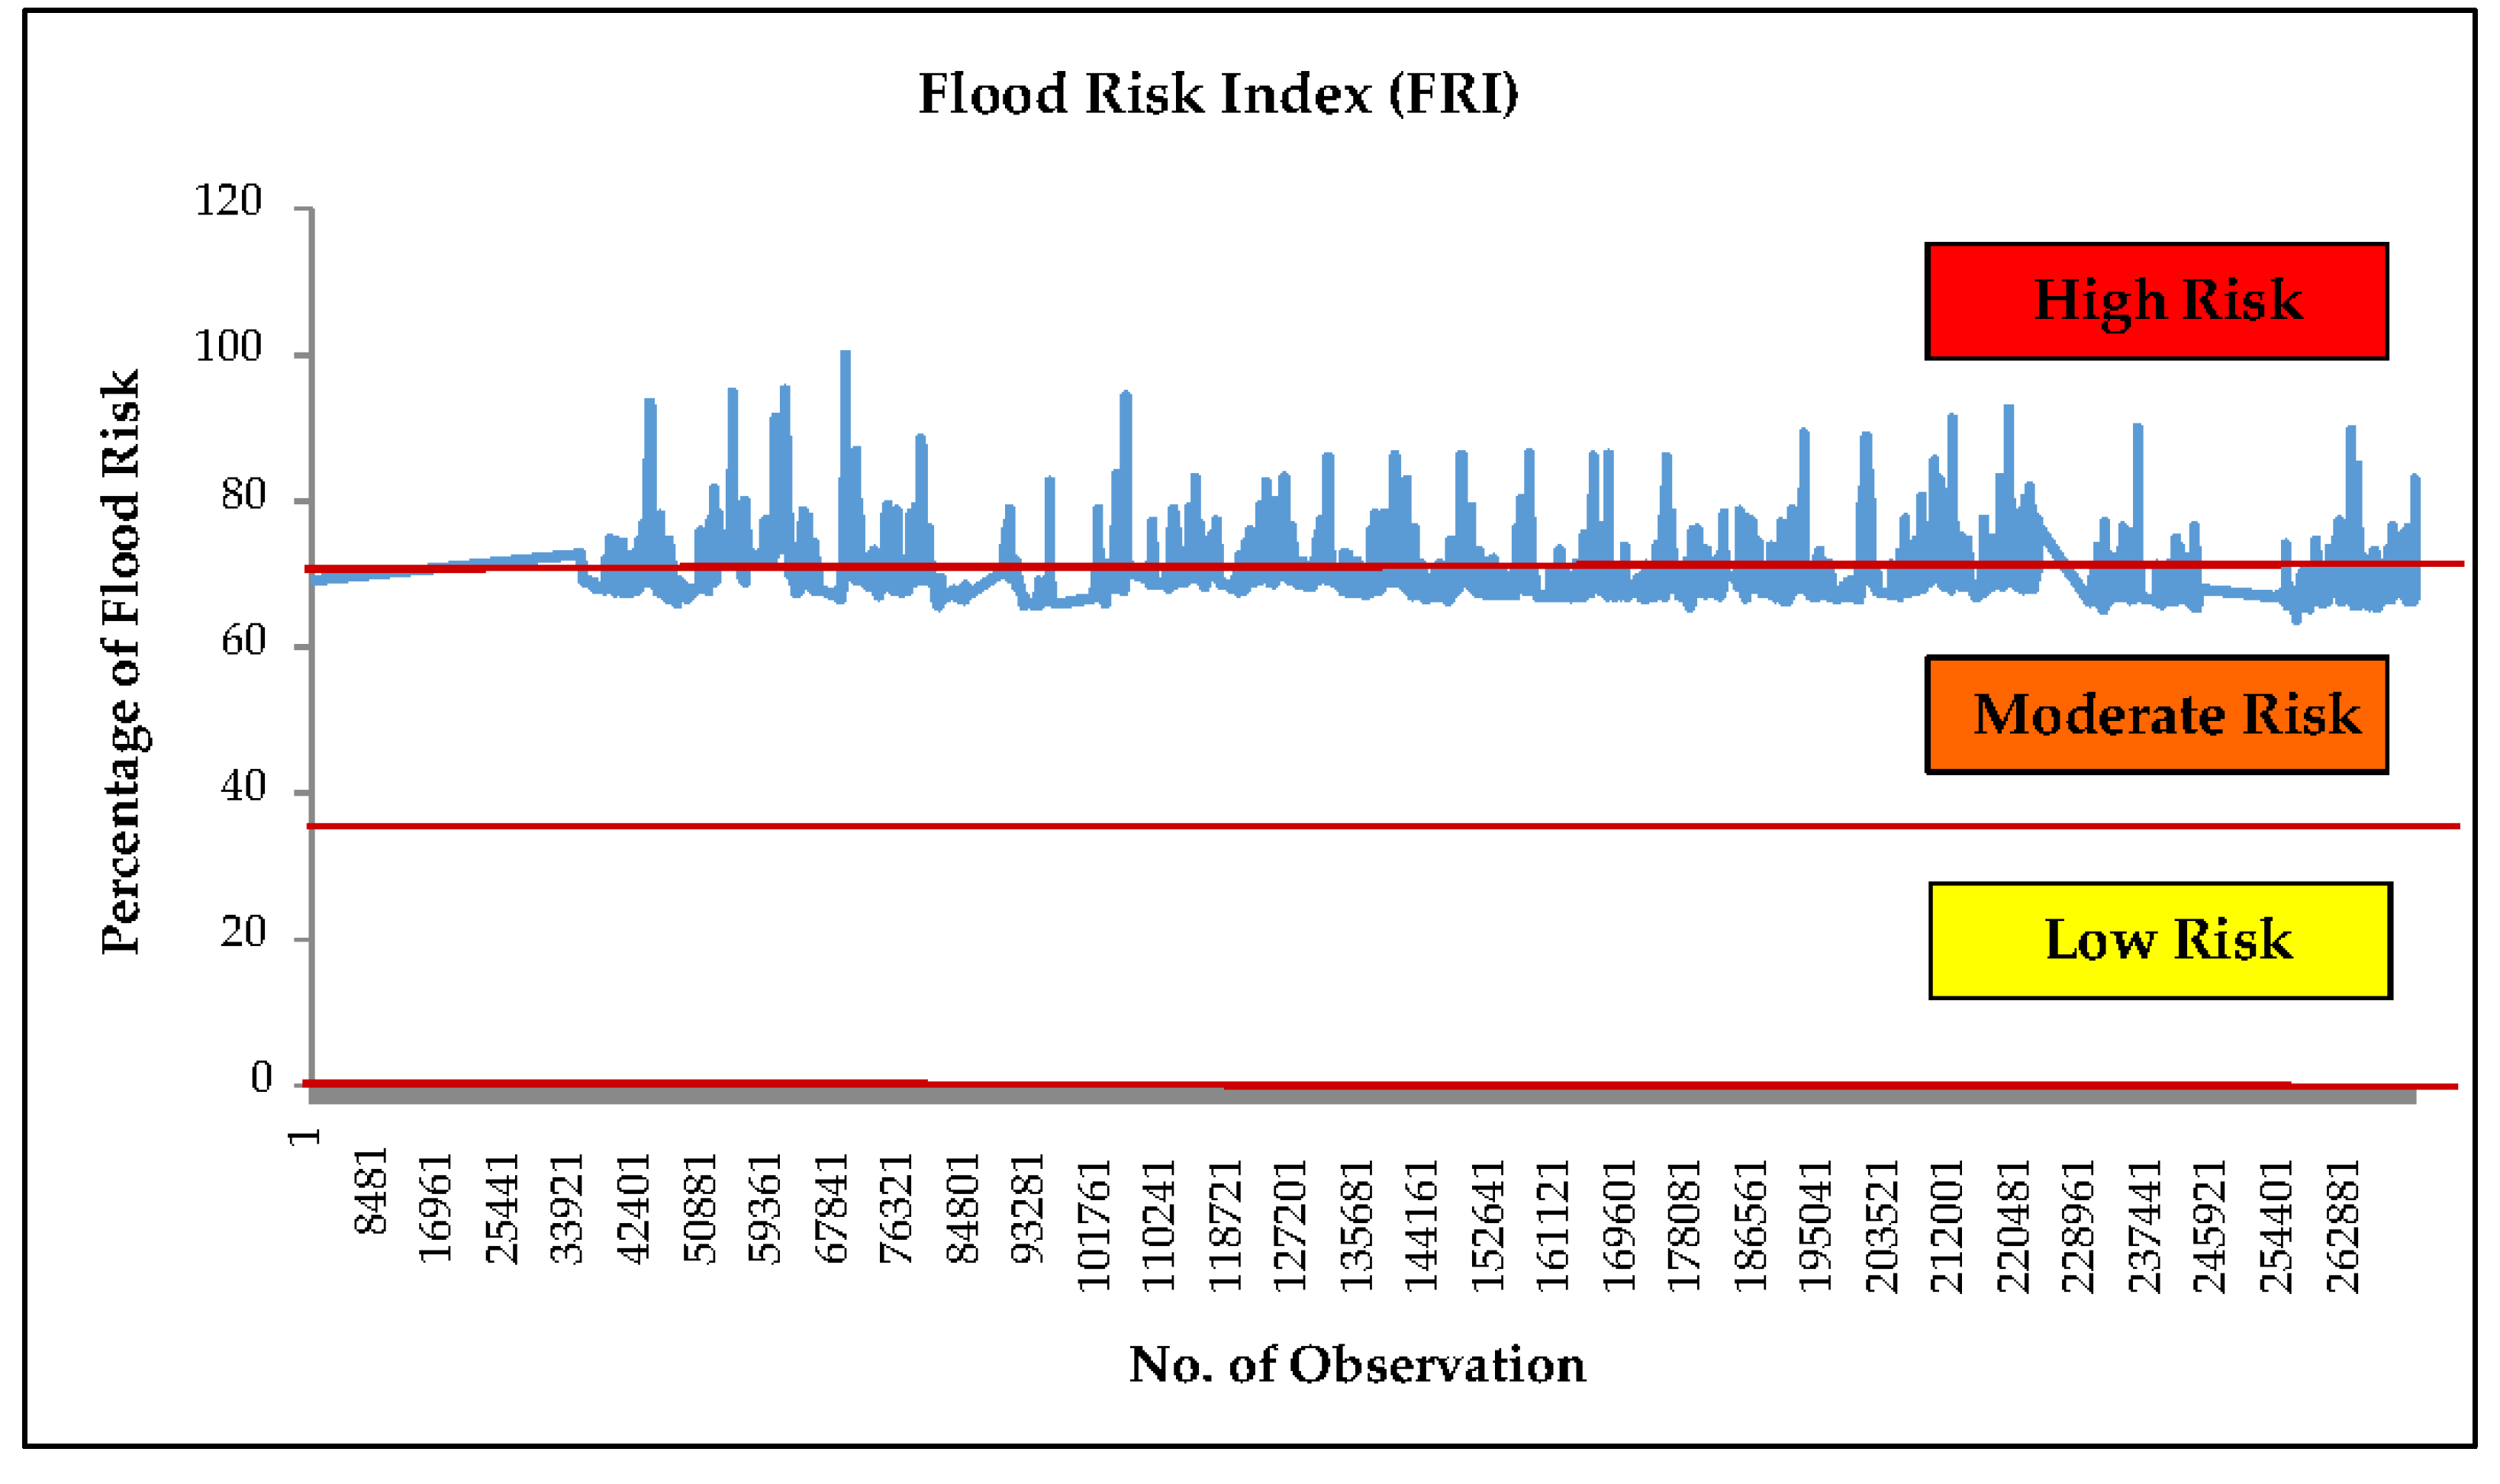
- Flood Risk Index (FRI)
- Artificial Neural Network (ANN)
2.4. Viability of Waterborne Bacteria Using FCM
2.4.1. Water Sampling
2.4.2. Bacterial Detection and Live/Dead Discrimination
2.4.3. Data Acquisition and Analysis
3. Results
3.1. Chemometrics Techniques for Flood Risk Patterns
3.1.1. General Descriptive
3.1.2. Identification of the Significant Factors
3.1.3. FRI Model
3.1.4. Prediction Performance by ANN
3.2. Viability of Waterborne Bacterial Diseases
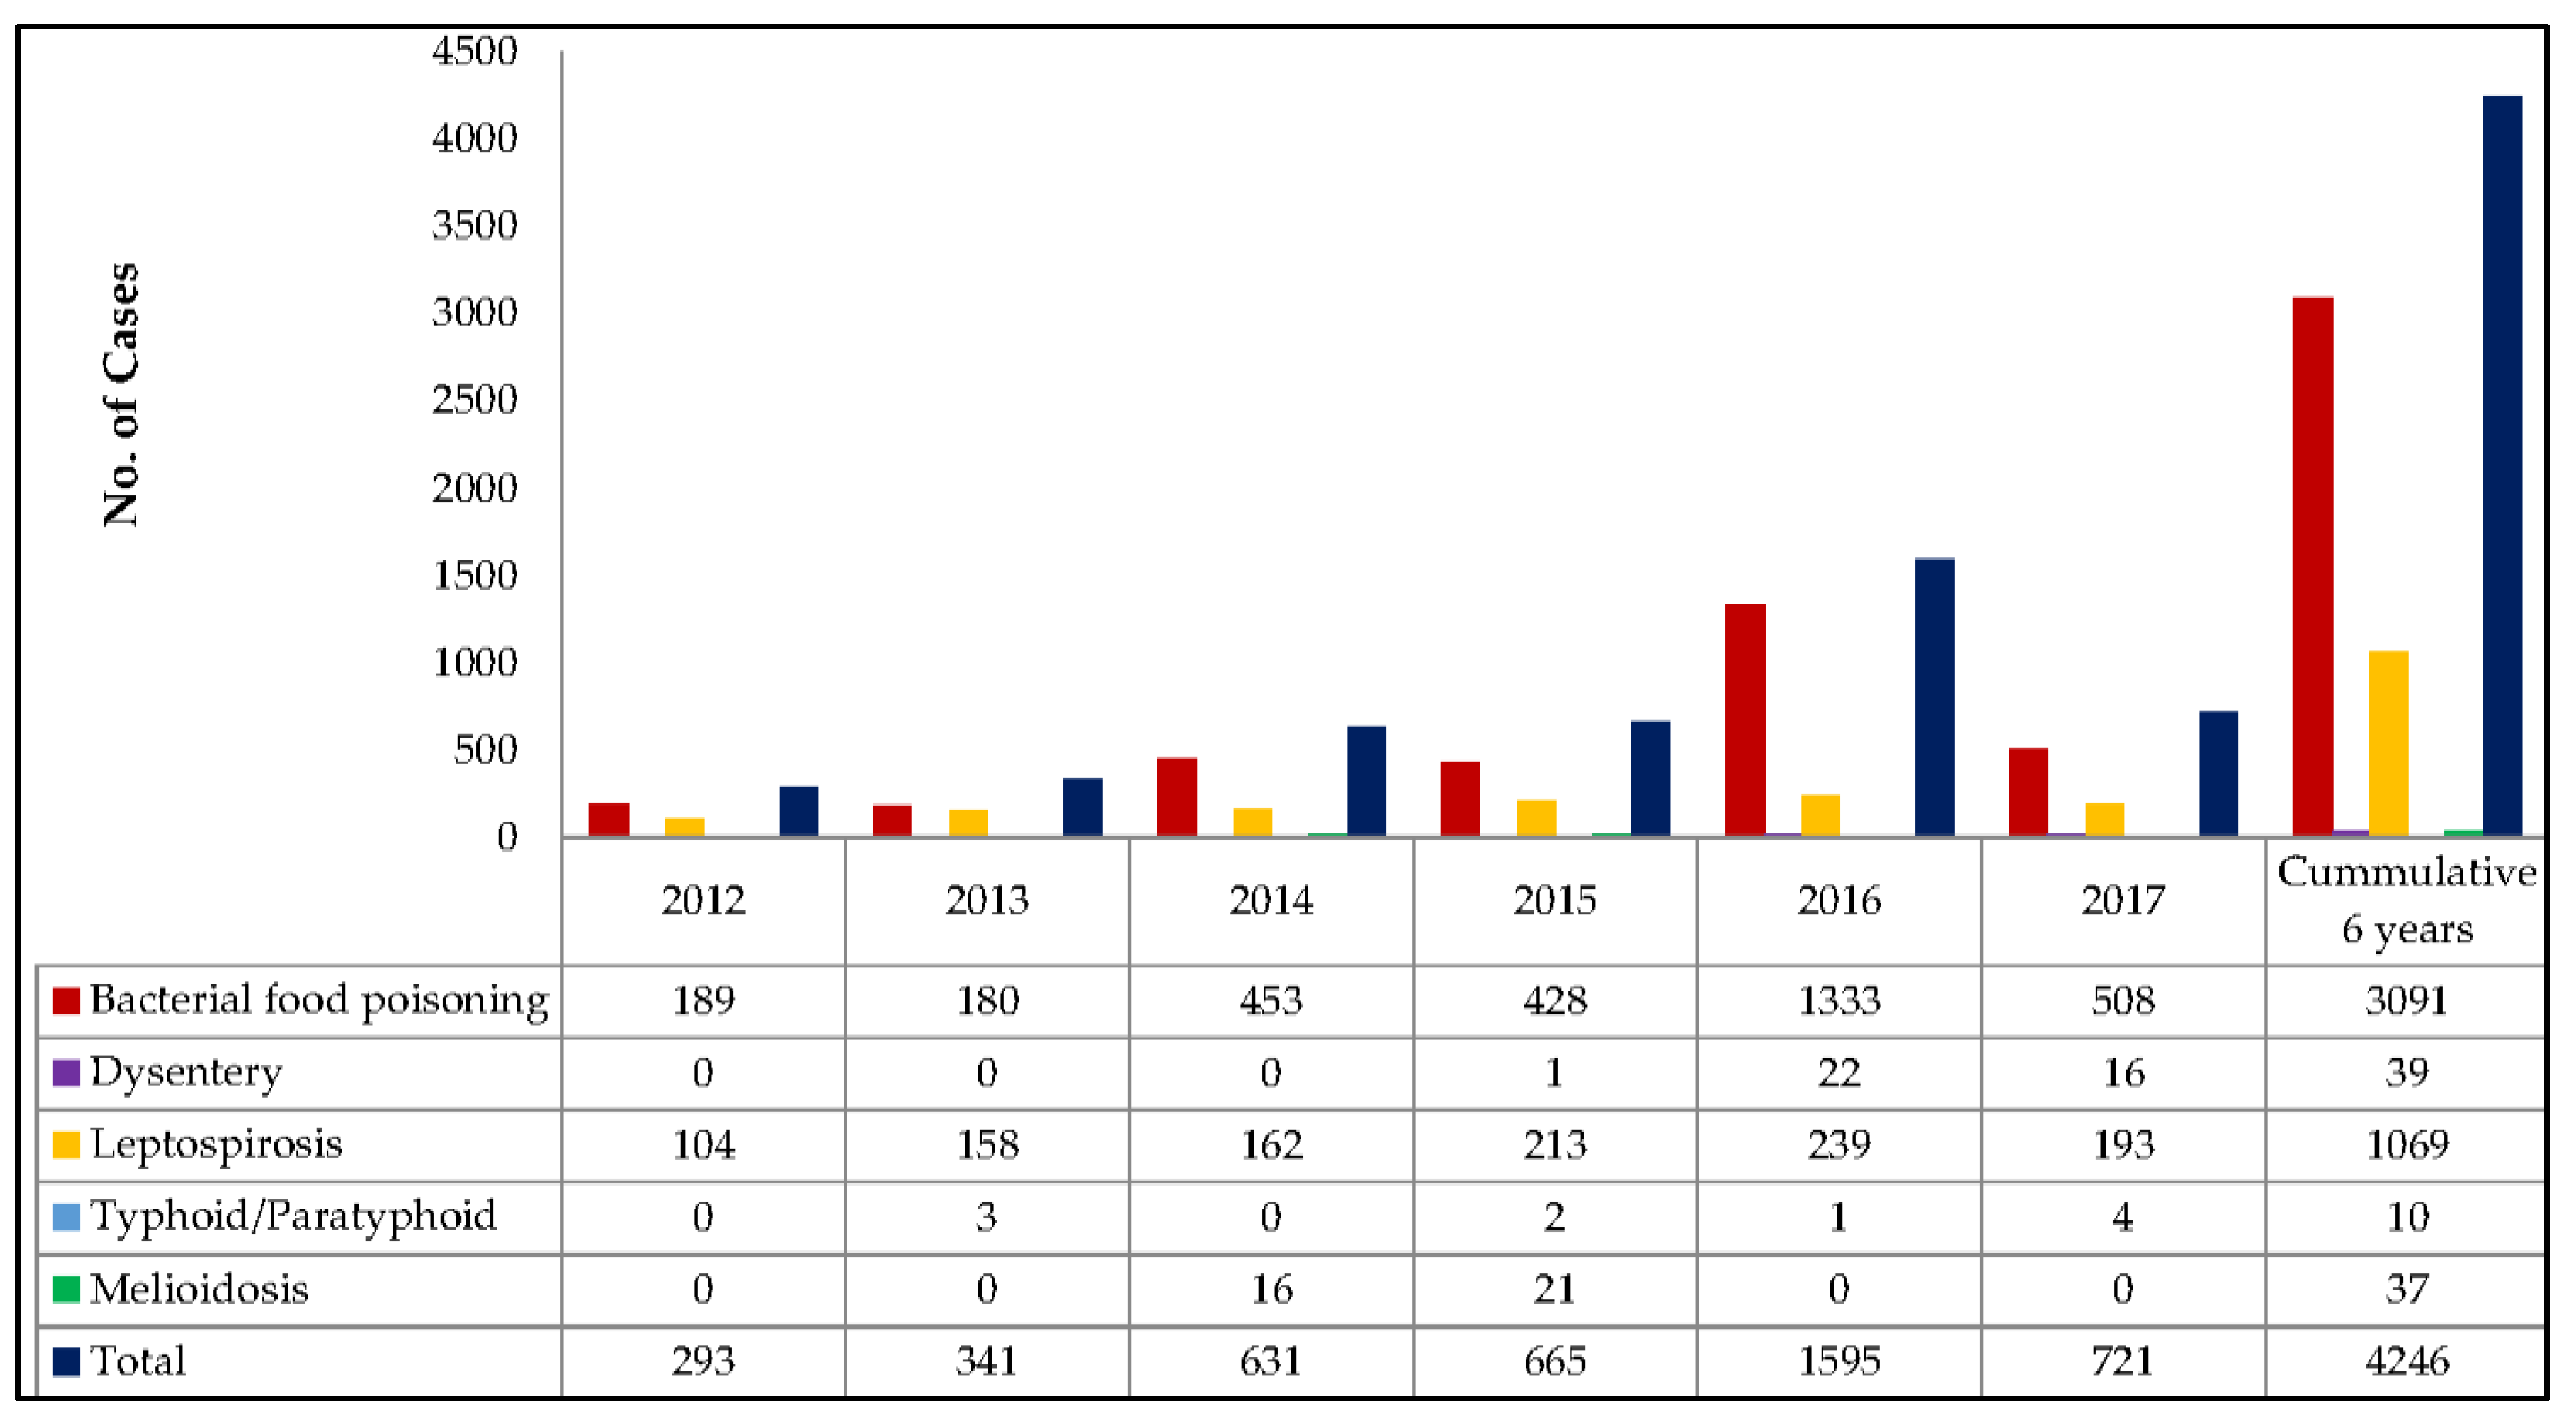
3.2.1. Waterborne Diseases in Pahang, Malaysia
3.2.2. Waterborne Bacterial Detection and Live/Dead Discrimination
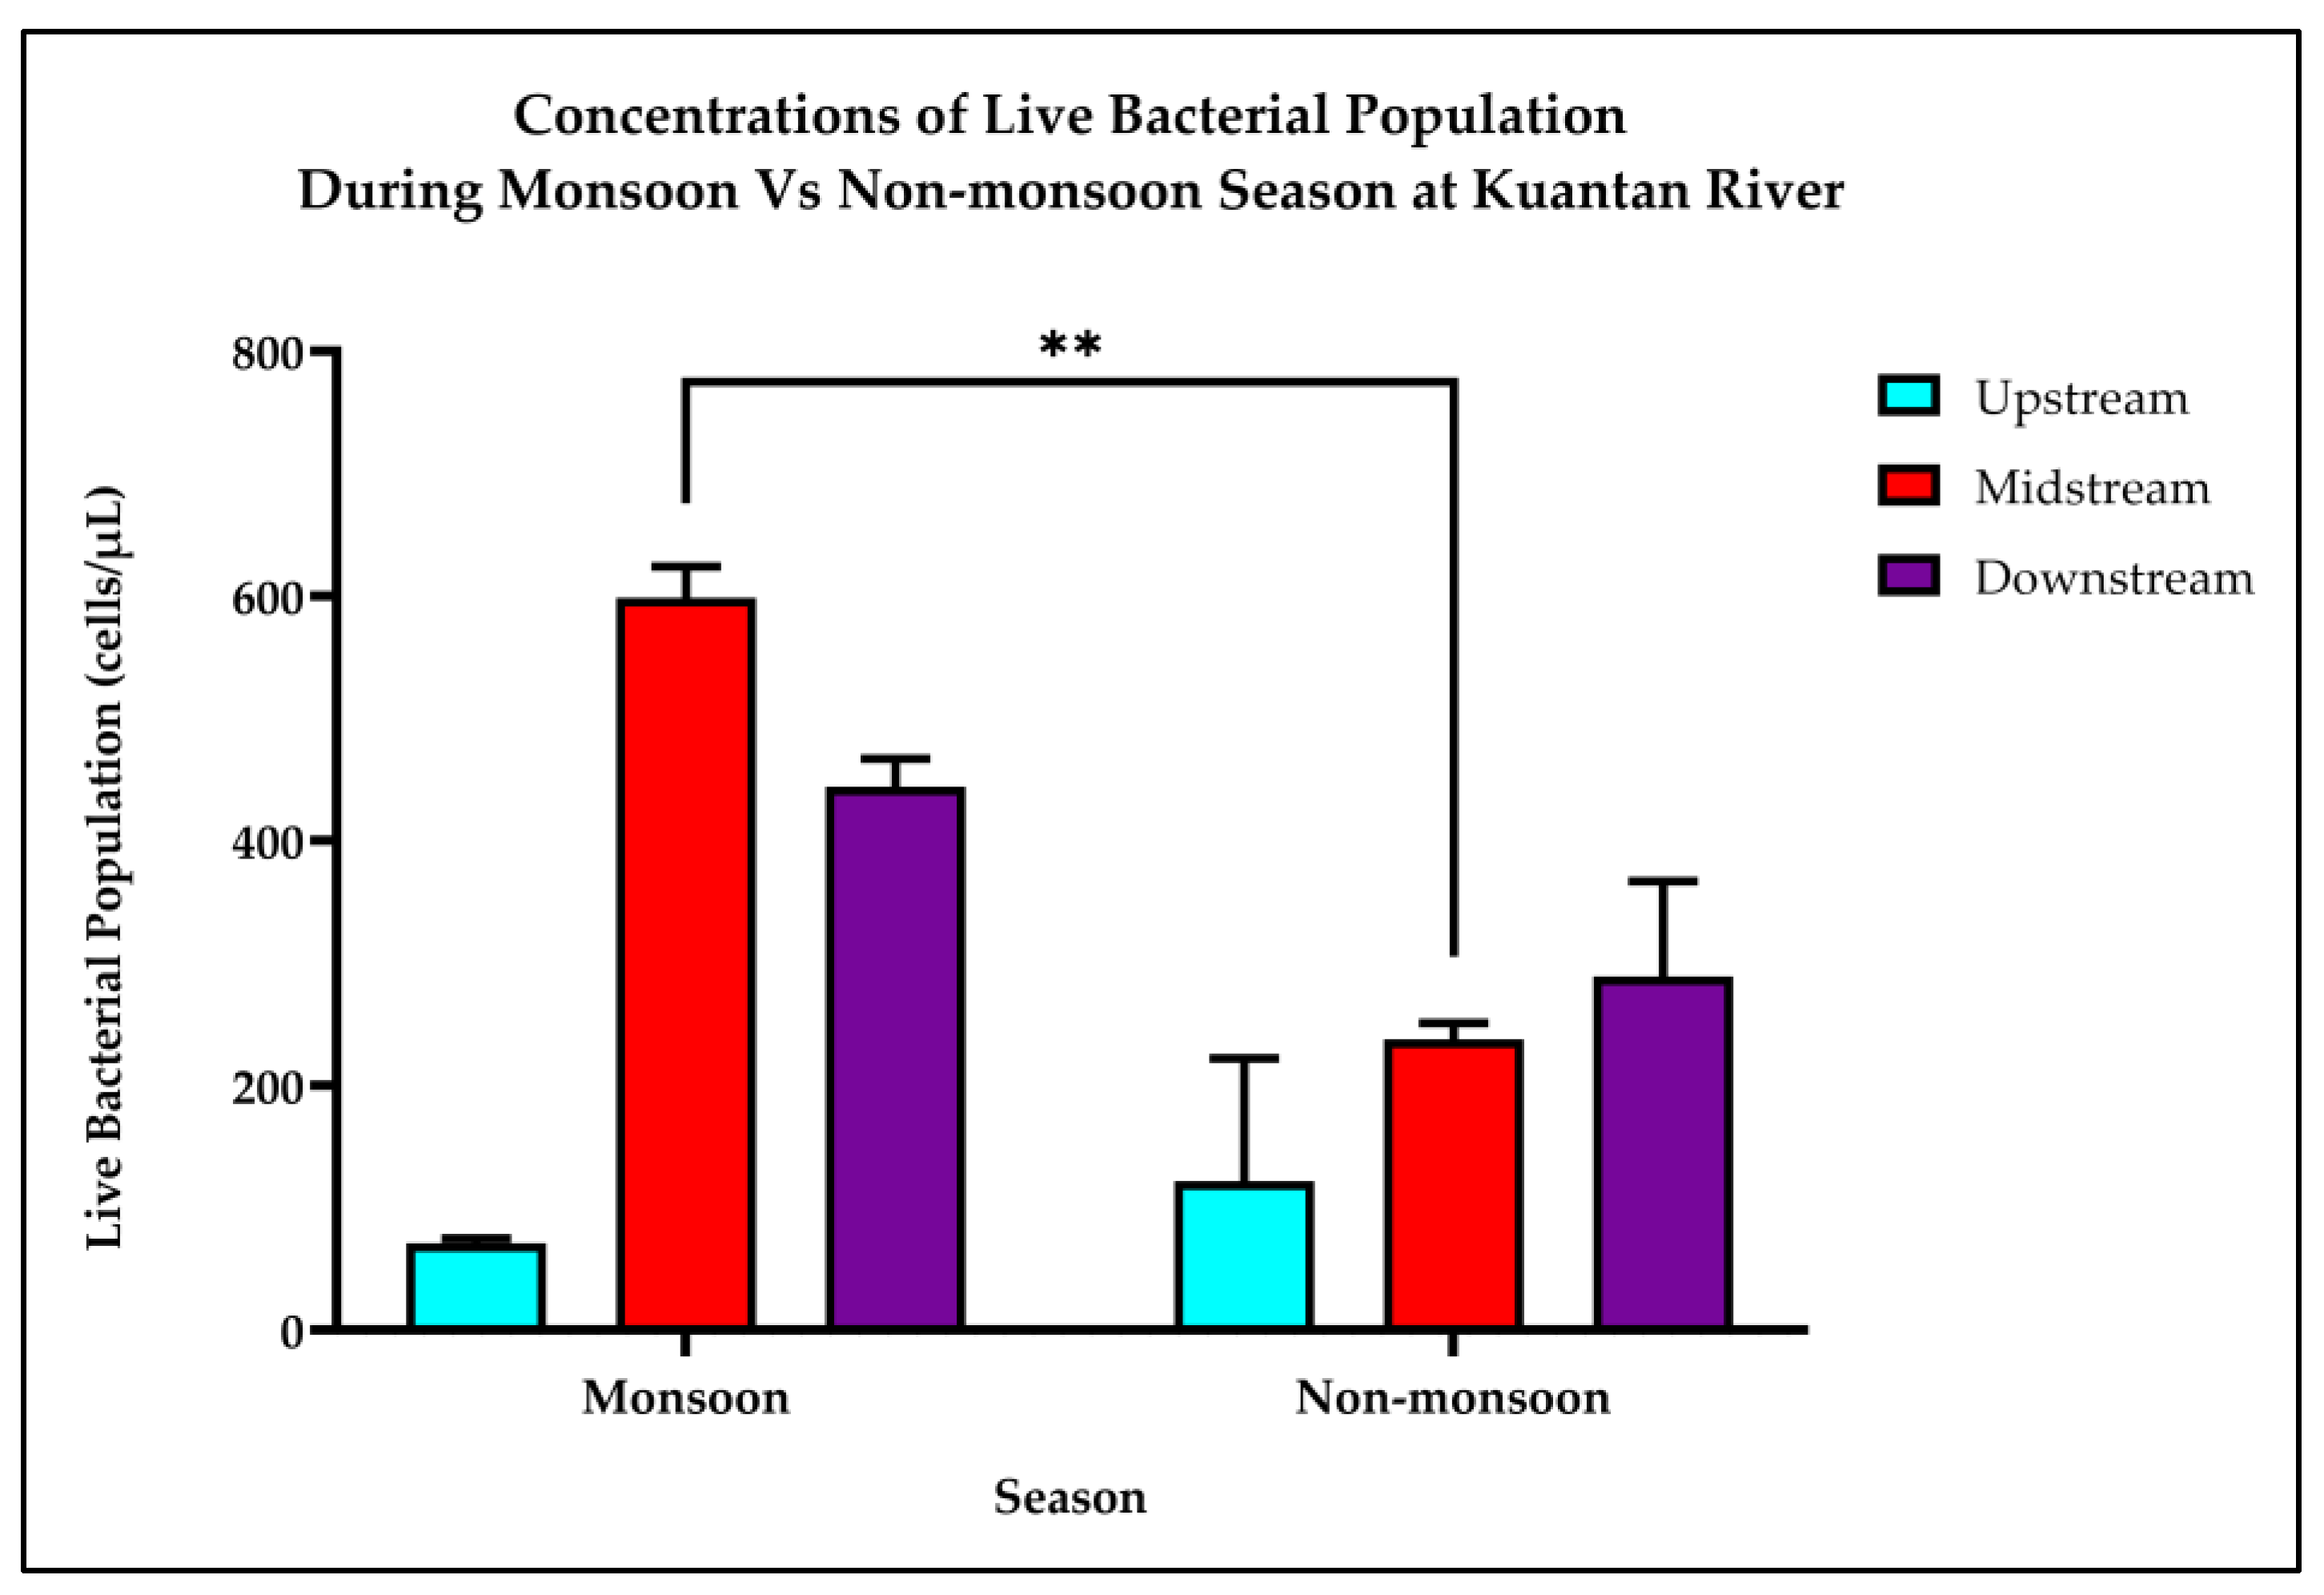
3.2.3. Concentrations of Live Bacterial Population
4. Discussion
4.1. Flood Risk Patterns
4.1.1. The Most Significant Variable Contributing to Flood Occurrences
4.1.2. Flood Patterns for the FRI Model
4.2. Viability of Bacterial Waterborne Pathogens
4.2.1. The Occurrence of Waterborne Bacterial Diseases in Pahang, Malaysia
4.2.2. Bacterial Detection, Live/Dead Discrimination, and Its Association with Waterborne Diseases during Monsoon Season
4.3. Implications for Flood Risk and Flood-Related Disease Management
4.4. Limitations of the Study
4.5. Future Research
5. Conclusions
Author Contributions
Funding
Institutional Review Board Statement
Informed Consent Statement
Data Availability Statement
Acknowledgments
Conflicts of Interest
References
- World Health Organization (WHO). Health Topics: Floods. Available online: https://www.who.int/health-topics/floods#tab=tab_1 (accessed on 17 February 2022).
- Centre for Research on the Epidemiology of Disasters (CRED); United Nations Office for Disaster Risk Reduction (UNISDR). 2018 Review of Disaster Events. Available online: https://www.cred.be/2018-review-disaster-events (accessed on 13 May 2019).
- Guha-Sapir, D.; Hoyois, P.; Wallemacq, P.; Below, R. Annual Disaster Statistical Review 2016: The Numbers and Trends. Available online: https://emdat.be/sites/default/files/adsr_2016.pdf (accessed on 10 March 2019).
- Centre for Research on the Epidemiology of Disasters (CRED). 2021 Disasters in Numbers. Available online: https://cred.be/sites/default/files/2021_EMDAT_report.pdf (accessed on 21 November 2022).
- Keim, M. Floods. In Koenig and Schultz’s Disaster Medicine: Comprehensive Principles and Practices, 2nd ed.; Koenig, K.L., Schultz, C.H., Eds.; Cambridge University Press: Cambridge, UK, 2016; pp. 603–623. ISBN 978-1-107-04075-5. [Google Scholar]
- Wallemacq, P.; House, R.; McClean, D.; Below, R. Economic Losses, Poverty & Disasters: 1998–2017. Available online: https://www.undrr.org/publication/economic-losses-poverty-disasters-1998-2017 (accessed on 24 February 2020).
- Berghuijs, W.R.; Aalbers, E.E.; Larsen, J.R.; Trancoso, R.; Woods, R.A. Recent changes in extreme floods across multiple continents. Environ. Res. Lett. 2017, 12, 114035. [Google Scholar] [CrossRef]
- World Meteorological Organization (WMO). Press Release: Weather-Related Disasters Increase over Past 50 Years, Causing More Damage but Fewer Deaths. Available online: https://public.wmo.int/en/media/press-release/weather-related-disasters-increase-over-past-50-years-causing-more-damage-fewer (accessed on 13 December 2021).
- Department of Irrigation and Drainage (DID). Compendium 2020. Available online: https://www.water.gov.my/jps/resources/kompedium_2020_050121.pdf (accessed on 5 January 2021).
- Iya, S.G.D.; Gasim, M.B.; Toriman, M.E.; Abdullahi, M.G. Floods in Malaysia Historical Reviews, Causes, Effects and Mitigations Approach. Int. J. Interdiscip. Res. Innov. 2014, 2, 59–65. [Google Scholar]
- Shah, S.M.H.; Mustaffa, Z.; Yusof, K.W. Disasters worldwide and floods in the Malaysian region: A brief review. Indian J. Sci. Technol. 2017, 10, 1–9. [Google Scholar] [CrossRef]
- Omran, A.; Schwarz-Herion, O.; Bakar, A.A. Factors Contributing to the Catastrophic Flood in Malaysia. In The Impact of Climate Change on Our Life, 1st ed.; Omran, A., Schwarz-Herion, O., Eds.; Springer: Singapore, 2018; pp. 33–55. ISBN 978-981-10-7748-7. [Google Scholar]
- Majid, N.A.; Razman, M.R.; Zakaria, S.Z.S.; Ahmed, M.F.; Zulkafli, S.A. Flood disaster in Malaysia: Approach review, causes and application of geographic information system (GIS) for Mapping of flood risk area. Copyright@ EM Int. 2021, 27, S1–S8. [Google Scholar]
- Saudi, A.S.M.; Juahir, H.; Azid, A.; Kamarudin, M.K.A.; Kasim, M.F.; Toriman, M.E.; Aziz, N.A.A.; Hasnam, C.N.C.; Samsudin, M.S. Flood Risk Pattern Recognition Using Chemometric Technique: A Case Study in Kuantan River Basin. J. Teknol. 2015, 72, 137–141. [Google Scholar] [CrossRef] [Green Version]
- O’Dwyer, J.; Dowling, A.; Adley, C. The impact of climate change on the incidence of infectious waterborne disease. In Urban Water Reuse Handbook, 1st ed.; Eslamian, S., Ed.; CRC Press Taylor & Francis Group: Boca Raton, FL, USA, 2016; pp. 1017–1026. ISBN 978-1-4822-2915-8. [Google Scholar]
- Allaire, M. Socio-economic impacts of flooding: A review of the empirical literature. Water Secur. 2018, 3, 18–26. [Google Scholar] [CrossRef]
- World Health Organization (WHO). Flooding and Communicable Diseases Fact Sheet. Available online: https://www.who.int/hac/techguidance/ems/flood_cds/en/ (accessed on 4 May 2020).
- Hammer, C.C.; Brainard, J.; Hunter, P.R. Risk factors and risk factor cascades for communicable disease outbreaks in complex humanitarian emergencies: A qualitative systematic review. BMJ Glob. Health 2018, 3, e000647. [Google Scholar] [CrossRef] [Green Version]
- Okaka, F.O.; Odhiambo, B.D.O. Relationship between Flooding and Outbreak of Infectious Diseases in Kenya: A Review of the Literature. J. Environ. Public Health 2018, 2018, 5452938. [Google Scholar] [CrossRef] [Green Version]
- Deshmukh, R.A.; Joshi, K.; Bhand, S.; Roy, U. Recent developments in detection and enumeration of waterborne bacteria: A retrospective minireview. MicrobiologyOpen 2016, 5, 901–922. [Google Scholar] [CrossRef] [Green Version]
- Ramírez-Castillo, F.Y.; Loera-Muro, A.; Jacques, M.; Garneau, P.; Avelar-González, F.J.; Harel, J.; Guerrero-Barrera, A.L. Waterborne pathogens: Detection methods and challenges. Pathogens 2015, 4, 307–334. [Google Scholar] [CrossRef] [Green Version]
- Ahmad, F.; Ushiyama, T.; Sayama, T. Determination of Z-R Relationship and Inundation Analysis for Kuantan River Basin. Malays. Meteorol. Dep. Res. Publ. 2017, 2, 55. [Google Scholar]
- Loganathan, G.; Krishnaraj, S.; Muthumanickam, J.; Ravichandran, K. Chemometric and Trend Analysis of Water Quality of The South Chennai Lakes: An Integrated Environmental Study. J. Chemom. 2015, 29, 59–68. [Google Scholar] [CrossRef]
- Saudi, A.S.M.; Ridzuan, I.S.D.; Balakrishnan, A.; Shukor, D.M.A.; Rizman, Z.I. New Flood Risk Index in Tropical Area Generated by Using SPC Technique. J. Fundam. Appl. Sci. 2017, 9, 828–850. [Google Scholar] [CrossRef] [Green Version]
- Zakaria, N.A.A.; Saudi, A.S.M.; Kamarudin, M.K.A.; Saad, M.H.M. Flood Risk Index Assessment: Case Study in Lenggor River Basin, Johor, Malaysia. Int. J. Eng. Technol. 2018, 7, 473–476. [Google Scholar] [CrossRef]
- Griffin, M.; Naderi, N.; Kalaskar, D.M.; Malins, E.; Becer, R.; Thornton, C.A.; Whitaker, A.S.; Mosahebi, A.; Butler, P.E.M.; Seifalian, A.M. Evaluation of Sterilisation Techniques for Regenerative Medicine Scaffolds Fabricated with Polyurethane Nonbiodegradable and Bioabsorbable Nanocomposite Materials. Int. J. Biomater. 2018, 2018, 6565783. [Google Scholar] [CrossRef] [PubMed]
- Rutala, W.A.; Weber, D.J. Guideline for Disinfection and Sterilization in Healthcare Facilities. Available online: https://www.cdc.gov/infectioncontrol/pdf/guidelines/disinfection-guidelines-H.pdf (accessed on 29 May 2020).
- Bartram, J.; Ballance, R. Water Quality Monitoring: A Practical Guide to the Design and Implementation of Freshwater Quality Studies and Monitoring Programmes, 1st ed.; CRC Press Taylor & Francis: London, UK, 1996; ISBN 0419217304. [Google Scholar]
- Sunar, N.M.; Hamdan, R.; Khalid, A.; Hafizah, N.; Zaidi, E.; Azhar, A.T.S.; Ali, R.; Hamid, H.A.; Hamidon, N.; Harun, H.; et al. In-situ water quality assessment at recreational lake by using grab sampling technique. Sustain. Environ. Technol. 2018, 1, 31–39. [Google Scholar]
- World Health Organization (WHO). Guidelines for Drinking-Water Quality: Surveillance and Control of Community Supplies. Available online: https://www.who.int/water_sanitation_health/dwq/gdwqvol32ed.pdf?ua=1 (accessed on 29 May 2020).
- BD Biosciences. BD FACSCalibur Application Notes. Bacterial Detection and Live/Dead Discrimination by Flow Cytometry. Immunocytometry Systems. Available online: https://www.bdbiosciences.com/content/dam/bdb/marketing-documents/Bacterial_Detection_Live_Dead.pdf (accessed on 29 June 2018).
- Zhang, C.; Chen, X.; Xia, X.; Li, B.; Hung, Y.C. Viability assay of E. coli O157: H7 treated with electrolyzed oxidizing water using flow cytometry. Food Control 2018, 88, 47–53. [Google Scholar] [CrossRef]
- Mălinaș, C.; Oroian, I.; Odagiu, A.; Safirescu, C. Application of Descriptive Statistics in Monitoring Climatic Factors. ProEnvironment 2017, 10, 46–50. [Google Scholar]
- Shafii, N.Z.; Saudi, A.S.M.; Mahmud, M.; Rizman, Z.I. Spatial assessment on ambient air quality status: A case study in Klang, Selangor. J. Fundam. Appl. Sci. 2017, 9, 964–977. [Google Scholar] [CrossRef] [Green Version]
- Shafii, N.Z.; Saudi, A.S.M.; Pang, J.C.; Abu, I.F.; Sapawe, N.; Kamarudin, M.K.A.; Saudi, H.F.M. Application of chemometrics techniques to solve environmental issues in Malaysia. Heliyon 2019, 5, e02534. [Google Scholar] [CrossRef] [Green Version]
- Taber, K.S. The Use of Cronbach’s Alpha When Developing and Reporting Research Instruments in Science Education. Res. Sci. Educ. 2018, 48, 1273–1296. [Google Scholar] [CrossRef] [Green Version]
- Otto, M. Chemometrics: Statistics and Computer Application in Analytical Chemistry, 3rd ed.; John Wiley & Sons: Hoboken, NJ, USA, 2016; ISBN 978-3-527-34097-2. [Google Scholar]
- Mas, S.; Juan, A.; Tauler, R.; Olivieri, A.C.; Escandar, G.M. Application of Chemometric Methods to Environmental Analysis of Organic Pollutants: A Review. Talanta 2010, 80, 1052–1067. [Google Scholar] [CrossRef]
- Qian, C.; Chen, W.; Li, W.H.; Yu, H.Q. A Chemometric Analysis on The Fluorescent Dissolved Organic Matter in A Full-Scale Sequencing Batch Reactor for Municipal Wastewater Treatment. Front. Environ. Sci. Eng. 2017, 11, 12. [Google Scholar] [CrossRef]
- Balasubramanian, A. Surface Water Runoff. Available online: https://www.researchgate.net/publication/320331329_SURFACE_WATER_RUNOFF (accessed on 5 January 2020).
- Zaidee, W.N.A.W.F.; Saudi, A.S.M.; Kamarudin, M.K.A.; Toriman, M.E.; Juahir, H.; Abu, I.F.; Mahmud, M.; Shafii, N.Z.; Nizam, K.; Elfithri, R. Flood risk pattern recognition using chemometric techniques approach in Golok River, Kelantan. Int. J. Eng. Technol. 2018, 7, 75–79. [Google Scholar] [CrossRef]
- Toriman, M.E.; Kamarudin, M.K.A.; Idris, M.; Jamil, N.R.; Gazim, M.B.; Aziz, N.A.A. Sediment Concentration and Load Analyses at Chini River, Pekan, Pahang Malaysia. Res. J. Earth Sci. 2009, 1, 43–500. [Google Scholar]
- Wahab, N.A.; Kamarudin, M.K.A.; Toriman, M.E.; Juahir, H.; Gasim, M.B.; Rizman, Z.I.; Adiana, G.; Saudi, A.S.M.; Sukano, S.; Subartini, B.; et al. Climate changes impacts towards sedimentation rate at Terengganu River, Terengganu, Malaysia. J. Fundam. Appl. Sci. 2018, 10, 33–51. [Google Scholar]
- Kandari, P.N.A.; Saudi, A.S.M.; Chyang, P.J.; Kamarudin, M.K.A.; Saad, M.H.M.; Azid, A.; Saudi, N.S.M.; Mahmud, M. Flood Risk Pattern Recognition Analysis in Klang River Basin. Int. J. Eng. Technol. 2018, 7, 86–90. [Google Scholar] [CrossRef]
- Gharibreza, M.; Raj, J.K.; Yusoff, I.; Ashraf, M.A.; Othman, Z.; Tahir, W.Z.W.M. Effects of agricultural projects on nutrient levels in Lake Bera (Tasek Bera), Peninsular Malaysia. Agric. Ecosyst. Environ. 2013, 165, 19–27. [Google Scholar] [CrossRef]
- Dobriyal, P.; Badola, R.; Tuboi, C.; Hussain, S.A. A review of methods for monitoring streamflow for sustainable water resource management. Appl. Water Sci. 2017, 7, 2617–2628. [Google Scholar] [CrossRef] [Green Version]
- McGrane, S.J. Impacts of urbanisation on hydrological and water quality dynamics, and urban water management: A review. Hydrol. Sci. J. 2016, 61, 2295–2311. [Google Scholar] [CrossRef] [Green Version]
- Ligtenberg, J. Runoff Changes due to Urbanization: A Review. Master’s Thesis, Umeå University, Umeå, Sweden, 2017. [Google Scholar]
- Lun, P.I.; Gasim, M.B.; Toriman, M.E.; Rahim, S.A.; Kamaruddin, K.A. Hydrological pattern of Pahang River Basin and their relation to flood historical event. e-BANGI 2011, 8, 29–37. [Google Scholar]
- Sulaiman, N.H.; Kamarudin, M.K.A.; Toriman, M.E.; Juahir, H.; Ata, F.M.; Azid, A.; Wahab, N.J.A.; Umar, R.; Khalit, S.I.; Makhtar, M.; et al. Relationship of Rainfall Distribution and Water Level on Major Flood 2014 in Pahang River Basin, Malaysia. EnvironmentAsia 2017, 10, 1–8. [Google Scholar] [CrossRef]
- Mishra, V.; Aaadhar, S.; Shah, H.; Kumar, R.; Pattanaik, D.R.; Tiwari, A.D. The Kerala flood of 2018: Combined impact of extreme rainfall and reservoir storage. Hydrol. Earth Syst. Sci. Discuss. 2018. preprint. [Google Scholar] [CrossRef] [Green Version]
- David, A.; Schmalz, B. Flood hazard analysis in small catchments: Comparison of hydrological and hydrodynamic approaches by the use of direct rainfall. J. Flood Risk Manag. 2020, 13, e12639. [Google Scholar] [CrossRef]
- Ismail, A.; Saudi, A.S.M.; Kamarudin, M.K.A.; Saad, M.H.M.; Azid, A.; Saudi, N.S.M.; Mahmud, M. New Approach in Analyzing Risk Level of Flood in Tropical Region: A Case Study at Pahang River Basin, Malaysia. Int. J. Eng. Technol. 2018, 7, 103–107. [Google Scholar] [CrossRef]
- Romali, N.S. Flood Damage Function Model for Residential area in Kuantan: A Preliminary Study. Int. J. Integr. Eng. 2019, 11, 203–213. [Google Scholar] [CrossRef] [Green Version]
- Ni, L.; Khin, M. The Probability Distributions of Daily Rainfall for Kuantan River Basin in Malaysia. Int. J. Sci. Res. 2012, 4, 977–983. [Google Scholar]
- Zaidi, S.M.; Akbari, A.; Ishak, W.M.F. A Critical Review of Floods History in Kuantan River Basin: Challenges and Potential Solutions. Int. J. Civ. Environ. Eng. 2014, 5, 1–5. [Google Scholar]
- Robinson, J.P. Overview of Flow Cytometry and Microbiology. Curr. Protoc. Cytom. 2018, 84, e37. [Google Scholar] [CrossRef]
- Department of Statistics Malaysia (DOSM). Compendium of Environment Statistics (CES) 2016. Available online: https://www.dosm.gov.my/v1/index.php?r=column/pdfPrev&id=MTZVTGQycmc4azNuaDl6NGdhUjZoZz09 (accessed on 18 July 2019).
- New, C.Y.; Ubong, A.; Premarathne, J.M.K.J.K.; Thung, T.Y.; Lee, E.; Chang, W.S.; Loo, Y.Y.; Kwan, S.Y.; Tan, C.W.; Kuan, C.H.; et al. Microbiological food safety in Malaysia from the academician’s perspective. Food Res. 2017, 1, 183–202. [Google Scholar] [CrossRef]
- Packierisamy, P.R.; Haron, R.R.; Mustafa, M.; Mahir, A.H.; Ayob, A.; Balan, V. Outbreak caused by food-borne Salmonella enterica serovar Enteriditis in a residential school in Perak state, Malaysia in April 2016. Int. Food Res. J. 2018, 25, 2379–2384. [Google Scholar]
- Naing, C.; Reid, S.A.; Aye, S.N.; Htet, N.H.; Ambu, S. Risk factors for human leptospirosis following flooding: A meta-analysis of observational studies. PLoS ONE 2019, 14, e0217643. [Google Scholar] [CrossRef]
- Sapian, M.; Khairi, M.T.; How, S.H.; Rajalingam, R.; Sahhir, K.; Norazah, A.; Kebir, V.; Jamalludin, A.R. Outbreak of Melioidosis and Leptospirosis Co-infection Following a Rescue Operation. Med. J. Malaysia 2012, 67, 293–297. [Google Scholar] [PubMed]
- Radi, M.F.M.; Hashim, J.H.; Jaafar, M.H.; Hod, R.; Ahmad, N.; Nawi, A.M.; Baloch, G.M.; Ismail, R.; Ayub, N.I.F. Leptospirosis outbreak after the 2014 major flooding event in Kelantan, Malaysia: A spatial-temporal analysis. Am. J. Trop. Med. 2018, 98, 1281–1295. [Google Scholar] [CrossRef] [PubMed] [Green Version]
- Gurpreet, K.; Tee, G.H.; Amal, N.M.; Paramesarvathy, R.; Karuthan, C. Incidence and determinants of acute diarrhoea in Malaysia: A population-based study. J. Health Popul. Nutr. 2011, 29, 103–112. [Google Scholar] [CrossRef] [Green Version]
- Woh, P.Y.; Thong, K.L.; Lim, Y.A.L.; Behnke, J.M.; Lewis, J.W.; Mohd Zain, S.N. Microorganisms as an Indicator of Hygiene Status Among Migrant Food Handlers in Peninsular Malaysia. Asia Pac. J. Public Health. 2017, 29, 599–607. [Google Scholar] [CrossRef]
- Ruby, G.E.; Abidin, U.F.U.Z.; Lihan, S.; Jambari, N.N.; Radu, S. Self-reported Food Safety Practices Among Adult Consumers in Sibu, Malaysia: A Cross-sectional Study. Food Prot. Trends 2019, 39, 366–376. [Google Scholar] [CrossRef]
- Ministry of Health Malaysia (MOH). Laporan Tahunan Kementerian Kesihatan Malaysia 2018. Available online: https://www.moh.gov.my/moh/resources/Penerbitan/Penerbitan%20Utama/ANNUAL%20REPORT/Laporan%20Tahunan%20KKM%202018_Final.pdf (accessed on 11 July 2019).
- Nathan, S.; Chieng, S.; Kingsley, P.V.; Mohan, A.; Podin, Y.; Ooi, M.H.; Mariappan, V.; Vellasamy, K.M.; Vadivelu, J.; Daim, S.; et al. Melioidosis in Malaysia: Incidence, Clinical Challenges, and Advances in Understanding Pathogenesis. Trop. Med. Infect. Dis. 2018, 3, 25. [Google Scholar] [CrossRef] [Green Version]
- Akhir, M.Y.M.; Nor, F.M.; Ibrahim, M.I.I.; Shafei, M.N. Association between Environmental Factors and Typhoid Fever Post Massive Flood in Northeastern Malaysia. World Appl. Sci. J. 2018, 36, 799–805. [Google Scholar]
- Rzymski, P.; Poniedziałek, B. Applications of Flow Cytometry in Environmental Sciences: Inspiring Examples. In Flow Cytometry: Principles, Methodology and Applications, 1st ed.; Papandreou, S., Ed.; Nova Science Publishers: Hauppauge, NY, USA, 2013; pp. 105–112. ISBN 978-1-62808-709-3. [Google Scholar]
- Ambriz-Aviña, V.; Contreras-Garduño, J.A.; Pedraza-Reyes, M. Applications of flow cytometry to characterize bacterial physiological responses. Biomed. Res. Int. 2014, 2014, 461941. [Google Scholar] [CrossRef] [Green Version]
- Frossard, A.; Hammes, F.; Gessner, M.O. Flow cytometric assessment of bacterial abundance in soils, sediments and sludge. Front. Microbiol. 2016, 7, 903. [Google Scholar] [CrossRef] [PubMed]
- Besmer, M.D.; Epting, J.; Page, R.M.; Sigrist, J.A.; Huggenberger, P.; Hammes, F. Online flow cytometry reveals microbial dynamics influenced by concurrent natural and operational events in groundwater used for drinking water treatment. Sci. Rep. 2016, 6, 38462. [Google Scholar] [CrossRef] [PubMed]
- Van Nevel, S.; Koetzsch, S.; Proctor, C.R.; Besmer, M.D.; Prest, E.I.; Vrouwenvelder, J.S.; Knezev, A.; Boon, N.; Hammes, F. Flow cytometric bacterial cell counts challenge conventional heterotrophic plate counts for routine microbiological drinking water monitoring. Water Res. 2017, 113, 191–206. [Google Scholar] [CrossRef] [PubMed] [Green Version]
- Fiedler, C.J.; Schönher, C.; Proksch, P.; Kerschbaumer, D.J.; Mayr, E.; Zunabovic-Pichler, M.; Domig, K.J.; Perfler, R. Assessment of microbial community dynamics in river bank filtrate using high-throughput sequencing and flow cytometry. Front. Microbiol. 2018, 9, 2887. [Google Scholar] [CrossRef]
- Cheswick, R.; Cartmell, E.; Lee, S.; Upton, A.; Weir, P.; Moore, G.; Nocker, A.; Jefferson, B.; Jarvis, P. Comparing flow cytometry with culture-based methods for microbial monitoring and as a diagnostic tool for assessing drinking water treatment processes. Environ. Int. 2019, 130, 104893. [Google Scholar] [CrossRef] [PubMed]
- Tandon, R. Quantitative and FACS Analysis of Bacterial and Fungal Communities in Indoor Environment. Master’s Thesis, San Diego State University, San Diego, CA, USA, 2018. [Google Scholar]
- Ou, F.; McGoverin, C.; Swift, S.; Vanholsbeeck, F. Near real-time enumeration of live and dead bacteria using a fibre-based spectroscopic device. Sci. Rep. 2019, 9, 4807. [Google Scholar] [CrossRef] [PubMed] [Green Version]
- Li, R.; Dhankhar, D.; Chen, J.; Krishnamoorthi, A.; Cesario, T.C.; Rentzepis, P.M. Identification of live and dead bacteria: A Raman spectroscopic study. IEEE Access 2019, 7, 23549–23559. [Google Scholar] [CrossRef]
- Overgaard, H.J.; Dada, N.; Lenhart, A.; Stenström, T.A.B.; Alexander, N. Integrated disease management: Arboviral infections and waterborne diarrhoea. Bull. World Health Organ. 2021, 99, 583–592. [Google Scholar] [CrossRef]
- Ascott, M.J.; Lapworth, D.J.; Gooddy, D.C.; Sage, R.C.; Karapanos, I. Impacts of extreme flooding on riverbank filtration water quality. Sci. Total Environ. 2016, 554, 89–101. [Google Scholar] [CrossRef] [Green Version]
- Manetu, W.M.; Karanja, A.M. Waterborne Disease Risk Factors and Intervention Practices: A Review. Open Access Libr. J. 2021, 8, 1–11. [Google Scholar] [CrossRef]
- Yusof, N.; Hamid, N.; Ma, Z.F.; Lawenko, R.M.; Mohammad, W.M.Z.W.; Collins, D.A.; Liong, T.M.; Odamaki, T.; Xiao, J.; Lee, Y.Y. Exposure to environmental microbiota explains persistent abdominal pain and irritable bowel syndrome after a major flood. Gut Pathog. 2017, 9, 75. [Google Scholar] [CrossRef] [PubMed] [Green Version]
- Maquart, P.O.; Froehlich, Y.; Boyer, S. Plastic pollution and infectious diseases. Lancet Planet. Health 2022, 6, e842–e845. [Google Scholar] [CrossRef]
- Paterson, D.L.; Wright, H.; Harris, P.N. Health risks of flood disasters. Clin. Infect. Dis. 2018, 67, 1450–1454. [Google Scholar] [CrossRef] [PubMed] [Green Version]
- Kingsley, P.V.; Leader, M.; Nagodawithana, N.S.; Tipre, M.; Sathiakumar, N. Melioidosis in Malaysia: A Review of Case Reports. PLoS Negl. Trop. Dis. 2016, 10, e0005182. [Google Scholar] [CrossRef] [PubMed]
- Zueter, A.; Yean, C.Y.; Abumarzouq, M.; Rahman, Z.A.; Deris, Z.Z.; Harun, A. The epidemiology and clinical spectrum of melioidosis in a teaching hospital in a North-Eastern state of Malaysia: A fifteen-year review. BMC Infect. Dis. 2016, 16, 333. [Google Scholar] [CrossRef] [Green Version]
- Islam, R.; Kamaruddin, R.; Ahmad, S.A.; Jan, S.; Anuar, A.R. A review on mechanism of flood disaster management in Asia. Int. Rev. Manag. Mark. 2016, 6, 29–52. [Google Scholar]
- Muzamil, S.A.H.B.S.; Zainun, N.Y.; Ajman, N.N.; Sulaiman, N.; Khahro, S.H.; Rohani, M.M.; Mohd, S.M.B.; Ahmad, H. Proposed Framework for the Flood Disaster Management Cycle in Malaysia. Sustainability 2022, 14, 4088. [Google Scholar] [CrossRef]
- Yusoff, I.M.; Ramli, A.; Alkasirah, N.A.M.; Nasir, N.M. Exploring the managing of flood disaster: A Malaysian perspective. Geogr. Malays. J. Soc. Space. 2018, 14, 24–36. [Google Scholar] [CrossRef]
- Mostafiz, R.B.; Rohli, R.V.; Friedland, C.J.; Lee, Y.C. Actionable information in flood risk communications and the potential for new web-based tools for long-term planning for individuals and community. Front. Earth Sci. 2022, 10, 840250. [Google Scholar] [CrossRef]
- Seebauer, S.; Babcicky, P. Trust and the communication of flood risks: Comparing the roles of local governments, volunteers in emergency services, and neighbours. J. Flood Risk Manag. 2018, 11, 305–316. [Google Scholar] [CrossRef] [Green Version]
- Zakaria, S.F.; Zin, R.M.; Mohamad, I.; Balubaid, S.; Mydin, S.H.; Mdr, E.M.R. The development of flood map in Malaysia. AIP Conf. Proc. 2017, 1903, 110006. [Google Scholar] [CrossRef] [Green Version]
- Randle-Boggis, R.J.; Ashton, P.D.; Helgason, T. Increasing flooding frequency alters soil microbial communities and functions under laboratory conditions. MicrobiologyOpen 2018, 7, e00548. [Google Scholar] [CrossRef] [PubMed]
- Doering, M.; Freimann, R.; Antenen, N.; Roschi, A.; Robinson, C.T.; Rezzonico, F.; Smits, T.H.; Tonolla, D. Microbial communities in floodplain ecosystems in relation to altered flow regimes and experimental flooding. Sci. Total Environ. 2021, 788, 147497. [Google Scholar] [CrossRef] [PubMed]
- See, K.L.; Nayan, N.; Rahaman, Z.A. Flood Disaster Water Supply: A Review of Issues and Challenges in Malaysia. Int. J. Acad. Res. Bus. Soc. Sci. 2017, 7, 525–532. [Google Scholar] [CrossRef] [PubMed] [Green Version]


| Descriptive Category | Hydrological Variable | |||
|---|---|---|---|---|
| Water Level (m) | Stream Flow (m3/s) | Suspended Sediment (Tons/Day) | Rainfall (mm) | |
| Minimum | 15.75 | 2.80 | 1.40 | 0.00 |
| Maximum | 24.69 | 2164.00 | 3985.70 | 83.30 |
| Mean | 17.10 | 51.86 | 846.42 | 0.29 |
| Median | 16.98 | 29.60 | 144.40 | 0.00 |
| Standard Deviation | 0.65 | 94.16 | 1143.19 | 1.98 |
| Coefficient of Variation | 0.04 | 1.82 | 1.35 | 6.83 |
| Variable | F1 | F2 |
|---|---|---|
| Water Level (m) | 0.981 * | 0.002 |
| Stream Flow (m3/s) | 0.973 * | 0.073 |
| Rainfall (mm) | 0.073 | −0.110 |
| Suspended Sediment (Tons/Day) | 0.179 | −0.355 |
| Eigenvalue | 1.947 | 0.144 |
| Variability (%) | 48.675 | 3.591 |
| Cumulative (%) | 48.675 | 52.267 |
| Cronbach’s alpha | 0.977 | 0.102 |
| Prediction Model | Hidden Node | Train | Validation | ||
|---|---|---|---|---|---|
| R2 | RMSE | R2 | RMSE | ||
| Water Level-FRI | 1 | 0.999918 | 0.002858 | 0.999929 | 0.002860 |
| 2 | 0.999925 | 0.002861 | 0.999934 | 0.002863 | |
| 3 | 0.999937 | 0.002855 | 0.999949 | 0.002856 | |
| 4 | 0.999937 | 0.002855 | 0.999949 | 0.002856 | |
| 5 | 0.999937 | 0.002855 | 0.999953 | 0.002855 | |
Disclaimer/Publisher’s Note: The statements, opinions and data contained in all publications are solely those of the individual author(s) and contributor(s) and not of MDPI and/or the editor(s). MDPI and/or the editor(s) disclaim responsibility for any injury to people or property resulting from any ideas, methods, instructions or products referred to in the content. |
© 2023 by the authors. Licensee MDPI, Basel, Switzerland. This article is an open access article distributed under the terms and conditions of the Creative Commons Attribution (CC BY) license (https://creativecommons.org/licenses/by/4.0/).
Share and Cite
Shafii, N.Z.; Saudi, A.S.M.; Pang, J.C.; Abu, I.F.; Sapawe, N.; Kamarudin, M.K.A.; Mohamad, M.H.N. Association of Flood Risk Patterns with Waterborne Bacterial Diseases in Malaysia. Water 2023, 15, 2121. https://doi.org/10.3390/w15112121
Shafii NZ, Saudi ASM, Pang JC, Abu IF, Sapawe N, Kamarudin MKA, Mohamad MHN. Association of Flood Risk Patterns with Waterborne Bacterial Diseases in Malaysia. Water. 2023; 15(11):2121. https://doi.org/10.3390/w15112121
Chicago/Turabian StyleShafii, Nur Zahidah, Ahmad Shakir Mohd Saudi, Jyh Chyang Pang, Izuddin Fahmy Abu, Norzahir Sapawe, Mohd Khairul Amri Kamarudin, and Mohamad Haiqal Nizar Mohamad. 2023. "Association of Flood Risk Patterns with Waterborne Bacterial Diseases in Malaysia" Water 15, no. 11: 2121. https://doi.org/10.3390/w15112121