1. Introduction
The availability of water is a determining factor in economic development. According to the 2021 China Water Resources Bulletin, China’s average total water resources are estimated at 2.75 trillion m
, which accounts for only 6% of the global total [
1]. The per capita water resources in China are only one-fourth of the world average, making it one of the lowest levels globally. Nonetheless, these limited water resources support China’s significant share of the global economy, at approximately 18%. This has been made possible through a series of policies and measures implemented by the Chinese government [
2]. However, the challenge of water scarcity is exacerbated by the increasing impacts of climate change and environmental pollution [
3], particularly in developing countries such as China, posing present and future challenges. To tackle this challenge, the use of price and taxation mechanisms as regulatory tools to influence water behavior and demand has emerged as a crucial instrument in water management policy-making [
4,
5]. Taxing water users is considered a significant policy option to promote water conservation and the rational development and utilization of groundwater, while mitigating ecological imbalances resulting from excessive groundwater exploitation [
6]. Many countries have adopted water taxes as an economic tool to regulate and safeguard water utilization [
7,
8]. By harnessing market mechanisms, these nations aimed to enhance the sustainability of water use. Accordingly, the Chinese government is currently reforming its 32-year-old water fee policy, replacing it with a more stringent water resources tax as part of the “fee-to-tax” policy reform for water resources management.
The Chinese government has implemented a pilot reform of water resources tax policies in 10 provinces in two batches. Hebei Province was the first pilot province to actively respond to the national water resources tax reform, issuing the Hebei Water Conservation Plan in July 2016, which included the water resources tax as a key measure [
9]. Since the implementation of the water resources tax reform, the continuous growth of total water consumption in Hebei Province has been curbed, with the groundwater level rebounding [
10]. Additionally, this policy has also encouraged water-dependent industries to pursue lower-cost water sources to replace more expensive ones, such as using surface water instead of groundwater and unconventional water instead of conventional water [
11]. Building on the success achieved in the first pilot province, in November 2017, China added nine regions, including Beijing and Tianjin, as the second batch of pilot water resources tax reforms, to further explore the effect of water resources tax reform in different regions and to demonstrate the feasibility of a unified promotion of water resources tax reform policy throughout the country [
12]. However, there have been few studies on the comprehensive evaluation of the implementation effect of the water resources tax in China. Cruz and Marques [
13] have presented a comprehensive assessment framework concerning the sustainability of government management capacity. By dividing the assessment into nine criteria, they provided the scorecards to evaluate government performance, aiding in the determination of their societal, economic, and environmental contributions. This underscores the significance of evaluating the effectiveness of policy implementation to enhance government performance, thereby promoting sustainable management. Moreover, governments hold an irreplaceable role in the administration of water resources tax. As the sole authority responsible for granting water extraction permits, they have the power to determine the magnitude of the water resources tax, which can vary from high rates to zero, depending on national policy goals. The water resources tax reform is an important potential measure to improve the utilization of water resources and promote green development. The evaluation of its water saving and economic impact (WSEI) has become a prerequisite for the smooth implementation of the water resources tax reform policy. Moreover, it can also provide a scientific and reasonable reference for the wide-scale adoption of water resources tax policy and reflect the government’s sustainable performance from an indirect perspective, which holds practical significance.
Water resources tax is a type of resource tax that falls under the broader category of green taxes [
14]. Resource taxes have attracted scholarly attention since the 1920s, with the recognition that the exploitation of natural resources should be subject to taxation to compensate for the depletion of resources and environmental damage [
15]. This formed the theoretical foundation for the imposition of resource taxes. The development of green taxes occurred relatively late in China, with the introduction of resource taxes in 1984 [
16]. Only seven types of resources, including coal, petroleum, and natural gas, were subject to taxation, but water resources were not included [
17]. To better manage and govern water resources, China has gradually promoted water resources tax reform and improved the scope of taxation [
18]. Assessing the impact of water resources tax reform requires not only the consideration of water conservation effects but also accounting for the macroeconomic impact, as the imposition of the tax indirectly raises users’ water costs [
19]. Therefore, selecting effective evaluation tools to quantitatively simulate and assess tax reform effects is crucial. The computable general equilibrium (CGE) model provides researchers with a feasible path with which to achieve this [
20].
From the perspective of research subjects, CGE models have been widely adopted in the study of carbon taxes and environmental tax policies. For instance, Yingzhu Li et al. [
21] developed a city-level CGE model to simulate the potential impacts of carbon pricing on Singapore’s coastal cities, including border carbon adjustments for export payments or the introduction of domestic carbon taxes. Gen Li et al. [
22] established a CGE model that includes an independent pollution emission treatment department to describe pollution treatment processes and their impact on policy, and assess China’s latest environmental tax policies. In terms of water resources management, CGE models are mainly used for water pricing [
23,
24,
25], restricted water supply [
26,
27], and water rights trade [
28,
29] policy evaluation. Only a few studies have employed CGE models to examine water resources tax reform, including optimal tax rate, water conservation effect, and economic impact [
30,
31]. However, the substitution relationships between different water sources has been overlooked in this water resources tax research. According to the principle of cost minimization, users will explore lower-cost water sources to replace high-cost ones and reduce the impact on sectoral output. Therefore, these studies may exaggerate the negative effects of water resources tax reform on the economy, and decision-makers may hinder the implementation of water resources tax policies due to concerns about their impact on economic and social development.
Through literature review and analysis, the CGE model has demonstrated remarkable performance in the study of resources tax reform and water resources management, providing a solid research foundation and analytical framework for water resources tax policy simulation and analysis. However, there remain three questions to be answered in the current research on water resources tax: (1) What are the impacts of water resources tax reform policies that consider the substitution between multiple types of water on water use and the economy? (2) Building on question (1), what are the differences in implementing different tax rates between high water-consuming industries and general water users? (3) If levying a water resources tax has a negative impact on the economy, can the impact be alleviated through subsidies? This study’s main contribution will focus on addressing these three questions. So, the novelty of this study lies in its comprehensive investigation of the implications of integrating multiple types of water production modules into a CGE model, with a specific focus on the impacts of water resources tax reform policy. By constructing the independent water resources account and formulating water resources tax equations, this research provides a quantitative analysis of the resultant changes in both water conservation and economic output. The findings of this study serve as a valuable reference for other regions seeking to develop and implement water resources tax policies, offering critical insights into the necessary preliminary assessments and considerations.
The other sections of this article are organized as follows:
Section 2 introduces the structure of the CGE model, including the equations and methods used to integrate multiple types of water into the model, as well as the representation of the water resources tax.
Section 3 presents the construction of the database and the selection of parameters using Hebei Province as the first pilot area. By setting up a comparison between the “with” and “without” scenarios, the difference in WSEI resulting from the implementation of the water resources tax was analyzed, and revelations are provided for the policy proposal. In
Section 4, the simulation results were analyzed and compared with those of other studies, and insights into the integration approach in the CGE model are provided.
Section 5 summarizes the main findings of this article and offers policy recommendations for decision-makers. Additionally, it addresses the limitations of the study and suggests potential avenues for further research and in-depth exploration.
3. Case Study
Hebei Province, with a total area of 188,800 square kilometers, is located between 36°05
N–42°40
N and 113°27
E–119°50
E in the North China Plain and is an important part of the Beijing-Tianjin-Hebei economic zone (
Figure 2). In 2017, the GDP of Hebei Province reached 3.06 trillion CNY, with the three sectors of the economy contributing in the proportions of 10%, 42%, and 48% respectively. According to the 2022 Hebei Province Water Resources Bulletin, the average annual water resources in Hebei Province are 17.65 billion m
. And the per capita water resources are 236.9 m
, which is only 1/7 of the per capita water resources in China and far below the world average. For a long time, people have had to rely on groundwater extraction to support their daily lives and industrial production, making overexploitation of groundwater one of the main water issues in Hebei Province, resulting in a series of ecological and environmental problems [
41]. In order to actively address the trend of continuous decline in groundwater levels, promote water conservation, and maintain ecological stability, Hebei Province became the first pilot area for water resources tax reform in China. Choosing Hebei Province as a research area to evaluate the water resources tax reform policy’s WSEI has its typical and important significance and can provide possible reference for other regions in China and even similar regions worldwide.
3.1. Database and Parameters
3.1.1. Database Construction
Given the limitations posed by the non-consecutive annual compilation of input–output tables in China, the most recent available data set for input–output analysis was only updated until 2017. For those who are unfamiliar with the CGE model, it may be mistakenly assumed that these data cannot accurately reflect the current state of economic development. However, it is important to note that the updating of the input–output table using the economic statistics of the corresponding year was carried out based on the original data structure. In other words, the data from the 2017 input–output table can indeed provide valuable information on the current economic structure. Thus, in this study, the 2017 input–output table for Hebei Province was used as the primary data source.
The water consumption data, as reported in the Water Resources Bulletin of Hebei Province, were disaggregated according to the industry classifications provided in the statistical yearbook. The water supply for each industry was then integrated into three categories based on the source of water supply: surface water, groundwater, and unconventional water. This involves the disaggregation of the water sector into three sub-sectors, each producing commodities of surface water, groundwater, and unconventional water. The economic value of water production in each industry is estimated using data on average water prices compiled by the China Water Network, which corresponds to the water resources account in the CGE model.
Using the dual-scale proportional scaling (RAS) method [
42], we balanced the input–output table for the split water sector. Considering the water dependency of the relevant industries, we merged 42 industry sectors into nine, namely agriculture, general industries, water intensive industries, surface water sector, groundwater sector, unconventional water sector, construction, general services, and water intensive services. The industry classification and aggregation details were based on the study by Lin et al. [
43]. Although water resources tax is exempted for agricultural use within the quota in the pilot areas, the original intention of the water resources fee-to-tax reform is to promote water conservation and effective protection. As the largest water-consuming sector, the agricultural sector needs to be included in the reform to effectively encourage water conservation. Therefore, considering the fundamental purpose of water resources tax reform, it is necessary to include agricultural water resources tax in the policy simulation, which aims to provide possible recommendations for the water management department.
3.1.2. Parameters Assignment
The parameters of the model were derived from modeling the behavior and decisions of various economic agents in the economic system. These economic agents include producers, investors, households, governments, imports and exports, as well as an inventory accounting agent. These economic agents were modeled as optimizing decision-makers in the model, making decisions based on their own interests and objectives. For example, producers determine production quantities and prices based on market demand and costs; households decide on consumption quantities based on income and prices. These behaviors and decision rules are encoded as mathematical equations and combined with other equations to form the CGE model. In practice, these parameters can be determined by fitting historical data or expert judgment. The selection of these parameters is crucial for the rationality of the model, and previous studies have provided us with valuable references. Taking into account the characteristics of China’s and Hebei Province’s economic structures, a reliable parameter configuration ensures that these research findings align closely with reality [
33,
35,
43,
44]. In this study, the parameter settings were referenced from previous research. Specifically, the labor demand elasticity was set at 0.243 according to estimates from the Chinese Academy of Social Sciences [
44], and the consumption price elasticity was set at 4 based on the PRCGEM model constructed by Zheng and Fan [
35]. The industry Arminton elasticity, factor substitution elasticity, and household consumption elasticity were based on the results of ORANI-G and processed by weighted averages. The Frisch parameter was set at −2 based on the actual income level of residents in Hebei Province [
43], and other parameters were set based on the ORANI-G model [
33].
3.2. Scenario Settings
This study examines the potential impact of water resources tax policy on water use and the economy by dividing the scenarios into “with” and “without” taxation. The “without” scenario refers to the economic operating status of Hebei Province when no water resources tax is imposed, which serves as the baseline scenario. The “with” scenario investigates the changes in water use and economic conditions resulting from the imposition of water resources tax on different types of water, which represents the policy scenario. Based on the three research questions presented earlier, we set three possible policy scenarios, labeled S1, S2, and S3, and analyze the differences between the two scenarios using policy shock analysis. Referring to Tian’s research [
30], who used the principle of maximizing resident utility to determine the optimal water resources tax rate of 18% in Hebei Province, we adopt this as the S1 scenario, meaning that a tax rate of 18% is imposed on the use of surface and groundwater in all industries. To promote the use of unconventional water sources, which are currently exempt from water resources tax in pilot regions, we apply the same exemption in our study. The S2 scenario is based on the S1 scenario but increases the water resources tax rate for high water-consuming industries by 5%. Although pilot regions have implemented water resources tax reform based on the principle of “translate fee to tax”, water resources tax differs from water resources fee in that it can participate in the redistribution of the national economy, i.e., transfer payments. To alleviate the burden of water use for producers, the tax revenue is refunded to water users through subsidies, and the water resources tax rate is maintained at the S2 scenario for the S3 scenario. All policy scenarios are presented in
Table 1.
3.3. Analog Results
We simulated the water resources tax policies under three scenarios by constructing a model database and allocating different types of parameters, which corresponded to the three additional questions raised earlier. Given that the productive nature of industries varies in their degree of water dependence, each industry exhibits a different degree of response to the tax reform policies. The details of the simulation results are presented below.
Table 1.
Policy scenario settings based on “with-without” division.
Table 1.
Policy scenario settings based on “with-without” division.
| Scenario Label | Description |
|---|
| Baseline Scenario (S0) | Without water resources tax |
| Policy Scenario 1 (S1) | With 18% water resources tax rate imposed on all industries |
| Policy Scenario 2 (S2) | With 23% water resources tax rate imposed on high-water-consuming industries, other industries keep the same with scenario S1 |
| Policy Scenario 3 (S3) | With the same water resources tax rate subjects to scenario S2, but refunded to the industries through subsidies |
3.3.1. Changes in Water Use by Type
Based on the simulation results presented in
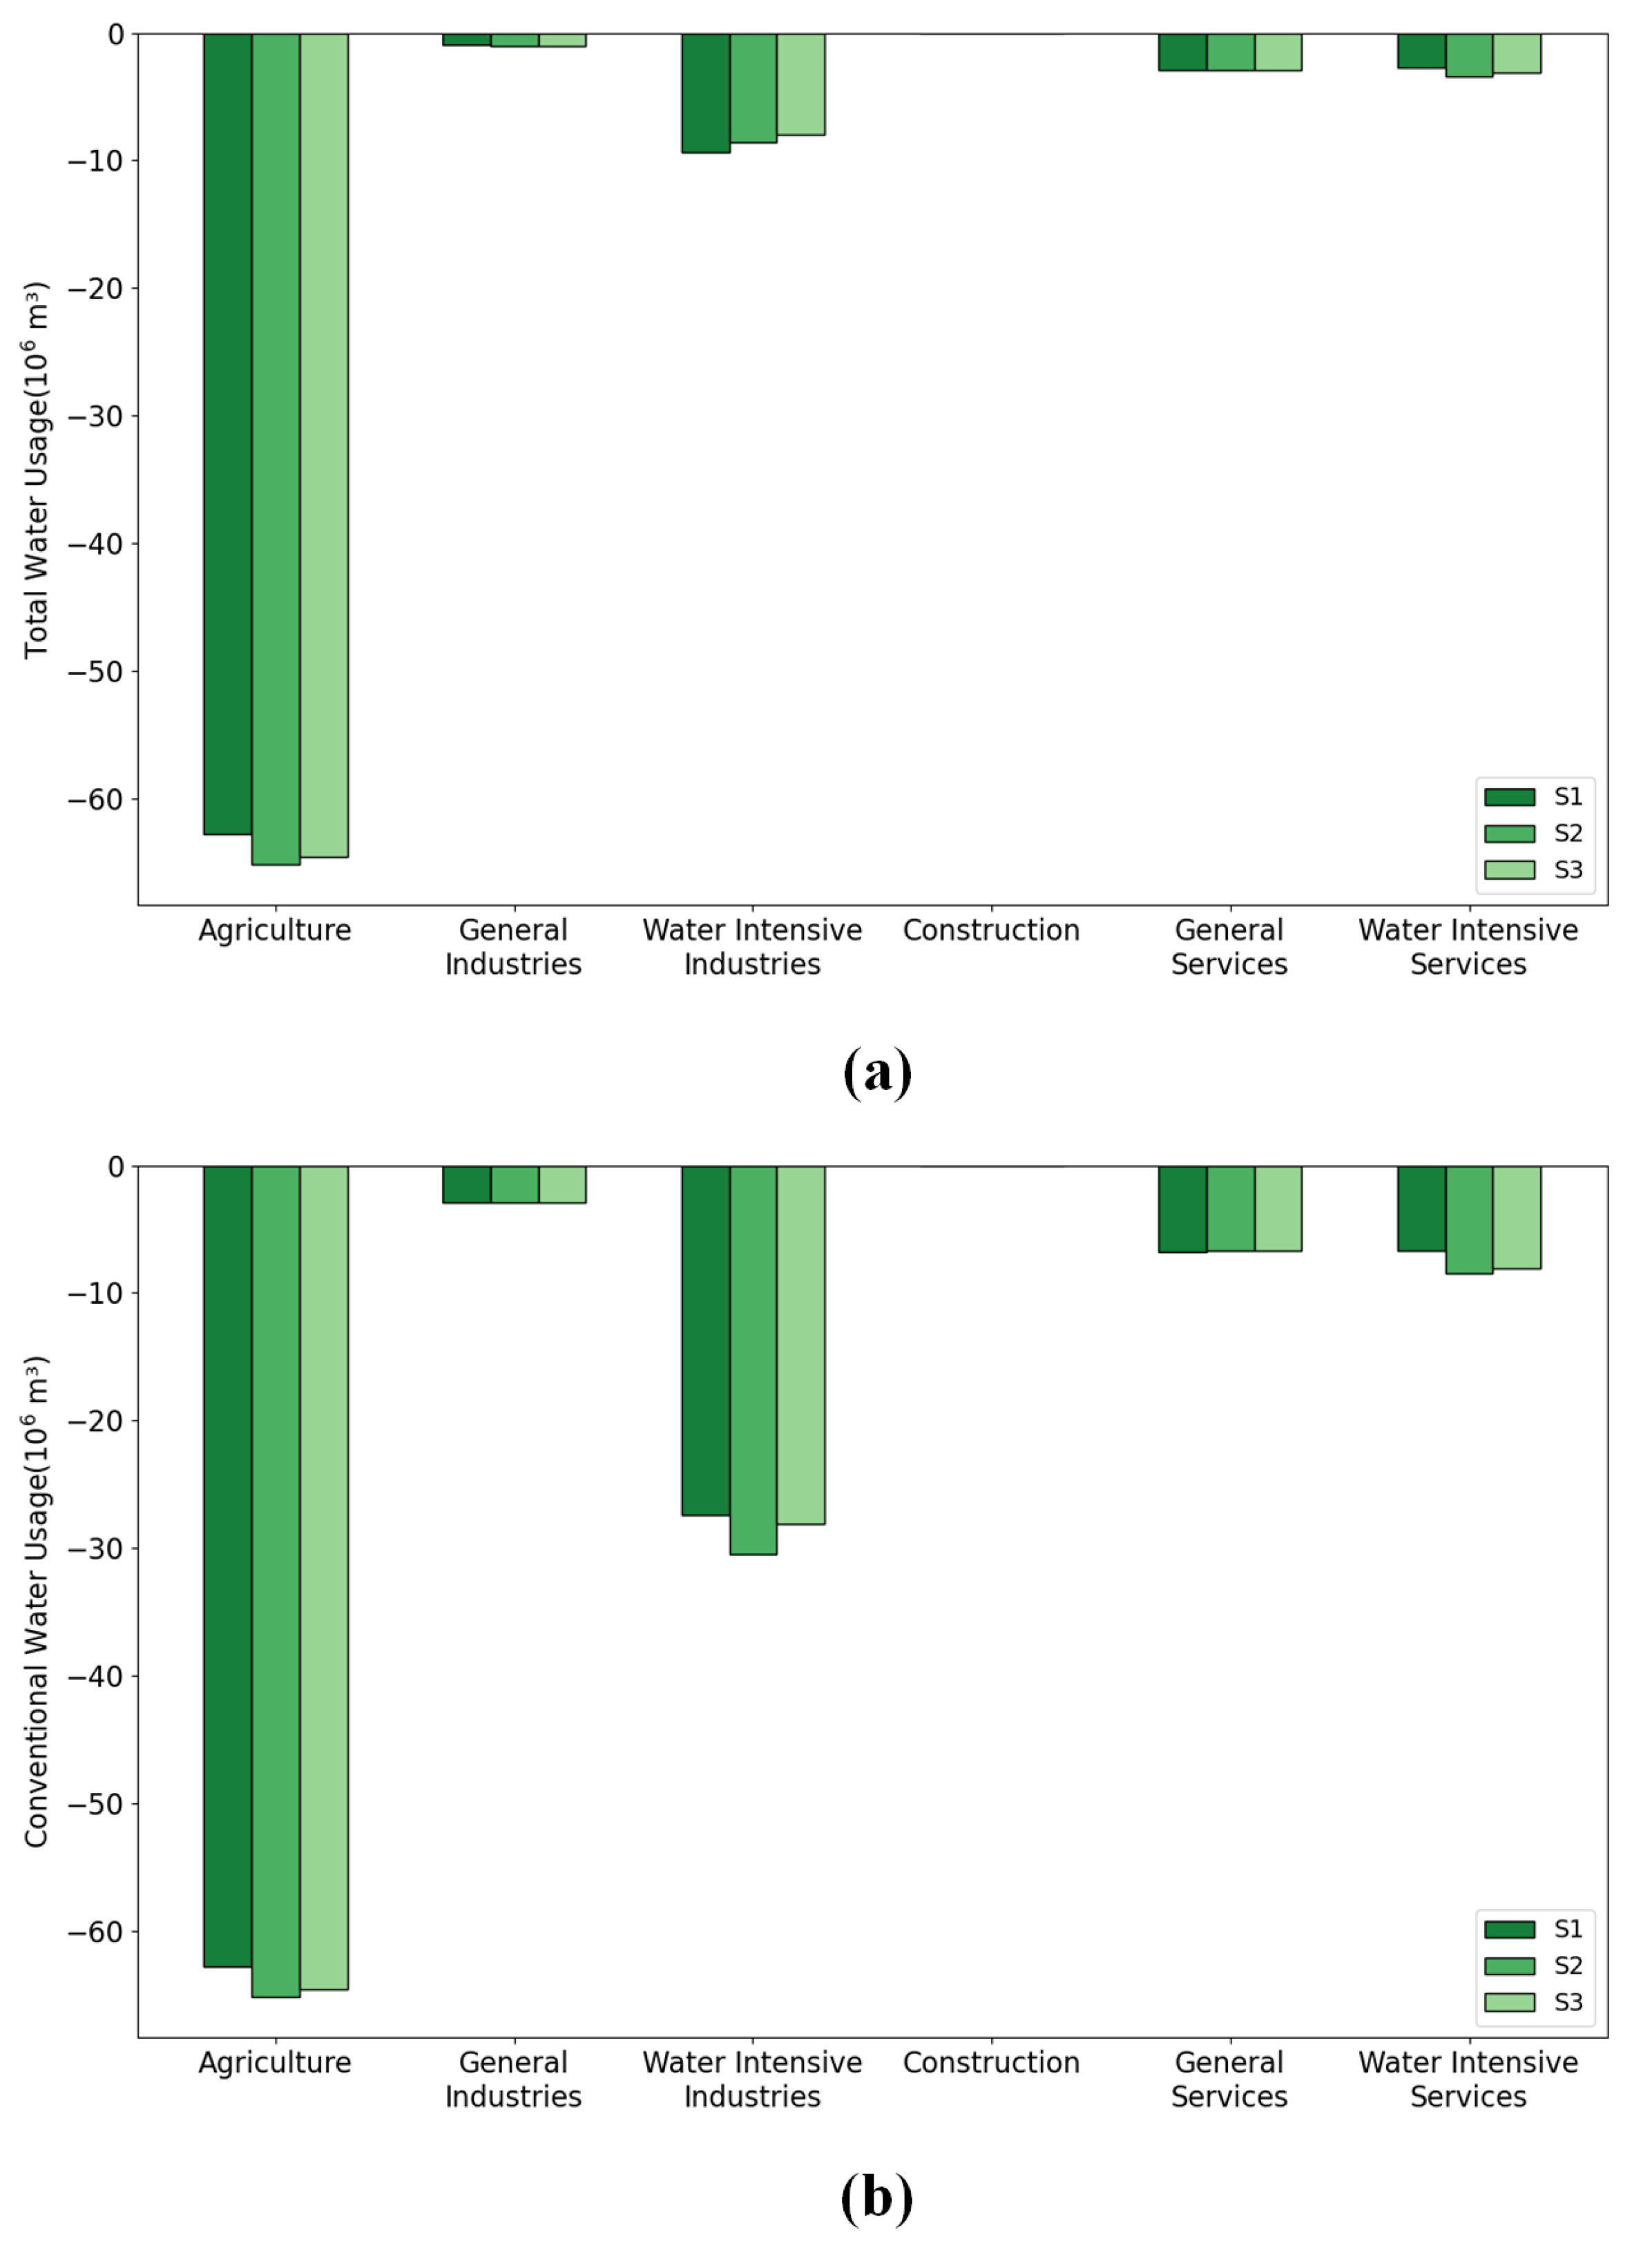
Table 2, the total water consumption and conventional water consumption of all industries under the three water resources tax policies have decreased, which is further illustrated in
Figure 3. From an industry-wide perspective, the degree of reduction in water consumption for both total and conventional water follows the scenario order of S2 > S3 > S1. The corresponding reduction spaces are 80.98 Mm
3, 79.54 Mm
3, and 78.79 Mm
3 for total water consumption and 113.65 Mm
3, 110.32 Mm
3, and 106.70 Mm
3 for conventional water consumption. When examined by industry, agriculture has experienced the greatest reduction in water consumption, which is consistent with the degree of reduction in conventional water consumption. This is because agriculture does not use unconventional water in the baseline scenario and there is no substitution between natural water resources and unconventional water in the policy scenarios. Furthermore, the water use behavior of high-water-consuming industries is more sensitive to policy shocks than that of other industries. In the S2 scenario, the conventional water consumption of water intensive industries has decreased by approximately 30 Mm
3, which is about 3 and 2 Mm
3 higher than the water savings of S1 and S3 scenarios, respectively, while the largest reduction in total water consumption occurs in the S1 scenario. Water intensive services follow the pattern of S2 > S3 > S1 in terms of their degree of reduction in total water consumption and conventional water consumption, which ranges from −2.77 to −3.10 Mm
3 and from −6.74 to −8.45 Mm
3, respectively. The impact of different scenarios on water consumption in general water-consuming industries and services is not obvious, while the water consumption of the construction industry has almost remained unchanged.
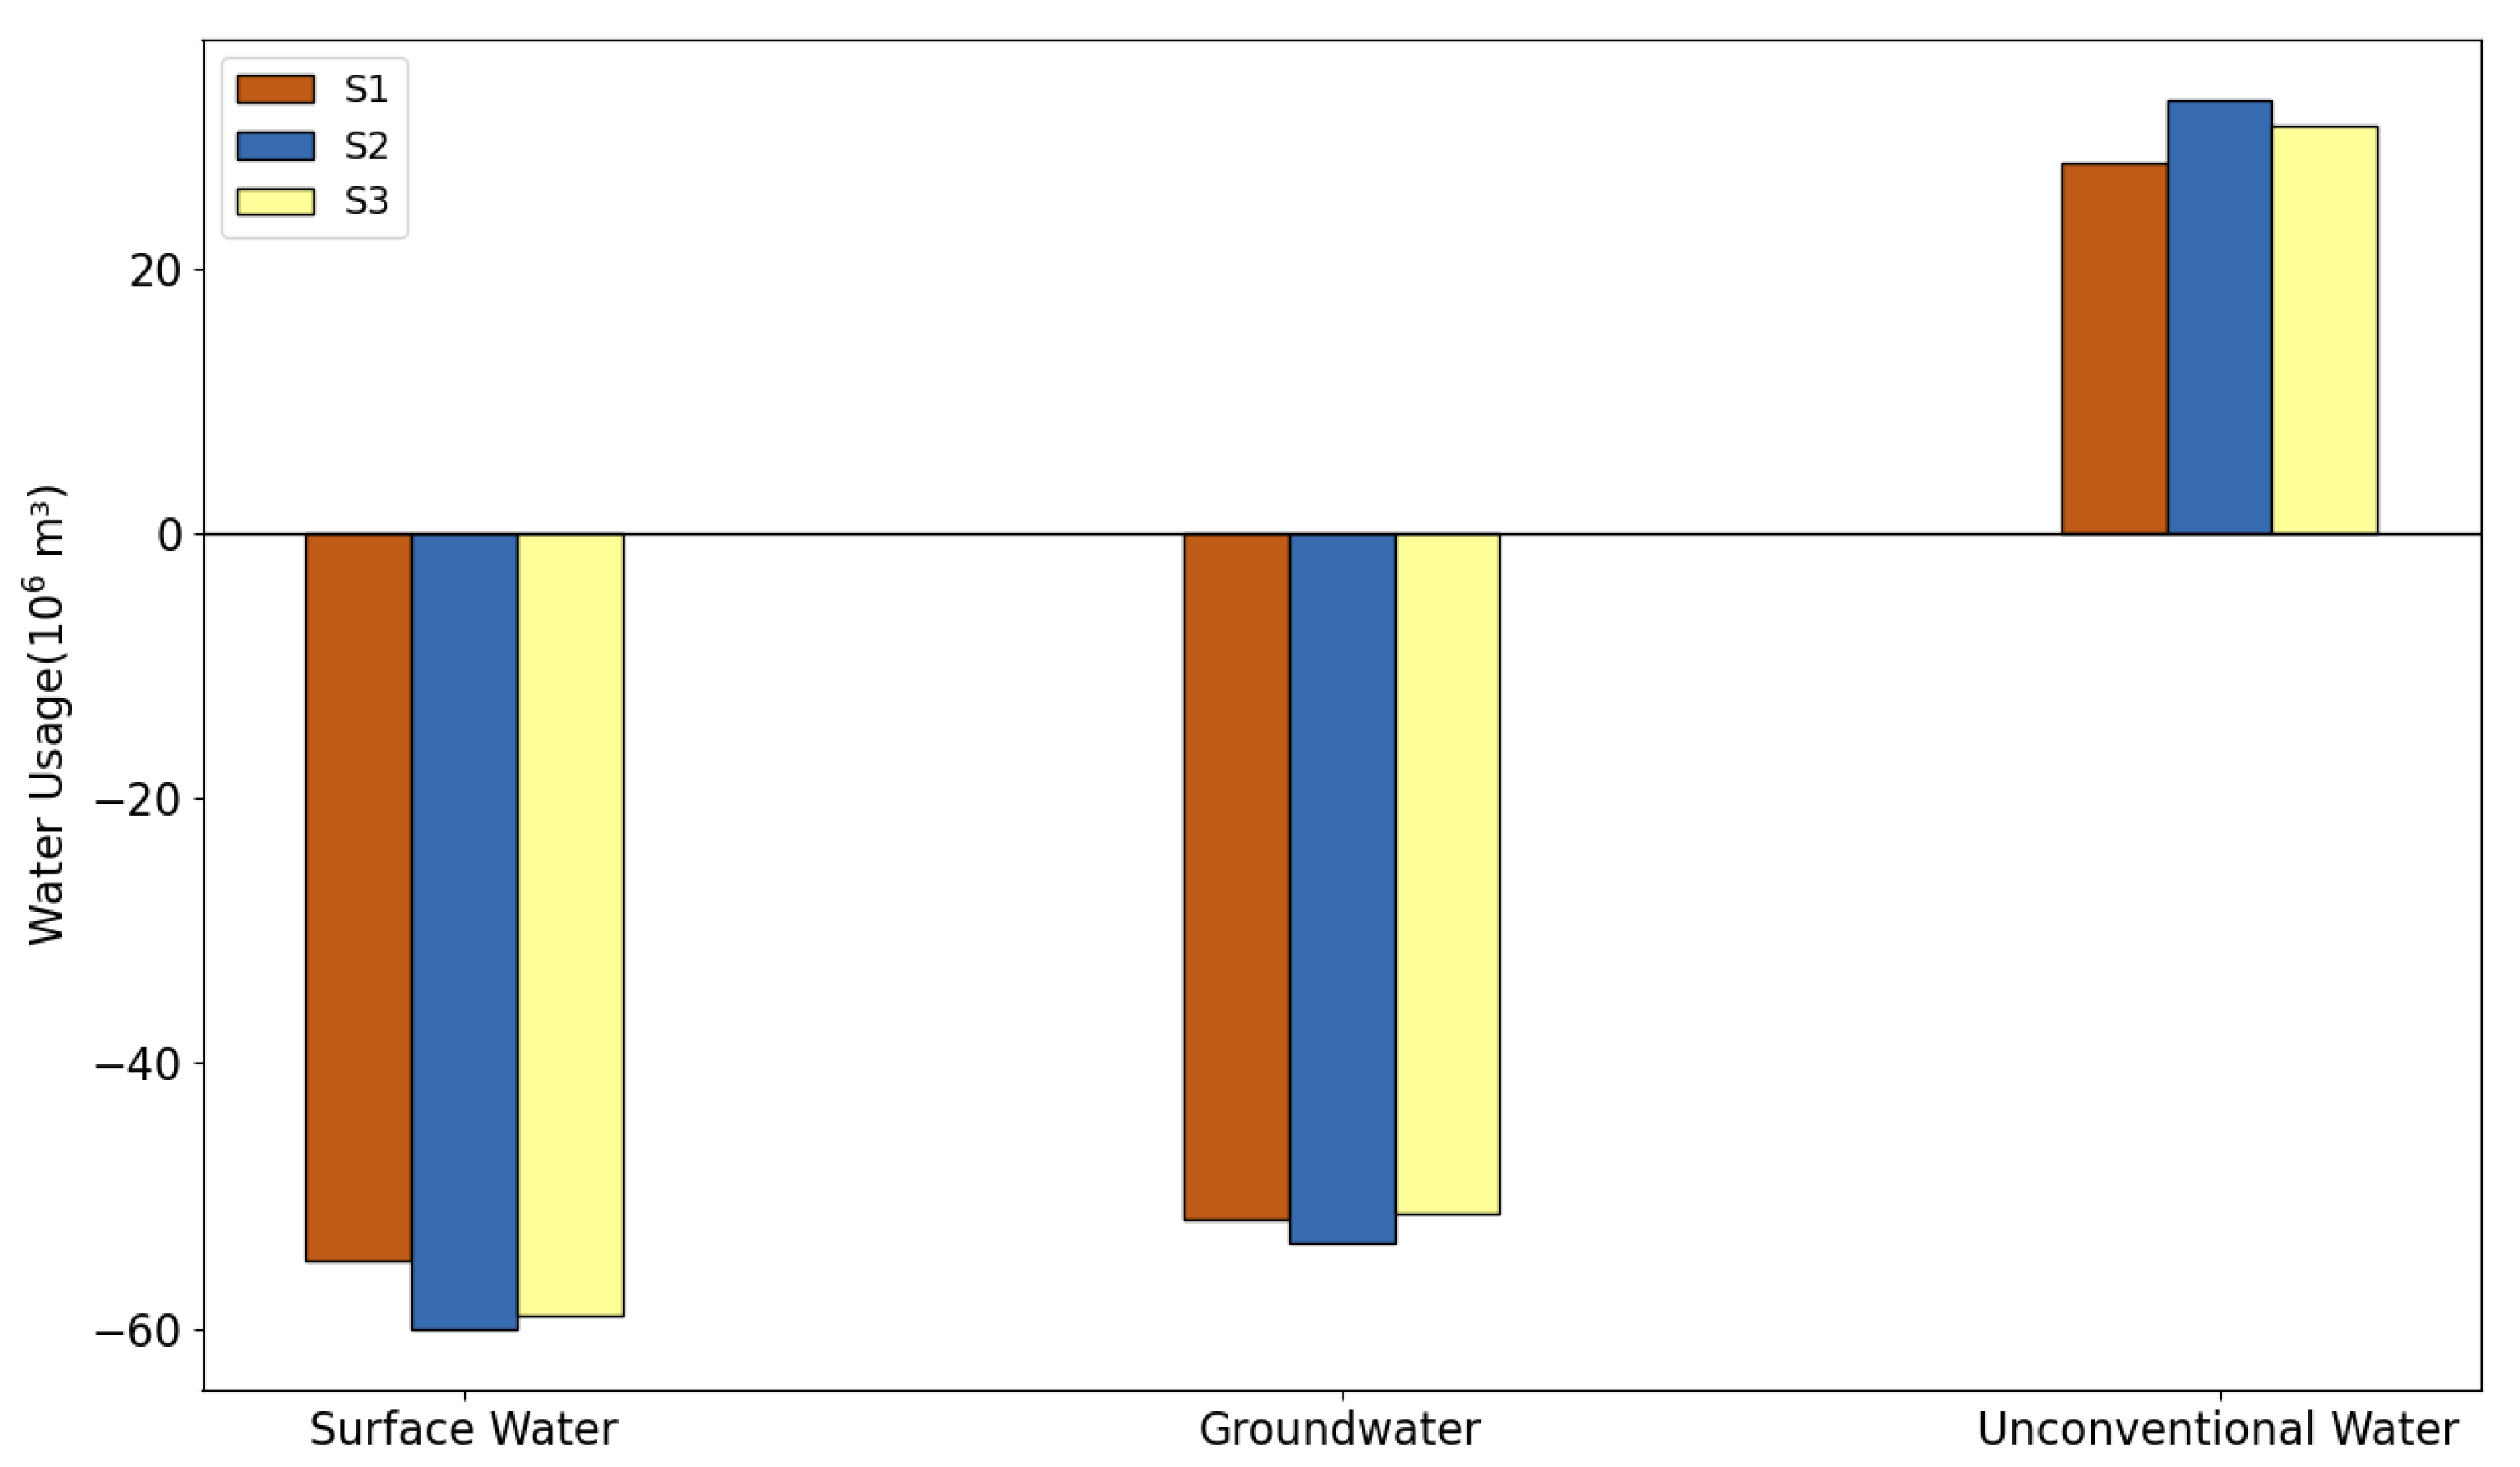
As reported in
Table 3, the impact of three different water resources tax policies on the usage of multiple types of water is presented. Overall, the total water reduction levels in the three scenarios are quite similar. In the S2 scenario, which involves increasing the water resources tax rate for high-water-consuming industries, the reduction levels of surface water and groundwater are the highest, reaching −60.08 Mm
3 and −53.57 Mm
3, respectively. The reduction levels in this scenario are significantly higher than those in the S1 and S3 scenarios. The promotion of the use of unconventional water follows the order of S2 > S3 > S1, which also explains why the reduction level of water intensive industries is highest in the S1 scenario. This is due to the fact that the S2 and S3 scenarios further increase the usage of unconventional water, and the large water-saving space created by the reduction in the usage of conventional water is filled when calculating the total water usage. This results in the water-saving levels being similar in all three scenarios. By combining with
Figure 4, we can clearly explain the changes in
Figure 3, which shows why the reduction in water usage by water intensive industries is the highest in the S1 scenario, as the groups using unconventional water are concentrated in these industries.
3.3.2. Changes in Water Use Efficiency
To investigate the impact of different water resources tax policies on the overall water utilization efficiency, we measured the actual decline in water usage per 10,000 CNY of value added. The larger the decline, the higher the improvement in water use efficiency. Specifically, the simulation results in the three scenarios showed only slight differences, but overall, the impact on water efficiency was positive, albeit with limited improvement. As shown in
Table 4, the changes in water efficiency under the three policy scenarios are nearly identical, with changes of −0.166, −0.170, and −0.167 m
per 10,000 CNY for scenarios S1, S2, and S3, respectively. The main reason for this phenomenon was that there was little difference in the total water savings in the three scenarios.
3.3.3. Changes in Sectoral Output
The primary objective of implementing water resources tax reform is to facilitate water conservation and ensure sustainable utilization while effectively balancing the interplay between economic development and resource preservation. Consequently, the economic impact of water resources tax policy cannot be overlooked. In this study, we primarily evaluated its economic implications by examining changes in output across various industries. As the results presented in
Table 5 show, three different policy scenarios have varying impacts on the economic output of different sectors. Based on the policy simulations, the impacts of water resource taxation on economic output are negative, as illustrated more intuitively in
Figure 5. Among the three scenarios, the impact is the highest in Scenario S2, where a higher differential tax rate was implemented. In contrast, the impact is the smallest in Scenario S1, where a uniform tax rate was applied. Scenario S3, which involves tax subsidies refunded to enterprises, has an impact that falls between the other two scenarios. The range of total output impact across the three policy scenarios is between CNY −342.76 and −310.46 million. As the largest water user, the agricultural is the most affected in terms of economic output, with losses ranging from CNY −101.49 million to CNY −81.90 million due to tax impacts. In terms of actual changes in output impact, high-water-consuming industries are the next most affected, with the water intensive services experiencing fluctuations in impact ranging from CNY −94.94 to −76.42 million across different policy scenarios, while the water intensive industries experience a range of CNY −79.17 to −61.82 million. The total output of the construction industry and general services industry shows similar responses across the three policy scenarios, with no significant differences in fluctuation. Specifically, the total output of the construction industry changes between CNY −21.40 and −19.99 million, while the total output of the general services industry decreases in the range of CNY −4.29 to −3.00 million.
4. Discussion
4.1. Policy Reaction Analysis and Comparisons
According to the simulation results of different policy scenarios presented earlier, different types of water consumption, overall water use efficiency, and total economic output of each sector have responded to policy shocks. It can be observed that levying water resources tax can reduce the use of conventional water resource, produce water-saving effects, and promote the use of non-conventional water resource. This policy response is particularly evident in high-water-consumption industries. In other words, compared to a uniform water resources tax rate for the entire industry, implementing a higher differential tax rate for high-water-consumption industries can more effectively promote the conservation of conventional water resource and the use of non-conventional water resource. The higher the tax rate, the more obvious the water-saving effect of conventional water resource and the use of non-conventional water resource. This change is consistent with actual reported cases, such as a golf course belonging to a high-water-consumption service industry in Langfang City, Hebei Province, which used to pump an average of 10,000 m3 of groundwater per month. After the water resources tax reform was implemented and the cost of water use sharply increased, the enterprise had to take measures to reduce the use of groundwater and build a rainwater collection and storage system to replace and reduce the use of groundwater. After investing in water-saving renovation, the enterprise reduced the use of groundwater by 1348 m3 per month, which reduced the total cost compared to not conducting the renovation. Since the implementation of the water resources tax reform in Hebei Province, the average annual total water consumption has decreased by about 100 million m3, which is also close to the simulated results.
It is important to note that the direct impact of high tax rates is an increase in industry’s production cost of using water. This is because the effect of tax rate increase in the model is reflected through prices, as confirmed by the impact results under different policy scenarios. Due to the increase in industry’s production cost of using water, every industry will be affected by varying degrees of negative impact. This seems to create a contradiction in balancing the requirements of water conservation and economic loss cost. Therefore, considering the negative impact on the macro economy becomes an important factor in policy implementation, a similar understanding as previous research [
30,
31]. By comparing the actual economic development situation in Hebei Province, it can be observed that the actual GDP of Hebei has continued to rise steadily since the tax reform policy was implemented.However, to adapt to this change, producers may need time to make adjustments and changes, resulting in a slowdown in the growth rate of Hebei Province’s GDP compared to before.
As an industry that accounts for more than 60% of water consumption, agriculture is a potential target for promoting water conservation through the imposition of a water resources tax [
11]. While actual water savings in agriculture are highest compared to other industries in different scenarios, the actual economic output value of agriculture is also the most affected. As an upstream industry in the majority of sectors, agricultural shocks inevitably affect downstream industries, while larger shocks in downstream industries reduce sectoral output and decrease demand for agriculture. Therefore, in practice, all pilot areas, including Hebei, levy water resources taxes when agricultural water consumption exceeds the limit, to some extent constraining water use and avoiding significant water cost burdens on this fundamental industry. However, as the water resources tax system matures, the imposition of water resources taxes on agricultural water use should also be considered.
4.2. Scenario Selected Details and Revelations
By analyzing policy responses from different perspectives, three policy scenarios were compared. From the perspective of total water conservation, the impact of the three scenarios is similar, but S2 is the optimal choice, as the water savings in S2 are 2.19 Mm3 and 1.45 Mm3 higher than those in S1 and S3, respectively. From the perspective of conventional water conservation, the impact of S2 is significantly higher than that of S1, although it is similar to S3. Thus, S2 is still the optimal choice. From the perspective of promoting the use of unconventional water sources, S2 exhibits the best impact and should be preferred. From the perspective of economic output, the scenarios ranked as S1 < S3 < S2, and the S1 scenario should be selected. But the S1 scenario neglects the dependence of high-water-consuming industries on water resources, making it difficult to exploit the water-saving potential of such industries, leading to less significant effects on conventional water conservation and promoting the use of unconventional water sources. The S2 scenario has a greater impact on the economy since it does not return taxes to water users through subsidies. However, the S3 scenario achieves this. Unlike earmarked funds for water resources fees, water resources taxes can be directly incorporated into government fiscal revenue and participate in the redistribution of the national economy. With Scenario S2, where tax revenue is not returned to the enterprises, it results in reduced income for the companies, and their water burden remains uncompensated. In the case of Scenario S3, tax refunds achieve a regulatory effect on welfare distribution, compensating for the output loss caused by increased production costs. However, it is important to note that the subsidies provided to the industries are limited compared to the economic output loss. This policy scenario cannot entirely eliminate the negative impact of water resource tax rates on the economy. This is because industry subsidies are lower than the benefits derived from the water resources input in production activities. Nevertheless, to some extent, this approach alleviates the negative economic effects. Its impact on conventional water conservation and promotion of unconventional water sources is similar to that of S2. Therefore, among the three scenarios, S3 should be chosen as the optimal choice.
Compared with the current situation, in formulating water resources policies, the dependence of industries on water use should be fully considered, and water resource taxes should reflect the principle of “more water consumption, more burden” to force companies to transform their production methods and update their water-saving technologies and facilities. Secondly, it is essential to make reasonable use of tax revenue, while adhering to the principle that taxation is not the primary goal [
45]. This can be achieved by transferring the burden of water consumption away from businesses. One approach is to establish a water-saving assessment reward fund that provides subsidies to production departments. Thirdly, the assessment of negative economic impacts should be incorporated into tax policy implementation requirements, and reasonable collection standards should be set to achieve a win-win situation of water-saving targets and minimal negative economic impacts. Finally, as agriculture is a fundamental pillar industry for economic development, the collection of water resources taxes should be based on accurate assessments of farmers’ ability to bear the burden and the benefits of agriculture, while ensuring effective use of agricultural water resources and steady agricultural development.
4.3. Insights and Advancements in Integrated Approach
To meet the research requirements, we categorized the water sector into three types: surface water, groundwater, and unconventional water. The combination of surface and groundwater forms conventional water, while conventional water and unconventional water together constitute the entire water production sector, allowing for substitution elasticity among different water sources. Ouyang et al. [
11] emphasized and deduced the impact of substitution effects between different water types on industrial water behavior when assessing the effectiveness of China’s water resources tax reform policy, underscoring the significance of this influence. Taking this into consideration, we adopted this approach. From a model mechanism perspective, producers adhere to the principle of cost minimization, seeking lower-cost water types to replace higher-cost water resources. This approach mitigates the potential negative economic effects of relying solely on one water type in evaluating tax reform policies. By providing a detailed characterization of different water sources, our model mechanism closely aligns with real-world conditions. While there is currently no literature reporting the adoption of this specific treatment method for evaluating water resources tax policies, we can observe similar strategies employed in other research areas within water policy studies. For example, Zhao et al. [
23] evaluated the impact of water price reforms in Tianjin by categorizing the single water sector into raw water, tap water, reclaimed water, and desalinated water. Luckmann et al. [
39] constructed the STAGE_W model to assess the economic impact of water scarcity by dividing the water production sector into naturally endowed water resources and artificially treated commodity water resources, ultimately incorporating them into the CGE model through primary factors. These researchers tailored their water type categorization to the specific research needs and objectives, indicating the potential of this method in future studies within the field of water resources management. However, it is important to note that this approach places higher demands on data granularity and completeness. For different water policy scenarios, this method is more suitable for capturing and describing actual water usage.
5. Conclusions
5.1. Main Findings
Through the construction of a production module that incorporates multiple types of water into a CGE model, this study analyzed the implementation of China’s first water resources tax pilot area in Hebei Province, and divides it into a “with” and “without” tax scenario for comparison. This enriched and refined previous studies on water resources tax policy evaluations, and addressed the three key questions posed earlier. The study found that the implementation of water resources tax policy can have a certain negative impact on industry economic output, but can effectively reduce the use of conventional water and promote the utilization of unconventional water. By setting higher differential tax rates on high-water-consuming industries, water resources tax policies can more effectively promote water conservation, mainly reflected in the further reduction of conventional water consumption and increase in unconventional water utilization in these industries. This change benefits from the sensitive response of industries that are highly dependent on water resources use, while the degree of economic output damage also intensifies. In contrast, the construction and general water-consuming industries have limited space for actual water conservation, and the water consumption of the construction industry hardly changes. The approach of tax subsidies to the water-using industry can alleviate the impact on economic output, while achieving water conservation, but the compensation degree is limited. Based on the research findings, the S3 policy scenario was selected as the recommended plan from multiple angles, such as the total water conservation, conventional water conservation, unconventional water utilization, water use efficiency, and economic impact. The S3 scenario entails imposing a 18% water resources tax rate on general water-consuming industries, while applying a differential tax rate of 23% on high water-consuming industries. Furthermore, this optimal scenario involves subsidizing producers through tax refunds. This selection was based on a thorough evaluation of multiple perspectives, indicating its potential effectiveness in achieving water conservation and economic goals.
5.2. Recommendations
Based on the research findings and real-world insights, this study put forth recommendations for water resources tax reform, encompassing differential tax rates, tax redistribution, government regulation, and agricultural water resources taxation. The key suggestions are as follows:
(1) In light of regional economic structures, it is crucial to thoroughly analyze the water dependency of various industries. To stimulate enterprises to adopt water-saving technologies, upgrade equipment, and encourage water reuse, it is advisable to implement distinct tax rates between general water-consuming industries and high water-consuming industries.
(2) The primary objective of taxation should not solely be fiscal revenue generation. Instead, the water resources tax should be used judiciously, striking a balance between economic development and water resource preservation, while considering regional conditions. Mitigating adverse economic impacts can be achieved through measures such as enterprise subsidies and transfer payments. Furthermore, establishing a water-saving assessment and incentive fund, funded by tax revenues, can foster a mutually beneficial relationship between economic growth and water conservation.
(3) Strengthening supervision of water users by water administrative management and decision-making bodies is of paramount importance. Enhancing data collection, transmission, storage, and sharing capabilities concerning industrial water consumption is crucial for effective water resources tax collection. Transparent public scrutiny of water supply project costs and disclosure of detailed cost accounting information will enhance public engagement and prevent monopolistic practices resulting from the imposition of water resources taxes.
(4) When implementing water resources taxation in the agricultural sector, it is imperative to accurately assess farmers’ capacity to bear the tax burden and consider agricultural production income. Proactively exploring complementary policy development and preferential treatment for agricultural water resources taxation is essential. The transition from quota exemptions to comprehensive taxation should be gradual and aligned with economic development and policy maturity.
5.3. Limitations and Directions
Although this study has enriched and refined the understanding of the use of multiple types of water under the water resources fee to tax reform policy, and has answered three key questions; the availability of statistical data has limited our ability to process water quantity and price information for each industry, which serves as the foundation for our policy tools. With more detailed economic and water data, we could better evaluate the impact of the water resources tax reform policy. Additionally, this study belongs to the category of comparative static analysis, whereas the impact of the water resources tax reform policy may be ongoing. This provides a possible opportunity for dynamic simulation analysis of policy evolution.
Furthermore, from the perspective of water environmental protection, there is a close connection between water conservation and reducing wastewater discharge. This is because a greater emphasis on water conservation leads to a reduction in the wastewater discharge associated with production water usage. For example, agricultural water conservation can help mitigate non-point source pollution, while industrial water conservation can reduce point source emissions, thus playing a positive role in water environmental protection. In future research, the assessment of this aspect can be incorporated into the model.


