Article

Mapping the Environmental Vulnerability of a Lagoon Using Fuzzy Logic and the AHP Method

by
Clebson Pautz
1,
Alexandre Rosa dos Santos
1,
Jéferson Luiz Ferrari
2,
Plinio Antonio Guerra Filho
3,*,
Sustanis Horn Kunz
1,
Henrique Machado Dias
1,
Taís Rizzo Moreira
1,
Rita de Cássia Freire Carvalho
1,
Vinícius Duarte Nader Mardeni
1,
Elaine Cordeiro dos Santos
1 and
Larissa Marin Scaramussa
4
1
Postgraduate Programme in Forest Sciences, Forestry and Wood Sciences Department, Jerônimo Monteiro Campus, Espírito Santo Federal University/UFES, Jerônimo Monteiro 29550-000, ES, Brazil
2
Geoprocessing Laboratory, Alegre Campus, Espírito Santo Federal Institute/IFES, Alegre 29520-000, ES, Brazil
3
Agricultural Engineering Department, Chapadinha Sciences Center, Maranhão Federal University/UFMA, Chapadinha 65500-000, MA, Brazil
4
Postgraduate Programme in Environmental Engineering, Environmental Engineering Department, Lavras Federal University (UFLA), Lavras 37203-202, MG, Brazil
*
Author to whom correspondence should be addressed.
Water 2023, 15(11), 2102; https://doi.org/10.3390/w15112102
Submission received: 27 March 2023 / Revised: 10 May 2023 / Accepted: 12 May 2023 / Published: 1 June 2023

Abstract

:
Environmental vulnerability refers to the susceptibility of a region to damage when it is subjected to natural or anthropogenic actions. The assessment of environmental vulnerability in lakes is an important tool to assist managers in planning and intervening for sustainable production and environmental preservation. The combination of geotechnologies, fuzzy logic and the analytic hierarchy process (AHP) has been applied by professionals and researchers to improve the work and research conducted in various areas and environments. In this context, the objective of this work was to map the environmental vulnerability of a lake and its surroundings through fuzzy logic and the AHP method. The study area comprises the Juparanã Lagoon Drainage Surface (JLDS), Espírito Santo state, Brazil. A survey of the physical characteristics of the watershed (drainage surface) that feeds the Juparanã Lagoon was carried out and also of the land use of this surface. To achieve the proposed objectives, the following methodological steps were implemented: (a) delimitation of watersheds, (b) spatialization of Permanent Preservation Areas (APP) based on the Brazilian Forestry Code (Law nº 12,651/2012), (c) application of logic fuzzy and AHP to spatialize the environmental vulnerability and (d) application of an evaluation of environmental vulnerability to the Preservation Areas (APP). Environmental vulnerability was modeled using Euclidean distance analysis, fuzzy logic and the AHP method, as proposed by Saaty (1977). For the development of this work, geotechnologies were used, with special emphasis on the use of the free software QGIS. The analysis revealed that 31.20%, 32.86% and 20.93% of the JLDS have very high, high and medium vulnerability, respectively. The evaluation of the environmental vulnerability of the APP showed that there is protection in the APP of the JLDS at rates of 47.35%, 34.05% and 14.5% for very high, high and medium vulnerability classes, respectively. The difficulties encountered were related to the lack of studies in the area of environmental vulnerability with a particular focus on lagoons. Here, for the first time, we perform a photointerpretation of the surroundings of Juparanã Lagoon. An important improvement measure would be the application of a temporal analysis to assess the dynamics of environmental vulnerability over time, considering socioeconomic, climatic and environmental changes. This would provide a more complete understanding of the distribution of environmental vulnerability in the study area. The methodology can be adapted to consider different scales of analysis, from local to regional, national and global scales, to assess environmental vulnerability at various scopes and levels of complexity. It can also be adapted to include local communities and governments.

1. Introduction

Lakes, ponds and lagoons are bodies of water of different sizes. The first two are continental, with lakes being larger than ponds. The third type, represented by lagoons, are depressions filled with brackish or salty water that are located on coastal edges and communicate with the sea through a channel. All three are extremely complex, both from the point of view of contamination and the composition and volume of their waters [1].
Over the decades, human activities in coastal lagoons have had a significant impact on their ecology and valuable ecosystem services. Basic biological and physiological needs, such as food and shelter, social status and occupation, financial self-sufficiency and self-realization, drive activities such as fishing, agriculture, expansion of settlements, mining, mangrove harvesting and industrialization, among others. These activities have altered lagoon environments, contributing to the predation of fish and mangrove species; the introduction of heavy metals, organic materials, nutrients and pathogens; decreasing oxygen levels; increasing biochemical oxygen demand; and reducing biodiversity and lagoon areas [2].
Aquatic ecosystems are commonly used by populations to obtain food for their own survival or that of their dependents who live further away. This explains the occupation and use of their surroundings for a series of actions and activities essential to human life. These uses and occupations have their limits, notably due to the environmental vulnerability of such ecosystems [3].
The region of the lower Doce River (Espirito Santo state) has about 90 lakes, which correspond to a total area of 165 km2, representing one of the most important coastal lake systems in Brazil [4]. The lagoons of the Baixo Rio Doce (ES) originate from ancient estuarine sediments that are influenced by oceanic and fluvial processes and are often embedded in large valleys, such as Juparanã Lagoon, or are remnants of large and ancient coastal lagoons [5].
Juparanã Lagoon covers the municipalities of Rio Bananal, Sooretama and Linhares, the latter having legal jurisdiction over most of its territory. The lagoon has an approximate area of 68.58 km2 and a perimeter of 89.50 km. It is 38 km long, 5 to 7 km wide and has an average depth of 13 m. Its main tributary is the São José River. It is the largest lagoon in Espírito Santo, the second largest in terms of land area and the largest in terms of fresh water volume in Brazil [6].
In recent decades, the Juparanã Lagoon has been subjected to a series of anthropic impacts such as silting and the disorderly occupation of its surroundings, both for real estate development (urbanization) and agricultural purposes [6,7]. Anthropogenic activities such as industrial and urban discharging, agriculture, coastal landfills, heavy traffic, naval activity and atmospheric accumulation directly contribute to the increase in toxic metals and sediment in the water column and cause pollution in marine ecosystems [8].
Agricultural activities, when practiced in an intensive manner, can disrupt the dynamic balance of the physical environment, with the main consequence being deforestation that is related to the historical context and occupation of the Brazilian territory and the predatory exploitation of natural resources [9].
With the intention of mitigating impacts and limiting anthropic action on natural resources, the Brazilian Forest Code, under Law 12,651 from 25 May 2012 [10], provides protection to native vegetation while allowing forest exploitation and the harvesting of forest raw materials, with regulation of the origin of forest products. It also regulates the control and prevention of forest fires and provides economic and financial instruments to achieve its objectives. It also establishes strips of vegetation that must be protected around water bodies and springs as permanent reserves. Permanent Preservation Areas (APP) are protected areas, covered or uncovered by native vegetation, whose environmental function is to protect water resources, landscapes, geological stability and biodiversity; promote gene flow in plants and animals; protect soils; and ensure the well-being of the population [10].
Despite being recognized as an APP, according to the Forest Code, many are vulnerable, as some developers violate the current legislation and exploit these areas for various purposes. Therefore, understanding the level of environmental vulnerability in a given area is a necessary requirement to implement effective environmental planning and prevent environmental disasters [11].
Understanding land use is very important in environmental research, as it directly affects its natural properties, in addition to physical, chemical and biological aspects. Land use can be understood as a set of information related to the classification of land uses on the Earth’s surface that constantly changes under the influence of various factors. However, as the occupation of and changes in the Earth’s surface evolve, so do the means of recording and identifying these processes, especially through remote sensing tools and geographic information systems (SIG) [12].
In recent decades, technology has become popular, and geotechnologies stand out in the implementation of research and monitoring activities in different types of environments and areas. Geotechnologies are a set of techniques used to collect, process, analyze and disseminate georeferenced information through computational tools that accurately assess processes that have environmental impacts [13]. The following geotechnologies stand out: geographic information systems, digital cartography, remote sensing, global positioning systems and topography [14].
The use of geotechnologies has provided methodological support for technical and scientific production in several areas, with emphasis on environmental planning, land use and in the process of land use identification [15].
Geotechnologies make it possible to identify and establish control and/or direction of anthropic land use activities and improve the production of various cartographic products, such as vulnerability maps, essential for the environmental diagnosis of an area [16]. Vulnerability maps result from a combination of different geographic information and include a geographic inference process with multicriteria analysis. This type of analysis involves a set of decision alternatives based on different evaluation criteria [17].
Environmental vulnerability can be defined as the degree to which natural systems are vulnerable or unable to cope with the impact of external interactions which may come from natural or anthropogenic actions [18]. It is essential to establish methodologies to identify the occurrence of vulnerability, to understand how these changes and their consequences are attenuated or amplified by different human and environmental conditions, as well as to identify what can be applied to reduce environmental vulnerability and how a more resilient and adaptable society can be built [19].
Understanding the areas and the dynamics in which environmental vulnerability occurs in land use units is essential to support studies regarding the assessment of the ecosystem’s environmental vulnerability. In this context, applying geotechnology tools associated with fuzzy logic and the analytic hierarchy process (AHP) multicriteria analysis method becomes fundamental for developing works that address the theme of environmental vulnerability.
Fuzzy modeling, or fuzzy logic, has the ability to convert the qualitative variables of an object of study into quantitative variables, providing a more detailed and less subjective analysis of the results. Fuzzy logic was used in this study to describe environmental characteristics more comprehensively. This artificial intelligence technique has been used in several studies and environmental documents that help in decision making due to the possibility of precise data aggregation inherent to classic mathematical models and the inaccuracies of the real world. Fuzzy logic is used to standardize the criteria on a scale of 0 to 1, with values close to 0 considered the least favorable and values close to 1 the most favorable [20].
The analytic hierarchy process (AHP) multicriteria analysis method developed by Thomas L. Saaty was used to support this study. The AHP is a selection method based on pairwise comparisons and a predefined scale to express the importance of one criterion over another with regard to decision making. It addresses the level of consistency in calculations and can be applied to quantitative or qualitative data [21].
The combination of fuzzy logic, the AHP method and geotechnologies can be a promising approach for analyzing the environmental vulnerability of a pond, considering its drainage surface [22].
In recent research by [23,24], which are studies similar to this one, fuzzy logic, the AHP method and geographic data were used to map and classify the flooding risk and environmental fragility in watersheds since environmental fragility, which is related to environments at risk, represents the vulnerability of the environment when experiencing interventions, including erosive processes, silting and flooding [25]. In [22], surveys were used to classify environmental fragility in watersheds; they also used fuzzy logic and the AHP method. As study methodologies, the authors found that they yielded satisfactory results in their studies. Research on typical estuarine and coastal ports obtained significant results by analyzing the essential regularity and determining factors of their spatial expansion using remote sensing and geographic information system technology [26].
Environmental vulnerability mapping is a technique that consists of identifying and evaluating the factors that make a certain area or ecosystem susceptible to negative impacts resulting from human activities or natural events. It is an important management and territorial planning tool, allowing the protection of the environmental system to be measured and the development of mitigation measures to reduce negative impacts [27]. In this context, the objective of this work is to describe and evaluate the effectiveness of a methodology based on fuzzy logic and the analytic hierarchy process (AHP) method and the use of geotechnologies and to map the environmental vulnerability of a lagoon and its surroundings.

2. Materials and Methods

2.1. Study Area

The study area comprises the Juparanã Lagoon, located in Espírito Santo state, Brazil, and its surroundings, named in this work as the Juparanã Lagoon Drainage Surface (JLDS). It is located in the north of the state between parallels 19°13′44″ and 19°23′16″ S and meridians 40°13′09″ and 40°04′16″ W (Figure 1). The area was defined from the selection of the 9 ottobasins of level 7, which are stretches of the drainage surface that face the Juparanã Lagoon, generated from the methodological steps presented in Figure 2. It has an area of 271.31 km2, is approximately 35 km long and 8 km wide and covers the municipalities of Linhares, Rio Bananal and Sooretama.
According to the Köppen climate classification, the study area of the Juparanã Lagoon Drainage Surface (JLDS) has an “Aw” climate, that is, a rainy tropical climate, with a dry season in winter. The average temperature of the coldest month is above 18 °C [28].
The average annual rainfall is 1278.9 mm, seasonally divided into two periods. A rainy one, which comprises the months of October to April, with a total of 1019.9 mm, which corresponds to 79.8% of the accumulated annual total, and a less rainy period between the months of May to September, with a total of 258.3 mm, which corresponds to 20.2% of the accumulated annual total. In addition, the average rainfall of the driest month is less than 60 mm [29]. The predominant soil is an Oxisol, classified as a dystrophic red yellow Oxisol (LVd11 and LVd13), with a medium clayey texture and a flat, gently undulating and undulating relief [30].
The main economic activities carried out in the JLDS are agriculture and livestock rearing, with emphasizing on pasture, coffee production, eucalyptus and fish farming [29].

2.2. Methodological Steps

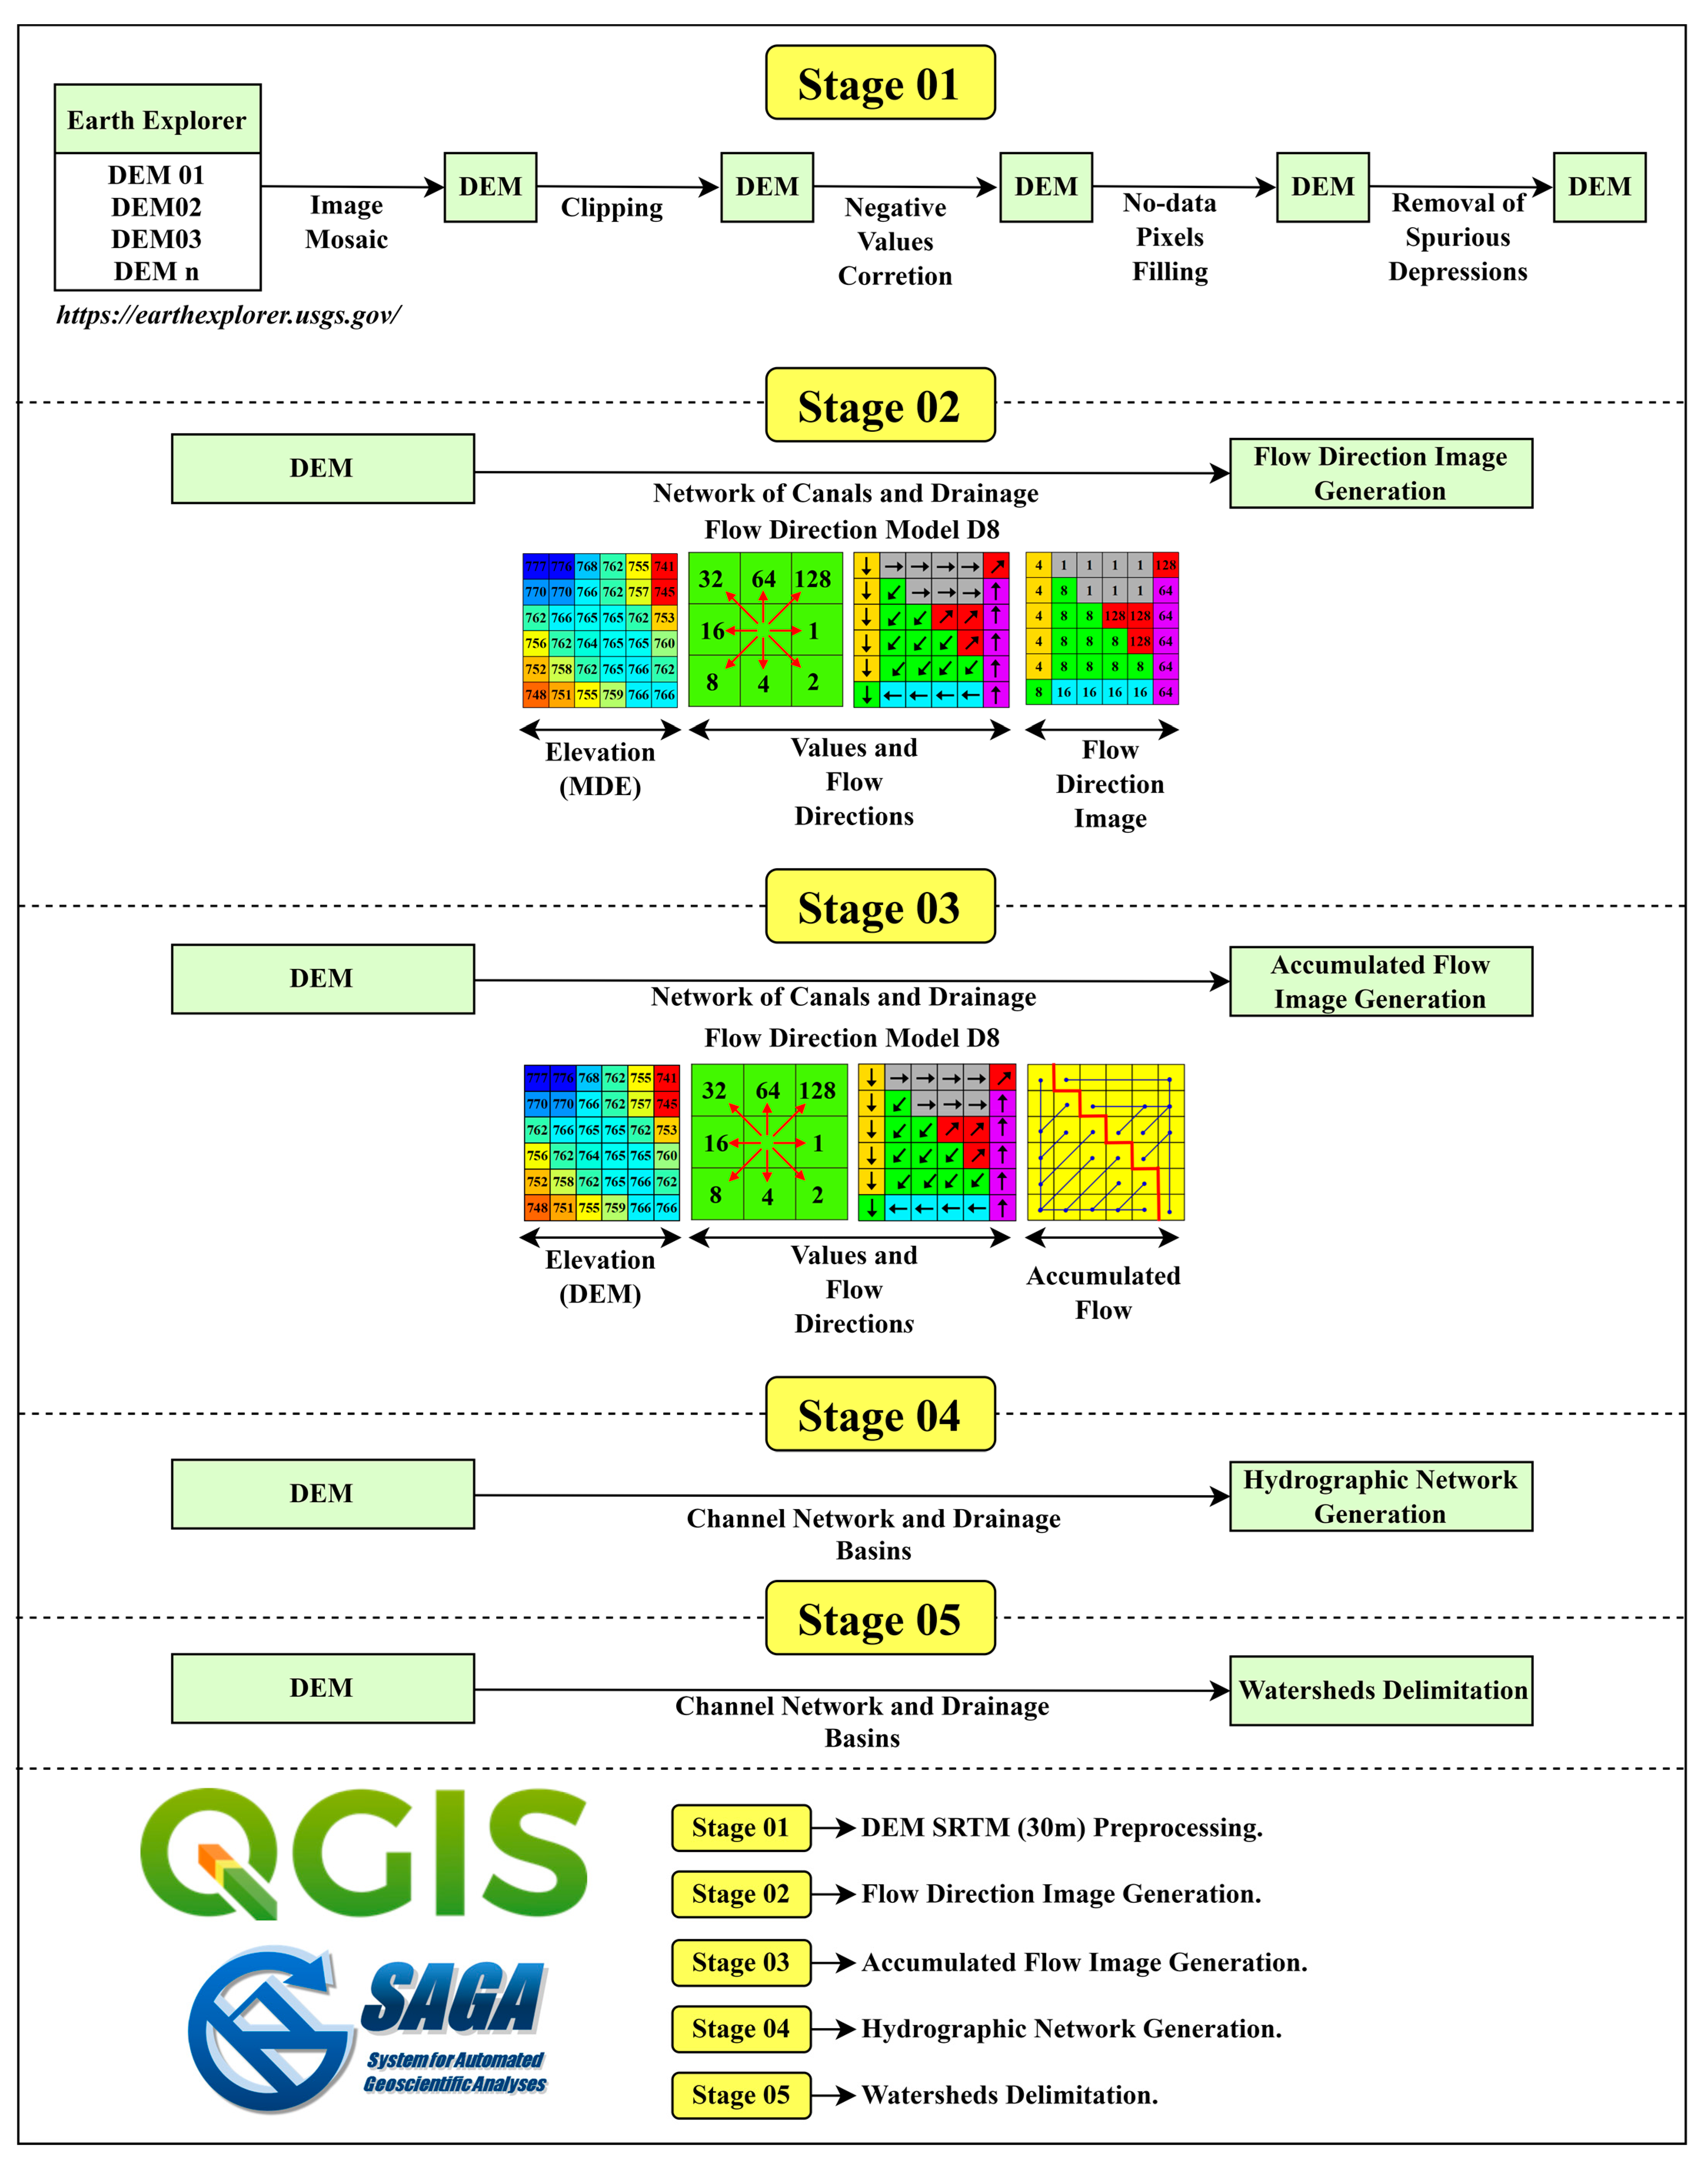
Stage 01—Delimitation of watersheds around Juparanã Lagoon, Espírito Santo state, Brazil
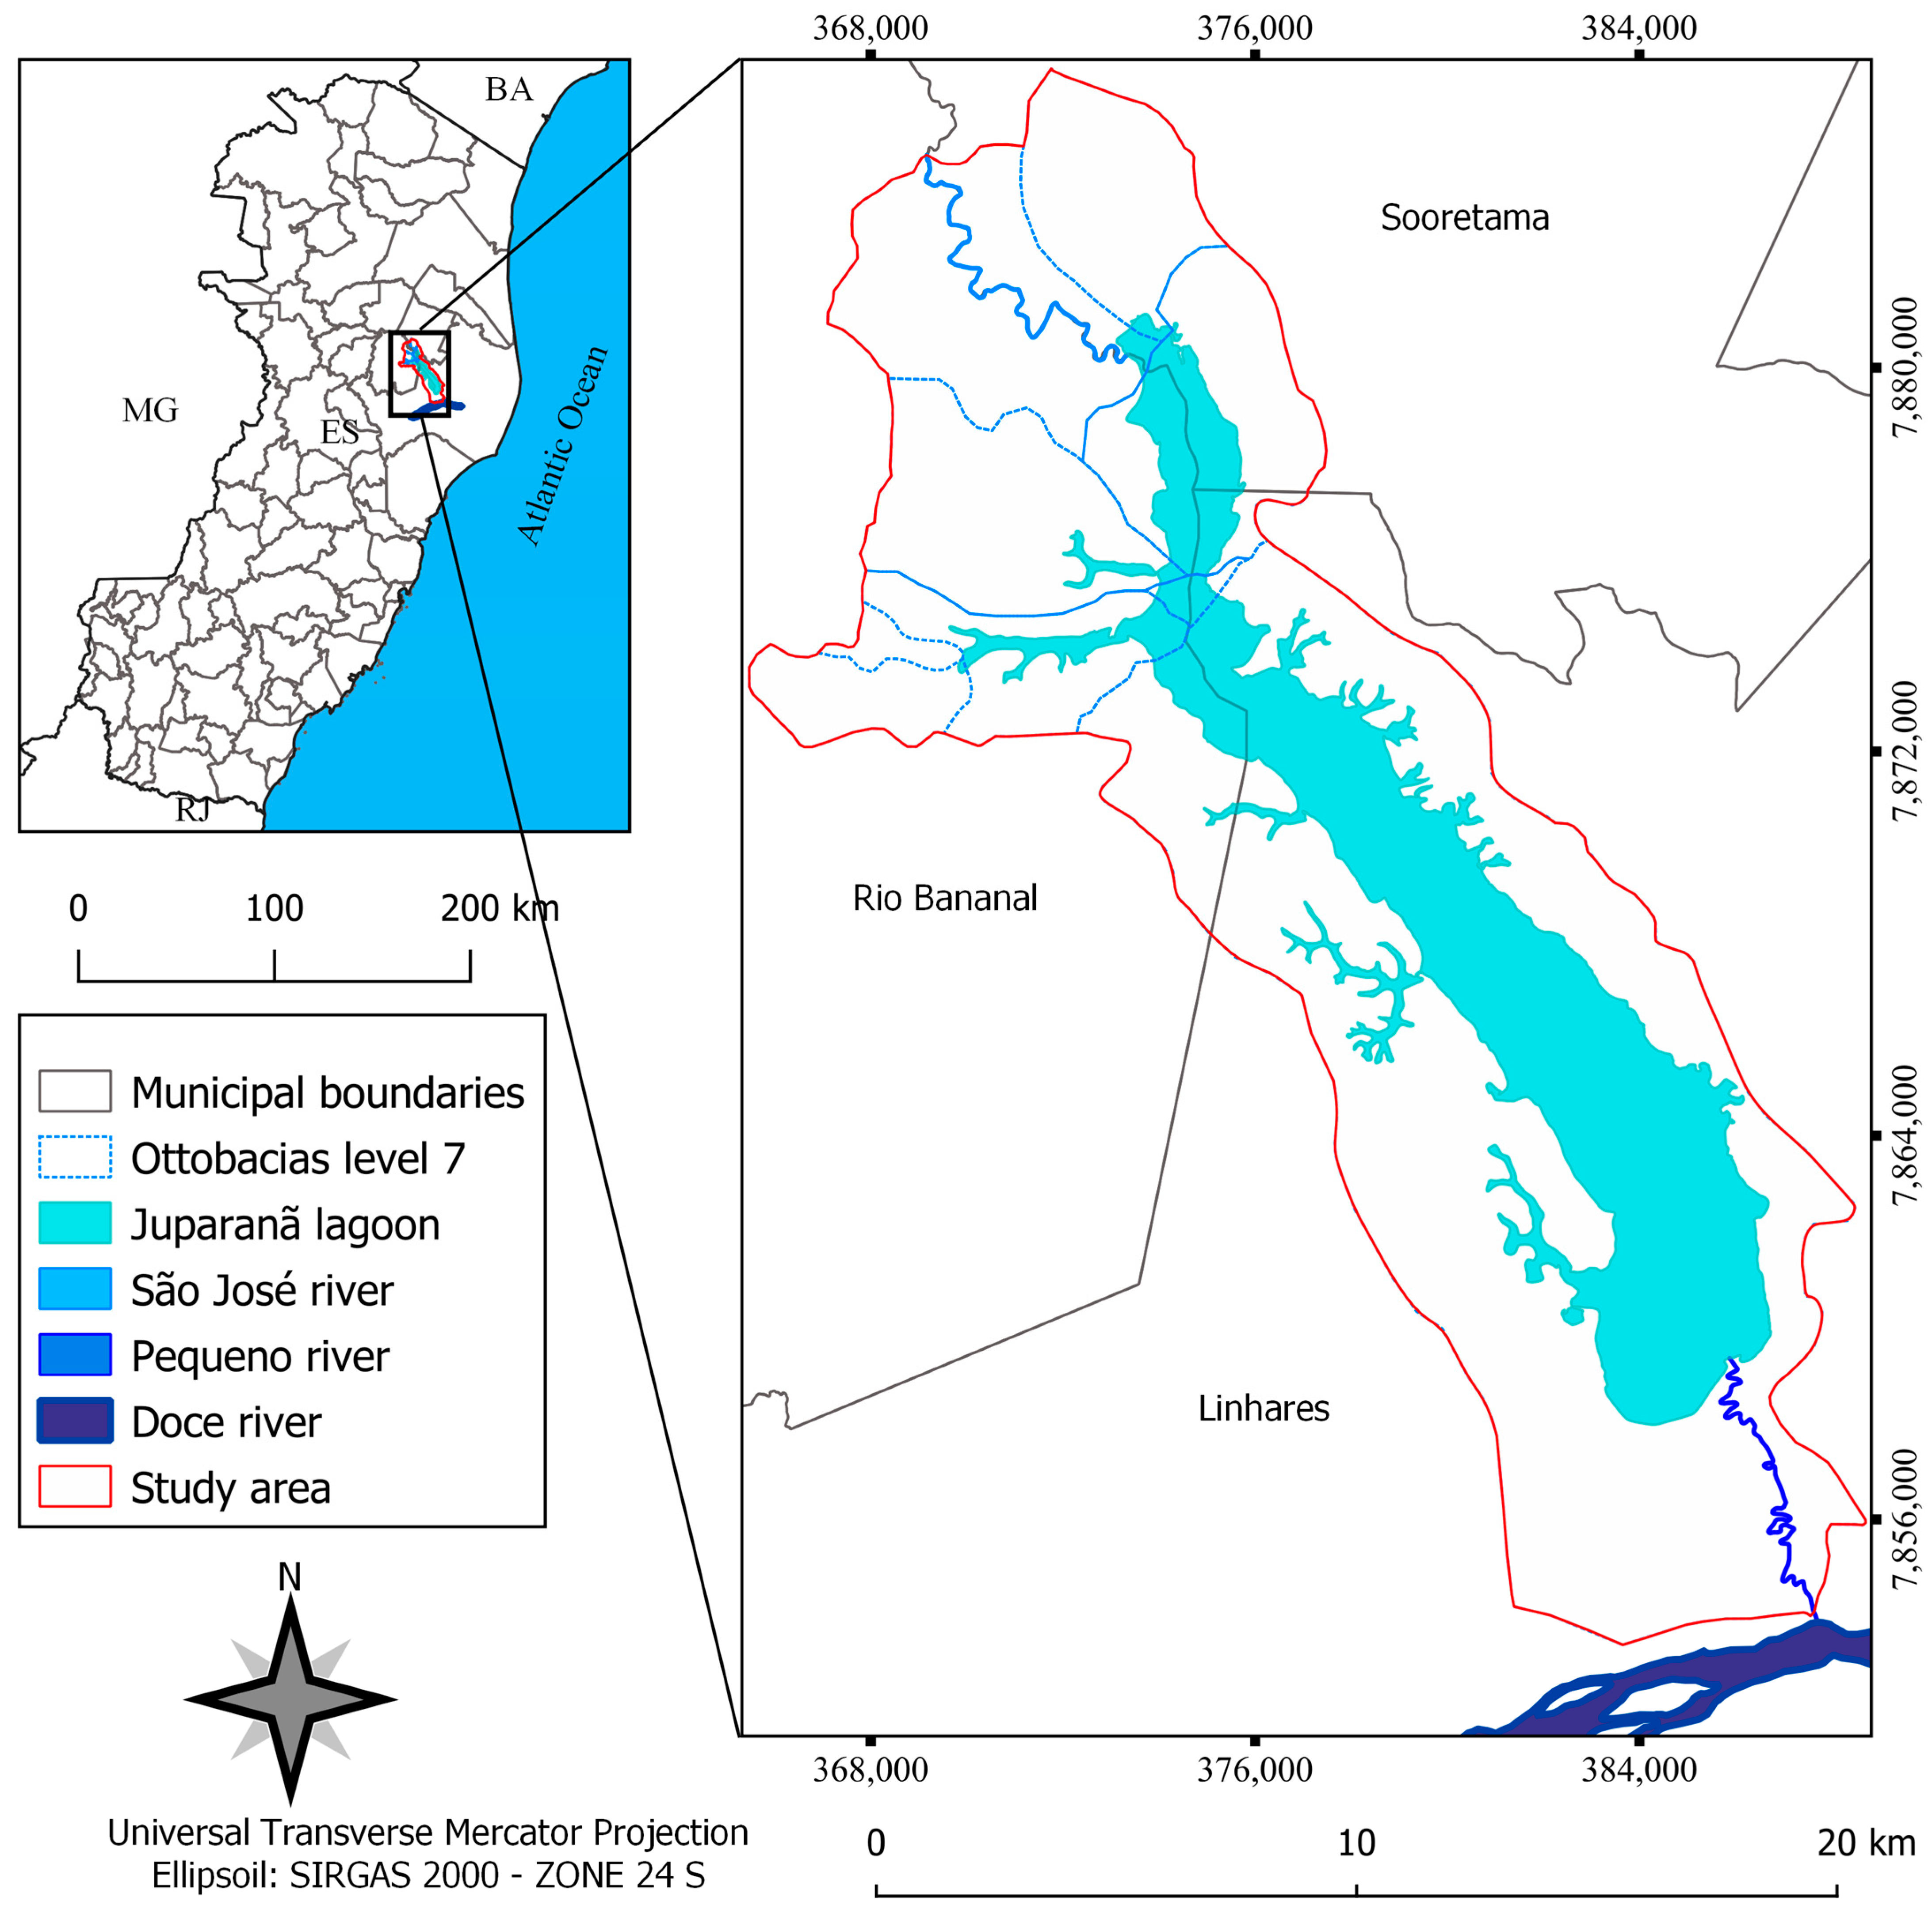
In order to apply the methodological steps adopted for the delimitation of watersheds for the Juparanã Lagoon Drainage Surface (JLDS), Espírito Santo state, Brazil, the free software QGIS (version 3.22.10) was used, together with the complement SAGA-GIS (version 7.8.2) and other functions, as shown in Figure 2.
Initially, the acquisition of matrix images of the digital elevation model (DEM) was carried out, with a spatial resolution of 30 m (1 arc-second), from the Shuttle Radar Topography Mission (SRTM), available on the United States Geological Survey website (https://earthexplorer.usgs.gov/ (accessed on 5 July 2021)), representative of the study area quadrant [31].
Subsequently, the matrix images of the DEM were pre-processed for the generation of the image mosaic, the clipping of the images for the study area (JLDS), the correction of negative values, the filling of pixels without data and the removal of spurious depressions. After pre-processing the DEM, it was applied to the function “network of channels and drainage basins” with the aim of generating images of water flow direction (flow direction model D8), accumulated water flow, hydrographic network and delimitation of hydrographic basins.
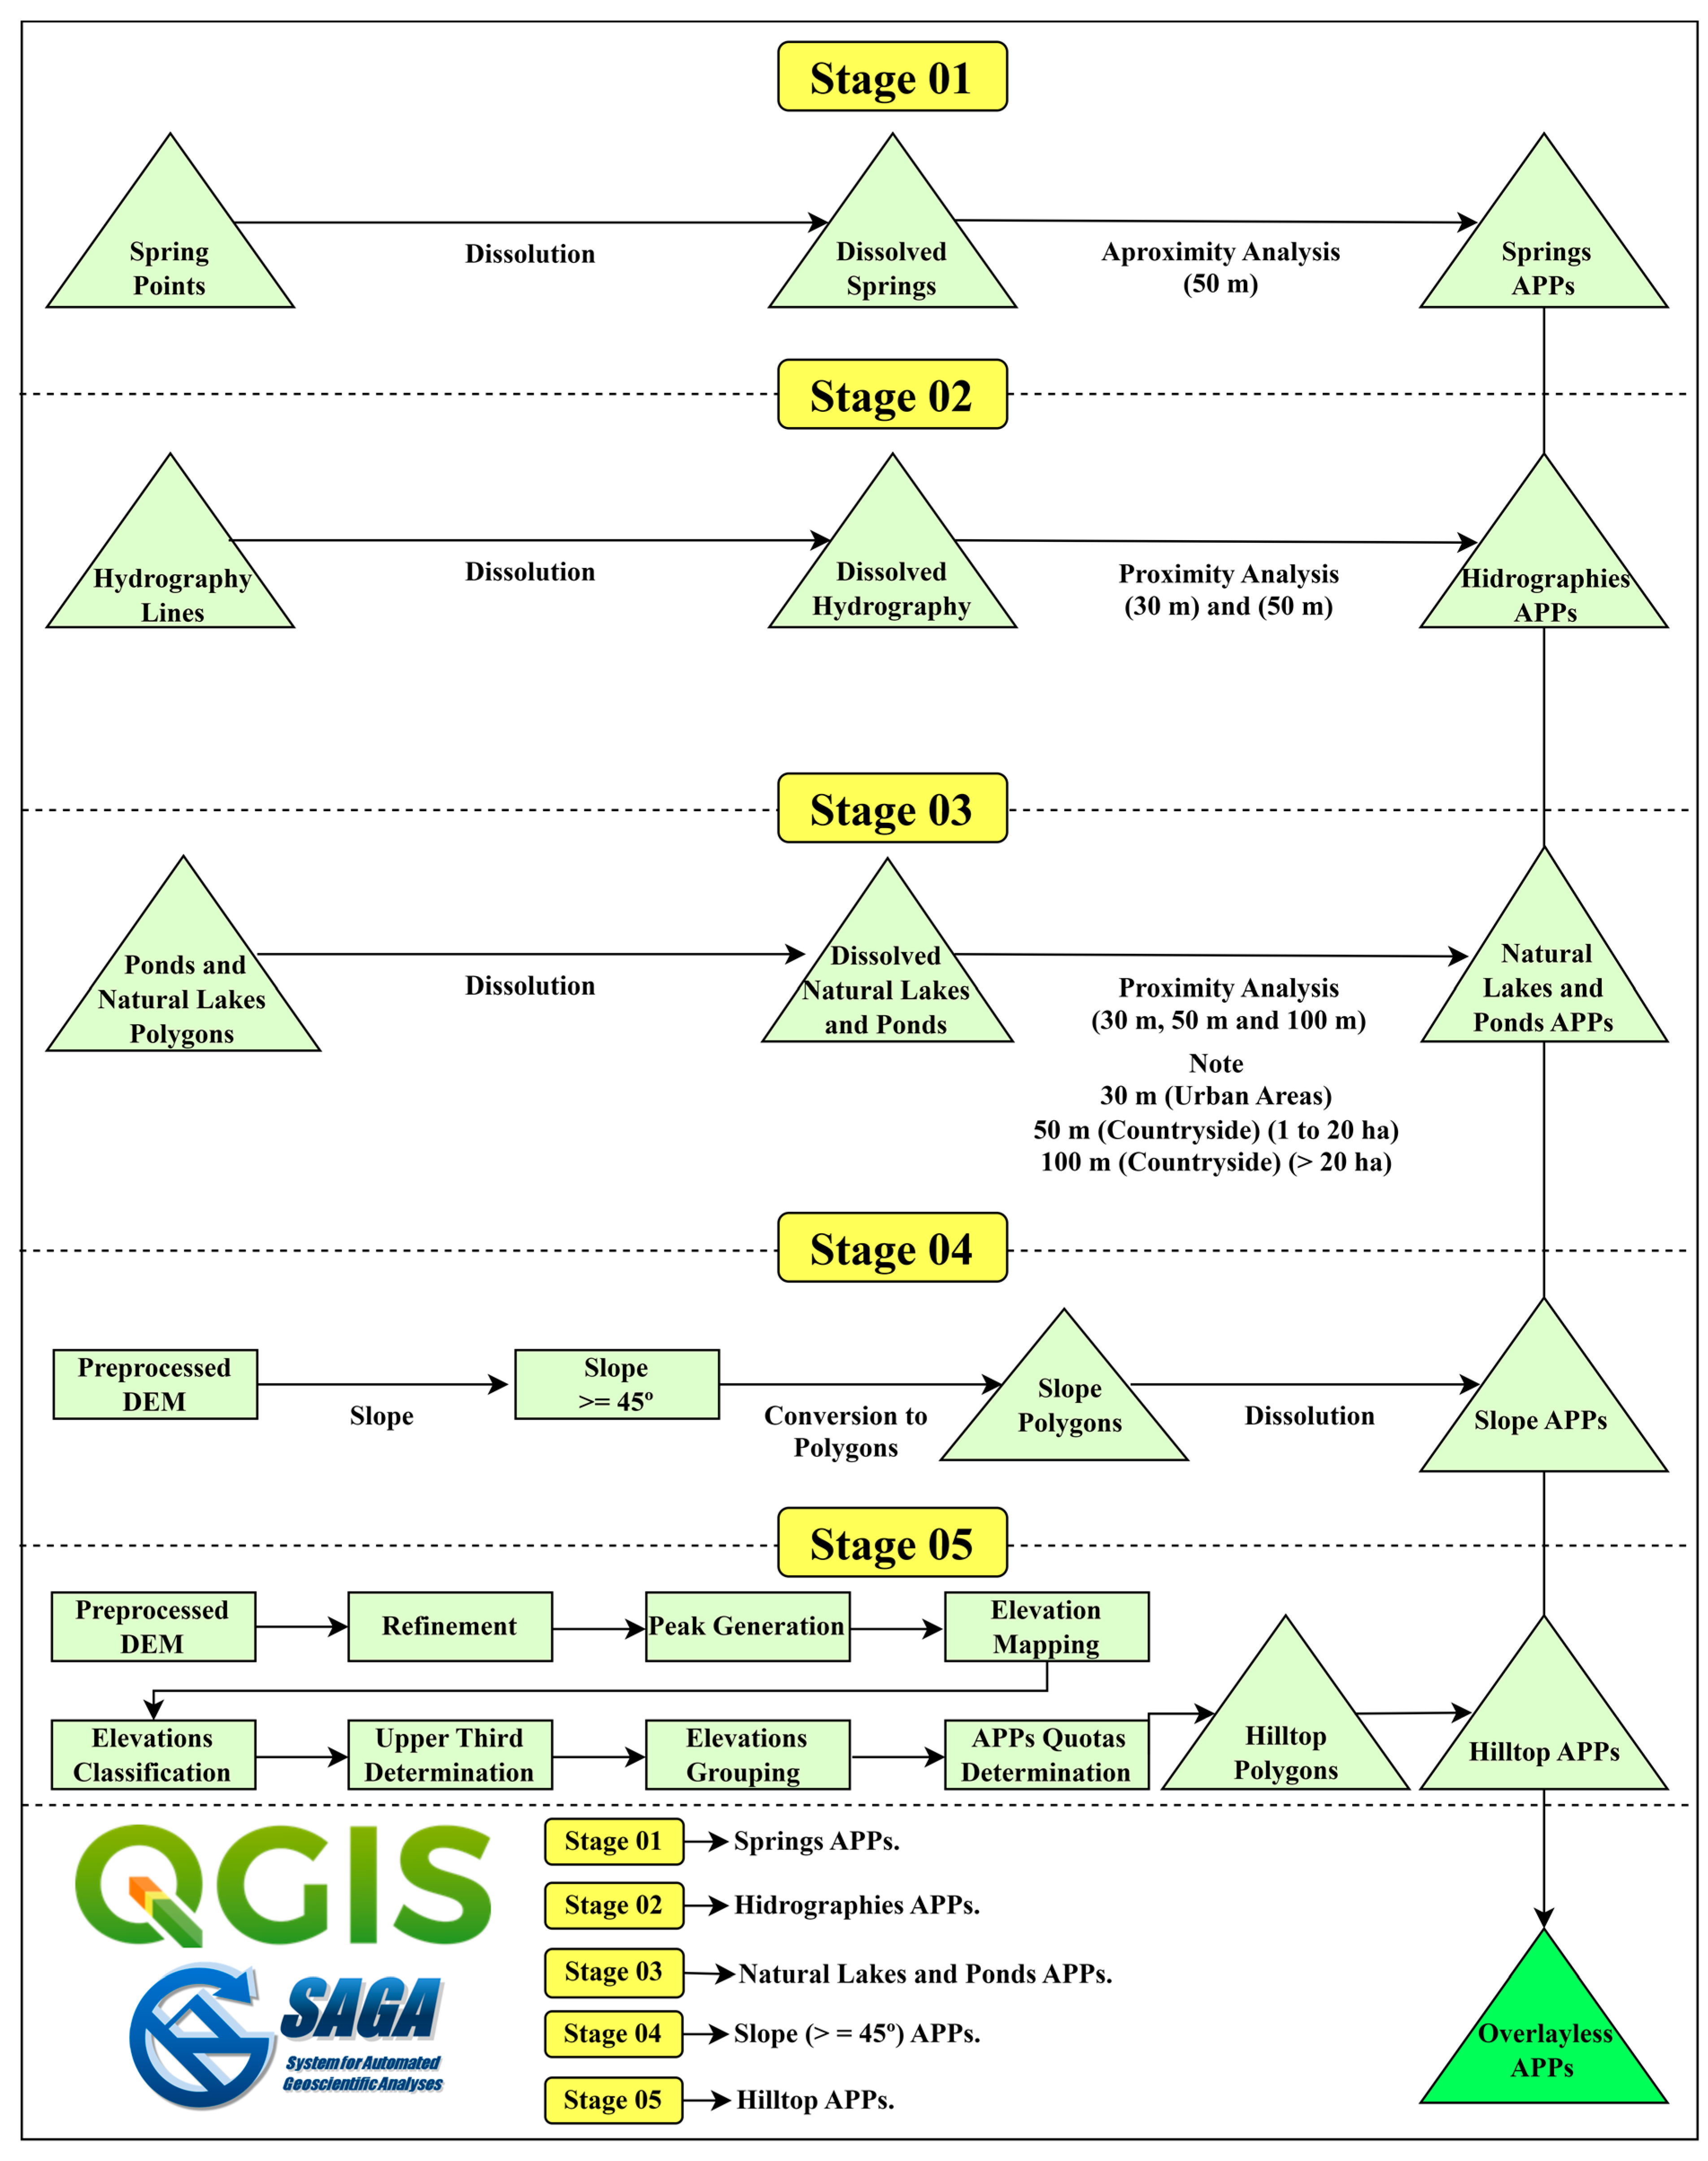
Stage 02—Spatialization of Permanent Preservation Areas (APP) based on the Brazilian Forest Code (Law nº. 12.651/2012) for the study area (JLDS)
The methodological steps for the spatialization of Permanent Preservation Areas (APP) based on the Brazilian Forest Code (Law nº. 12,651/2012) for the study area (JLDS) are shown in Figure 3.
All methodological steps were applied using the free QGIS application (version 3.22.10), and its complements and functions were based on the methodology proposed by [32,33,34,35].
Delimitation of the APP around the springs
At this stage, the vector file of points of the springs, in shapefile format, in the study area (JLDS) was initially dissolved, using the “dissolution” function, with the objective of generating a point vector image of dissolved springs.
Subsequently, the “proximity analysis” function was applied, with a buffer of 50 m and having as input the point vector image of dissolved springs, with the final objective of generating a vector file of polygons representative of the APP of springs.
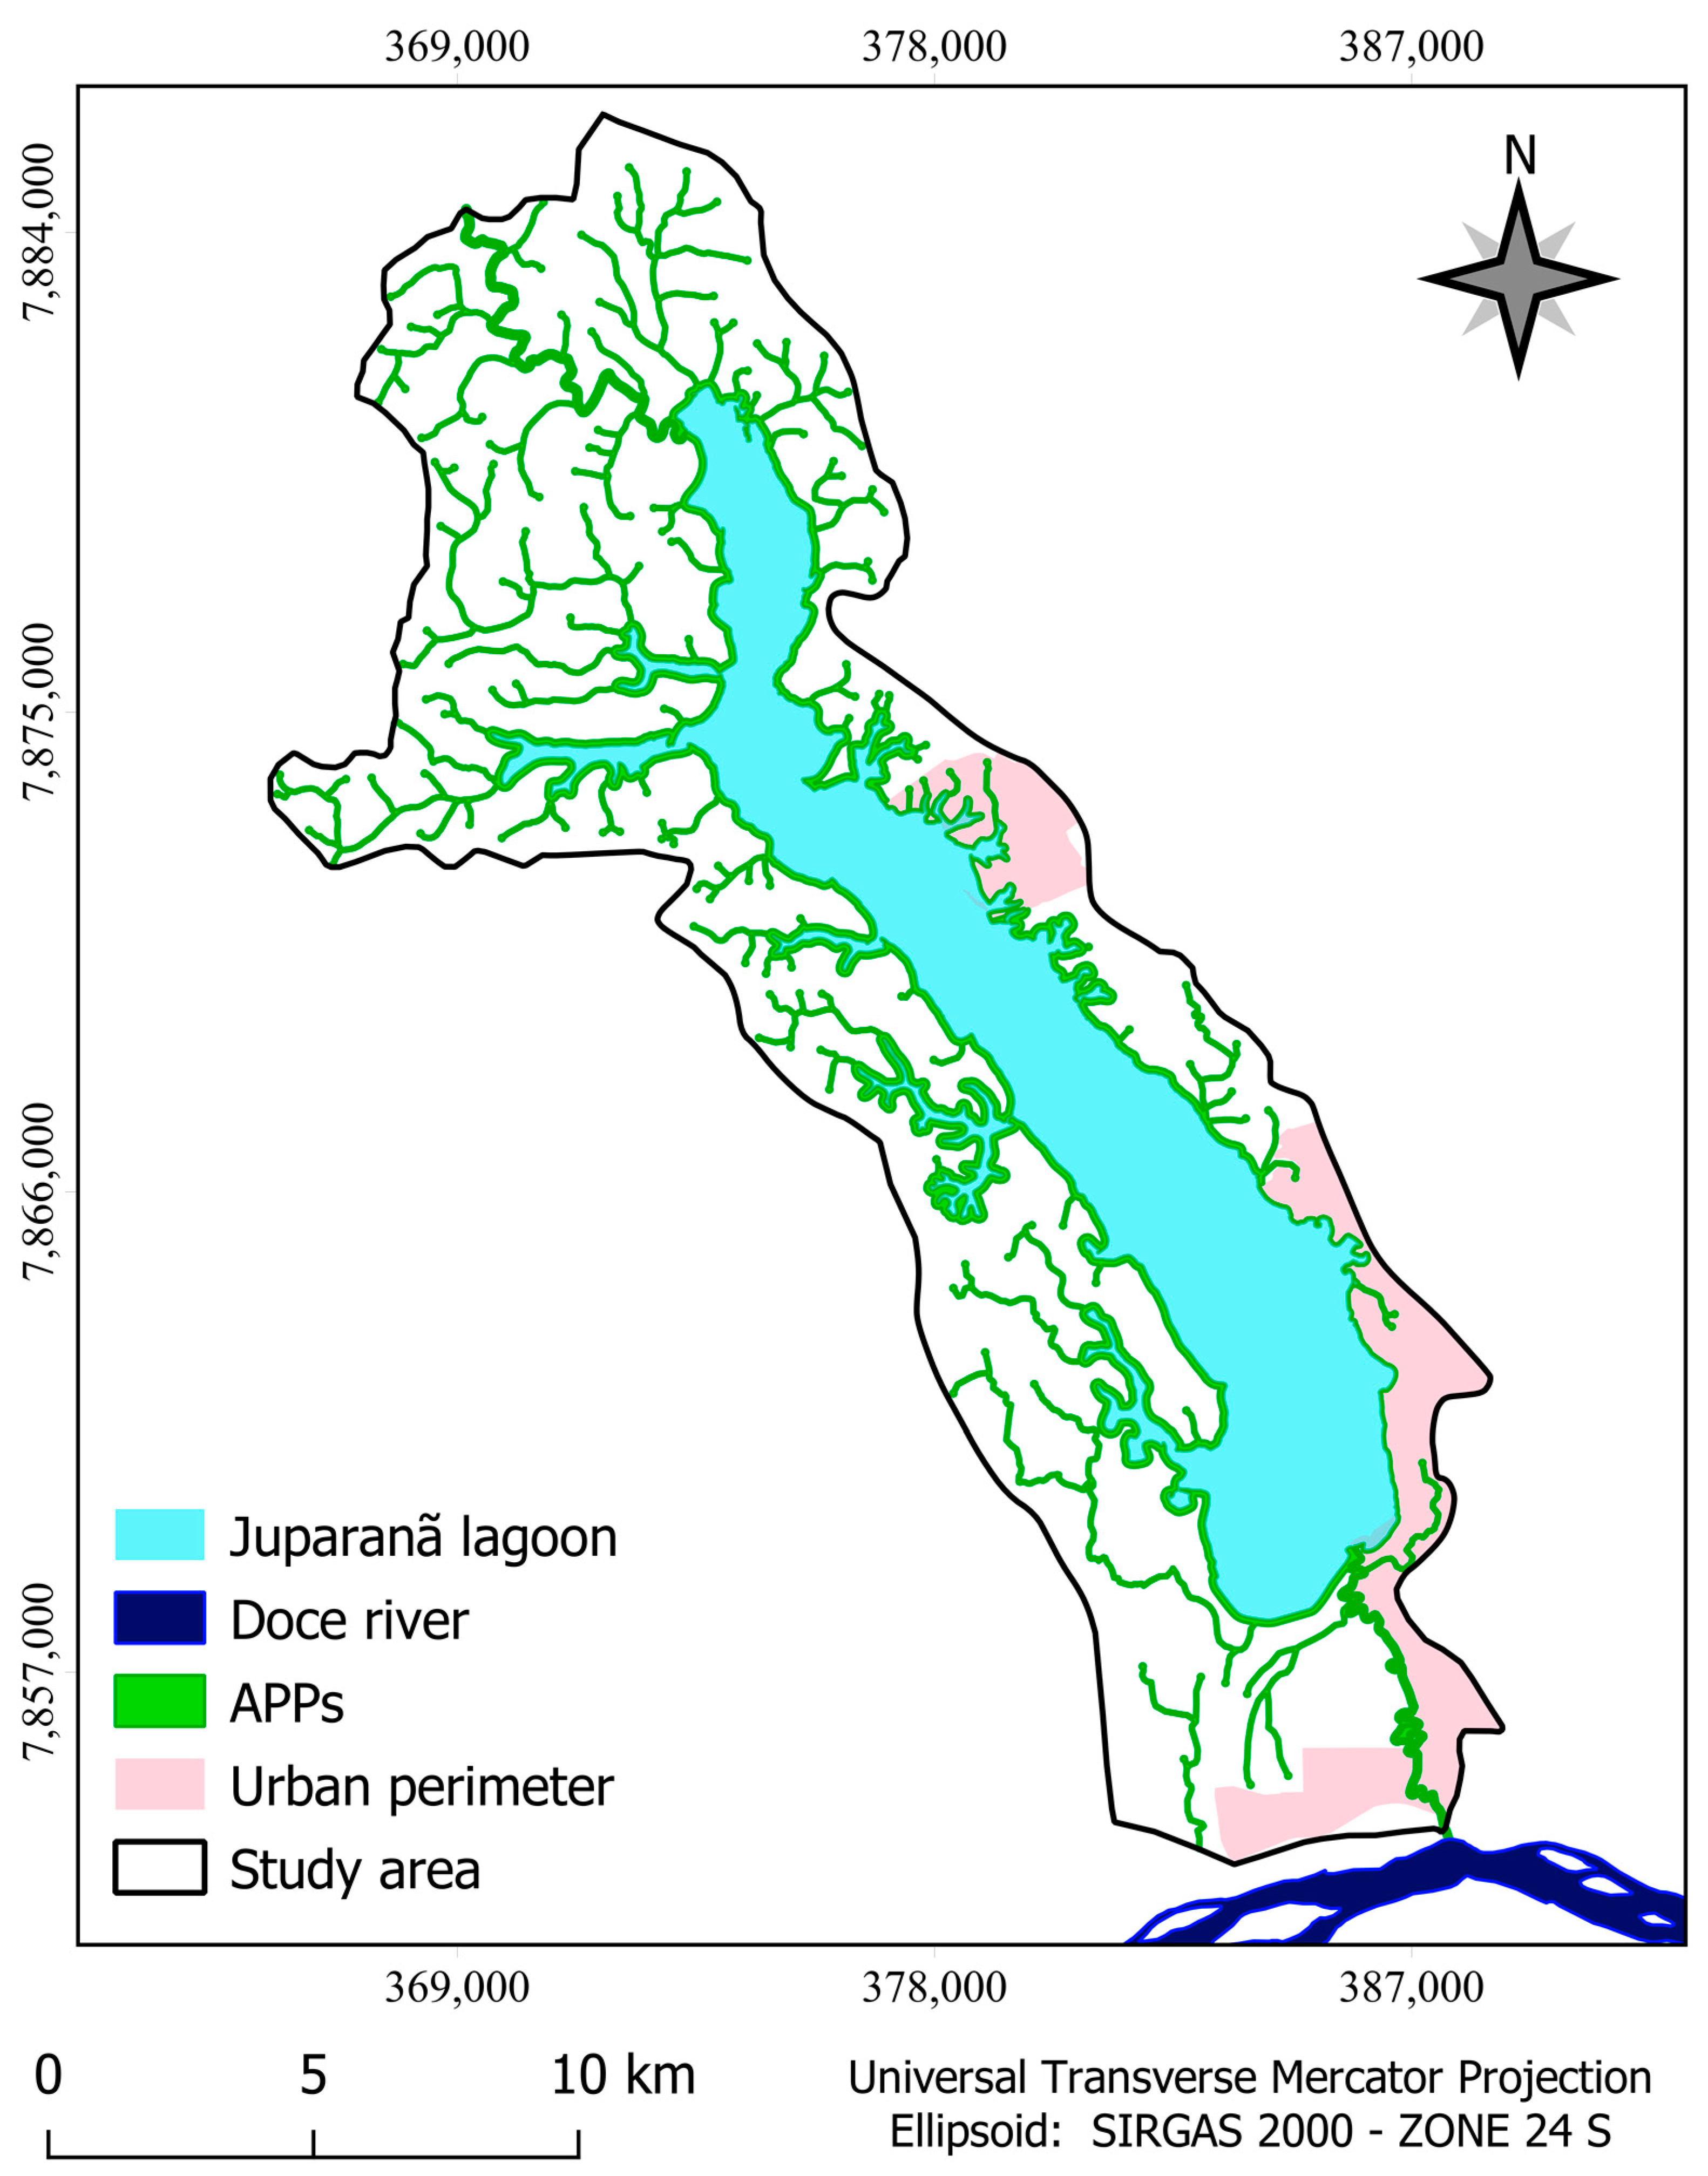
Delimitation of APPs along the marginal strip of watercourses
In this step, the vector file of hydrographic lines, in shapefile format, of the study area (JLDS) was initially dissolved, using the “dissolution” function, with the objective of generating a linear vector image of the dissolved hydrography [35].
Subsequently, the “varied proximity analysis” function was applied, with buffers of 30 m (watercourses < 10 m wide) and 50 m (watercourses between 10 and 50 m wide) and having as input the linear vector image of dissolved hydrography to generate a vector file of polygons representative of the APP along the marginal strip of watercourses [35].
Delimitation of APP around natural lakes and ponds
At this stage, the vector file of polygons of natural lakes and ponds, in shapefile format, from the study area (JLDS) was initially dissolved using the “dissolution” function, with the objective of generating a dissolved polygonal vector image of natural lakes and ponds.
Finally, the “varied proximity analysis” function was applied, with buffers of 30 m (Urban Area), 50 m (Rural Area: 1 to 20 ha) and 100 m (Rural Area: >20 ha), having as input the dissolved polygonal vector image of natural lakes and ponds, with the final objective of generating a vector file of polygons representing the APPs around natural lakes and ponds.
Delimitation of the APP of slopes with a slope greater than 45°
In this stage, the “declivity” function was applied, having as input the digital elevation model (DEM) matrix image pre-processed in 5 steps, with the objective of generating a continuous matrix image of the slope.
Subsequently, the slope continuous matrix image was reclassified, using the “reclassify” function, with the objective of generating a reclassified slope discrete matrix image with slopes greater than 45°.
Then, the reclassified slope discrete matrix image with slopes greater than 45° was converted to polygons, using the “conversion to polygons” function, with the aim of generating a polygonal vector image with slopes greater than 45°.
Finally, the polygonal vector image with slopes greater than 45° was dissolved (“dissolution” function) with the final objective of generating the vector file of polygons of the slope APPs.
Hilltop APP delimitation
The hilltop APPs, according to Law nº 12.651/2012 [10], are represented by areas on hilltops, hills and mountains, with a minimum height of 100 m and an average slope more significant than 25°. These areas are delimited from the contour corresponding to two-thirds of the minimum elevation height in relation to the base of the hill or mountain with the lowest height in the set.
Taking as input the matrix image of the DEM from SRTM, initially, its refinement was carried out, and later, the matrix images of the summits of each hill, mountain and mountain range were generated. Once the summits of each hill were acquired, the elevations were mapped, which were reclassified with the aid of the “map calculator” function, where the parameters contained in the current legislation were inserted, resulting in the determination of the upper third.
Total APP delimitation without overlapping
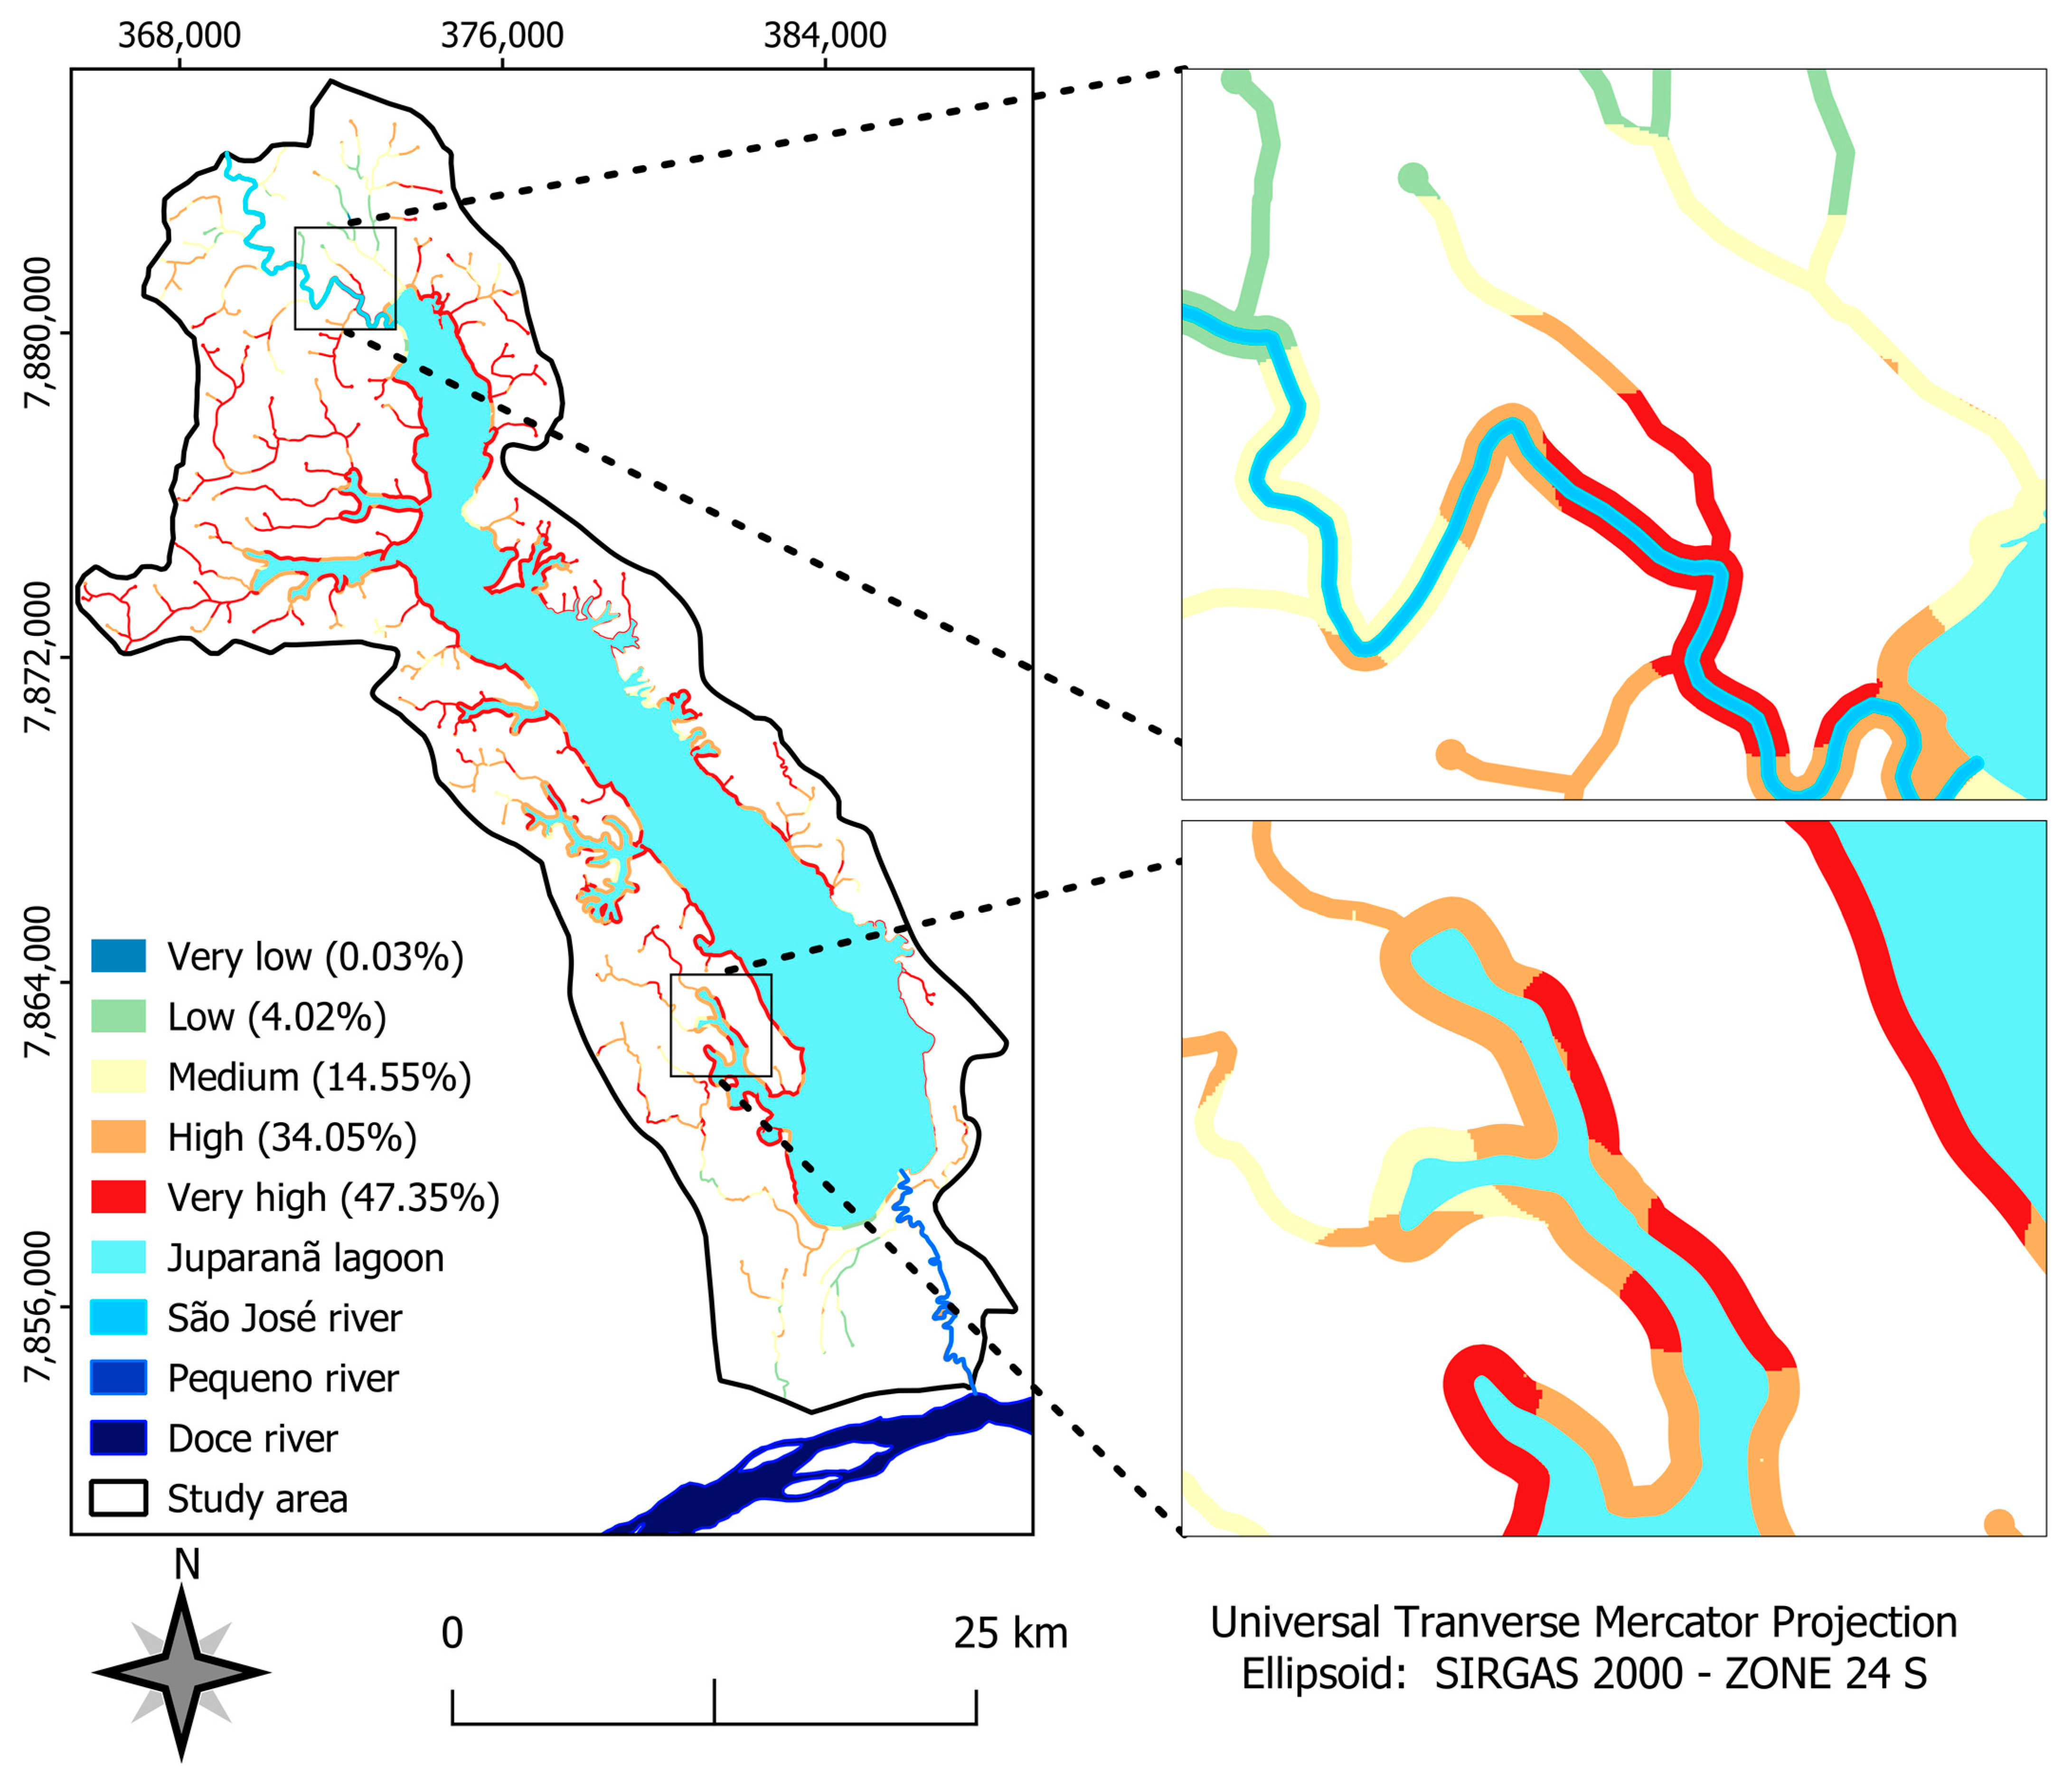
In this last stage, all the processed APPs in the previous stages (APP around the springs, APP along the marginal strip of watercourses, APP around natural lakes and ponds, APP with slopes greater than 45° and APP of hilltops) were updated using the “update” function in order to generate a polygonal vector image of the APPs without overlapping, making it possible to calculate the areas (km2), perimeters (km) and percentages (%) of the APP classes for the study area (JLDS).
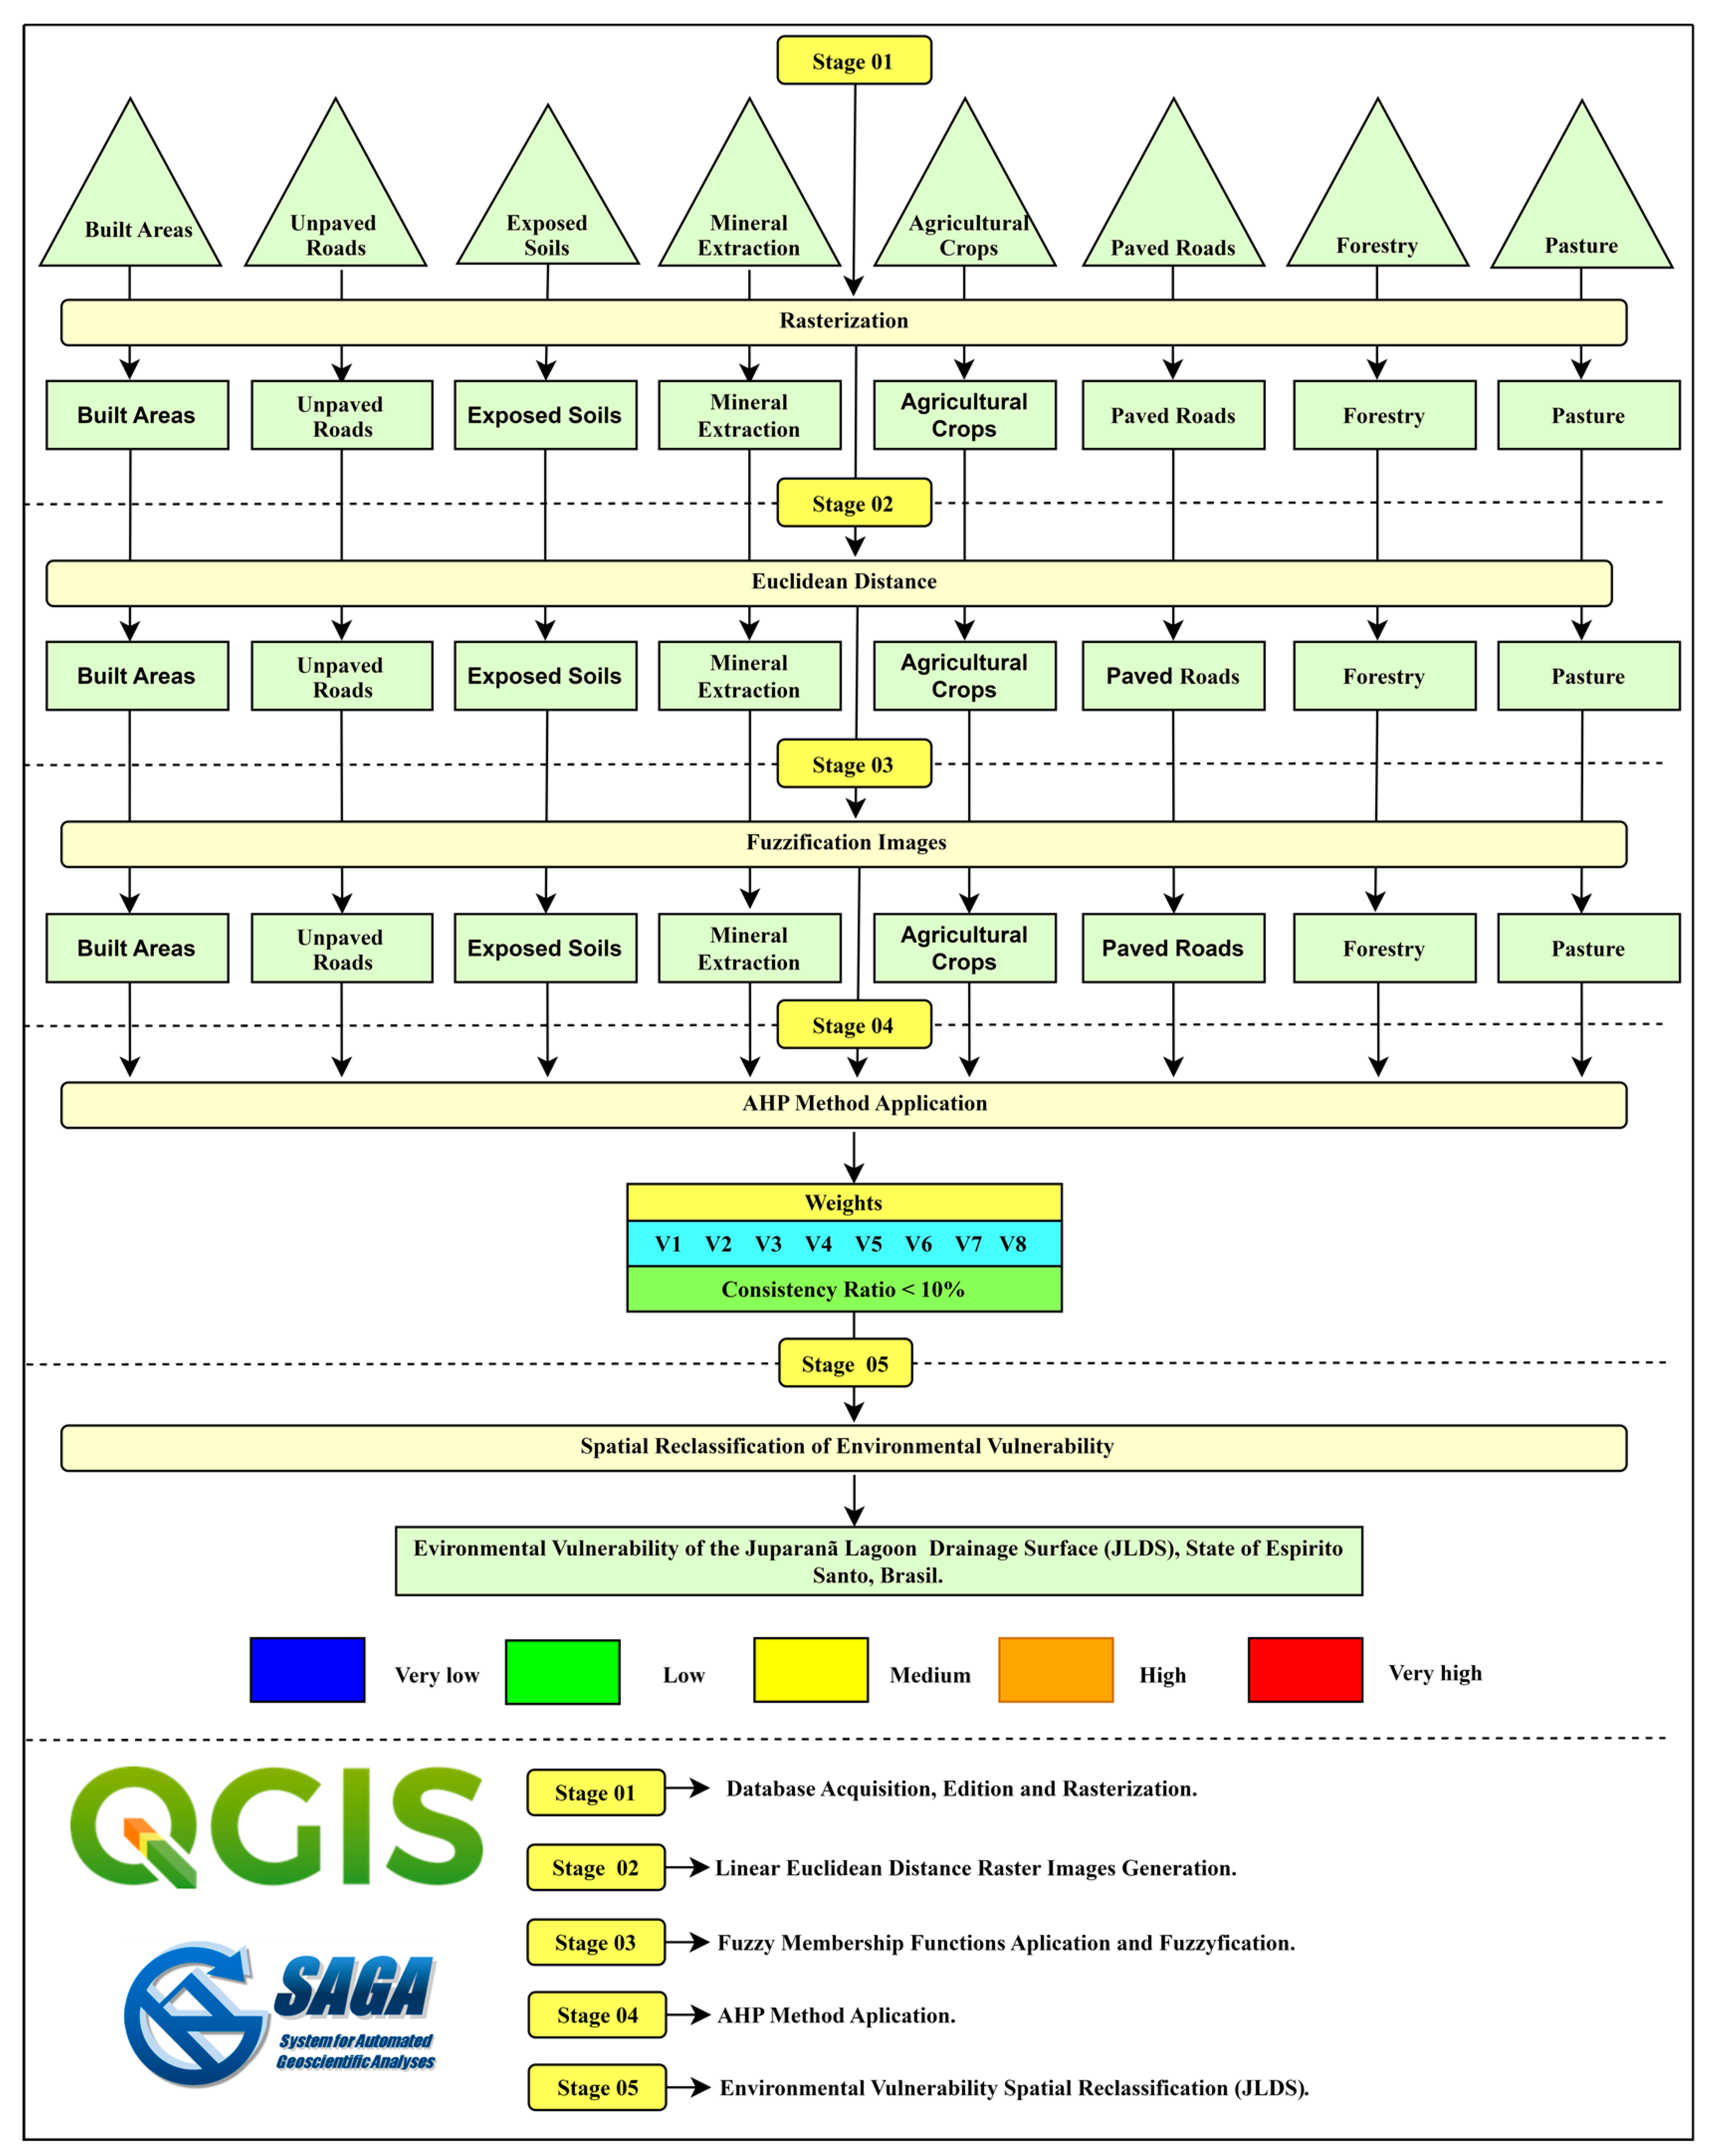
Stage 03—Spatialization of environmental vulnerability for the study area (JLDS)
The methodological steps necessary for the spatialization of environmental vulnerability for the study area (JLDS) are shown in Figure 4. All methodological steps were applied using the free software QGIS (version 3.22.10), as well as its respective complements and functions.
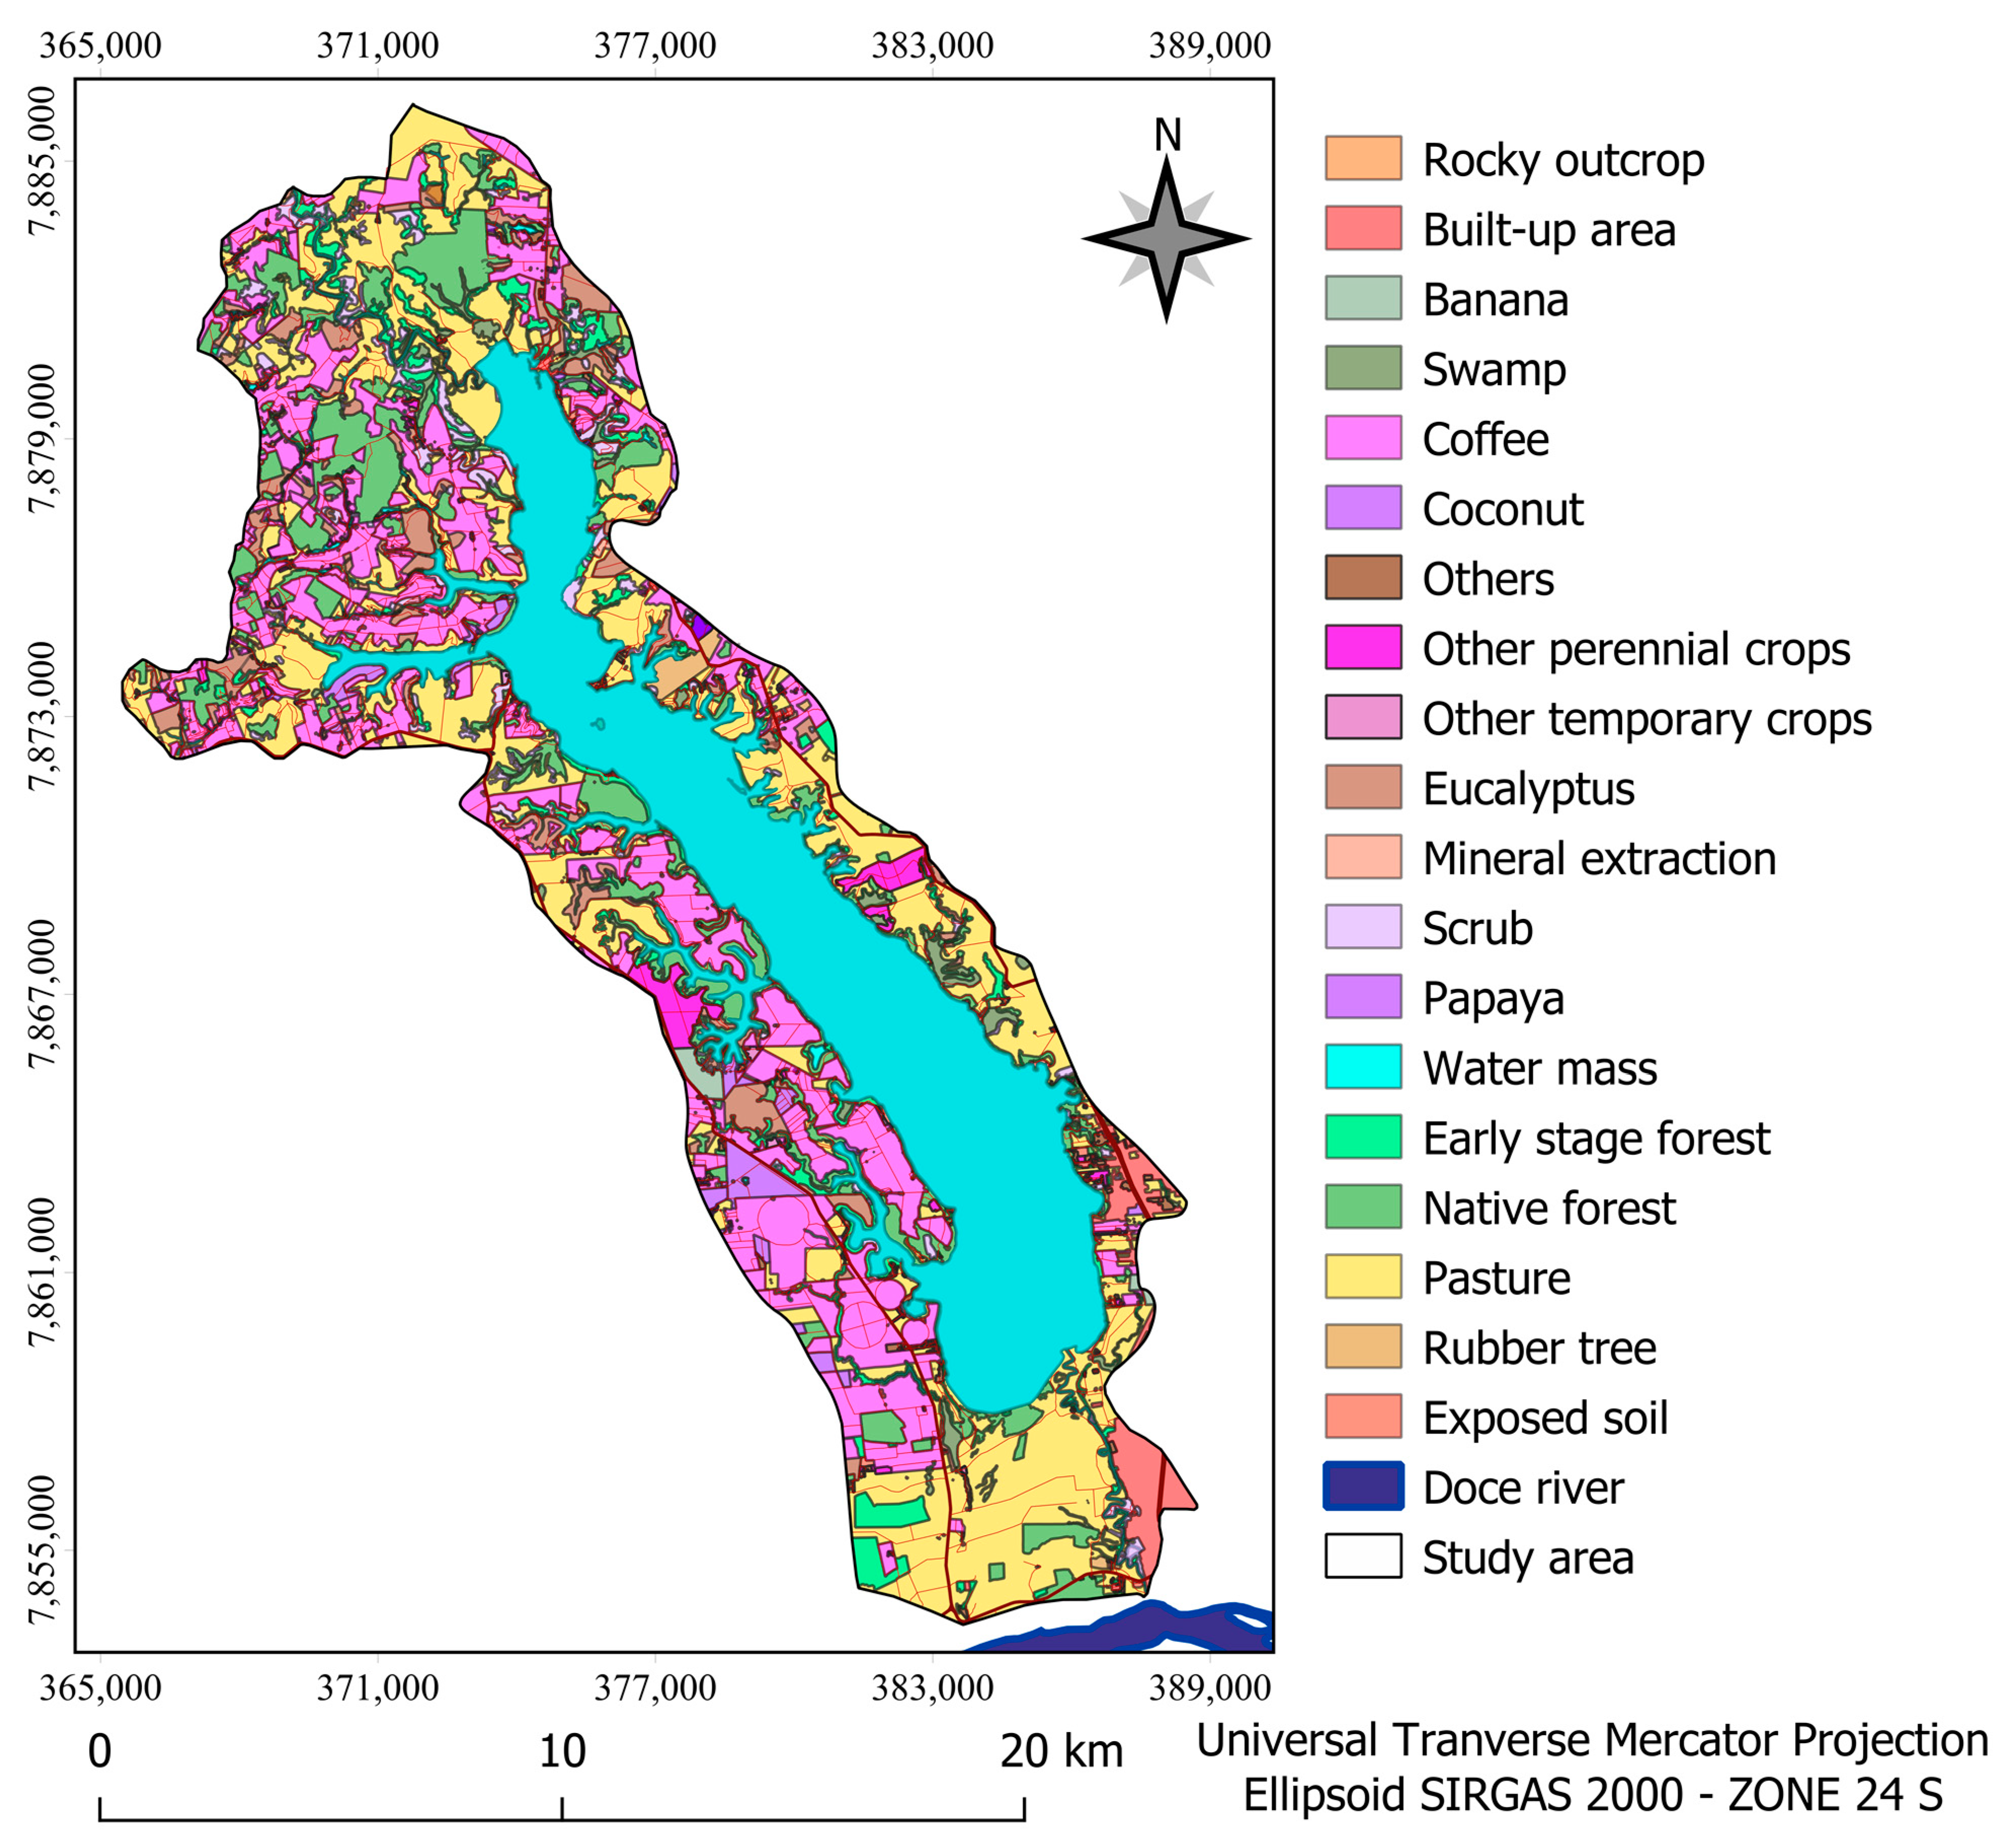
Database acquisition, editing and rasterization of input variables
The land use maps were generated via interpretative analysis at a scale of 1:2000 (photointerpretation) and the manual vectorization of the boundaries between classes of land use using images from the 3/3A sensors of the Kompsat satellites of the ES—2019–2020 with a resolution of 0.5 m, aided by the orthophotomosaic ES—2007–2008 with a resolution of 1.0 m and the orthophotomosaic ES—2012–2015 with a resolution of 0.25 m, both obtained from the Integrated System of Geospatial Bases of the State of Espírito Santo (Geobases) website (https://geobases.es.gov.br/ (accessed on 18 February 2022)).
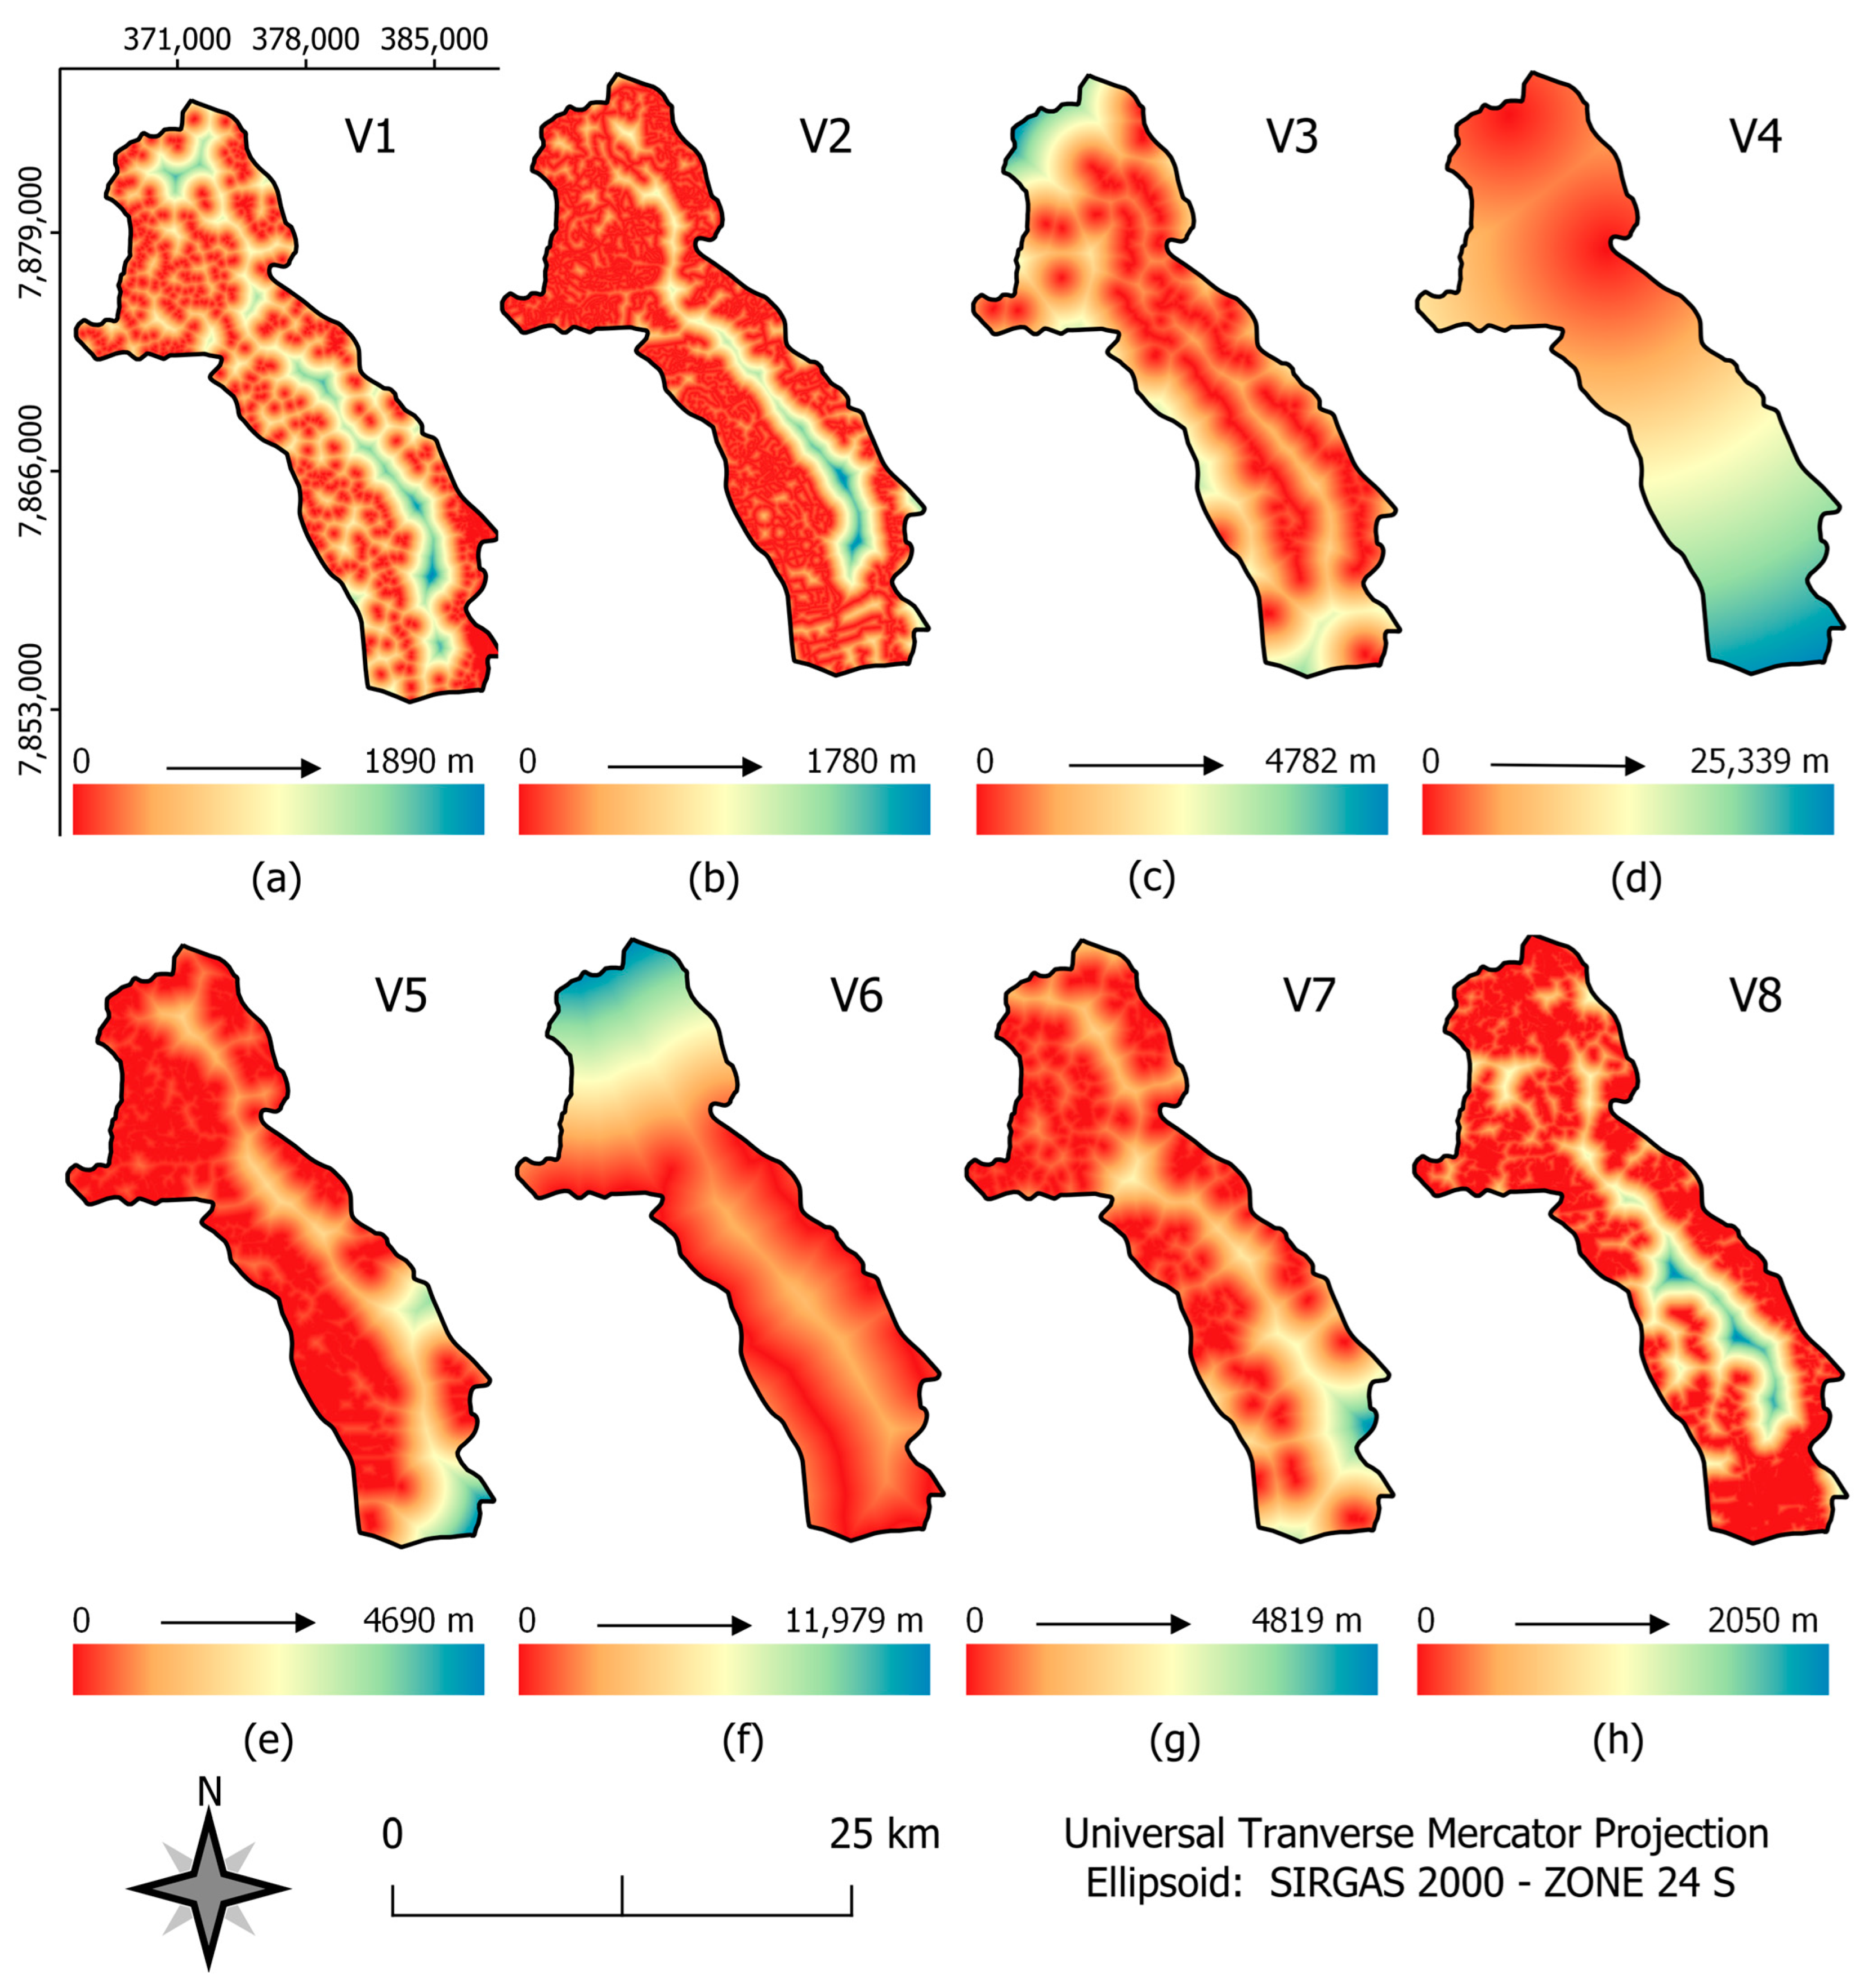
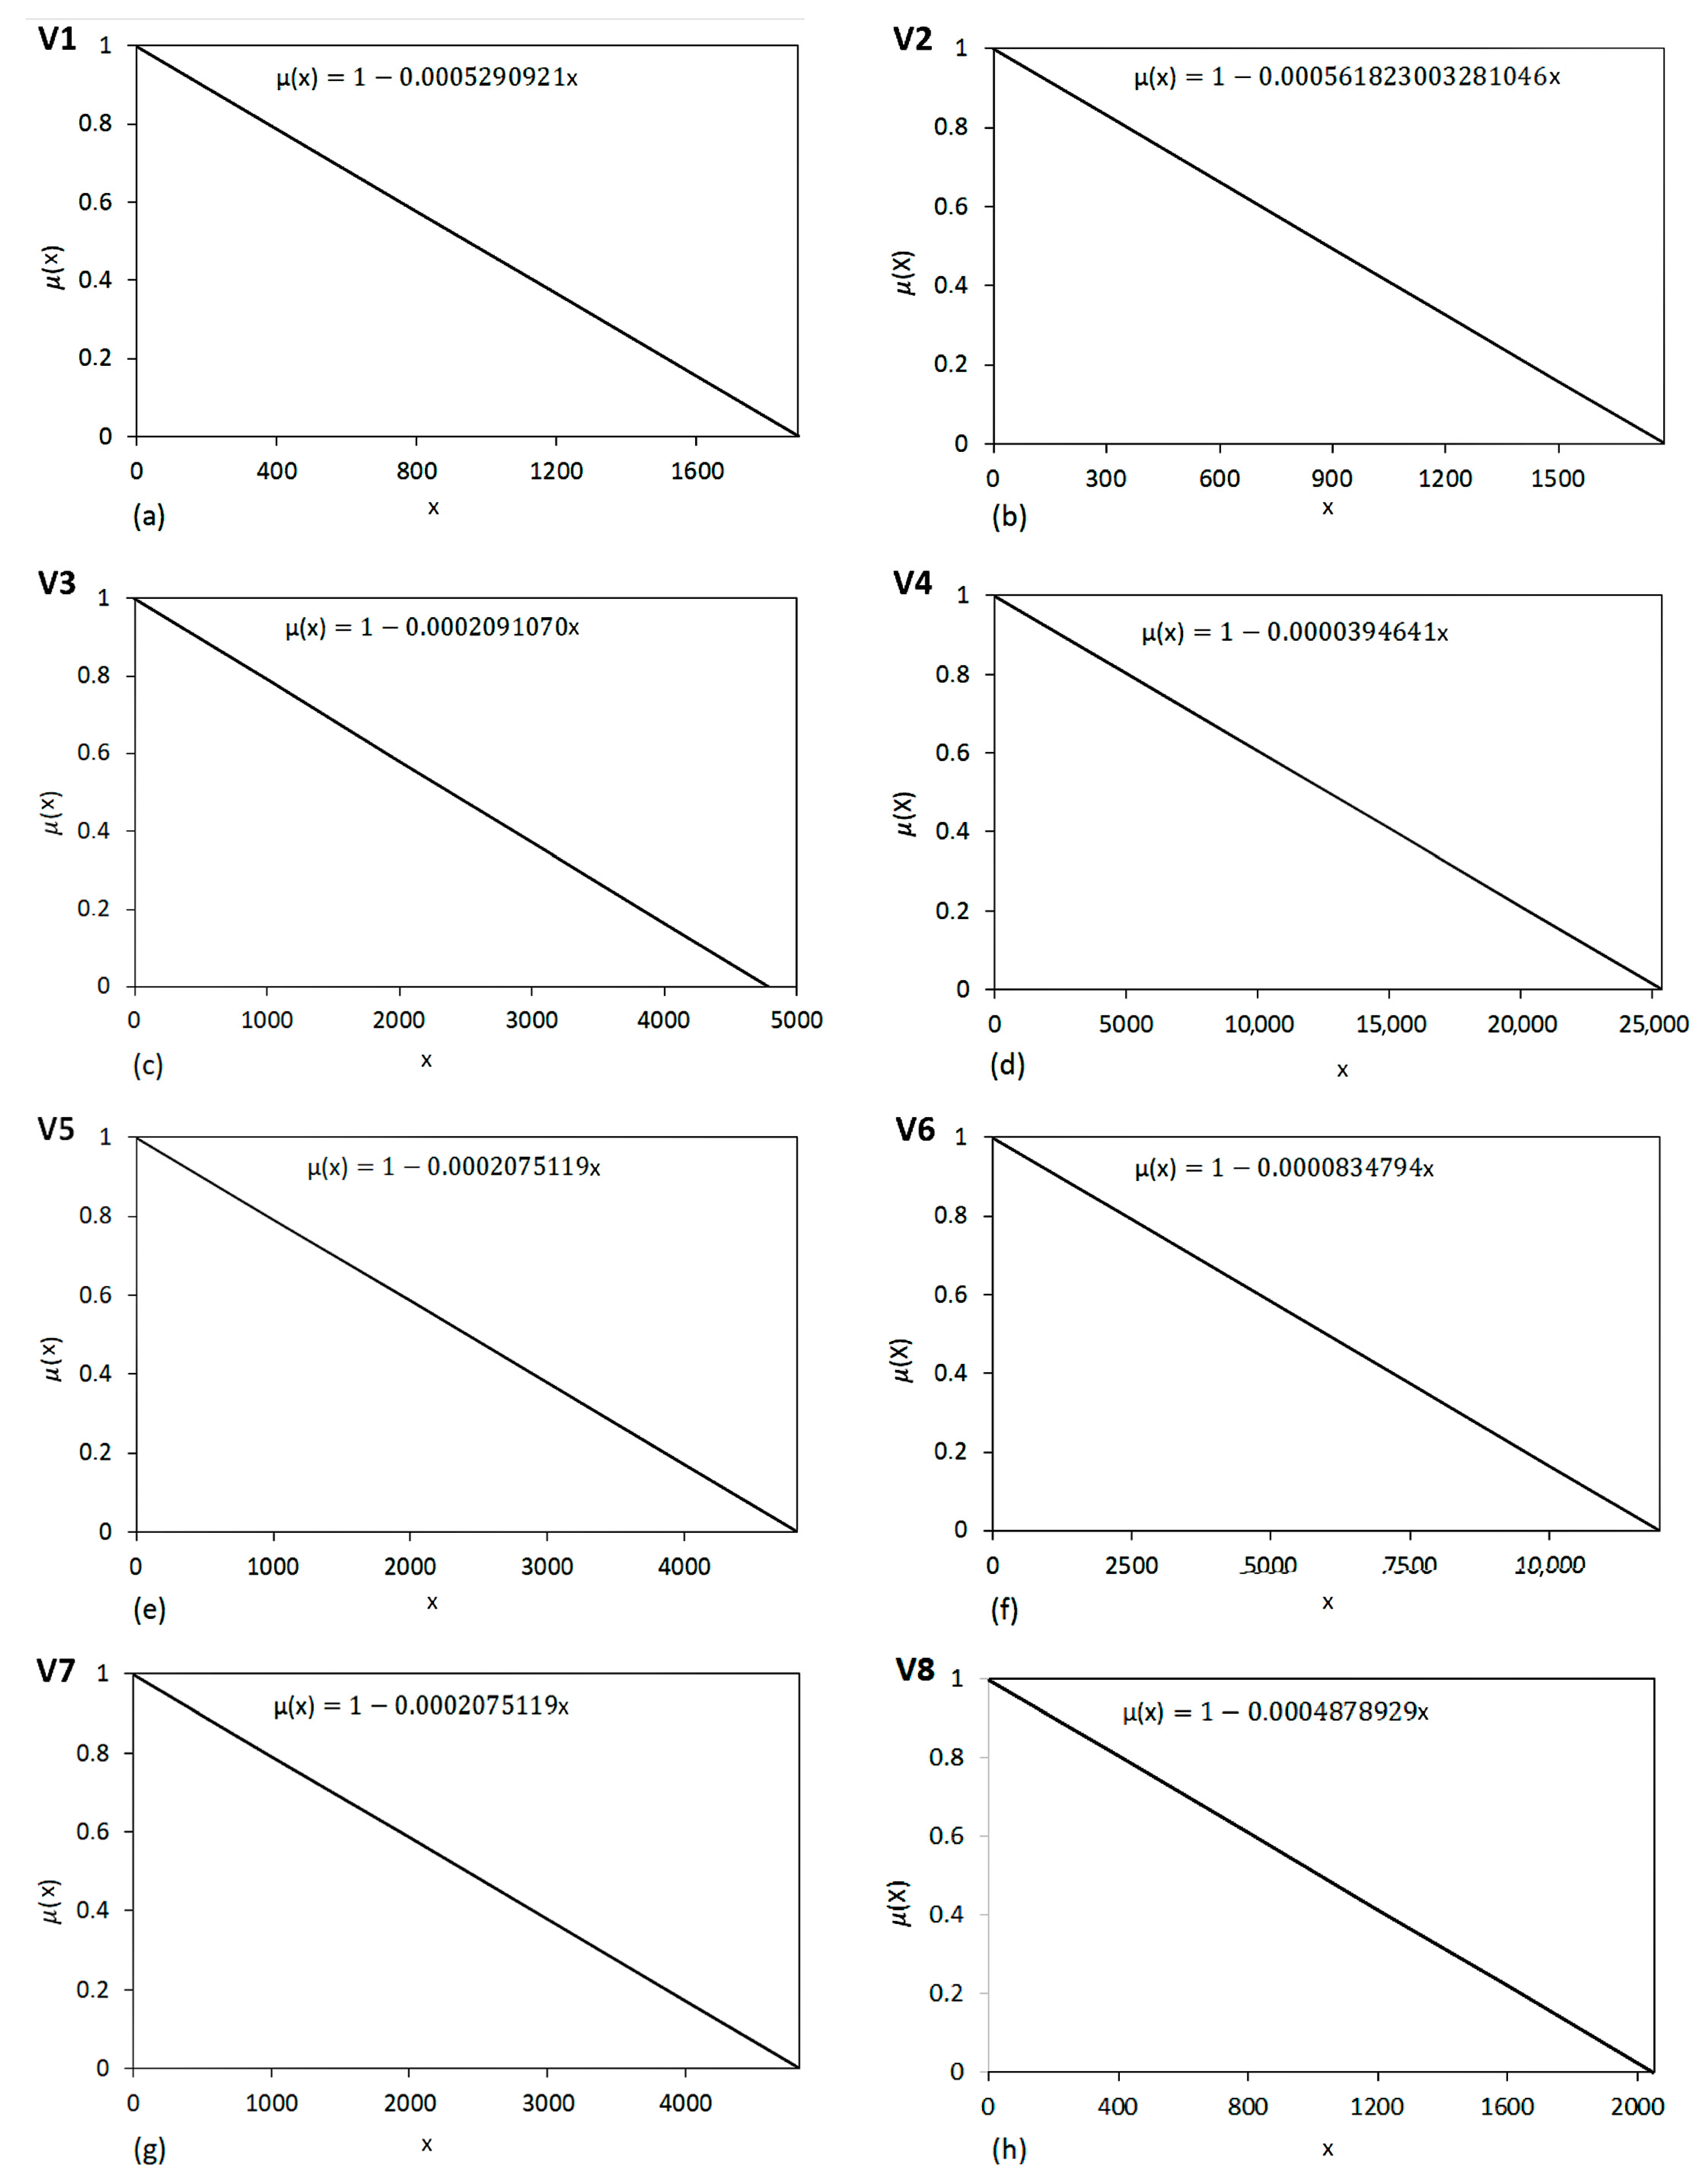
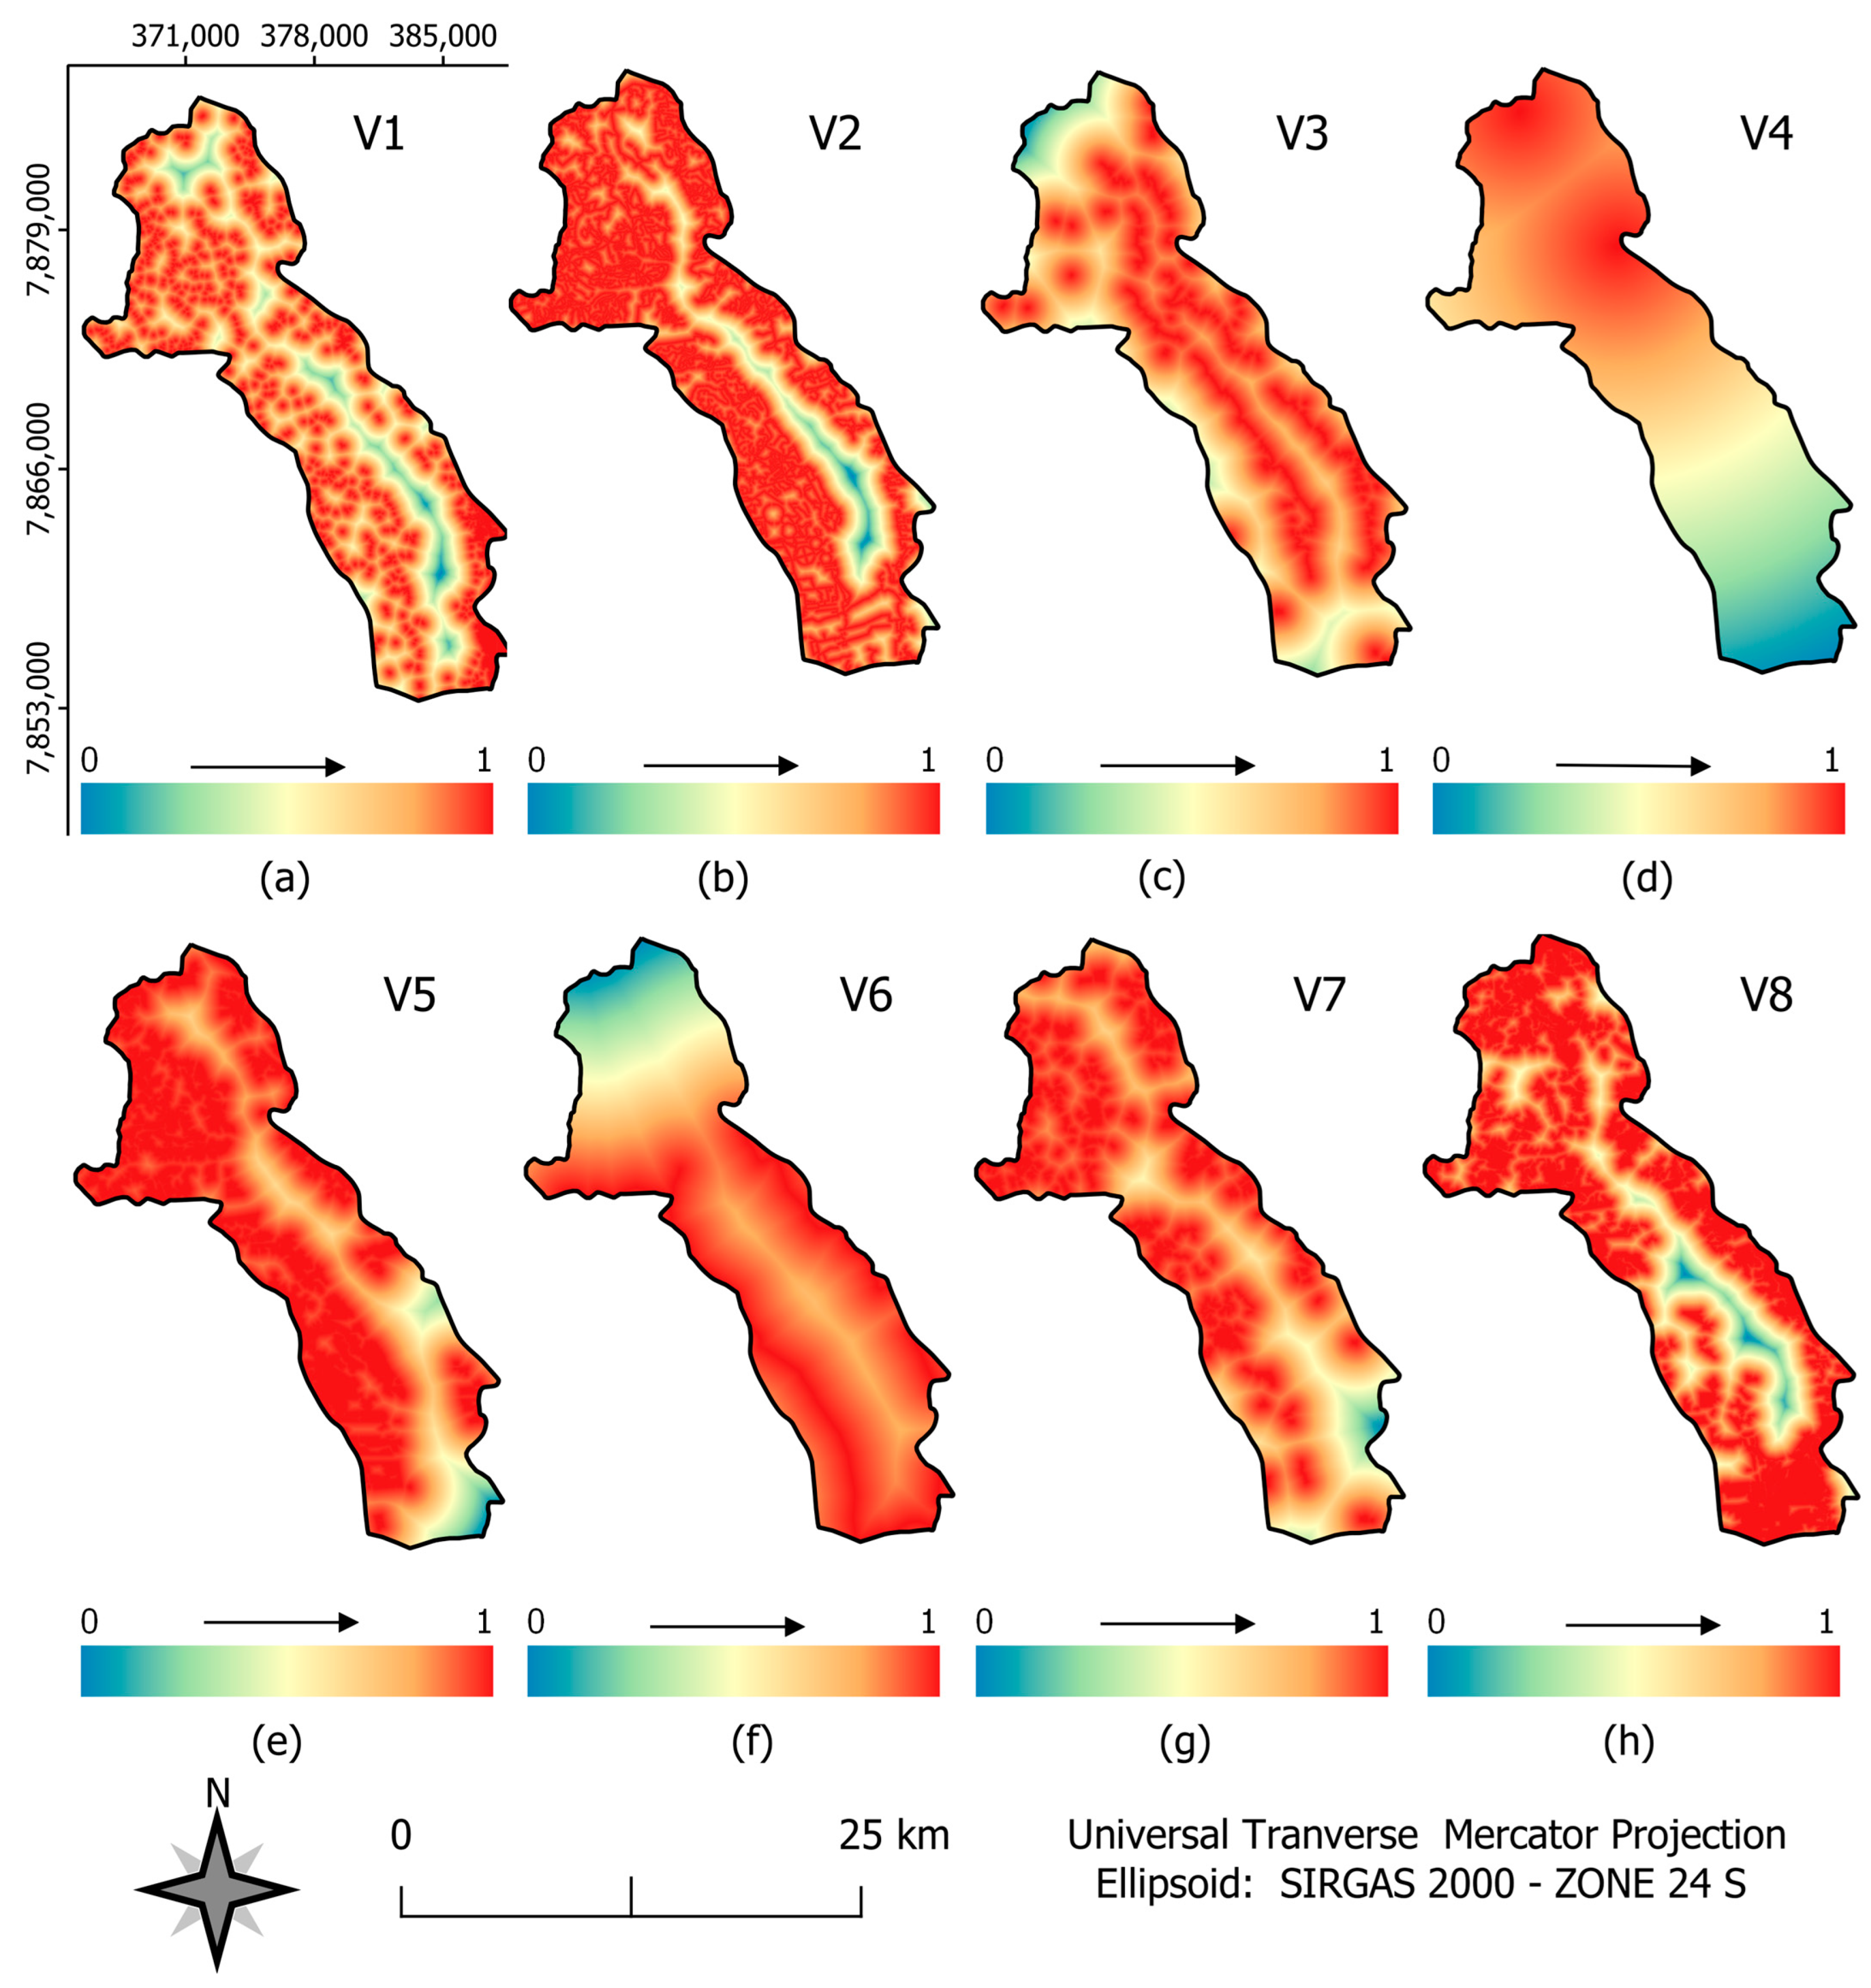
After classifying land use, the following vector input variables, in shapefile format, were pre-processed, edited and subsequently rasterized using the “rasterize” function: V1–Built-up areas; V2–Unpaved roads; V3–Exposed soil; V4–Mineral extraction; V5–Agricultural crops; V6–Paved roads; V7–Forestry; and V8–Pasture.
Generation of linear Euclidean distance matrix images
In this step, for each of the eight input variables rasterized in the previous step, the “proximity raster” function was applied, which uses the Euclidean metric, intending to generate eight continuous matrix images of Euclidean distance, in meters, for the study area (JLDS) [36,37,38].
Application of fuzzy membership functions and images fuzzification
In this step, for each of the eight continuous matrix images of Euclidean distance of the input variables, the fuzzy membership function entitled “matrix fuzzification (decreasing linear association)” was applied, with the objective of generating eight fuzzified continuous matrix images for the study area (JLDS), with values ranging from 0 to 1. The shortest distance, in meters, in relation to the studied variable received the value of 1, and the most significant distance received the value of 0 [38,39].
Application of the Analytical Hierarchical Process (AHP) proposed by Saaty (1977)
To determine the weights, the AHP method proposed by [40] was applied through the organization of the variables in hierarchical levels. This method determines, through the synthesis of the values of the decision makers, a global measure for each alternative, prioritizing or classifying each one at the end of the method [41,42].
The pairwise comparison matrix or decision matrix was used, using Saaty’s fundamental scale (Table 1). The matrix elaboration method makes use of a comparison scale, in which the hierarchy of importance between the pre-defined factors can be linearly defined (V1–Built–up areas; V2–Unpaved roads; V3–Exposed soil; V4–Mineral extraction; V5–Agricultural crops; V6–Paved roads; V7–Forestry; and V8–Pasture).
The value-selection phase, based on the scale of comparators, is considered one of the most important in the entire process of environmental vulnerability spatialization. The degree of importance of each factor was defined based on bibliographical research, researchers’ experience and support from a multidisciplinary team.
Considering the relative importance values of the factors, the online system entitled “AHP Online System—AHP-OS”, available at (https://bpmsg.com/ahp/ (accessed on 19 December 2022)), was used to determine the statistical weights for the eight variables [42].
An analysis of the consistency ratio of the weights chosen for each variable used in the model was performed using a tool available online (https://bpmsg.com/ahp/ahp-calc.php (accessed on 19 December 2022)), in which an adequate consistency ratio (CR) was found for the weights used [36,43,44].
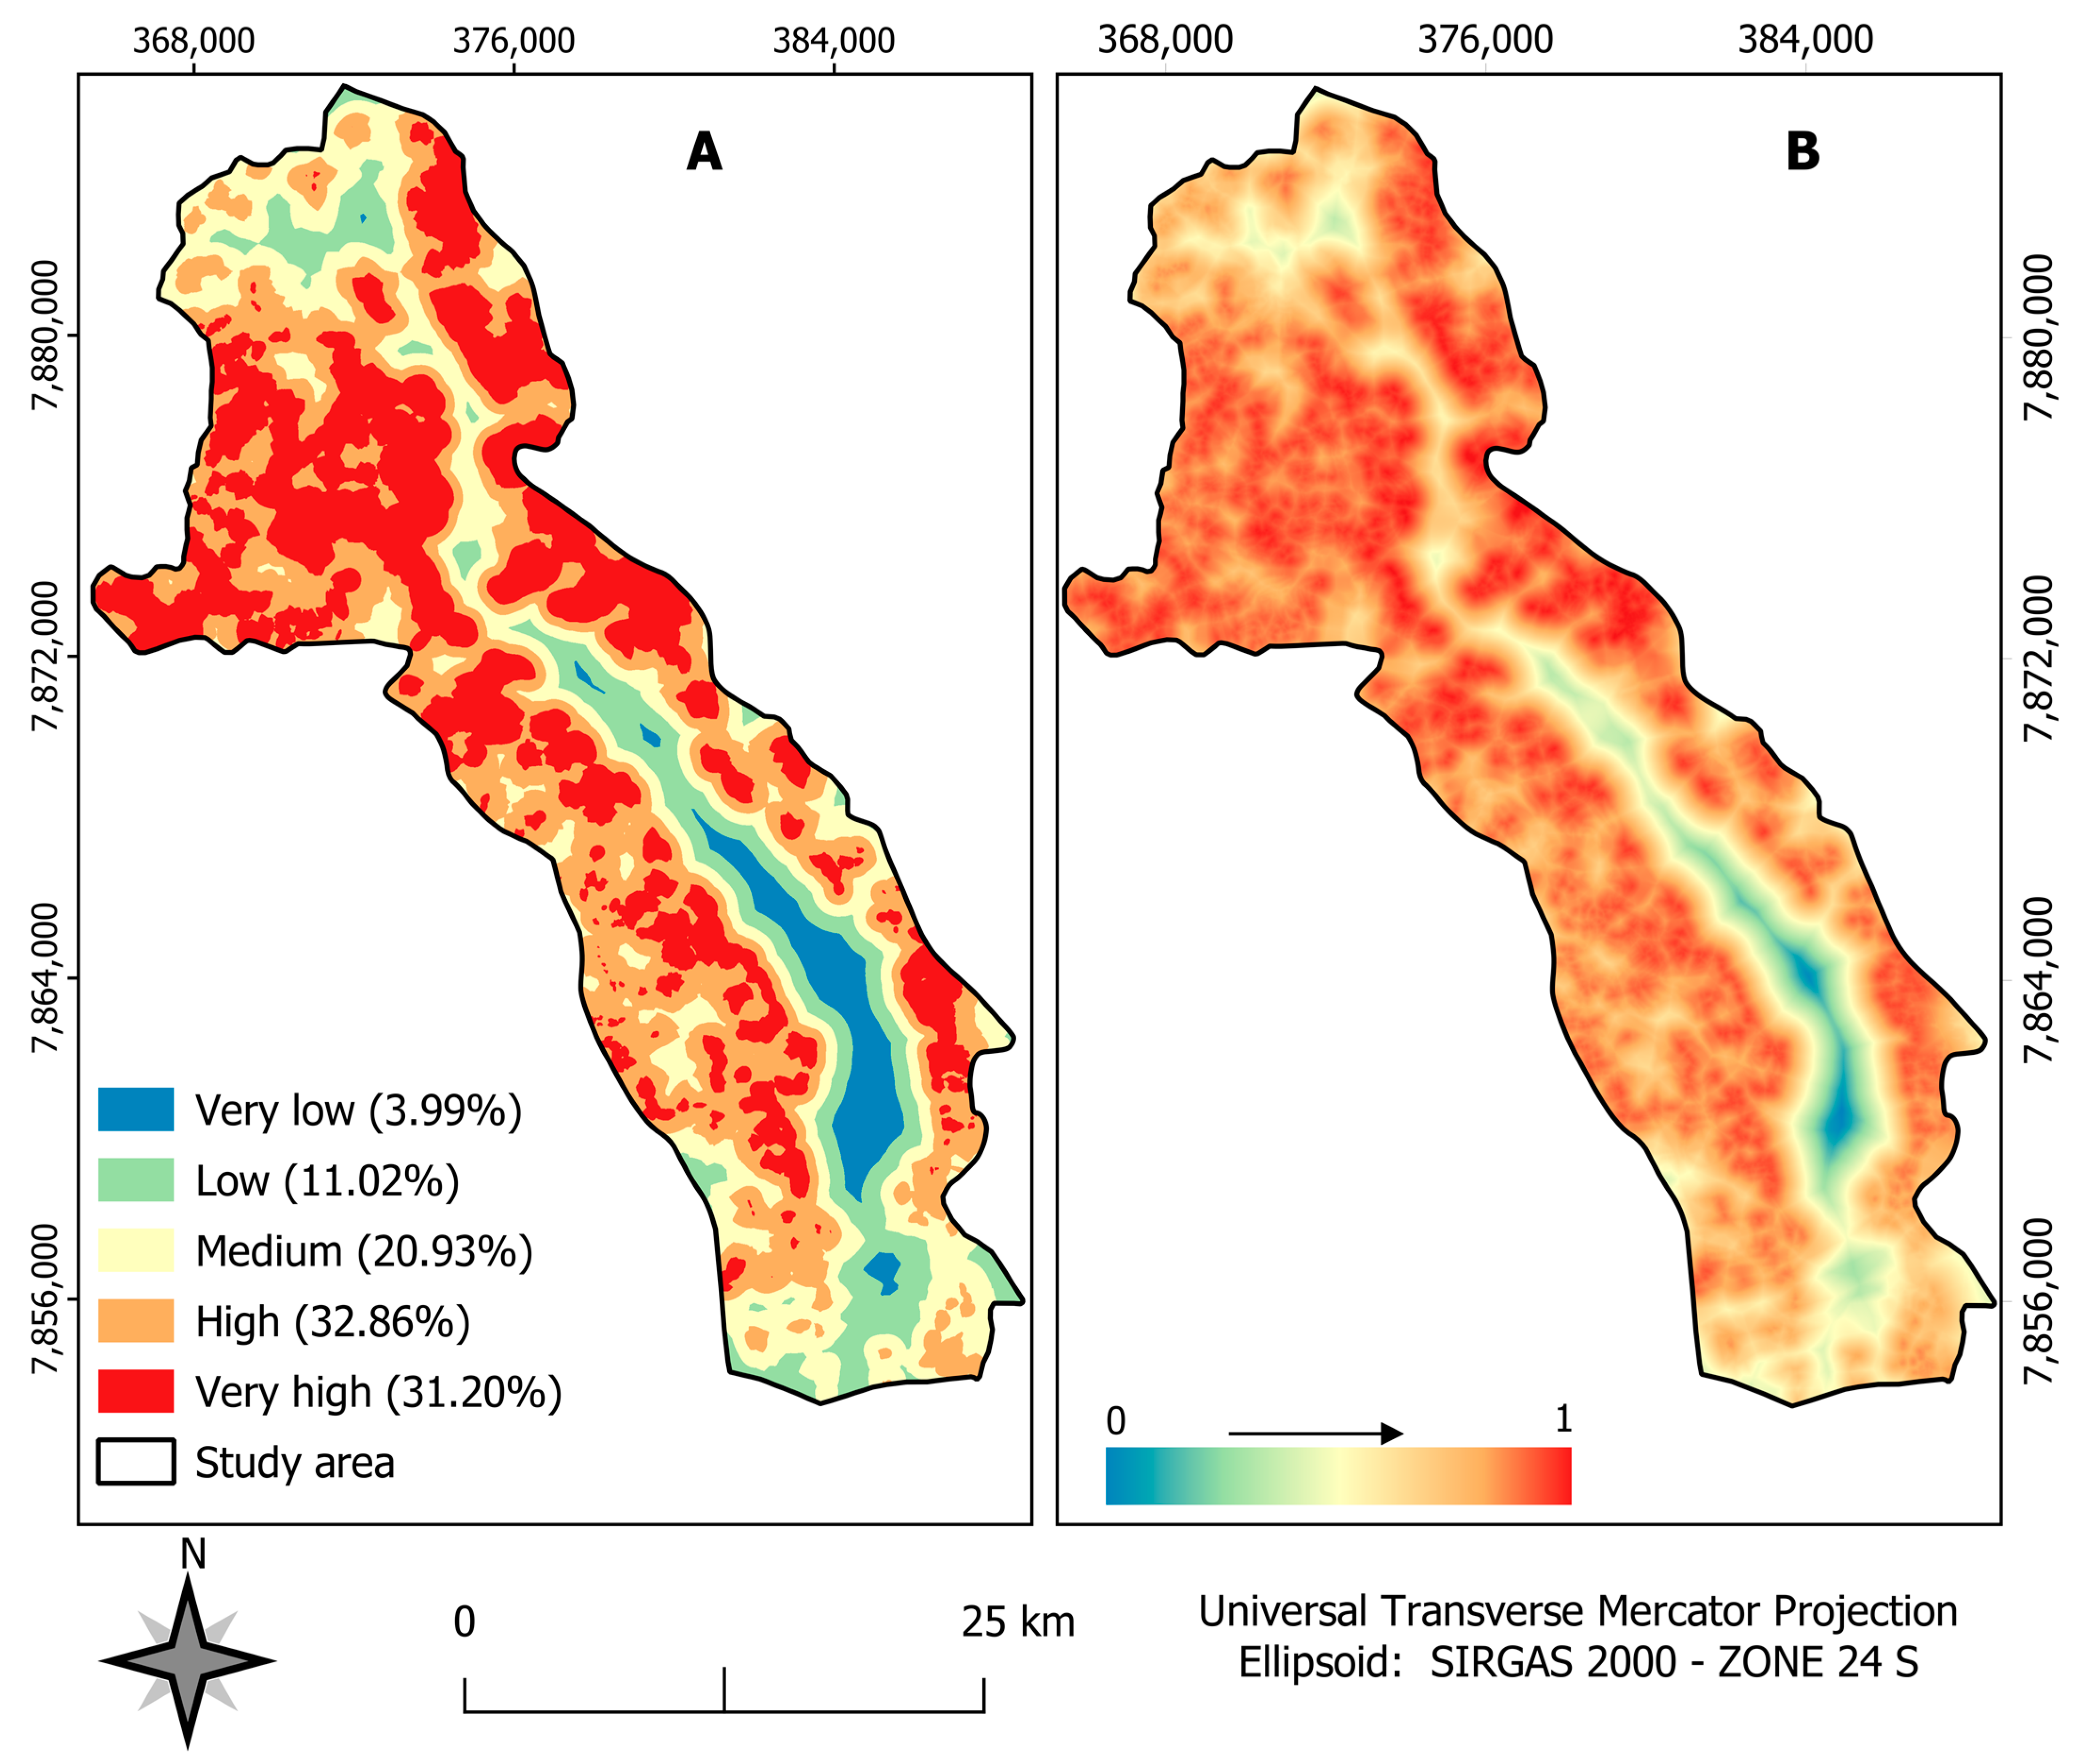
Finally, in possession of the statistical weights of the eight variables, the “map calculator” function was used, in which Equation (1) was inserted:
V S D L J = P 1 × V a r 1 + + P 8 × V a r 8
where V S D L J is the environmental vulnerability of the Juparanã Lagoon Drainage Surface, Espírito Santo state, Brazil; P 1 to P 8 are the statistical weights of the input variables; and V a r 1 to V a r 8 are the continuous raster images of the variables of fuzzified inputs.
Spatial Reclassification of Environmental Vulnerability for the study area (JLDS)
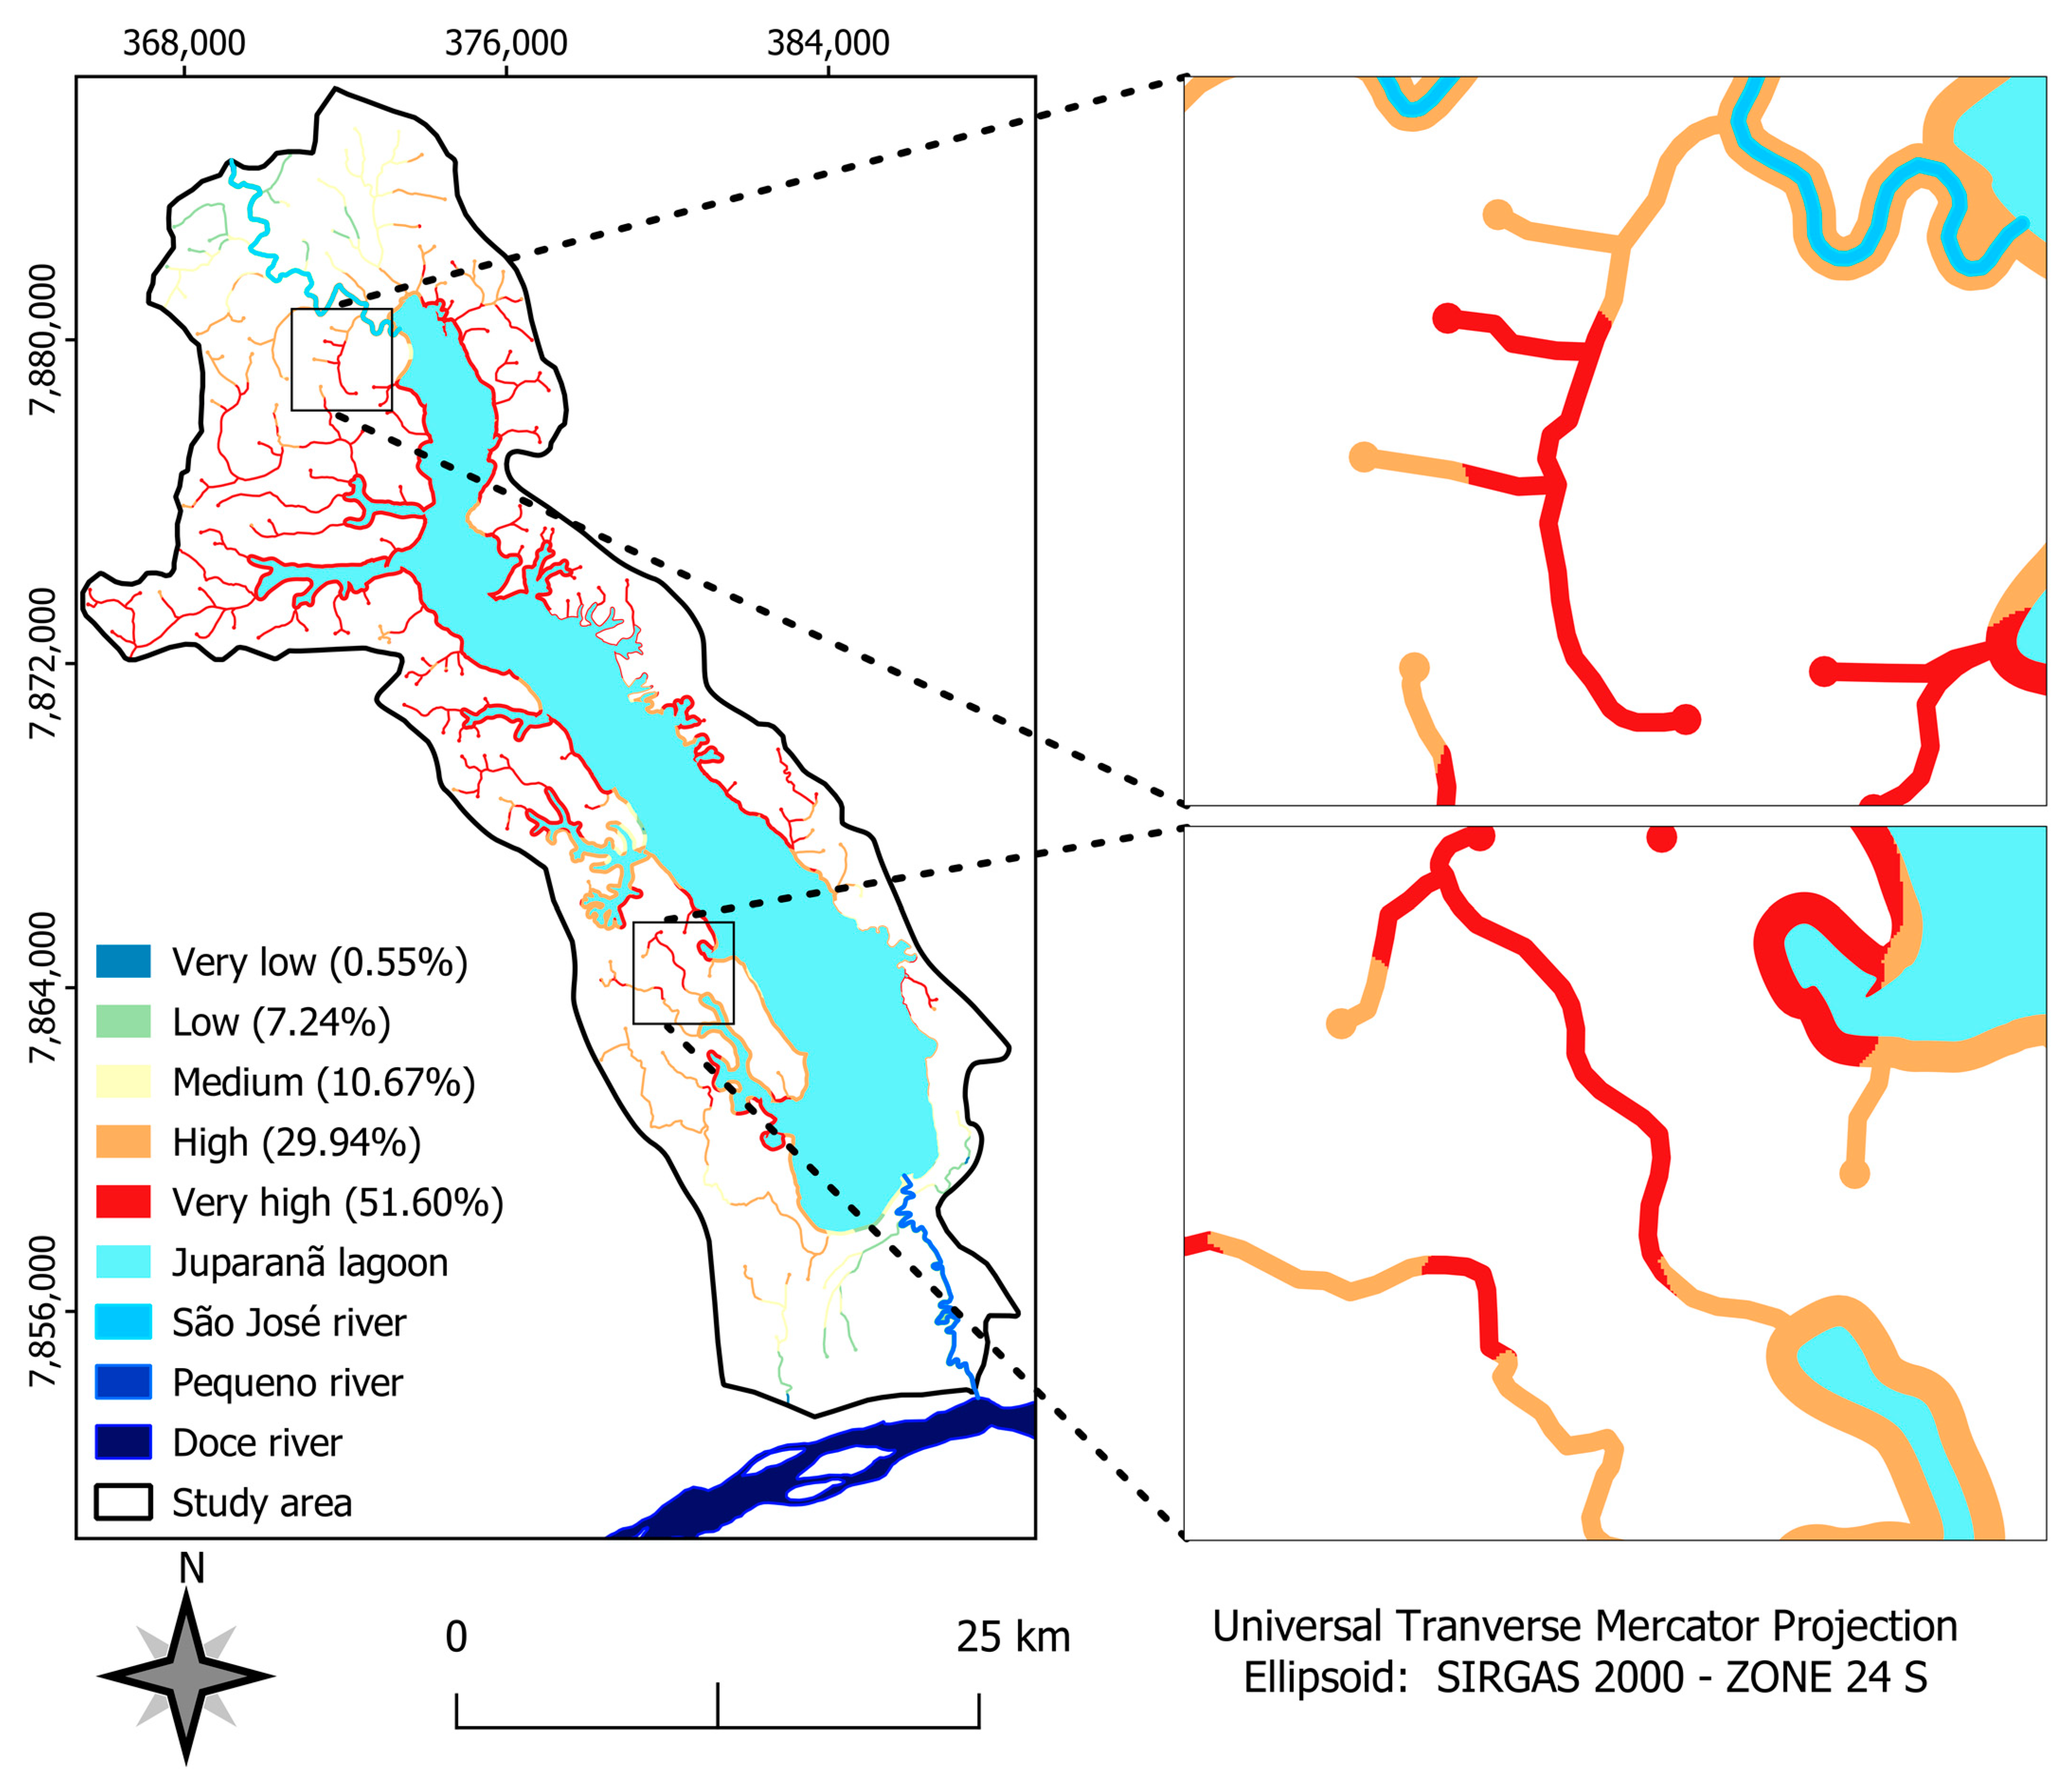
At this stage, the continuous matrix image of the environmental vulnerability of the study area (JLDS) was reclassified in the free computational application SAGA-GIS (version 7.8.2) using the “reclassify” function. Afterwards, Jenks’s natural breaks method was applied in order to generate the discrete matrix image of environmental vulnerability represented by the classes of very low, low, medium, high and very high environmental vulnerability.
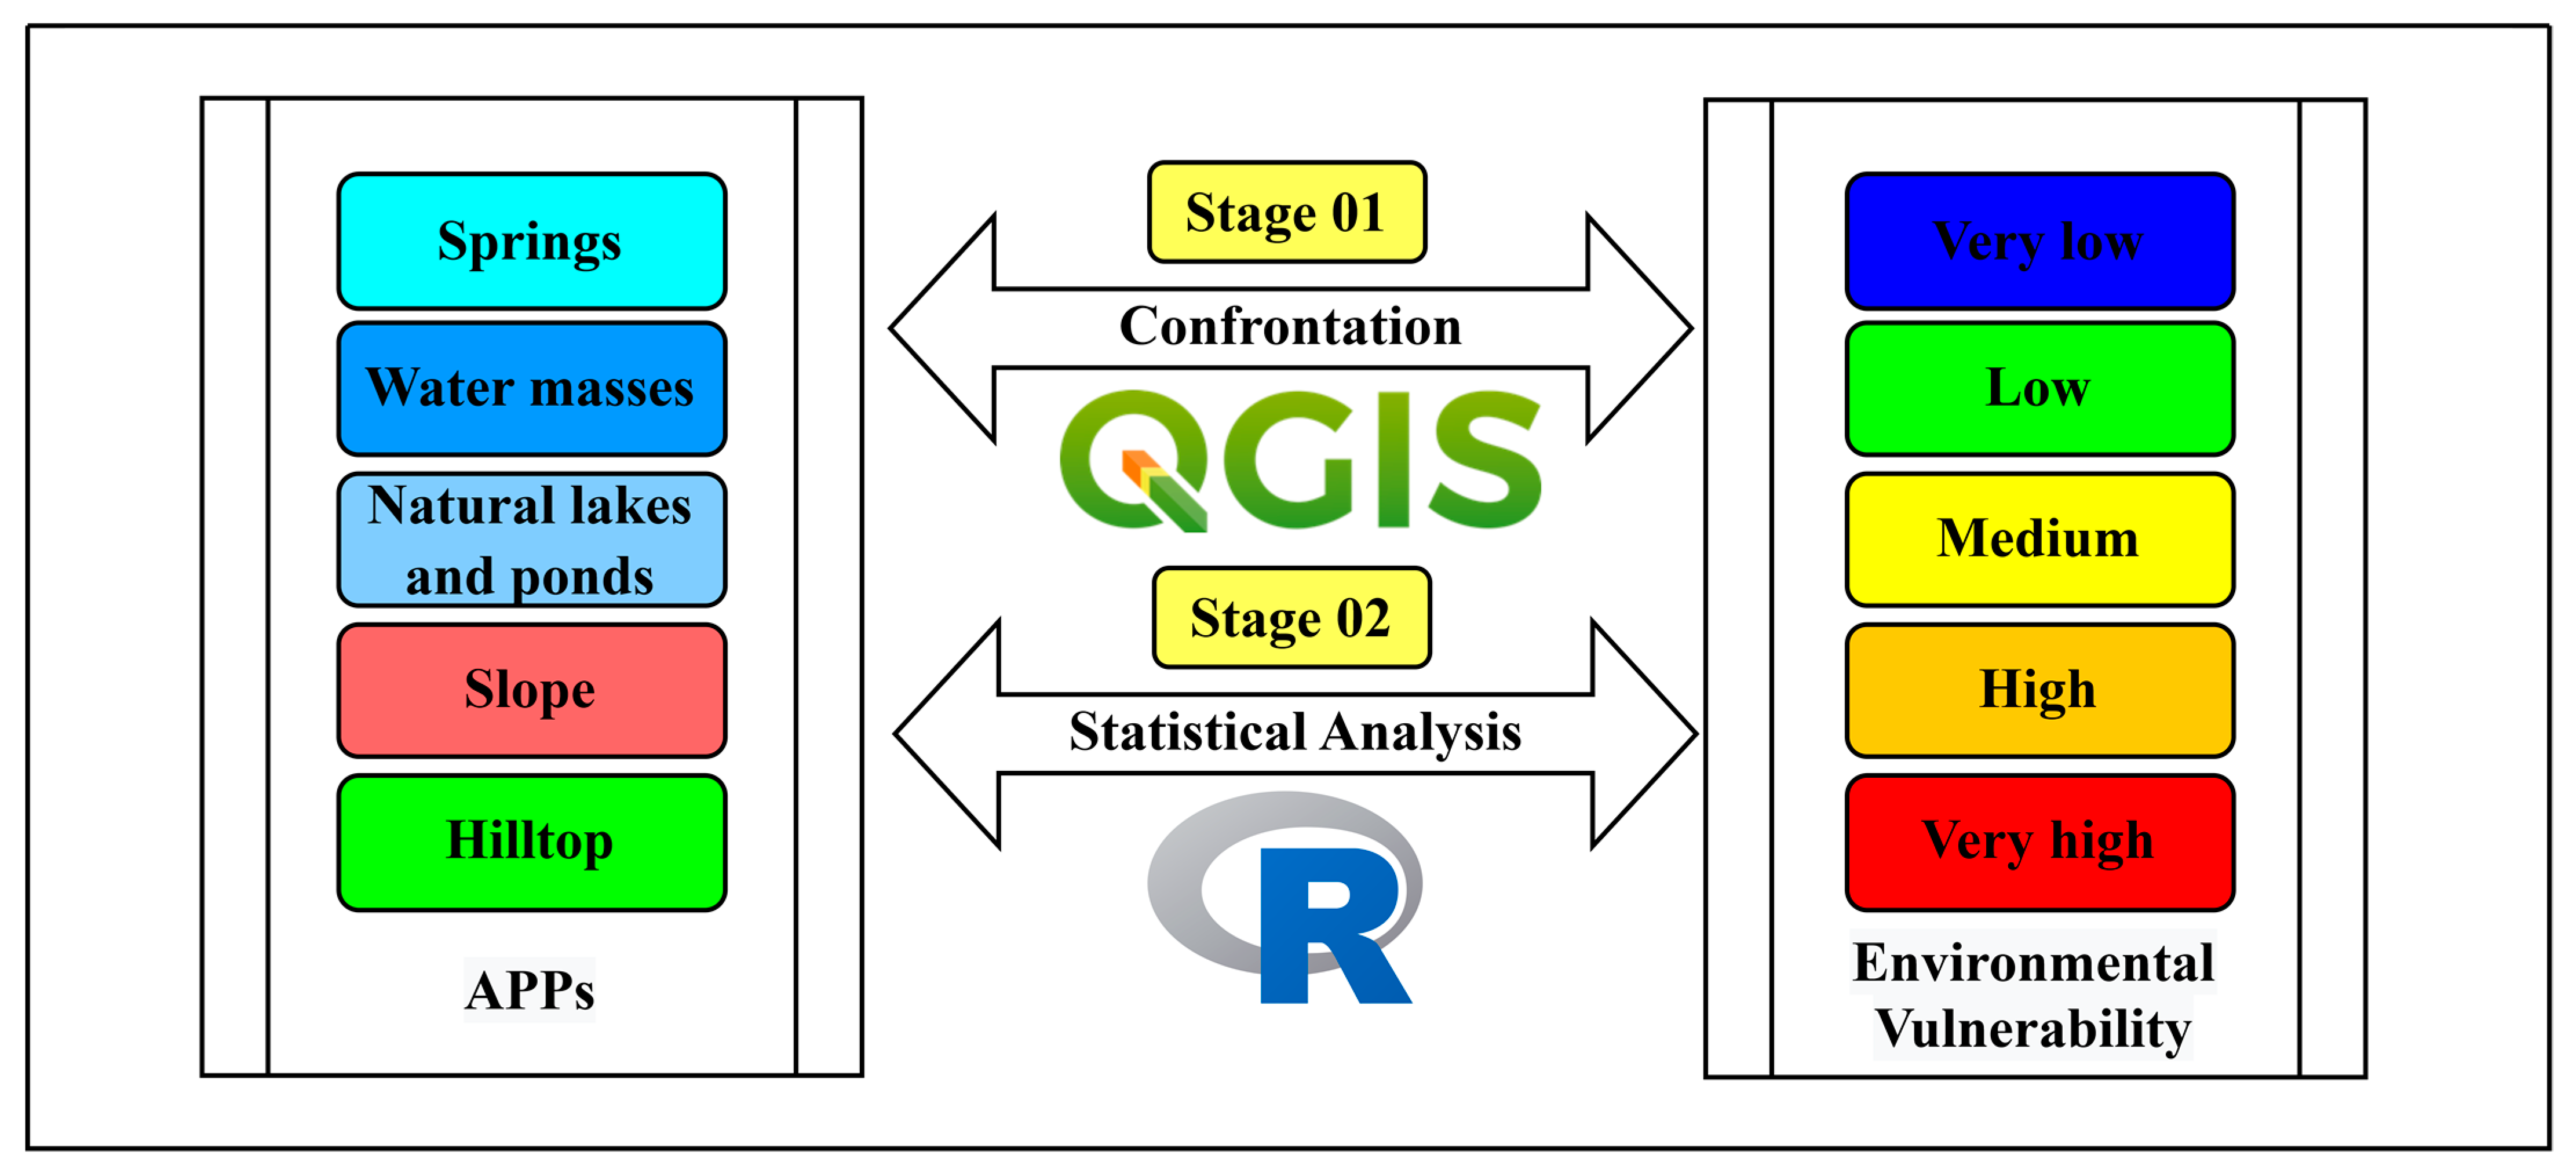
Stage 04—Confrontation and Statistical Analysis between Permanent Preservation Areas (APP) based on the Brazilian Forest Code (Law nº. 12.651/2012) and the Environmental Vulnerability of the study area (JLDS).
The methodological steps adopted for the confrontation and statistical analysis between the Permanent Preservation Areas (APP) based on the Brazilian Forest Code (Law nº 12.651/2012) and the environmental vulnerability for the study area (JLDS), Espírito Santo state, Brazil, are shown in Figure 5.
All methodological steps were applied using the free QGIS applications (version 3.22.10) and the R-statistics complement (free software environment for statistical computing and graphics).
At this stage, a confrontation and a statistical analysis were carried out between the representative classes of the Permanent Preservation Areas (APP) and the environmental vulnerability of the study area (JLDS), Espírito Santo, Brazil. In this context, the R-statistics complement present within the QGIS application (version 3.22.10) was used in order to verify if the anthropogenic actions corroborate the presence of areas with high environmental vulnerability within Permanent Preservation Areas (APP) based on the Brazilian Forest Code (Law nº 12.651/2012) for the study area (JLDS).

3. Results

3.1. Land Use for the Juparanã Lagoon Drainage Surface (JLDS), Espírito Santo state, Brazil

In the study area (JLDS), there is a distribution of several classes of land use, with emphasis on the water mass class that represents 25.68% (69.68 km2) of the total study area (Figure 6 and Table 2). In this context, the Juparanã Lagoon itself represents 24.98% (67.80 km2) of the study area (JLDS).
Among productive activities for agricultural purposes, the classes represented by pastures and coffee stand out, occupying 68.34 km2 (25.19%) and 50.58 km2 (18.64%) of the total area, respectively. However, 28.20 km2 (10.40%) of the total area is formed by native forest and 11.70 km2 (4.31%) by native forest in an initial stage of regeneration (Table 2).
The total identified APP area is 25.37 km2 (Figure 7 and Table 3), equivalent to 9.35% of the total study area. The lagoon APP represents 53.58% of the total APP territory, while the watercourse and spring APPs represent 42.24% and 4.17% of the total APP territory, respectively. When compared with the study area (JLDS), the lagoon APP represents 5.01% while the APPs of watercourses and springs represent 3.95% and 0.39% of the area, respectively.
The total APP area identified in the study area is 25.37 km2; the lagoon APP represents 53.58% of the total APP territory, watercourses represent 42.24% and springs represent 4.17% according to Table 3.
Table 4 shows the current situation of land use exclusively for the environment characterized as APPs, where 23.37%, 14.48%, and 13.19% of the area is occupied by native forest, native forest in the initial stage of regeneration and marsh, respectively, totaling 51.04% of the APPs distributed in the study area. When analyzing the classes involving agricultural exploration, the predominance of pastures stands out, with 24.96% of the total area, followed by eucalyptus with 4.72% and coffee with 3.84%.

3.2. Generation of Linear Euclidean Distance Matrix Images for the Juparanã Lagoon Drainage Surface (JLDS), Espírito Santo State, Brazil

The Euclidean distances are represented in the images through a color palette, where the blue color represents the most significant distances and the red color the smallest distances.
Among the generated images, mineral extraction (Figure 8d) and paved roads (Figure 8f) stand out with the highest linear distance values for the study area (JLDS) being equivalent to 25,339 m and 11,979 m, respectively, according to the Figure 8.
The variables that present smaller Euclidean distances are unpaved roads (Figure 8b), built-up areas (Figure 8a), pastures (Figure 8h), agricultural crops (Figure 8e), exposed soil (Figure 8c) and forestry (Figure 8g) with values of 1780 m, 1890 m, 2050 m, 4690 m, 4782 m and 4819 m, respectively.

3.3. Application of Fuzzy Membership Functions and Fuzzification of Images

The membership function diagrams (decreasing linear fuzzy values) representing the anthropogenic variables are shown in Figure 9. It is observed that the areas considered most vulnerable are those that present absolute values of the fuzzy set close to 1, while the less vulnerable areas show values close to 0.
Figure 10 shows the results of the fuzzy logic spatialization for anthropogenic matrix variables. Amongst the used variables, those that are most harmful to the environment, due to their lower Euclidean distance and fuzzy set values with intervals closer to 1, are unpaved roads (Figure 10b), built-up areas (Figure 10a), pasture (Figure 10h), agricultural crops (Figure 10e) and exposed soil (Figure 10c).
The representative histograms of the pixel frequency percentages for the decreasing linear fuzzy set range of the anthropogenic variables are presented in Figure 11. The results are fundamental when they are intended to evaluate a given variable behavior both in the most harmful range to the environment (0.75–1) and in the sum of the two main ranges (0.50–1).
This histogram is representative of the pixel frequency percentage and demonstrates how much, within a given interval, these pixels occurred for each vulnerability class.
In this context, of all anthropogenic variables, those that present the highest percentage values (values above 90.00%) of the fuzzy set interval between 0.50 and 1 are agricultural cultivation (95.11%), unpaved roads (93.70%), forestry (93.68%), pasture (92.33%), exposed soil (92.19%) and paved roads (90.20%). However, due to their infrequent occurrence in the entire study area (JLDS), the anthropogenic variables, paved road and mineral extraction presented for the same range of the fuzzy set (0.50–1) the lowest percentage values equivalent to 84, 79 and 66.34%, respectively.

3.4. Application of the Analytical Hierarchical Process (AHP) Proposed by Saaty (1977)

To determine the weights of the study variables, the AHP method was used, through Saaty’s fundamental scale (Table 1). The hierarchy of importance (from 1 to 8) was linearly defined between the pre-defined factors (Pasture (P); Forestry (S); Paved roads (EP); Agricultural crops (CA); Mineral extraction (EM); Exposed soil (SE); Unpaved roads (ENP); Built-up areas (AE)), which resulted in the weight of each criterion, as shown in Table 5.
Table 6 presents the statistical weights for the anthropogenic variables that were validated based on the consistency ratio (RC), which presented a value of 0.029 (an acceptable consistency ratio).

3.5. Spatial Reclassification of Environmental Vulnerability for the Juparanã Lagoon Drainage Surface (JLDS), Espírito Santo State, Brazil

The spatialization and reclassification of environmental vulnerability are represented in Figure 12. It is demonstrated that the study area (JLDS), has a great environmental vulnerability, evidenced by the values of the very high (31.20%), high (32.86 %) and medium (20.93%) classes. The areas in red are representative of the occurrence of greater vulnerability and are geographically distributed on all sides, including in the vicinity of Juparanã Lagoon, which is shown to be in a stage of environmental disturbance, which justifies further attention to these classes.
The most vulnerable region is precisely where there is a more significant presence of economic activities, especially agriculture. The classes of agricultural crops, unpaved road, forestry, pasture and exposed soil presented the highest percentage values, greater than 90% for the fuzzy set between 0.50 and 1, followed by the built-up areas class, which presented a percentage value of 89.19%. All anthropogenic classes presented above are directly related to human presence and proximity to buildings, combined with economic actions.
The confrontation of land use with the environmental vulnerability is represented in Table 7. The four variables that presented the most intense vulnerabilities (very high class) were mineral extraction (85.14%), silviculture (63.41%), unpaved roads (59.03%) and exposed soil (52.24%).

3.6. Confrontation and Statistical Analysis between Total APPs without Overlapping with Environmental Vulnerability for the Juparanã Lagoon Drainage Surface (JLDS), Espírito Santo State, Brazil

The confrontation between the APP and the environmental vulnerability is represented in Table 8 and Figure 13. The confrontation demonstrated that the total APP without overlap presents high environmental vulnerability, represented by 47.35% (very high), 34.05% (high), 14.55% (medium), 4.02% (low) and 0.03% (very low). In this context, 81.40% of the APP areas are represented by the combination of very high and high vulnerability classes, with good geographic distribution over the study area (JLDS).
Figure 14 presents the results of using the fuzzy overlay function to spatialize the environmental vulnerability for the Juparanã Lagoon Drainage Surface (JLDS), divided into two images (A and B). Figure 14A shows the vulnerability classes with natural Jenks breaks, highlighting the values of the vulnerability classes, as follows: very high (35.94%), high (30.70%), medium (16.22%), low (12.93%) and very low (4.21%). Moreover, 82.86% of the areas are classified as having very high, high and medium vulnerability. Figure 14A shows the environmental vulnerability in a linear form ranging from 0 to 1.
Figure 15 presents the spatialization of the confrontation between the APPs (Permanent Preservation Areas) and the environmental vulnerability of the JLDS using the fuzzy overlay function, where the environmental vulnerability is divided into the following classes: 51.60% (very high), 29.94% (high), 10.67% (medium), 7.24% (low) and 0.55% (very low). In total, 92.21% of the areas are classified as having very high, high and medium vulnerability.
A comparison was conducted between two methods used to obtain the environmental vulnerability map of the Juparanã Lagoon Drainage Surface (JLDS) in Espírito Santo state, Brazil. The first technique is the one described in this study, where maps were determined by the application of fuzzy logic and the analytic hierarchy process (AHP) method. In contrast, the second technique uses the fuzzy overlay function, which combines two fuzzy sets into a single fuzzy set. This function is used in image processing to perform fusion or to combine of fuzzy information, providing a multi-criteria decision framework for estimating a site’s vulnerability and offering the flexibility to evaluate a variety of spatial scales. The result of each of the two techniques was represented in separate maps.
Regarding the comparison between the two methods of weighting the elements of the environmental vulnerability map, it can be inferred that in both cases, in the JLDS and also in the APPs, very high and high vulnerability predominates.
Although the results were similar, the combination of fuzzy logic with the AHP method provided a broader distribution of vulnerability, more accurately representing the effects of the variables distributed across the JLDS. In contrast, the fuzzy overlay function presented greater vulnerability in the central part and in the northwest region of the JLDS.

4. Discussion

The delimitation of watersheds and the classification of land use were fundamental for the development of this research. The area of the ottobasins generated (Figure 2) through the methodology presented an area of 271.31 km2 for the drainage surface of the study area, while the level 7 ottobasins presented a total area of 268.29 km2. In similar works, the delimitation of watersheds is a step that could be disregarded for regions that have a reliable database. The delimitation of the polygon of the Juparanã Lagoon, through photointerpretation identified an area of 67.80 km2, diverging from the 2012–2015 mapping of the Environmental State Institute of Espírito Santo (IEMA), as well as from [7], who stated that the Juparanã Lagoon has approximate areas of 60.48 km2 and 63.00 km2, respectively.
The differences in the obtained areas of the Juparanã Lagoon may be due to the characteristics of the database and procedures adopted for the delimitation and generation of the files. It may also be associated with the dam built at the mouth of the Pequeno River to prevent the entry of water from the Doce River, contaminated by tailings, or from the rupture of a dam containing mining tailings owned by Samarco Mineração, located in Mariana/MG, in 5 November 2015 [45].
The classification of land use was fundamental for the development of this research, as well as for composing the scenario of environmental vulnerability of the area of this study in corroboration with the Brazilian Institute of Geography and Statistics [46] and [32]. Furthermore, [47] stated that land use mapping is essential for planning, as it provides information on land use, preservation and conservation areas; specific use areas; and environmental impact, in addition to describing and mapping the main existing occupations. The result identified explored areas impacted by anthropic actions in conflict with the Brazilian Forest Code (Law nº 12.651/2012), which provides for full protection of Permanent Preservation Areas [10].
Pastures and coffee cultivation are the productive activities of agriculture that stood out in the study area (JLDS), which corroborates the results found by [48], which highlights pasture and agriculture among the main elements in the predominance of land use in the Juparanã Lagoon hydrographic basin and in the surrounding areas.
It is observed that there is a great vulnerability, being geographically distributed throughout the study area (JLDS) with different intensities, including in the APP. The class representing very high vulnerability was more intense in the northwest part of the study area (JLDS). It is possible to observe that this result is linked to land use in these regions, where the highest concentration of unpaved roads, agricultural crops and pasture stands out. Furthermore, [9] points out that agricultural activities, when exploited in a predatory manner, can disrupt the dynamic balance of the physical environment.
The results of this research match the information presented by [6] and [7], who report that in recent decades, the Juparanã Lagoon has been subjected to a series of anthropic impacts, such as increased silting and disorderly occupation of its surroundings, both for real estate (urbanization) and agricultural purposes.
The confrontation between environmental vulnerability and the APP, contrary to what is foreseen in the Brazilian Forestry Code, pointed to a high level of vulnerability in the areas of permanent preservation, evidenced by the vulnerability in the very high and high classes that presented values of 47.35% and 34.05%, respectively. This occurs due to the environmental nonconformity present in the APPs (Permanent Preservation Areas), which are not adequately protected and are exploited by various activities, as identified in the land use map and shown in Table 4.
A significant environmental vulnerability may suggest the existence of a series of negative impacts in a region or community, as a high probability of the occurrence of natural disasters, such as floods, landslides and storms, which can cause damage to infrastructure and risk to life. Exposure to pollutants or lack of basic sanitation can lead to health problems such as respiratory illnesses, dermatitis and gastrointestinal infections. Environmental vulnerability can lead to scarcity of natural resources such as water and food, which can increase poverty and hunger, and promote the forced displacement of people who are forced to leave their homes and communities because of natural disasters or environmental degradation. Environmental vulnerability can lead to the destruction of natural ecosystems, which can result in the loss of biodiversity and species extinction. Environmental vulnerability can have negative economic impacts, such as job losses, damage to infrastructure and a drop in agricultural production [49].
The delimitation of urban centers based on the creation of an urban perimeter by the municipality of Linhares resulted in a reduction of 0.75 km2 (5.13%) in the APP of Juparanã Lagoon due to the reduction in this section of the APP to a strip of just 30 m, where previously it was 100 m, and also a reduction of 0.35 km2 (36.04%) in the APP on the Pequeno river, where its strip was reduced from 50 m to 15 m in width. This reduction in the APP range in the urban perimeter represents a loss of 4.12% of the APP in the study area (JLDS).
The main environmental problems found in the study area (JLDS) refer to unpaved roads and built-up areas that are geographically distributed over the area, presenting the lowest Euclidean distance values among all other variables, contributing to the occurrence of environmental problems such as soil loss, the silting up of water courses, running over wild animals, forest fires, forest fragmentation and domestic effluent.
The recent implementation of models using Artificial Intelligence (AI) has yielded excellent results. In the work developed by [50], neuro-fuzzy hybrid models were used to analyze the performance and efficiency of sediment removal in irrigation channels, and the modeling results obtained demonstrated an optimistic finding. An improved method for predicting the thermal performance parameters of a cylindrical cavity receiver using a modified neuro-fuzzy inference system algorithm, a powerful optimization tool for predicting energy performance, has been proposed by [51]. The authors [52] also used fuzzy logic to verify the performance of a wind turbine, obtaining results that confirmed that the proposed control increases the power performance and structural stability of wind turbines compared to conventional controls.
The methodology of this work can be applied to assess environmental vulnerability at different scales (local, regional and global) and in relation to different factors (social, economic, political and environmental). It is also similar to that presented by other authors. The delimitation of watersheds in this paper coincides with the work developed by [22], developed with the objective of carrying out the classification of environmental fragility in watersheds. The application of fuzzy logic and the analytic hierarchy process (AHP) method is one of the most important steps and follows the same criteria used by [23] for mapping flood risks.
Projects and actions can be established based on this study and directed towards areas with greater environmental vulnerability, through the implementation of mitigating measures by managers and owners, expanding the environmental stability of the Juparanã Lagoon.

5. Conclusions

The combination of fuzzy logic and the AHP method with the aid of geotechnologies proved to be efficient, as it allowed for spatializing the distribution of environmental vulnerability in the Juparanã Lagoon Drainage Surface (JLDS), which is important for the implementation of projects, action plans, decision making and proper management of anthropic activities aimed at reducing environmental impacts in areas of interest.
The use of these techniques made it possible to identify a highly positive relationship between anthropic activities in the study area and its surroundings and environmental vulnerability. The analysis found a marked environmental vulnerability to JLDS that is concerning, indicating that the region requires proper planning of actions, as 84.99% of the vulnerability is occurring in the following classes: very high (31.20%), high (32.86%) and medium (20.93%). The relationship becomes even more severe when considering only the Permanent Preservation Areas (APP), with almost 95% of the APP areas classified as having very high, high and medium vulnerability. The high environmental vulnerability may be mainly associated with the extensive distribution of built-up areas, unpaved roads, agricultural crops and pastures, as well as the low level of forest cover in the study area and the existing exploitation in the Permanent Preservation Areas (APP).
The difficulties encountered are related to the need for more studies about environmental vulnerability, especially regarding lagoons. The photointerpretation of the Juparanã Lagoon’s surroundings presented here is unprecedented. A vital measure for improvement would be applying a temporal analysis to assess the dynamics of environmental vulnerability over time, considering socioeconomic, climatic and environmental changes for a more comprehensive understanding of the distribution of environmental vulnerability in the study area.
The methodology can be adapted to consider different scales of analysis, at local, regional, national or global levels, to assess environmental vulnerability at various levels of scope and complexity, as well as the inclusion of local communities and governments.

Author Contributions

Conceptualization, C.P., L.M.S., E.C.d.S. and A.R.d.S.; methodology, C.P., J.L.F., V.D.N.M. and A.R.d.S.; validation, C.P., H.M.D., J.L.F. and A.R.d.S.; formal analysis, C.P., P.A.G.F., T.R.M. and J.L.F.; investigation, C.P., H.M.D., J.L.F. and A.R.d.S.; resources, C.P. and A.R.d.S.; data curation, C.P., S.H.K., H.M.D., P.A.G.F., J.L.F. and A.R.d.S.; writing—original draft preparation, C.P., L.M.S., E.C.d.S., V.D.N.M. and A.R.d.S.; writing—review and editing, C.P., P.A.G.F., T.R.M. and R.d.C.F.C.; supervision, A.R.d.S.; project administration, A.R.d.S.; funding acquisition, C.P. and A.R.d.S. All authors have read and agreed to the published version of the manuscript.

Funding

This research received no external funding.

Data Availability Statement

Not applicable.

Acknowledgments

The authors thank the following research and development agencies for their assistance, funding and support in the research development: (a) Integrated System of Geospatial Bases of the State of Espírito Santo (GEOBASES); (b) the Brazilian Institute of Geography and Statistics (IBGE); (c) the Institute of Agricultural Development and Forest Defense of the State of Espírito Santo (IDAF); (d) the Capixaba Institute for Research, Technical Assistance and Rural Extension (INCAPER); (e) Coordination of Superior Level Staff Improvement (CAPES); and (f) the Research and Innovation Support Foundation of Espírito Santo (FAPES) for the laboratory infrastructure, process number 2022-240F8 (21/2022). Finally, the authors would like to thank the Graduate Program in Forest Sciences at the Federal University of Espírito Santo and the research group Geotechnology Applied to the Global Environment (GAGEN), registered with CNPq.

Conflicts of Interest

The authors declare no conflict of interest.

References

  1. Gomes, M.A.F.; Pereira, L.C.; Tosto, S.G.; Romeiro, A.R. Importância das Áreas Protegidas (Por Lei) No Planejamento e Gestão Ambiental Sustentáveis; UFPB: João Pessoa, Brasil, 2011; pp. 1–14. [Google Scholar]
  2. Takyi, R.; El Mahrad, B.; Nunoo, F.K.E.; Adade, R.; Elhadary, M.; Essandoh, J. Adaptive Management of Environmental Challenges in West African Coastal Lagoons. Sci. Total Environ. 2022, 838, 156234. [Google Scholar] [CrossRef] [PubMed]
  3. Assis, D.R.S.d.; Magalhães de Mendonça Pimentel, R.; Moura de Castilho, C.J. Impactos da Urbanização e Vulnerabilidade de Lagoas Costeiras. Rev. Bras. Geogr. Física 2013, 6, 223–232. [Google Scholar] [CrossRef]
  4. Barroso, G.F. Lagoas Costeiras do Espírito Santo: Perspectivas para Conservação. In Ecossistemas Costeiros do Espírito Santo: Conservação e Restauração; EDUFES: Vitória, Brazil, 2007; pp. 71–86. [Google Scholar]
  5. Suguio, K.; Martin, L.; Dominguez, J.M.L. Evolução da Planície Costeira do Rio Doce (ES) Durante o Quaternário: Influência das Flutuações do Nível do Mar. In Proceedings of the Evolução da Planície Costeira do Rio Doce (Es) Durante o Quaternário: Influência das Flutuações do Nível do Mar, Atas do iv Simpósio do Quaternário no Brasil, Rio de Janeiro, Brazil, 27–31 July 1981; pp. 93–116. [Google Scholar]
  6. Gonçalves, M.A. Algas Fitoplanctônicas na Lagoa Juparanã (Linhares-Es): Variação Espacial, Temporal e Bioindicadores do Estado Trófico. Master’ Thesis, Universidade Federal do Espírito Santo, Centro de Ciências Humanas e Naturais, Vitória, Brazil, 2005; p. 120. [Google Scholar]
  7. Cavati, B.; de Oliveira Fernandes, V. Periphytic Algae in Two Environments of the Lower Doce River (Juparanã Lagoon and Pequeno River—Linhares, Espírito Santo State, Brazil): Spatial and Temporal Variation. Acta Sci.-Biol. Sci. 2008, 30, 439–448. [Google Scholar] [CrossRef]
  8. El Ouaty, O.; El M’rini, A.; Nachite, D.; Marrocchino, E.; Marin, E.; Rodella, I. Assessment of the Heavy Metal Sources and Concentrations in the Nador Lagoon Sediment, Northeast-Morocco. Ocean Coast. Manag. 2022, 216, 105900. [Google Scholar] [CrossRef]
  9. Ribeiro, C.A.A.S.; Soares, V.P.; Oliveira, A.M.S.; Gleriani, J.M. O Desafio da Delimitação de Áreas de Preservação Permanente. Rev. Árvore 2005, 29, 203–212. [Google Scholar] [CrossRef]
  10. Brasil, Lei n. 12.651, de 25 de Maio de 2012; Diário Oficial da União: Brasília, Brazil, 2012; p. 38.
  11. Ribeiro, A.D.S.; Mincato, R.L.; Curi, N.; Kawakubo, F.S. Vulnerabilidade Ambiental à Erosão Hídrica em uma Sub-Bacia Hidrográfica Pelo Processo Analítico Hierárquico. Rev. Bras. Geogr. Física 2016, 9, 016–031. [Google Scholar] [CrossRef]
  12. Instituto Brasileiro de Geografia e Estatística—Coordenação de Meio Ambiente. In Monitoramento da Cobertura e uso da Terra do Brasil 2018/2020; IBGE: Rio de Janeiro, Brazil, 2022; ISBN 9788524045448.
  13. Santos, G.M.A.D.A. Espacialização do Risco de Lixiviação de Agrotóxicos em Áreas de Cafeicultura no Estado do Espírito Santo. 2017. Master’ Thesis, Universidade Federal de Viçosa, Campus Viçosa, Viçosa, Brazil, 2017; p. 162. [Google Scholar]
  14. Rosa, R. Geotecnologias na Geografia Aplicada; Geotechnologies on Applied Geographie. Rev. Dep. Geogr. 2005, 16, 81–90. [Google Scholar] [CrossRef]
  15. Peluzio, T.M.d.O. Informaçoes Aerofotogramétricas e Orbitais na Determinação de uso e Ocupação da Terra e de Áreas de Preservação Permanente. Master’s Thesis, Universidade Federal do Espírito Santo, Vitória, Brazil, 2010; p. 82. [Google Scholar]
  16. Bianchini, C.D.; de Oliveira, G.G. Geoprocessamento Aplicado à Identificação de Áreas Aptas Para a Implantação de Unidades de Conservação no Vale do Taquari, Rs. Rev. Bras. Cartogr. 2019, 71, 513–541. [Google Scholar] [CrossRef]
  17. Malczewski, J. Multiple Criteria Decision Analysis Software. Int. Ser. Oper. Res. Manag. Sci. 2010, 233, 369–370. [Google Scholar] [CrossRef]
  18. de Aquino, A.R.; Paletta, F.C.; de Almeida, J.R. Vulnerabilidade Ambiental; Editora Blucher: São Paulo, Brazil, 2017; ISBN 9788580392425. [Google Scholar]
  19. Turner, B.L.; Kasperson, R.E.; Matsone, P.A.; Mccarthy, J.J.; Corell, R.W.; Christensene, L.; Eckley, N.; Kasperson, J.X.; Luers, A.; Martello, M.L.; et al. A Framework for Vulnerability Analysis in Sustainability Science. Proc. Natl. Acad. Sci. USA 2003, 100, 8074–8079. [Google Scholar] [CrossRef]
  20. Peluzio, T.M.D.O. Lógica Fuzzy na Determinação de Fragmentos Florestais Para a Coleta de Sementes. Ph.D. Thesis, Universidade Federal do Espirito Santo, Jerônimo Monteiro, Vitória, Brazil, 2017. [Google Scholar]
  21. Saaty, R.W. The Analytic Hierarchy Process—What It Is and How It Is Used. Math. Model. 1987, 9, 161–176. [Google Scholar] [CrossRef]
  22. Lira, K.C.S.; Francisco, H.R.; Feiden, A. Classificação de Fragilidade Ambiental em Bacia Hidrográfica Usando Lógica Fuzzy e Método AHP. Soc. Nat. 2022, 34, 1–17. [Google Scholar] [CrossRef]
  23. Parsian, S.; Amani, M.; Moghimi, A.; Ghorbanian, A.; Mahdavi, S. Flood Hazard Mapping Using Fuzzy Logic, Analytical Hierarchy Process, and Multi-Source Geospatial Datasets. Remote Sens. 2021, 22, 4761. [Google Scholar] [CrossRef]
  24. Madhu, A.; Kumar, A.; Jia, P. Exploring Fuzzy Local Spatial Information Algorithms for Remote Sensing Image Classificatio. Remote Sens. 2021, 13, 4163. [Google Scholar] [CrossRef]
  25. Spörl, C. Metodologia Para Elaboração de Modelos de Fragilidade Ambiental Utilizando Redes Neurais. Ph.D. Thesis, Departamento de Geografia da Universidade de São Paulo, São Paulo, Brazil, 2007. [Google Scholar] [CrossRef]
  26. Li, Z.; Luan, W.; Wang, X.; Wan, S.; Su, M.; Zhang, Z. Spatial Expansion Regular Pattern and Driving Factors of Estuarine and Coastal Harbors. Ocean Coast. Manag. 2022, 216, 105980. [Google Scholar] [CrossRef]
  27. Lopes, A.C. Geotecnologias Aplicadas na Avaliação da Vulnerabilidade Ambiental Antrópica. Ph.D. Thesis, Departamento de Ciências Florestais e da Madeira da Universidade Federal do Espírito Santo, Jerônimo Monteiro, Brazil, 2019. [Google Scholar]
  28. Seki, M.S.; Tetto, A.F.; Tres, A.; de Silos Vieira, R. Classificação Climática do Estado do Espírito Santo Segundo as Zonas de Vida de Holdridge. Rev. Agronegocio Meio Ambient. 2021, 14 (Suppl. S2), 1–19. [Google Scholar] [CrossRef]
  29. INCAPER. Instituto Capixaba de Pesquisa, Assistência Técnica e Extensão Rural; Programa de Assistência Técnica e Extensão Rural—PROATER 2020–2023; Editora Incaper: Vitória, Spain, 2019; pp. 1–81. ISBN 2013206534. [Google Scholar]
  30. EMBRAPA. Empresa Brasileira de Pesquisa Agropecuária. Levantamento de Reconhecimento dos Solos do Estado do Espírito Santo; Centre for Renewable Energy Sources: Athens, Greece, 1971; Volume 21, ISBN 9789896540821. [Google Scholar]
  31. Santos, A.R. Aula 14—Aquisição do MDE SRTM 30 m no Site Earth Explorer; Publicado Pelo Canal do Youtube Mundo da Geomática: Alegre, Brasil, 2020. [Google Scholar]
  32. dos Santos, A.R.; Chimalli, T.; Peluzio, J.B.E.; da Silva, A.G.; dos Santos, G.M.A.D.A.; Lorenzon, A.S.; Teixeira, T.R.; de Castro, N.L.M.; Soares Ribeiro, C.A.A. Influence of Relief on Permanent Preservation Areas. Sci. Total Environ. 2016, 541, 1296–1302. [Google Scholar] [CrossRef]
  33. Eugenio, F.C.; dos Santos, A.R.; Fiedler, N.C.; Ribeiro, G.A.; da Silva, A.G.; Soares, V.P.; Gleriani, J.M. Mapeamento das Áreas de Preservação Permanente do Estado do Espírito Santo, Brasil. Ciênc. Florest. 2017, 27, 897. [Google Scholar] [CrossRef]
  34. Peluzio, T.M.d.O.; dos Santos, A.R.; Fiedler, N.C.; Bauer, M.D.O.; Garcia, G.D.O.; Simão, J.B.P.; Peluzio, J.B.E. Comparação Fotointerpretativa Entre Aerofoto e Imagem de Satélite. Ciênc. Florest. 2013, 23, 537–544. [Google Scholar] [CrossRef]
  35. Peluzio, T.M.D.O.; Santos, A.R.; Fiedler, N.C.; Coelho, A.L.N.; Eugenio, F.C.; Louzada, F.L.R.D.O.; Saito, N.S.; Ferrari, J.L.; Júnior, P.Q.; Batista, R.S. Mapeamento de Áreas de Preservação Permanente no Arcgis 9.3; Caufes: Alegre, Brazail, 2010; ISBN 9788561890124. [Google Scholar]
  36. Santos, J.S.; Leite, C.C.C.; Viana, J.C.C.; dos Santos, A.R.; Fernandes, M.M.; de Souza Abreu, V.; do Nascimento, T.P.; dos Santos, L.S.; de Moura Fernandes, M.R.; da Silva, G.F.; et al. Delimitation of Ecological Corridors in the Brazilian Atlantic Forest. Ecol. Indic. 2018, 88, 414–424. [Google Scholar] [CrossRef]
  37. Santos, A.R. Aula 09—Geração da Imagem Matricial de Distância Euclidiana de Fragmentos Florestais; Publicado Pelo Canal do Youtube Mundo da Geomática: Alegre, Brasil, 2020. [Google Scholar]
  38. Teixeira, T.R.; Soares Ribeiro, C.A.A.; Rosa dos Santos, A.; Marcatti, G.E.; Lorenzon, A.S.; de Castro, N.L.M.; Domingues, G.F.; Leite, H.G.; da Costa de Menezes, S.J.M.; Santos Mota, P.H.; et al. Forest Biomass Power Plant Installation Scenarios. Biomass Bioenergy 2018, 108, 35–47. [Google Scholar] [CrossRef]
  39. dos Santos, A.R.; Paterlini, E.M.; Fiedler, N.C.; Ribeiro, C.A.A.S.; Lorenzon, A.S.; Domingues, G.F.; Marcatti, G.E.; de Castro, N.L.M.; Teixeira, T.R.; dos Santos, G.M.A.D.A.; et al. Fuzzy Logic Applied to Prospecting for Areas for Installation of Wood Panel Industries. J. Environ. Manag. 2017, 193, 345–359. [Google Scholar] [CrossRef] [PubMed]
  40. Saaty, T.L. A Scaling Method for Priorities in Hierarchical Structures. J. Math. Psychol. 1977, 15, 234–281. [Google Scholar] [CrossRef]
  41. Eugenio, F.C.; dos Santos, A.R.; Fiedler, N.C.; Ribeiro, G.A.; da Silva, A.G.; dos Santos, A.B.; Paneto, G.G.; Schettino, V.R. Applying GIS to Develop a Model for Forest Fire Risk: A Case Study in Espírito Santo, Brazil. J. Environ. Manag. 2016, 173, 65–67. [Google Scholar] [CrossRef] [PubMed]
  42. Santos, A.R. Aula 24—Sistema Online Para a Aquisição dos Pesos do Método AHP Proposto por Saaty (1977); Publicado Pelo Canal do Youtube Mundo da Geomática: Alegre, Brasil, 2022. [Google Scholar]
  43. dos Santos, A.R.; Araújo, E.F.; Barros, Q.S.; Fernandes, M.M.; de Moura Fernandes, M.R.; Moreira, T.R.; de Souza, K.B.; da Silva, E.F.; Silva, J.P.M.; Santos, J.S.; et al. Fuzzy Concept Applied in Determining Potential Forest Fragments for Deployment of A Network of Ecological Corridors in the Brazilian Atlantic Forest. Ecol. Indic. 2020, 115, 106423. [Google Scholar] [CrossRef]
  44. Louzada, F.L.R.O.; Santos, A.R.; Silva, A.G. Delimitação de Corredores Ecológicos no Arcgis 9.3; CAUFES: Alegre, Brazil, 2010. [Google Scholar]
  45. Sampaio, R.C.; Fontes, G.S.; Ferracioli, P. Molduras de Uma Tragédia Anunciada: Enquadramentos do Desastre de Mariana. Intercom Rev. Bras. Ciênc. Comun. 2017, 40, 55–72. [Google Scholar] [CrossRef]
  46. IBGE, Instituto Brasileiro de Geografia e Estatística. Manual Técnico de Uso da Terra IBGE; IBGE: Rio de Janeiro, Brazil, 2006; ISBN 8524038667. [Google Scholar]
  47. dos Santos, G.M.A.D.A.; Dos Santos, A.R.; Teixeira, L.J.Q.; Saraiva, S.H.; Freitas, D.F.; Pereira, O.d.S.; Ribeiro, C.A.A.S.; Lorenzon, A.S.; Eugenio, F.C.; Neves, A.A.; et al. GIS Applied to Agriclimatological Zoning and Agrotoxin Residue Monitoring in Tomatoes: A Case Study in Espírito Santo State, Brazil. J. Environ. Manag. 2016, 166, 429–439. [Google Scholar] [CrossRef]
  48. Martins, F.C.O. Limnological Characterization and Application of Dpsir Model Aimed at Integrated Assessment of Lacustrine Hydrographic Basins. Ambiência 2016, 12, 573–597. [Google Scholar] [CrossRef]
  49. Cartier, R.; Barcellos, C.; Hübner, C.; Porto, M.F. Vulnerabilidade social e risco ambiental: Uma abordagem metodológica para avaliação de injustiça ambiental. Cad. De Saúde Pública 2009, 25, 2695–2704. [Google Scholar] [CrossRef]
  50. Sharafati, A.; Masoud, H.; Tiwari, N.K.; Bhagat, S.K.; Al-Ansari, N.; Chau, K.W.; Yaseen, Z.M. Performance Evaluation of Sediment Ejector Efficiency Using Hybrid Neuro-Fuzzy Models. Eng. Appl. Comput. Fluid Mech. 2021, 15, 627–643. [Google Scholar] [CrossRef]
  51. Zayed, M.E.; Zhao, J.; Li, W.; Elsheikh, A.H.; Elaziz, M.A. A Hybrid Adaptive Neuro-Fuzzy Inference System Integrated with Equilibrium Optimizer Algorithm for Predicting the Energetic Performance of Solar Dish Collector. Energy 2021, 235, 121289. [Google Scholar] [CrossRef]
  52. Jeon, T.; Paek, I. Design and Verification of the Lqr Controller Based on Fuzzy Logic for Large Wind Turbine. Energies 2021, 14, 230. [Google Scholar] [CrossRef]
Figure 1. Geographical location of the Juparanã Lagoon Drainage Surface (JLDS), Espírito Santo state, Brazil.
Water 15 02102 g001
Figure 2. Methodological steps adopted for the delimitation of watersheds for the Juparanã Lagoon Drainage Surface (JLDS), Espírito Santo state, Brazil.
Water 15 02102 g002
Figure 3. Methodological steps applied for the spatialization of Permanent Preservation Areas (APP) based on the Brazilian Forestry Code (Law nº 12.651/2012) for the Juparanã Lagoon Drainage Surface (JLDS), Espírito Santo state, Brazil.
Water 15 02102 g003
Figure 4. Methodological steps adopted for the spatialization of environmental vulnerability for the Juparanã Lagoon Drainage Surface (JLDS), Espírito Santo state, Brazil.
Water 15 02102 g004
Figure 5. Methodological steps for the confrontation and statistical analysis between the Permanent Preservation Areas (APP) based on the Brazilian Forest Code (Law nº 12.651/2012) and the environmental vulnerability of the Juparanã Lagoon Drainage Surface (JLDS), Espírito Santo state, Brazil.
Water 15 02102 g005
Figure 6. Land use for the Juparanã Lagoon Drainage Surface (JLDS), Espírito Santo state, Brazil.
Water 15 02102 g006
Figure 7. Permanent Preservation Areas (APP) for the Juparanã Lagoon Drainage Surface (JLDS), Espírito Santo state, Brazil.
Water 15 02102 g007
Figure 8. Euclidean distance of anthropogenic variables for the Juparanã Lagoon Drainage Surface (JLDS), Espírito Santo state, Brazil: (a) V1—Built–up areas; (b) V2—Unpaved roads; (c) V3—Exposed soil; (d) V4—Mineral extraction; (e) V5—Agricultural crops; (f) V6—Paved road; (g) V7—Silviculture; (h) V8—Pasture.
Water 15 02102 g008
Figure 9. Diagrams of membership functions (decreasing linear fuzzy values) representing the anthropogenic variables identified for the Juparanã Lagoon Drainage Surface (JLDS), Espírito Santo state, Brazil: (a) V1–Built-up areas; (b) V2–Unpaved roads; (c) V3–Exposed soil; (d) V4–Mineral extraction; (e) V5–Agricultural crops; (f) V6–Paved road; (g) V7–Silviculture; (h) V8–Pasture.
Water 15 02102 g009
Figure 10. Fuzzy logic spatialization for anthropogenic matrix variables for the Juparanã Lagoon Drainage Surface (JLDS), Espírito Santo state, Brazil: (a) V1–Built-up areas; (b) V2–Unpaved roads; (c) V3–Exposed soil; (d) V4–Mineral extraction; (e) V5–Agricultural crops; (f) V6–Paved road; (g) V7–Silviculture; (h) V8–Pasture.
Water 15 02102 g010
Figure 11. Pixel frequency percentage for the decreasing linear fuzzy set interval of anthropogenic variables for the Juparanã Lagoon Drainage Surface (JLDS), Espírito Santo state, Brazil: (a) V1–Built-up areas; (b) V2–Unpaved roads; (c) V3–Exposed soil; (d) V4–Mineral extraction; (e) V5–Agricultural crops; (f) V6–Paved road; (g) V7–Silviculture; (h) V8–Pasture.
Water 15 02102 g011
Figure 12. Spatialization of environmental vulnerability using fuzzy logic and AHP method for the Juparanã Lagoon Drainage Surface (JLDS), Espírito Santo state, Brazil: (A) vulnerability classes with natural Jenks breaks; (B) vulnerability ranging from 0 to 1.
Water 15 02102 g012
Figure 13. Spatialization of the confrontation between total APPs without overlapping with environmental vulnerability for the Juparanã Lagoon Drainage Surface (JLDS), Espírito Santo state, Brazil.
Water 15 02102 g013
Figure 14. Spatialization of environmental vulnerability using the fuzzy overlay method for the Juparanã Lagoon Drainage Surface (JLDS), Espírito Santo state, Brazil: (A) vulnerability classes with natural Jenks breaks; (B) vulnerability ranging from 0 to 1.
Water 15 02102 g014
Figure 15. Spatialization of the confrontation between total APPs without overlapping with environmental vulnerability for the Juparanã Lagoon Drainage Surface (JLDS), Espírito Santo state, Brazil.
Water 15 02102 g015
Table 1. Scale of comparators of the AHP method. Adapted from Saaty (1977).
ValuesMutual Importance
1/9Extremely less important than
1/7Much less important than
1/5Strongly less important than
1/3Moderately less important than
1Equally important to
3Moderately more important than
5Strongly more important than
7Much more important than
9Extremely more important than
Table 2. Area and area percentage of land use classes for the Juparanã Lagoon Drainage Surface (JLDS), Espírito Santo state, Brazil.
Land Use ClassesArea (km2)Percentage (%)
Water Bodies69.6825.68
Pasture68.3425.19
Coffee50.5818.64
Native forest28.2010.40
Eucalyptus12.194.49
Early-stage forest11.704.31
Scrub6.662.46
Built-up area5.832.15
Swamp4.991.84
Coconut3.511.29
Other perennial crops3.131.15
Others2.680.99
Exposed soil1.390.51
Rubber tree1.100.41
Banana0.720.27
Other temporary crops0.320.12
Papaya0.150.05
Mineral extraction0.090.03
Rocky outcrop0.050.02
Total271.31100.00
Table 3. Areas of APP classes relative to the total study area for the Juparanã Lagoon Drainage Surface (JLDS), Espírito Santo state, Brazil.
APPArea (km2)Total APP Area (%)Study Area (%)
Lagoon13.6053.595.01
Watercourses10.7242.243.95
Springs1.054.170.39
Total25.37100.009.35
Table 4. Land use in the APP for the Juparanã Lagoon Drainage Surface (JLDS), Espírito Santo state, Brazil.
Land Use ClassesArea (km2)Percentage (%)
Pasture6.3324.96
Native forest5.9323.37
Early-stage forest3.6714.48
Swamp3.3513.19
Scrub1.536.04
Eucalyptus1.204.72
Coffee0.973.84
Exposed soil0.953.73
Others0.592.32
Coconut0.321.25
Built-up area0.271.08
Rubber tree0.160.63
Other perennial crops0.070.26
Other temporary crops0.020.09
Banana0.0040.02
Rocky outcrop0.0030.01
Mineral extraction0.0010.003
Total25.37100
Table 5. Paired comparison matrix with mutual importance values for the Juparanã Lagoon Drainage Surface (JLDS), Espírito Santo state, Brazil: Pasture (P); Silviculture (S); Paved roads (EP); Agricultural Crops (CA); Mineral Extraction (EM); Exposed soil (SE); Unpaved roads (ENP); Built-up areas (AE).
PSEPCAEMSEENPAE
P1
S21
EP321
CA4321
EM54321
SE654321
ENP7654321
AE87654321
Table 6. Statistical weights calculated by the AHP method for each variable for the Juparanã Lagoon Drainage Surface (JLDS), Espírito Santo state, Brazil.
Anthropic VariableWeight
Built-up areas0.331322
Unpaved roads0.230663
Exposed soil0.157238
Mineral extraction0.105905
Agricultural crops0.070935
Paved roads0.047680
Forestry0.032696
Pasture0.023561
Table 7. Confrontation of land use classes with the environmental vulnerability for the Juparanã Lagoon Drainage Surface (JLDS), Espírito Santo state, Brazil: Pasture (P); Silviculture (S); Paved roads (EP); Agricultural Crops (CA); Mineral Extraction (EM); Exposed soil (SE); Unpaved roads (ENP); Built-up areas (AE).
VariablesVulnerability
Very LowLowMediumHighVery High
km2(%)km2%km2%km2%km2%
AE1.8732.111.0918.740.6310.781.2621.580.9816.80
ENP0.020.810.145.240.217.580.7527.341.6259.03
SE0.031.940.021.510.096.460.5337.850.7352.24
EM0.000.000.000.480.0114.380.000.000.0885.14
CA0.270.461.422.447.0112.0121.4836.8028.1848.29
EP0.1115.670.034.060.045.220.2635.590.2939.46
S0,020.160.110.820.926.953.8028.668.4063.41
P1.662.4414.1120.6512.0717.6614.1120.6426.3938.62
Table 8. Confrontation between total APPs without overlapping and environmental vulnerability for the Juparanã Lagoon Drainage Surface (JLDS), Espírito Santo state, Brazil.
VulnerabilityArea (km2)Percentage (%)
Very low0.010.03
Low1.024.02
Medium3.6914.55
High8.6434.05
Very high12.0147.35
Total25.37100
Disclaimer/Publisher’s Note: The statements, opinions and data contained in all publications are solely those of the individual author(s) and contributor(s) and not of MDPI and/or the editor(s). MDPI and/or the editor(s) disclaim responsibility for any injury to people or property resulting from any ideas, methods, instructions or products referred to in the content.

