
Small Hydropower Assessment of Uganda Based on Multisource Geospatial Data

Abstract
:1. Introduction
1.1. Background
1.2. The Hydropower Sector and Potential in Uganda
- To review the Ugandan hydropower situation and estimates of hydropower potential in the country;
- To validate the DEM for assessing stream capacities by comparing generated stream longitudinal profiles and present delineated small subbasins (catchments);
- To evaluate the country’s hydropower potential compared with prior estimates;
- To identify potential site locations with their key datasets, taking into account expected capacity, protected areas, the proximity of the grid and settlements, and the energy demand concentration points, and to carry out statistical analysis.
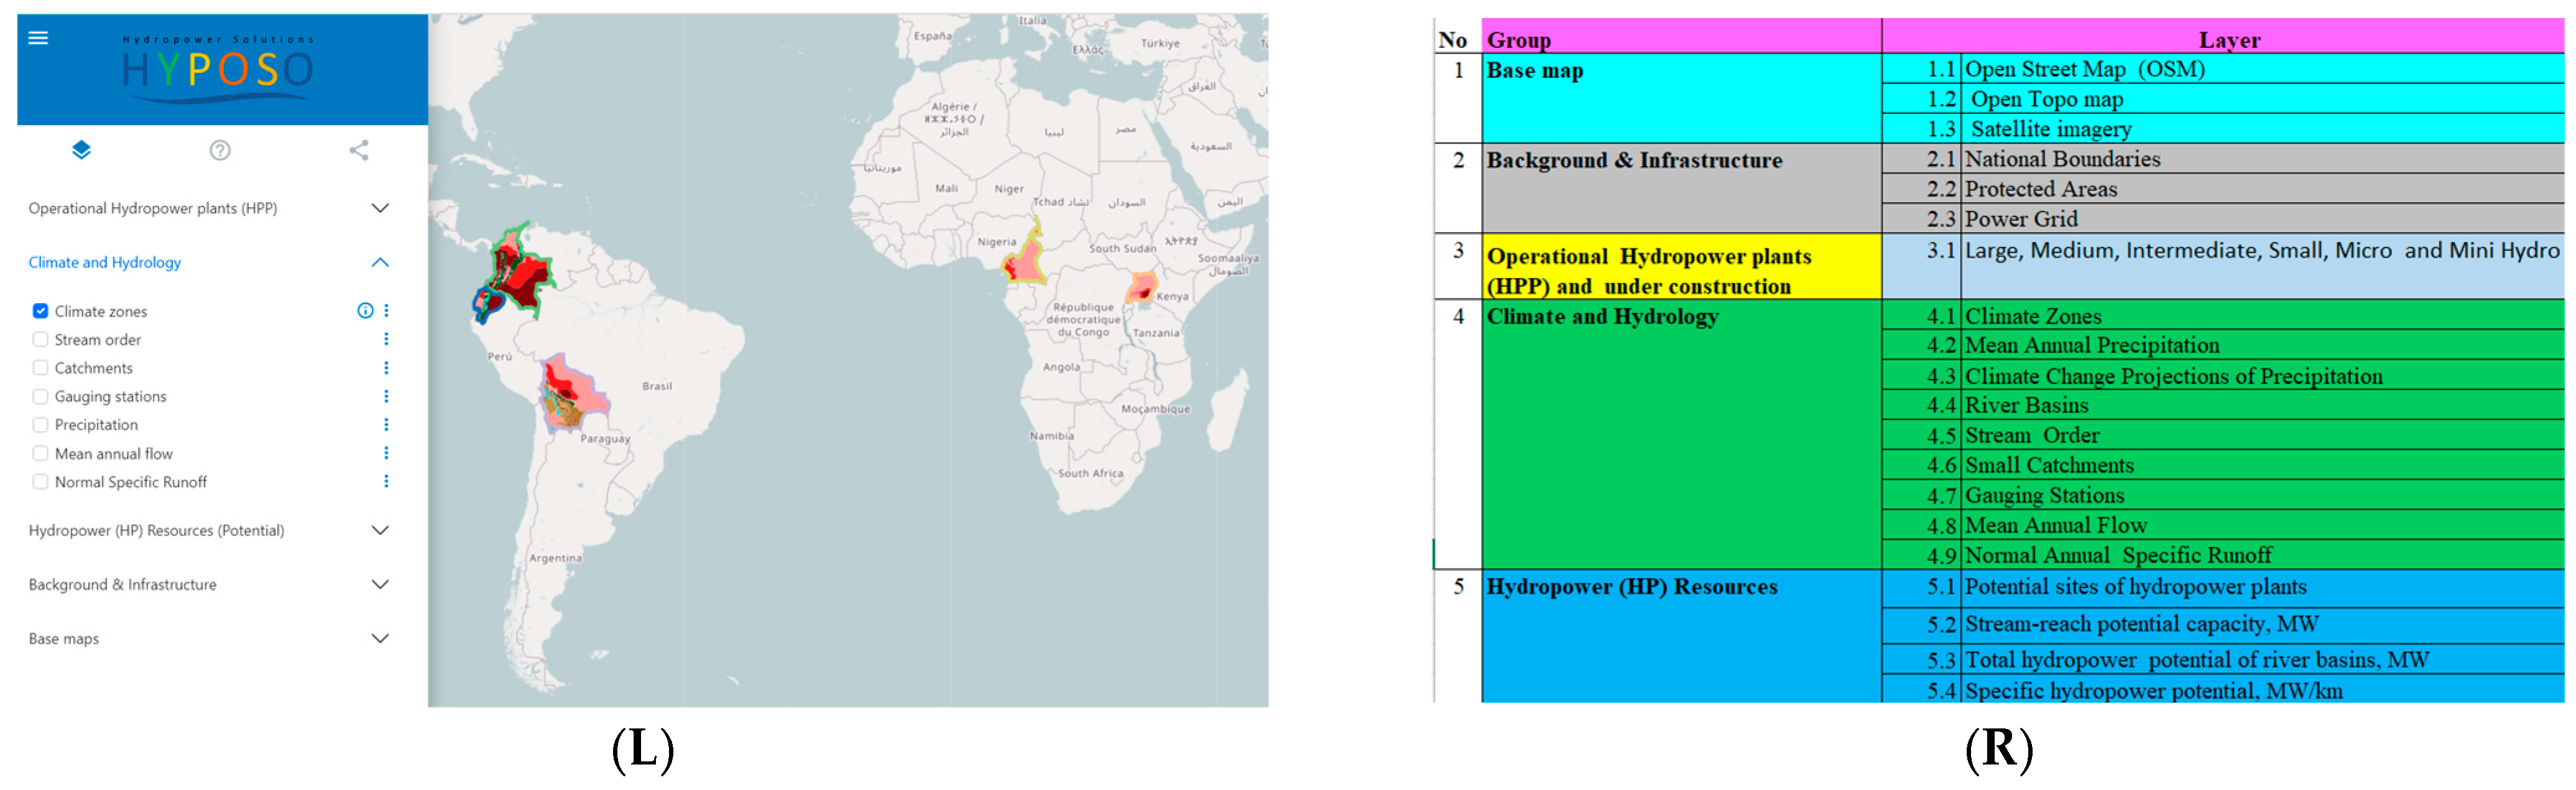
2. Materials and Methods
3. Results and Discussion
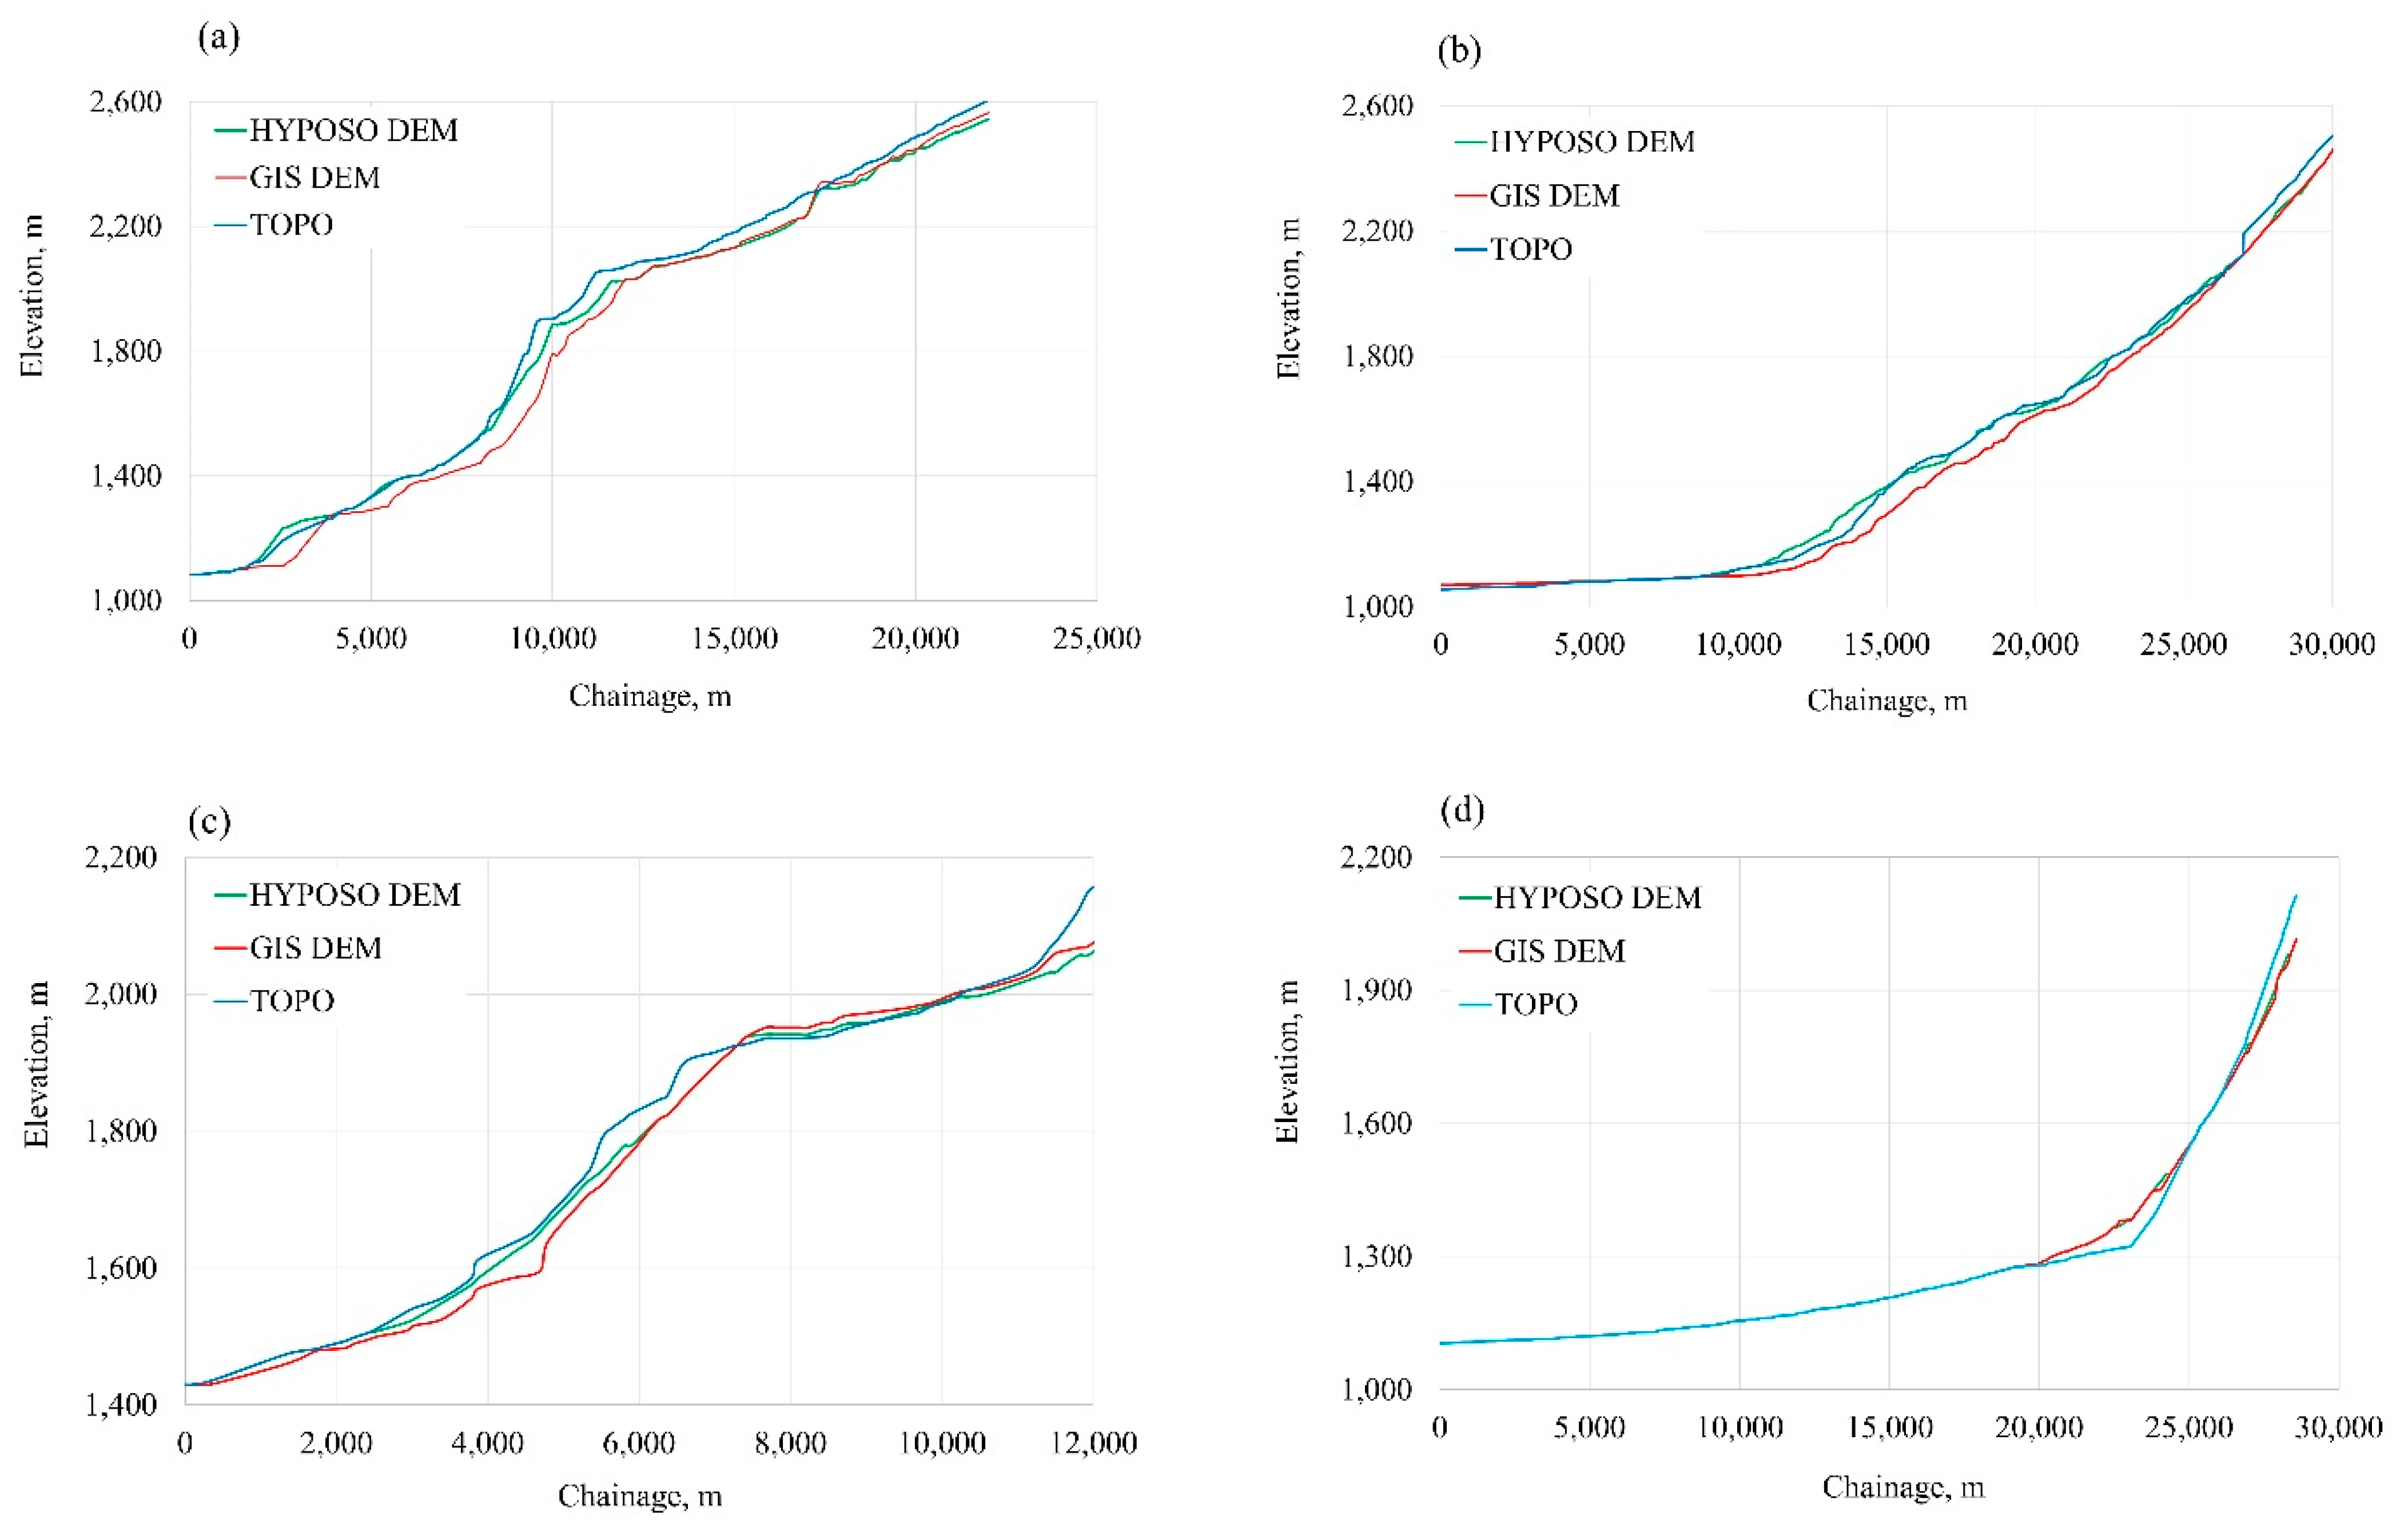
3.1. Validation of Longitudinal Stream Profiles
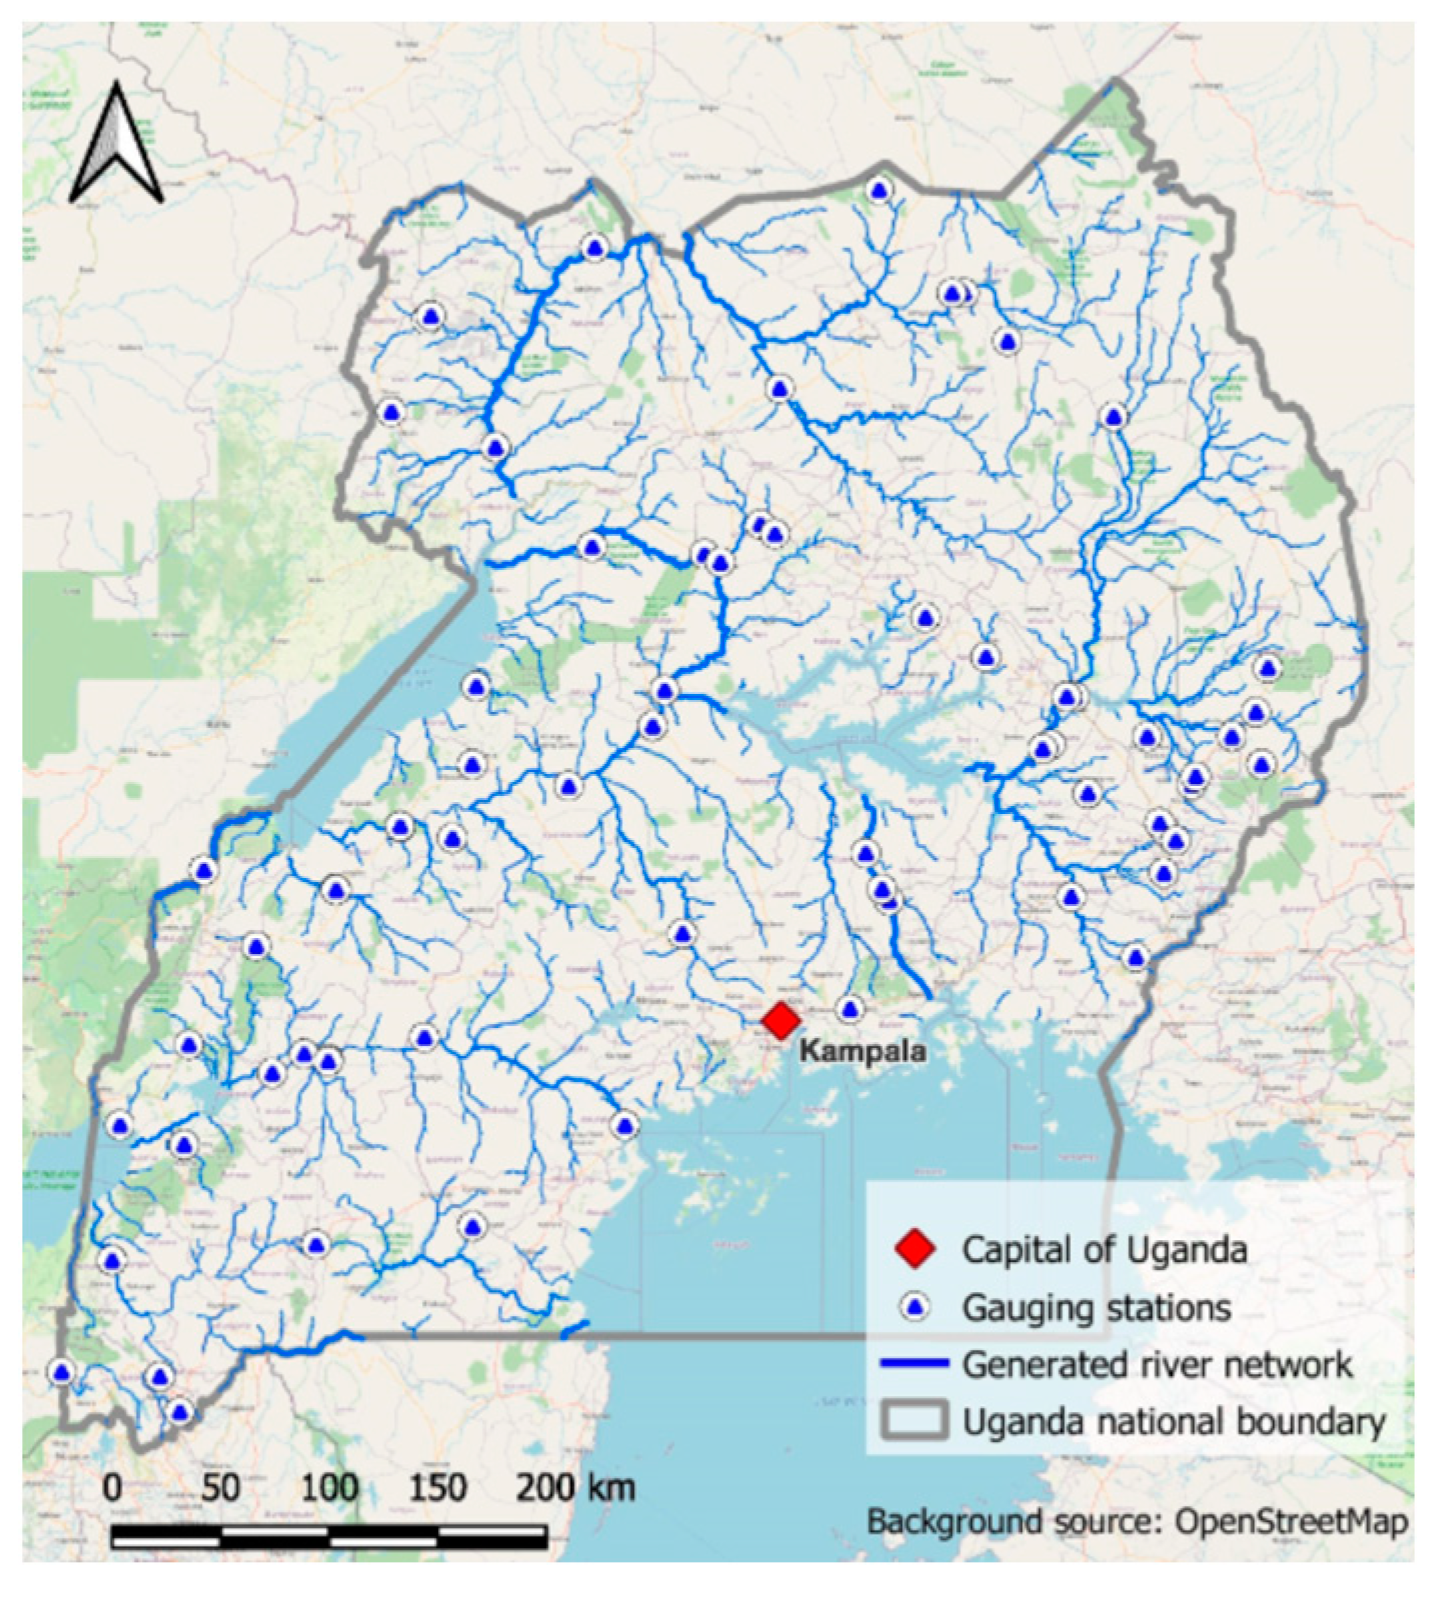
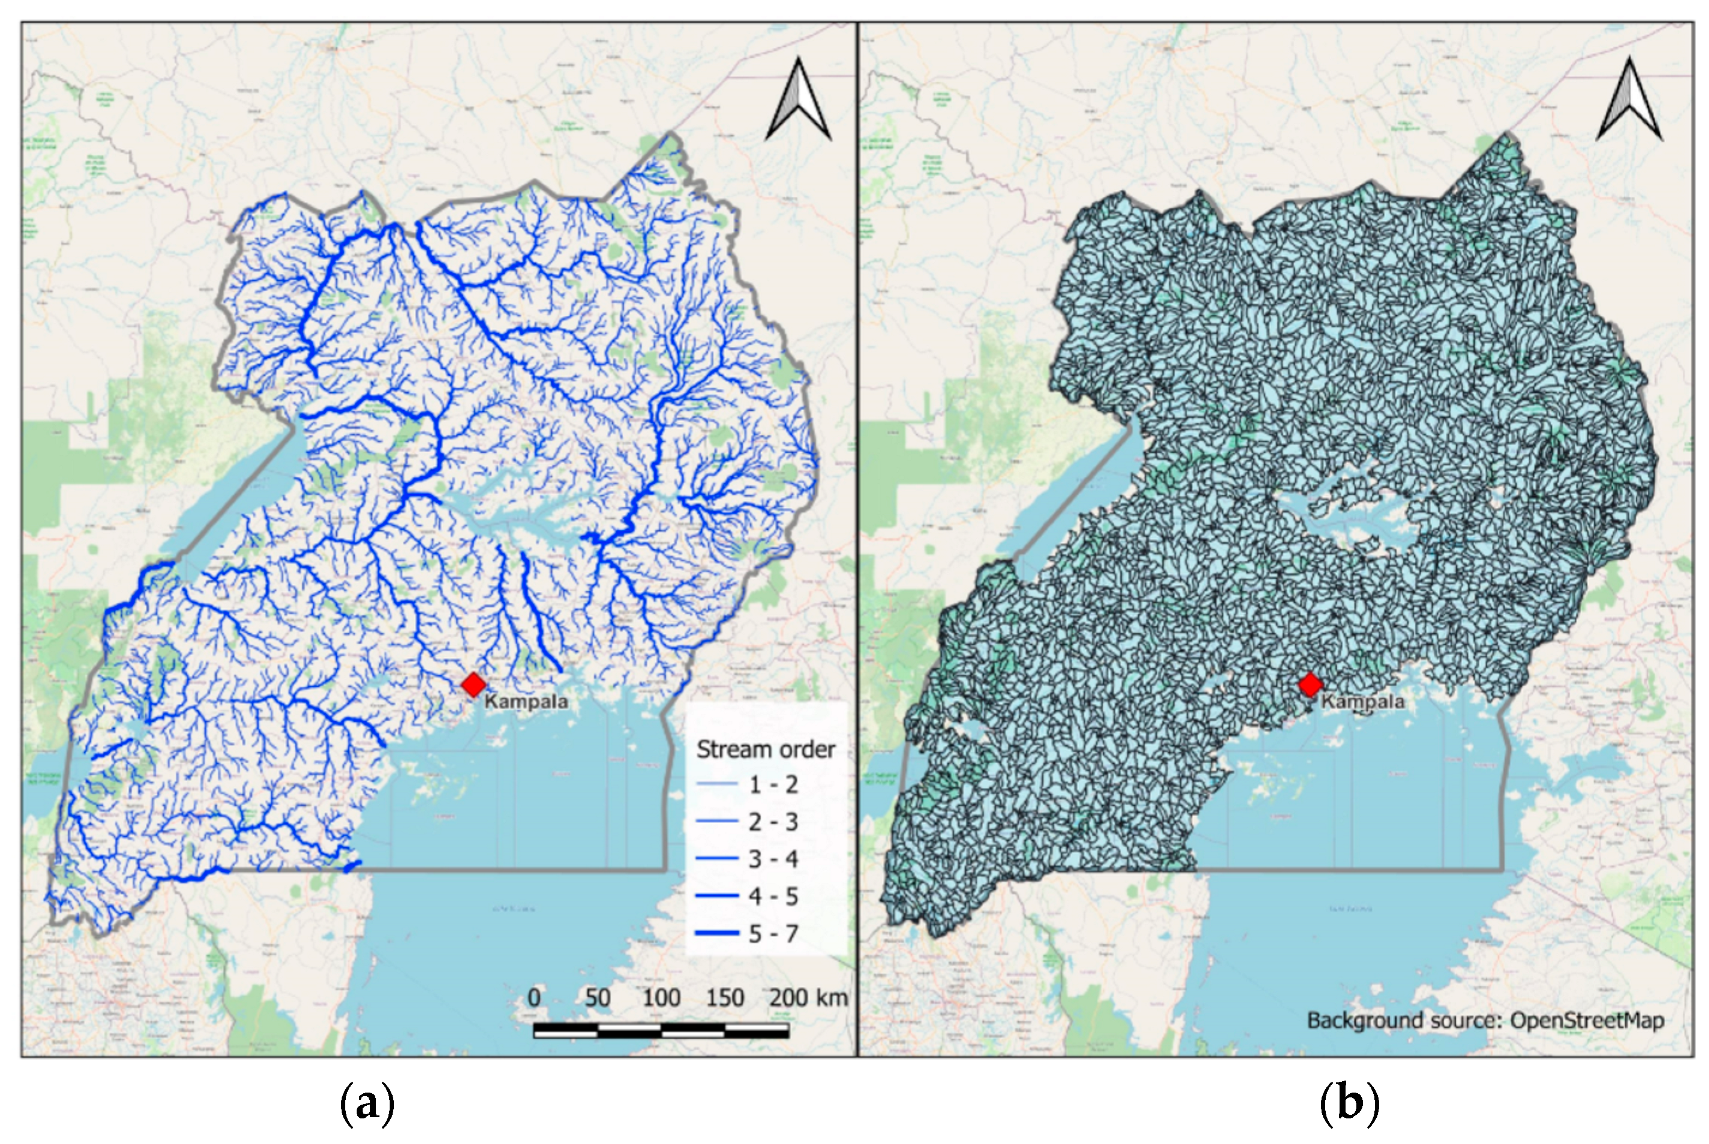
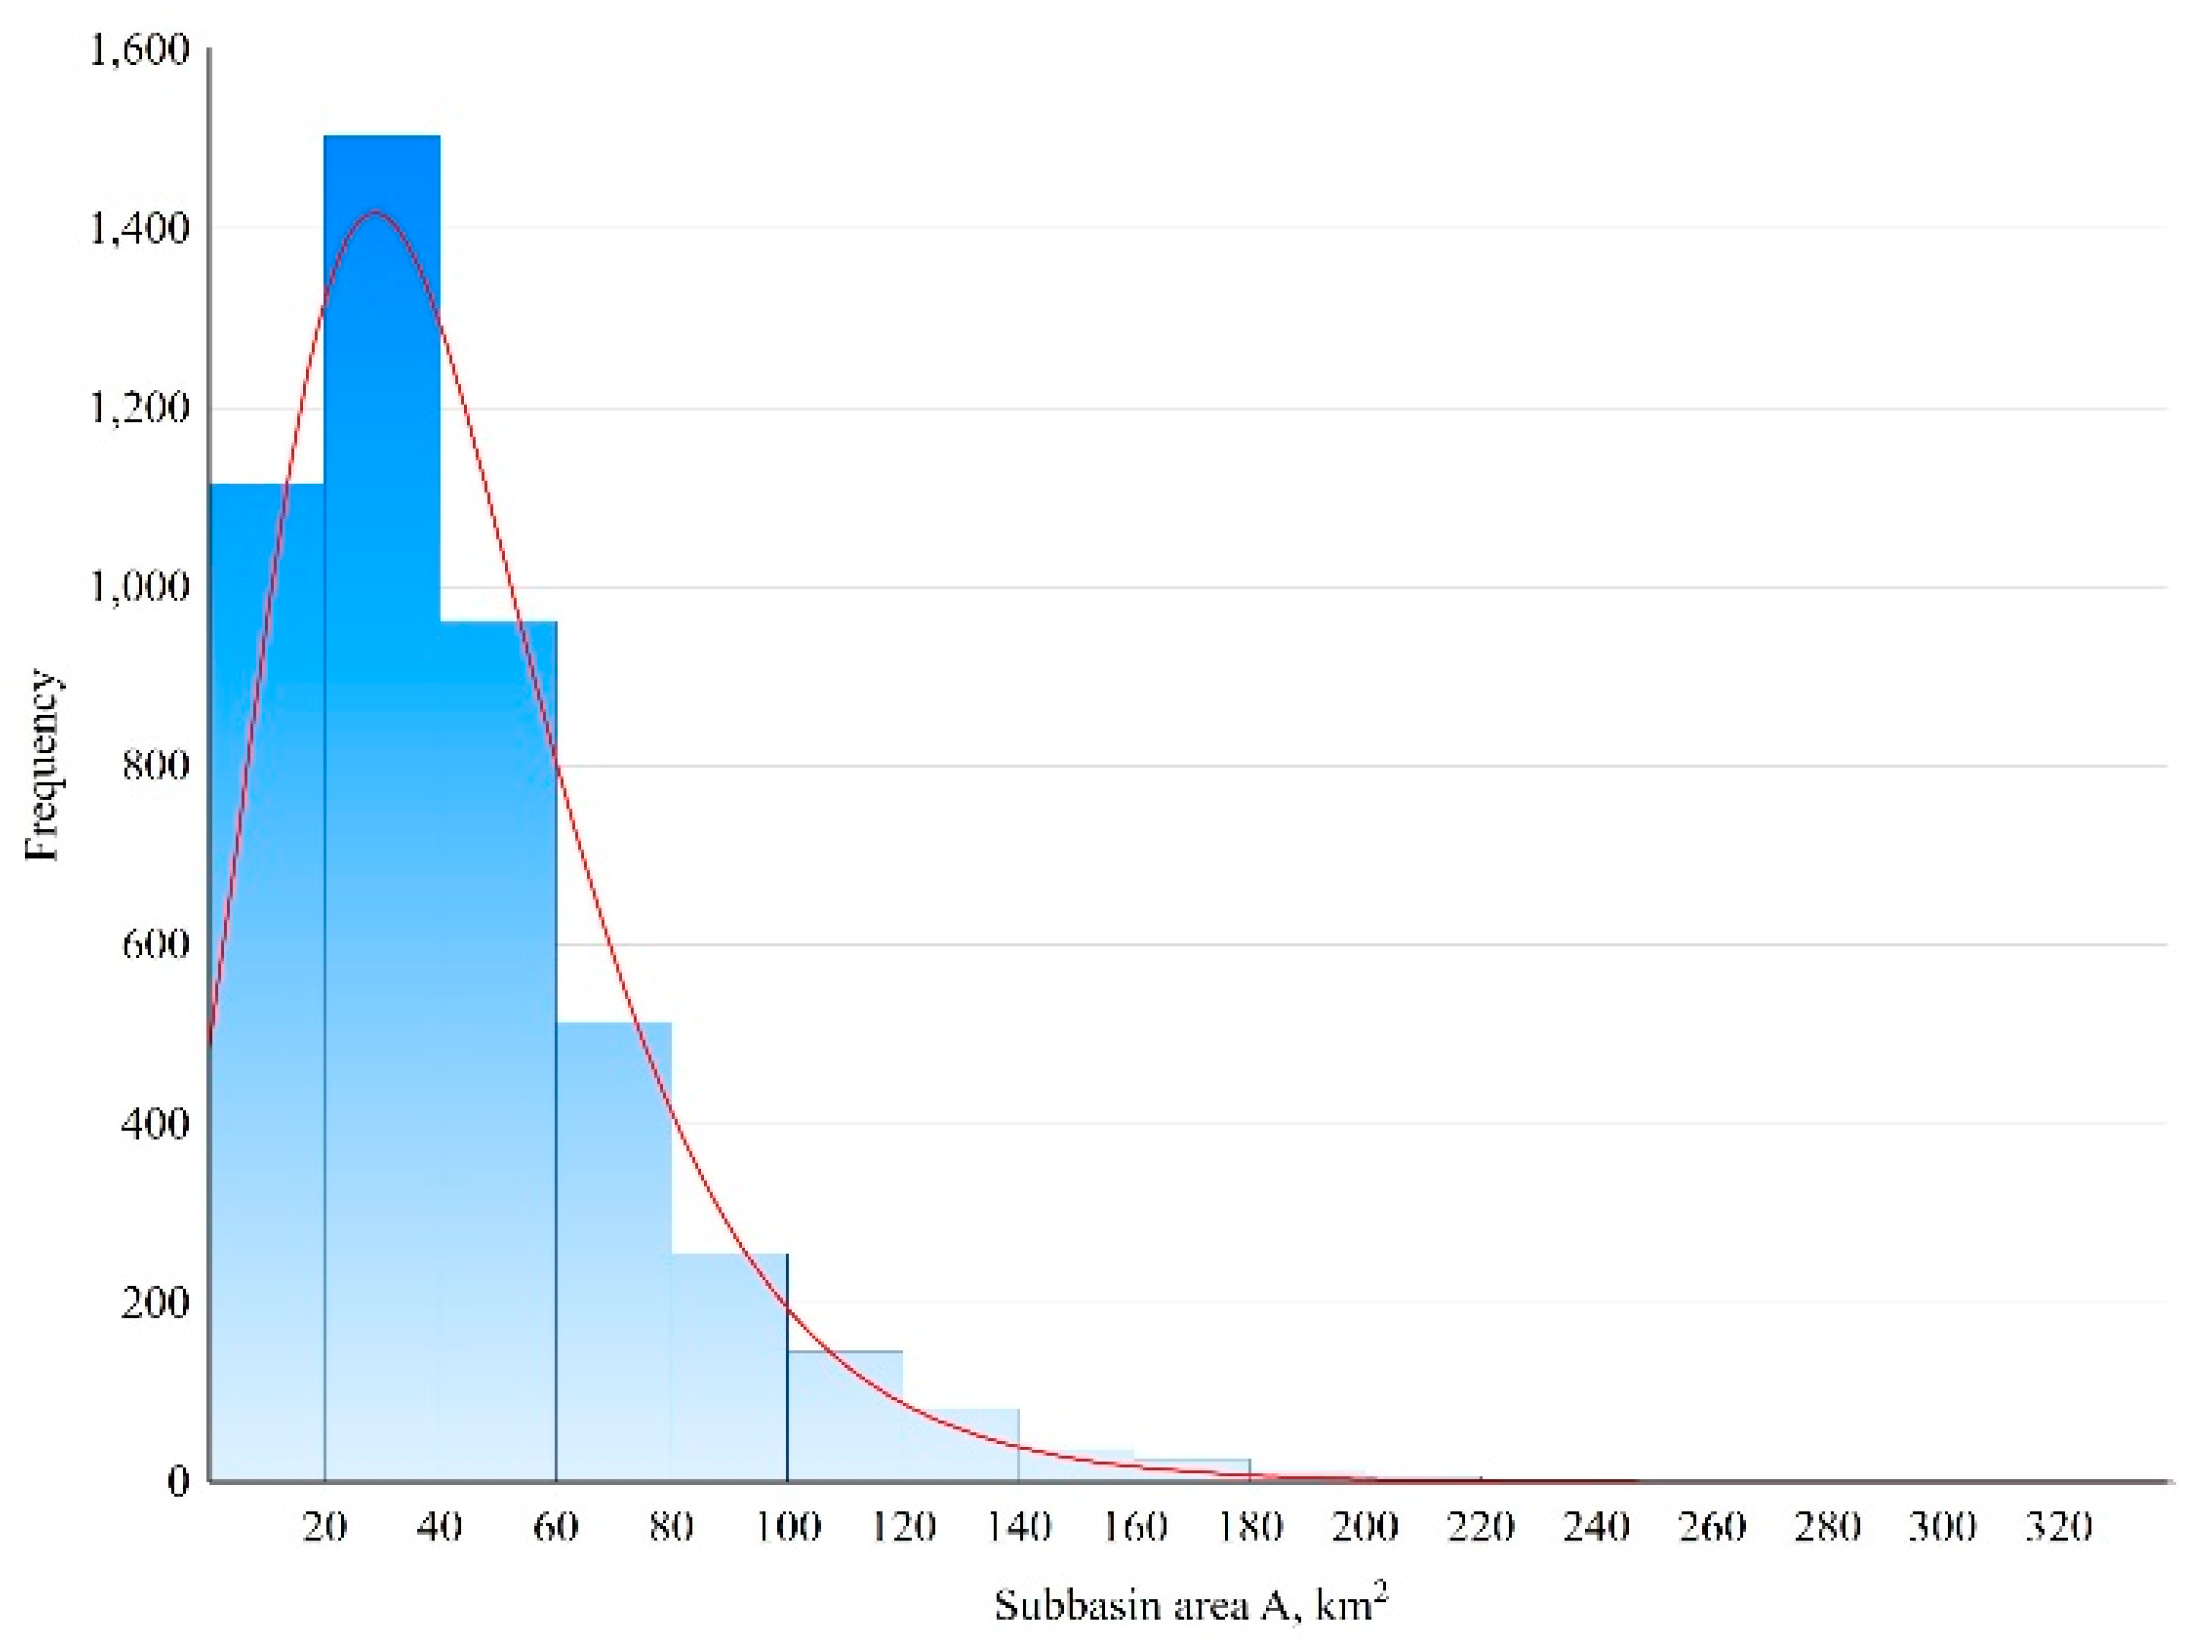
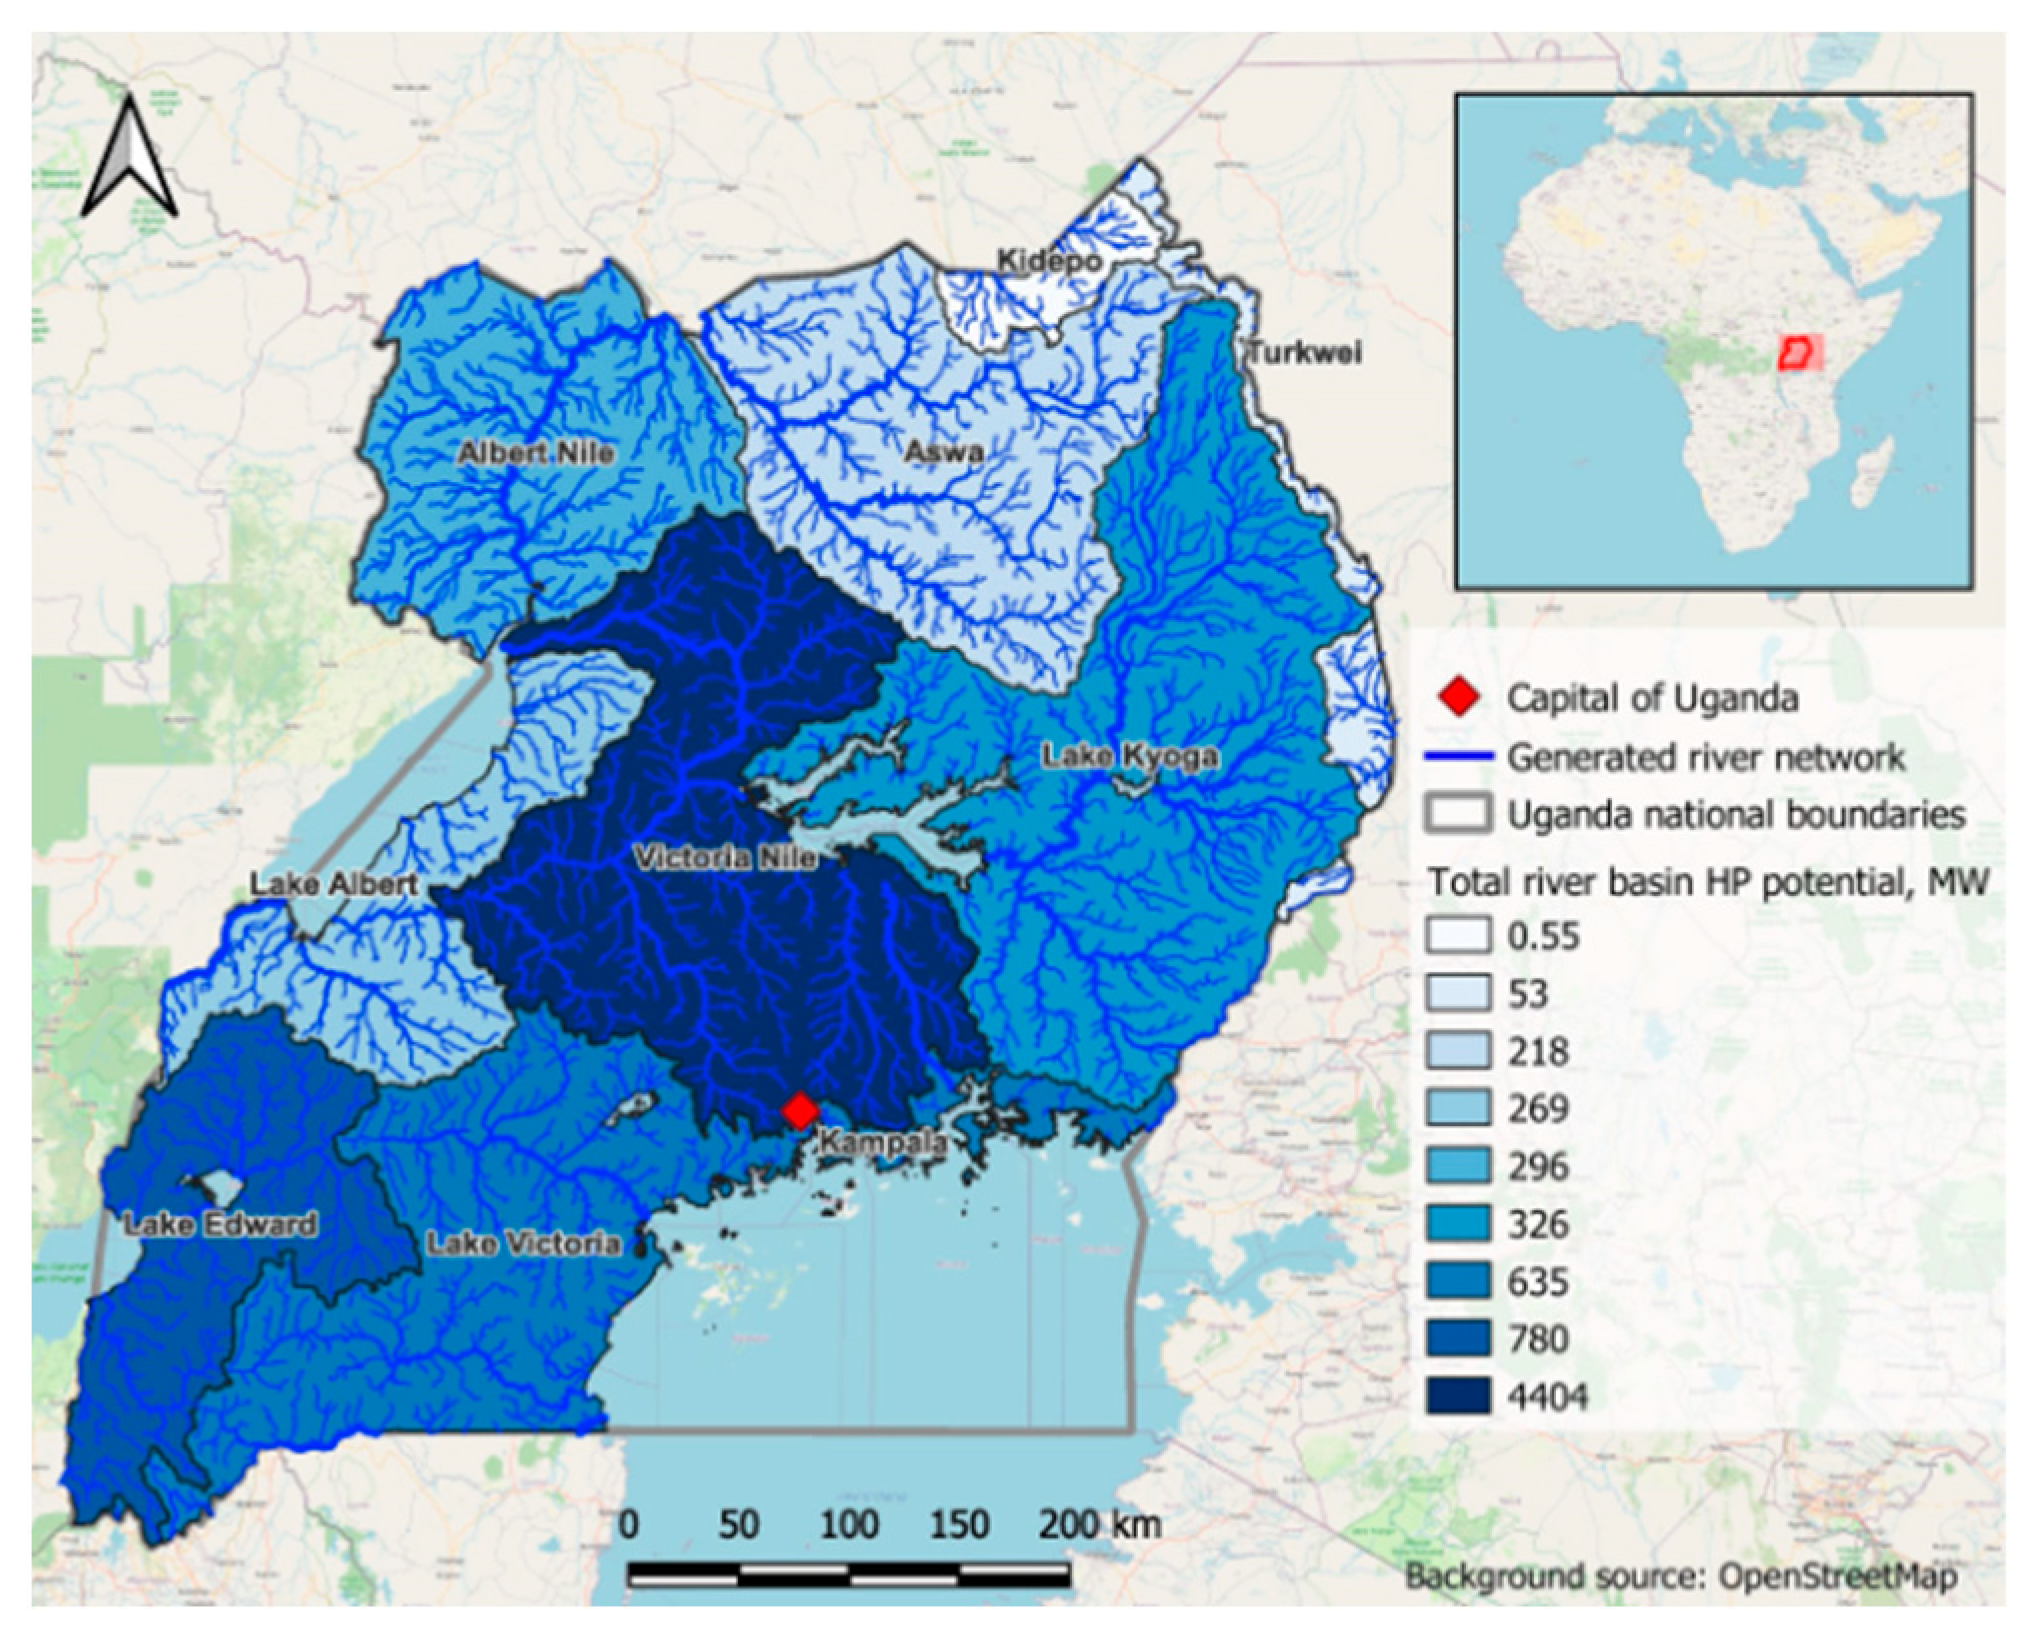
3.2. Generated Rivers and Small Sub-Basins
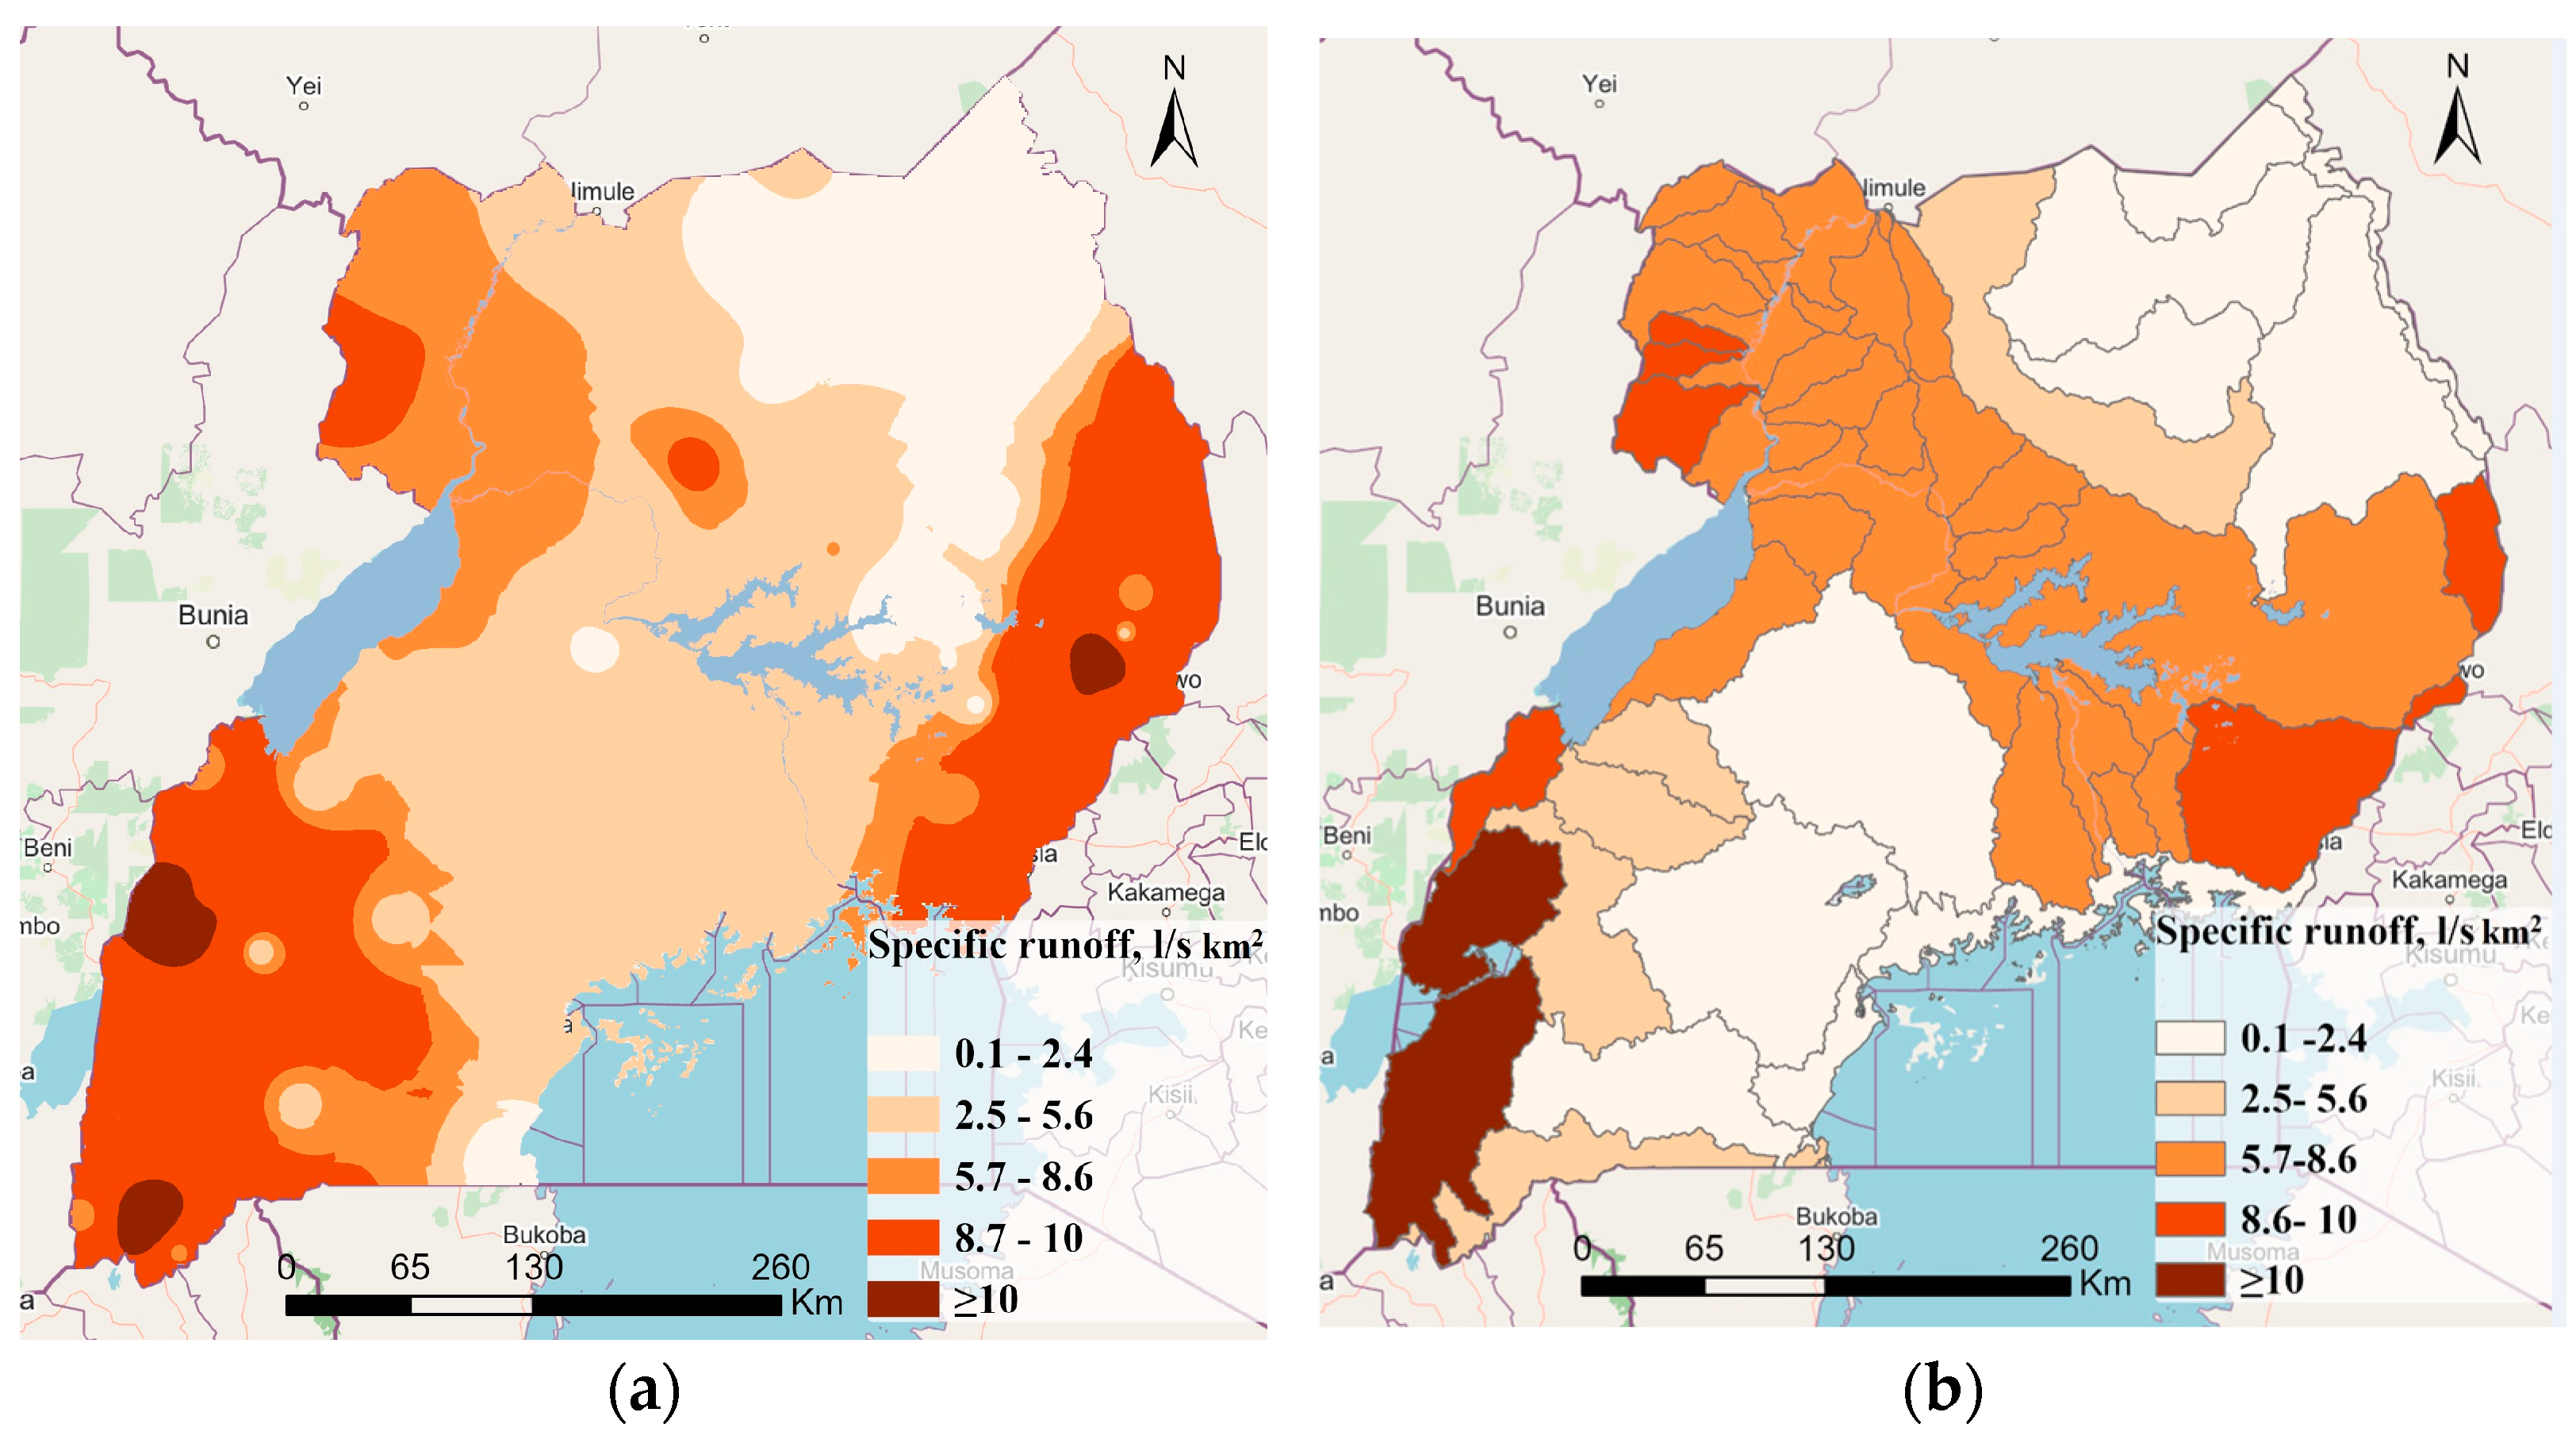
3.3. Specific Runoff
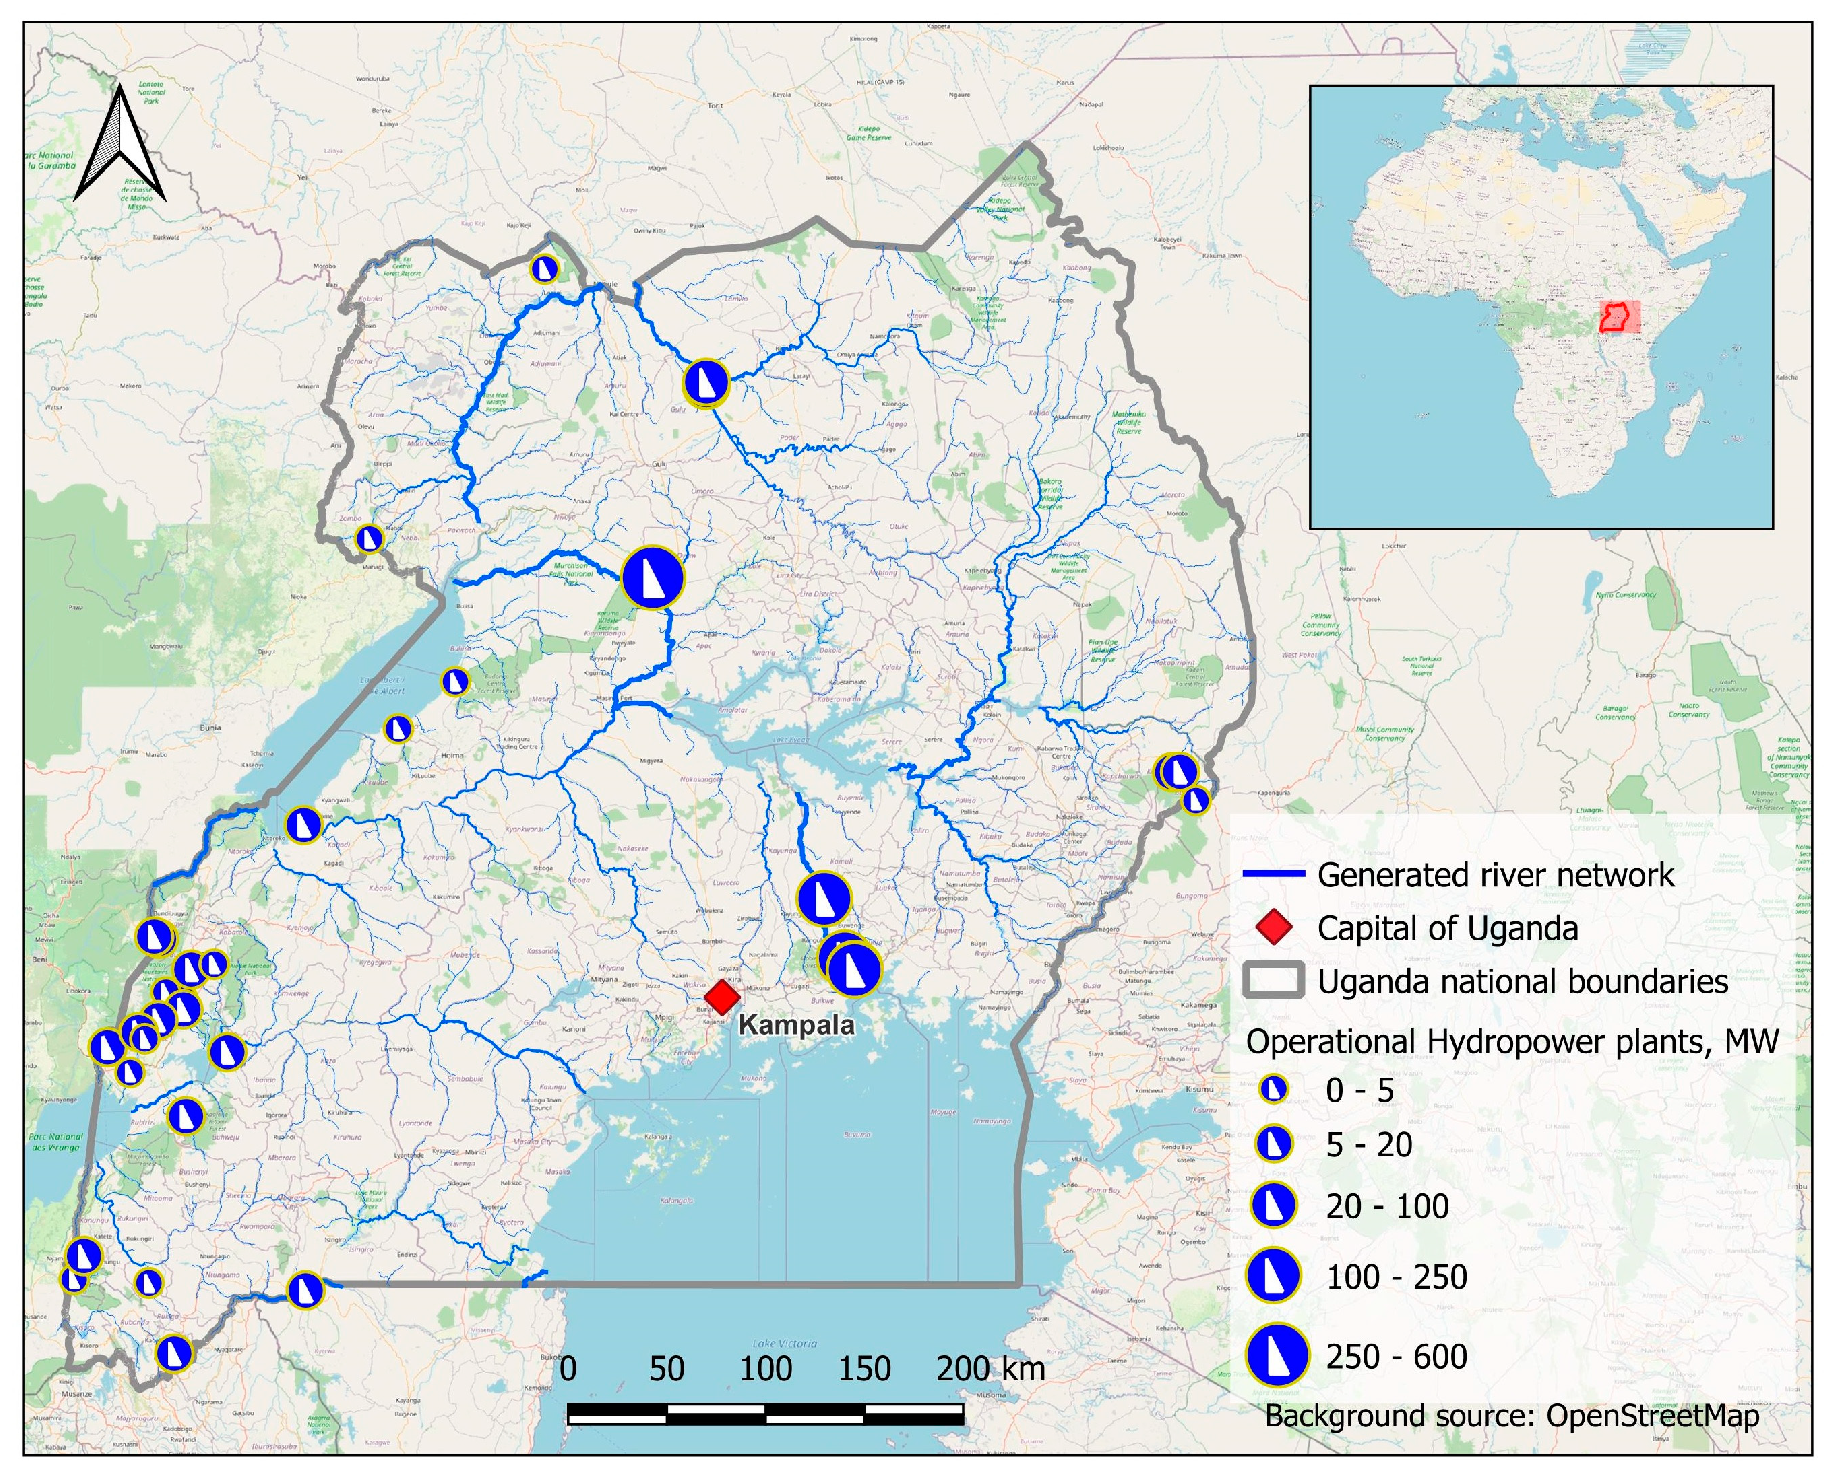
3.4. Hydropower Potential
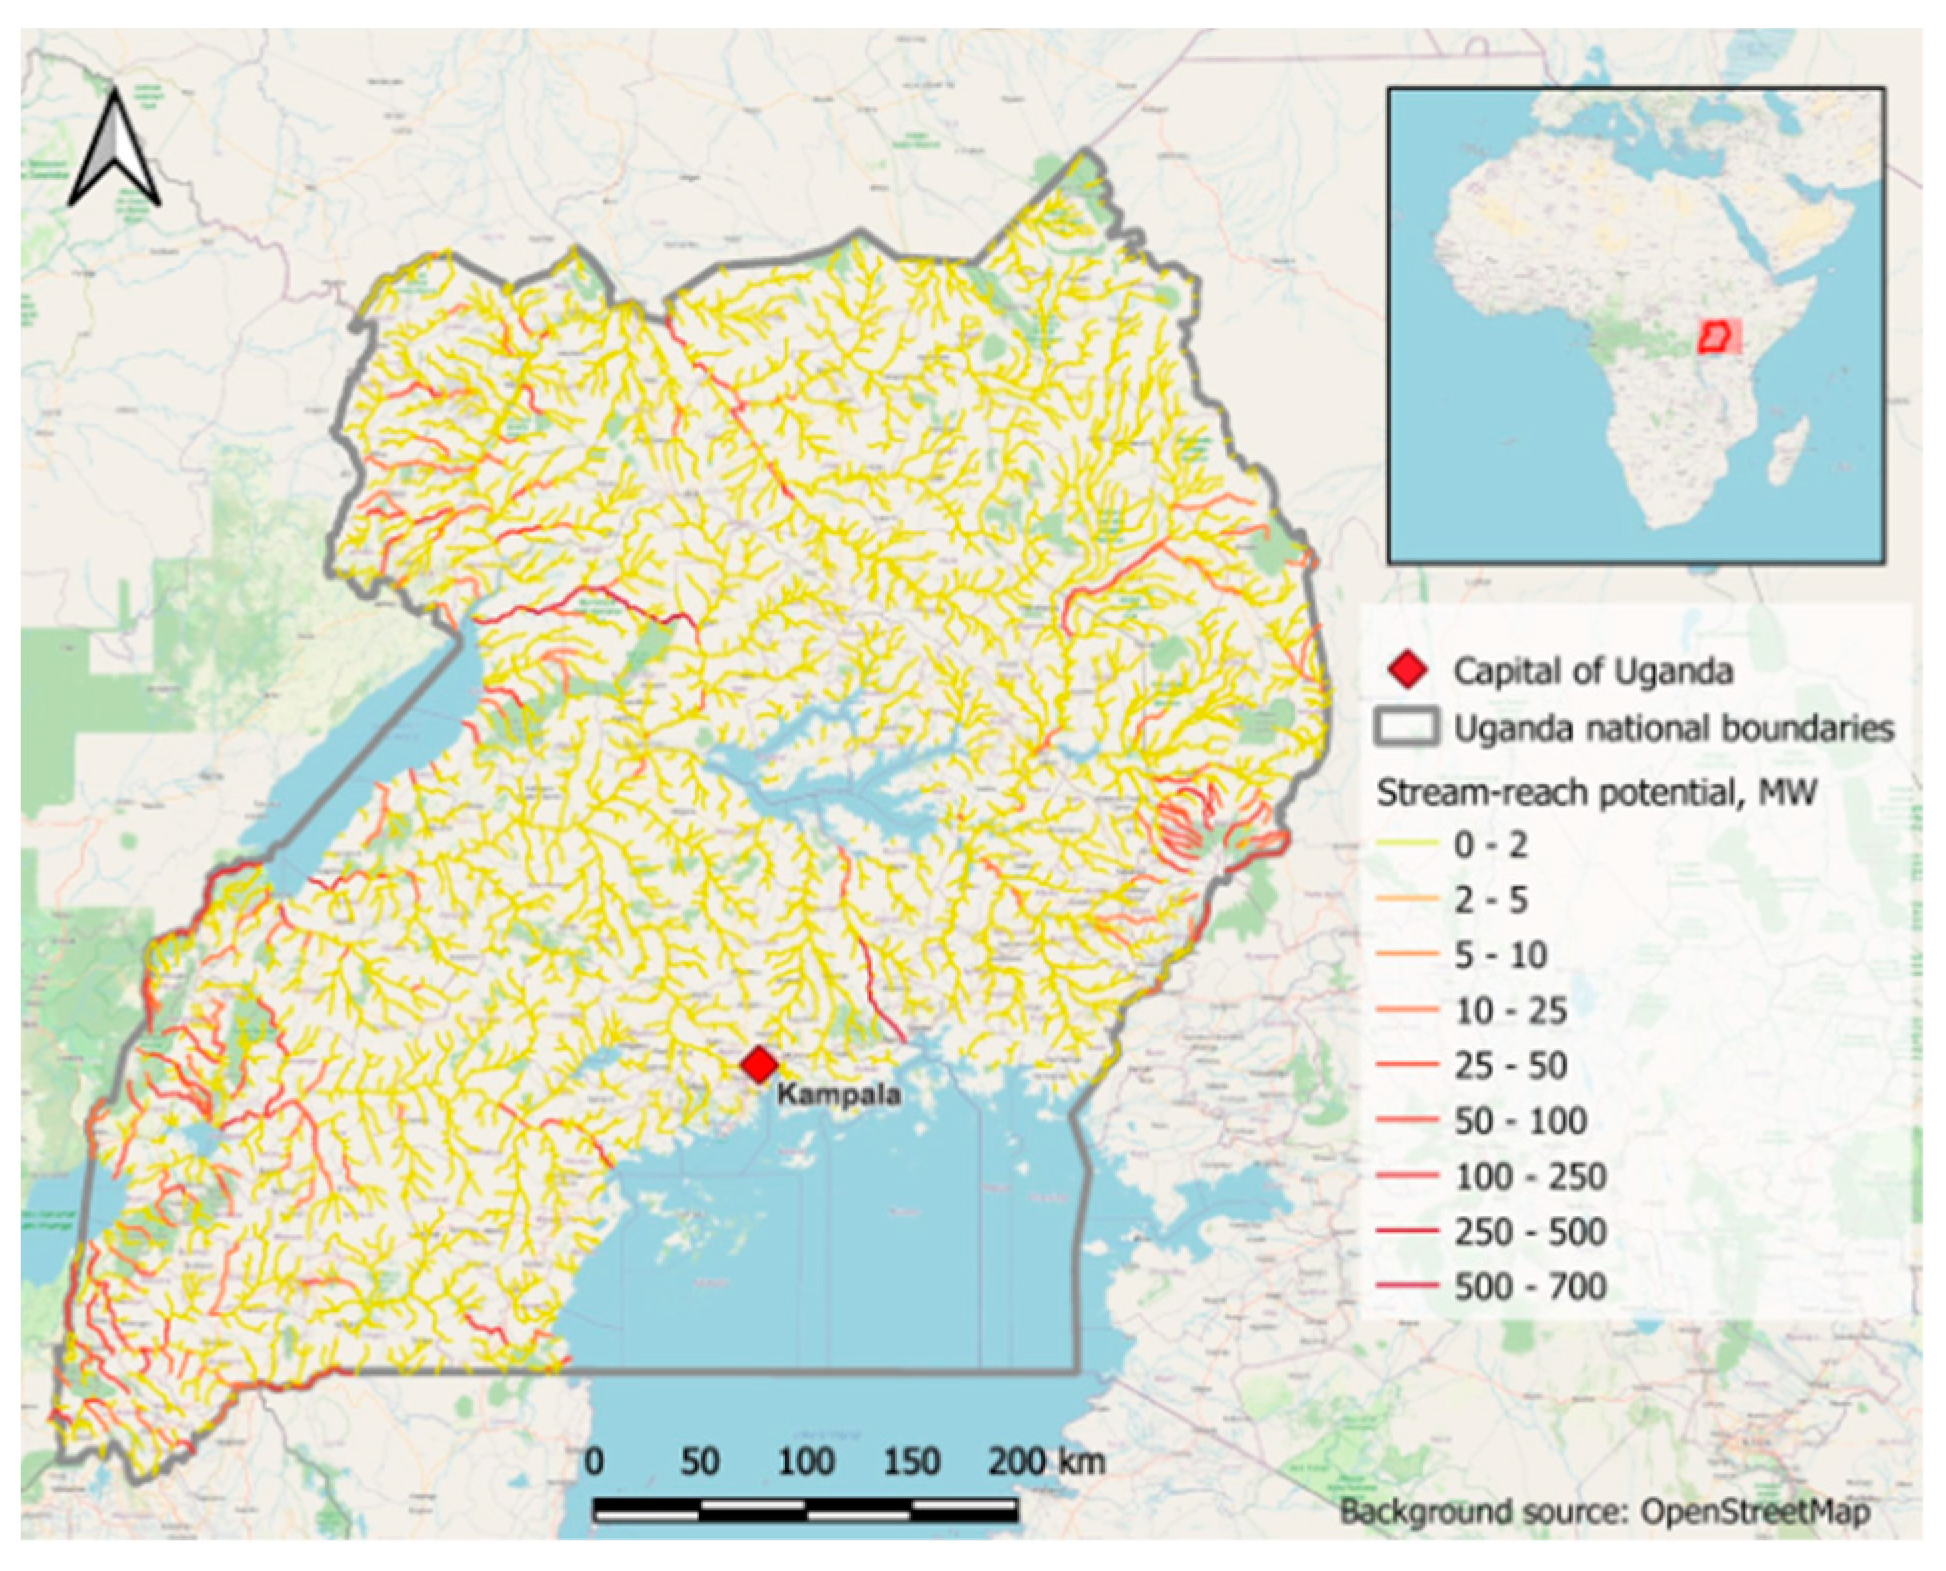
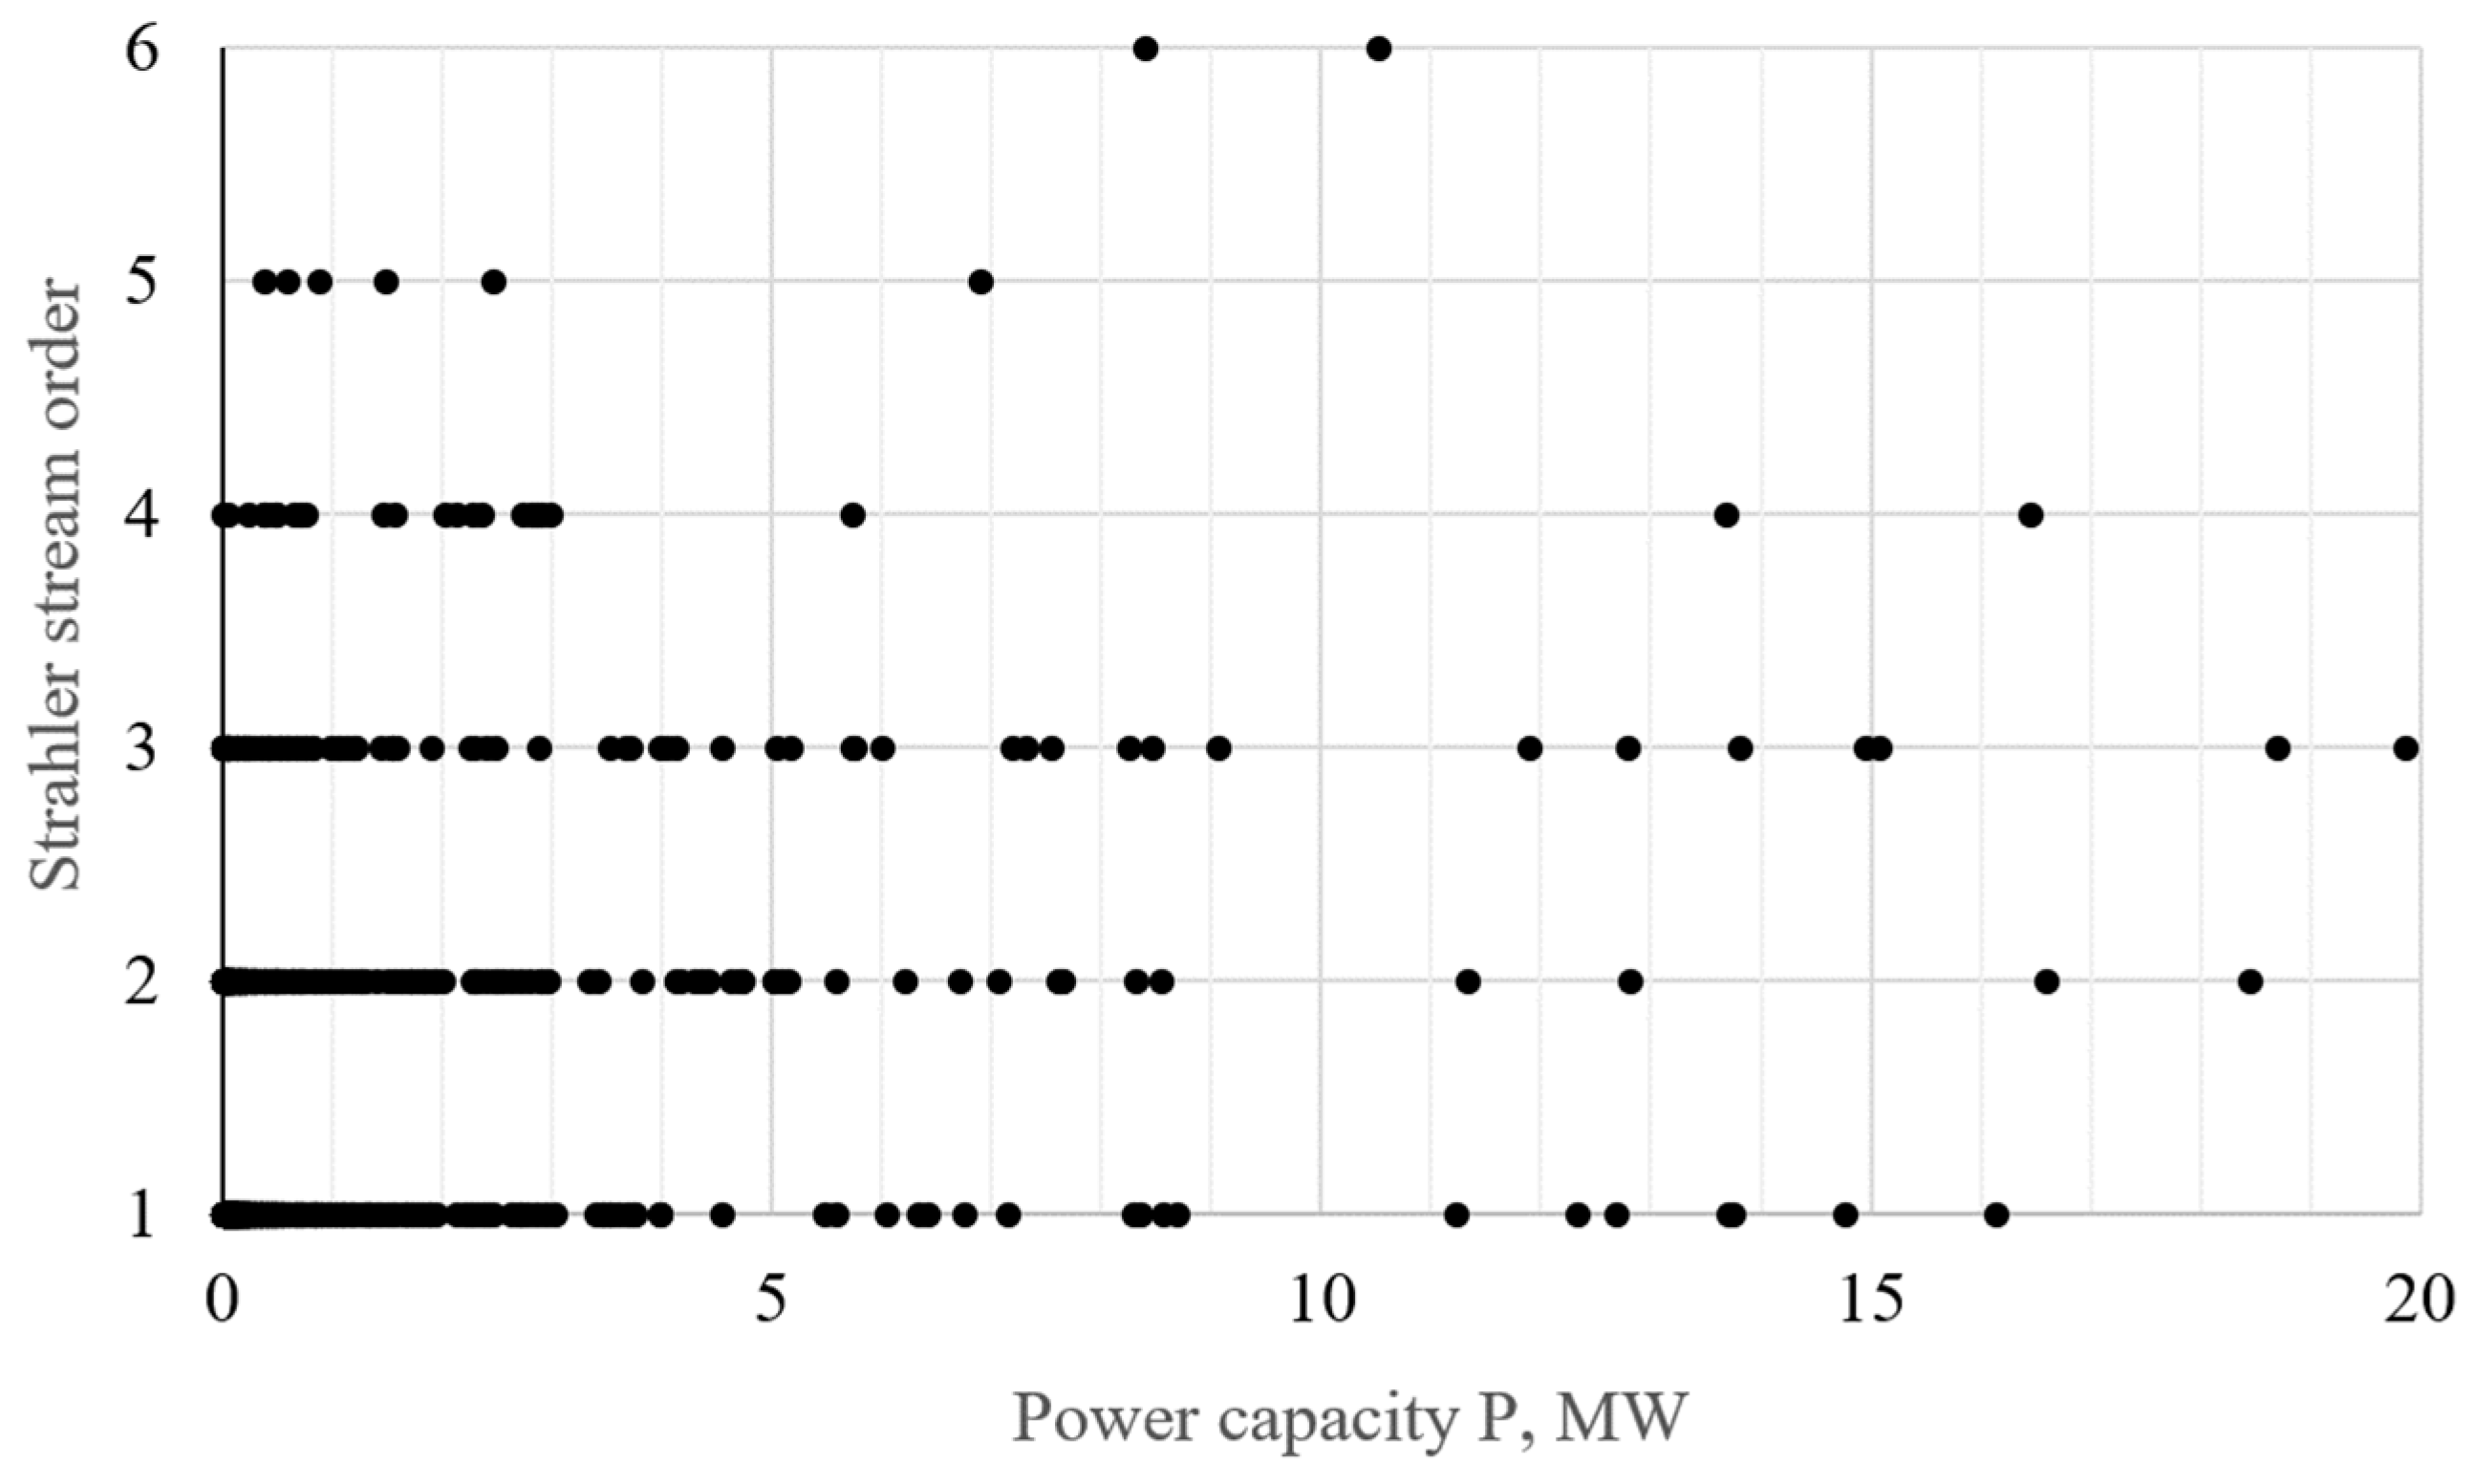
3.4.1. Stream-Reach Capacity
- (a)
- All the country’s small and medium-sized rivers, including the Nile;
- (b)
- The Nile;
- (c)
- All small and medium-sized rivers in the country, excluding the Nile;
- (d)
- Ditto, excluding the Nile and protected areas;
- (e)
- Ditto, excluding the Nile and stream-reach potential capacity of more than 20 MW (national SHP capacity limit);
- (f)
- Ditto, excluding the Nile and stream-reach potential capacity of more than 10 MW (European SHP standard).
- (a)
- The total stream-reach capacity potential for the country’s hydrographic area, including the Nile, was identified as 6917 MW (1439 stream reaches), which can be regarded as the technically feasible potential. Of these, 4170 MW of rivers’ capacity potential (and streams) falls within protected areas. This is about 60% of the total potential. Rivers that partially fall into protected areas add another 260 MW. Partially falling into a protected area was defined as up to ~30% of the river’s length occupying a protected area. The mean capacity of a stream segment was 4.81 MW, with a maximum of 673.62 MW (Table 8). Other estimates for the total hydropower potential differ considerably, e.g., 4137–4500 MW [5,29,30]. This is roughly one and a half times lower. The World Atlas of Hydropower & Dams [26] suggests that the capacity is 6950 MW. In contrast, a GIS study using the RhydroSearch application showed that the total hydropower potential estimates are at least three times higher, between 22,190 and 24,622 MW [3,27];
- (b)
- The Nile. In this case, the total stream-reach capacity potential amounts to 4831 MW, with a mean of 185.82 MW (population size is 26 out of 96 river segments). More than 1410 MW of capacity potential is currently installed or under construction [19]. As a result, the remaining potential amounts to 3421 MW;
- (c)
- The total stream-reach capacity potential of small and medium-sized rivers (the Nile is excluded) amounts to 2086 MW;
- (d)
- If the protected areas are screened out of the reaches mentioned above, the total capacity diminishes by nearly half to 1033 MW;
- (e)
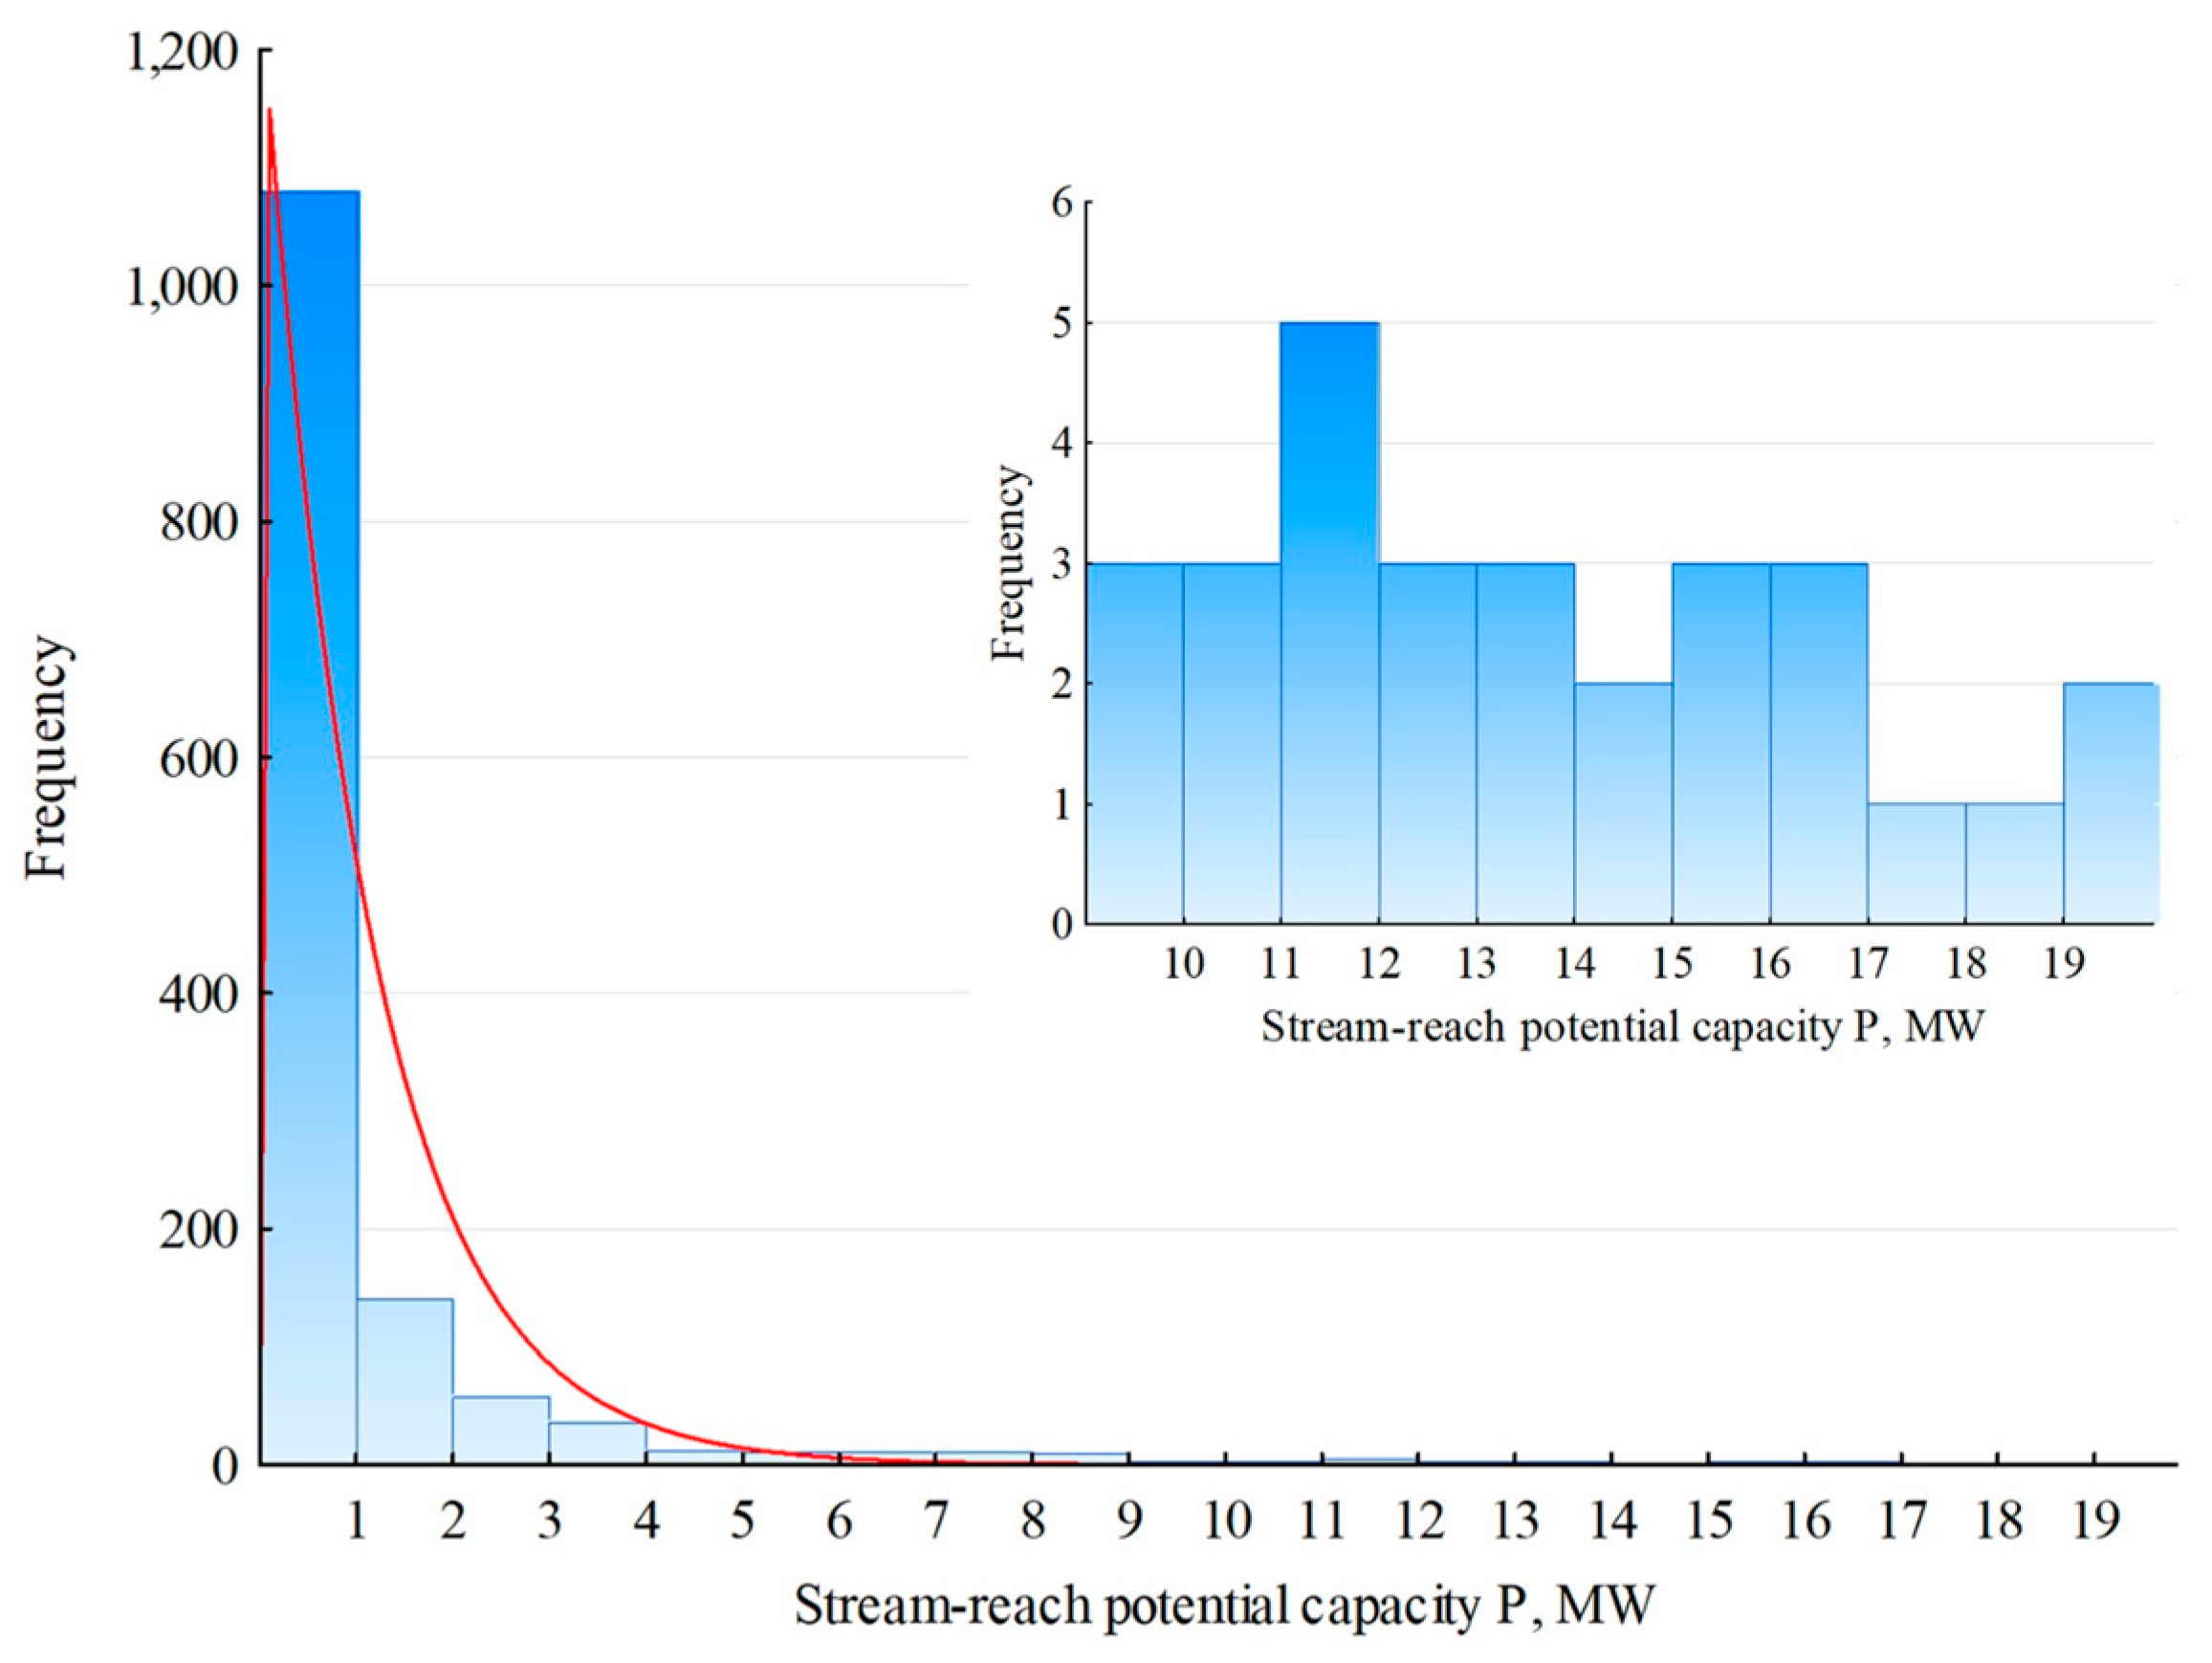
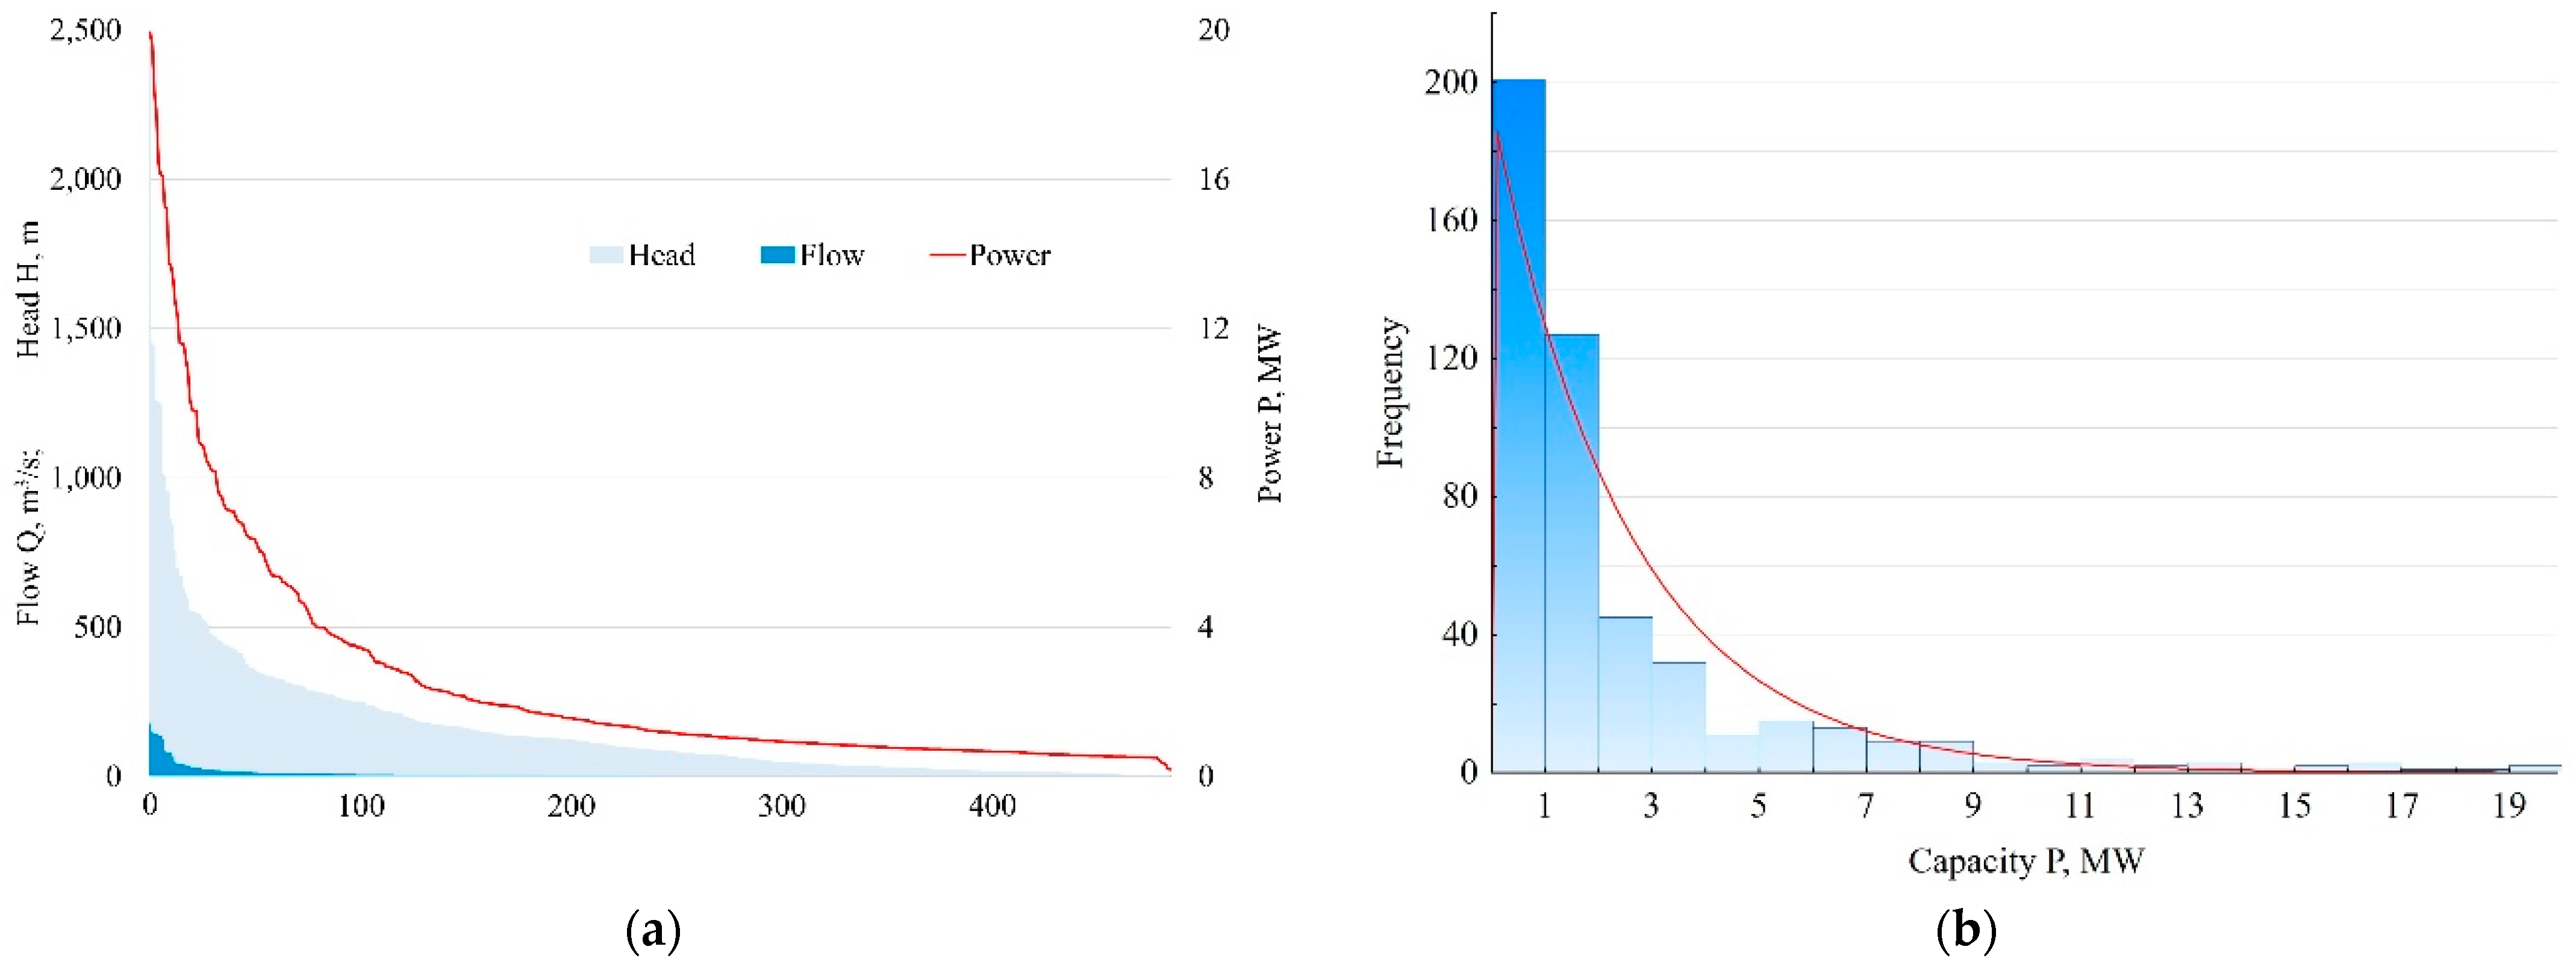
- If the stream-reach capacity is considered only at less than 20 MW, then the total stream-reach capacity potential decreases to 1549 MW. Their individual sites’ power capacity frequency distribution is illustrated in Figure 12. More than 160 MW are currently installed in SHPs < 20 MW [5,23]. As a result, the remaining potential amounts to some 1389 MW, or approximately 5500 GWh/year. The World Small Hydropower Development Report (WSHDR) for Uganda [32] provides a relatively low estimate of 258 MW. No detailed information was given in this report on how this potential was determined;
- (f)
- If the stream-reach capacity is considered only at less than 10 MW, then the total stream-reach capacity potential decreases to 1181 MW (sample size is 1370). More than 100 MW are currently installed in SHPs <10 MW [19,23]. As a result, the remaining potential amounts to 1081 MW. The WSHDR estimate for this SHP capacity limit was relatively low at 200 MW [32]. A very small technical SHP potential, taking into account environmental limitations, was estimated at 49.8 MW in 43 sites in Uganda [11].
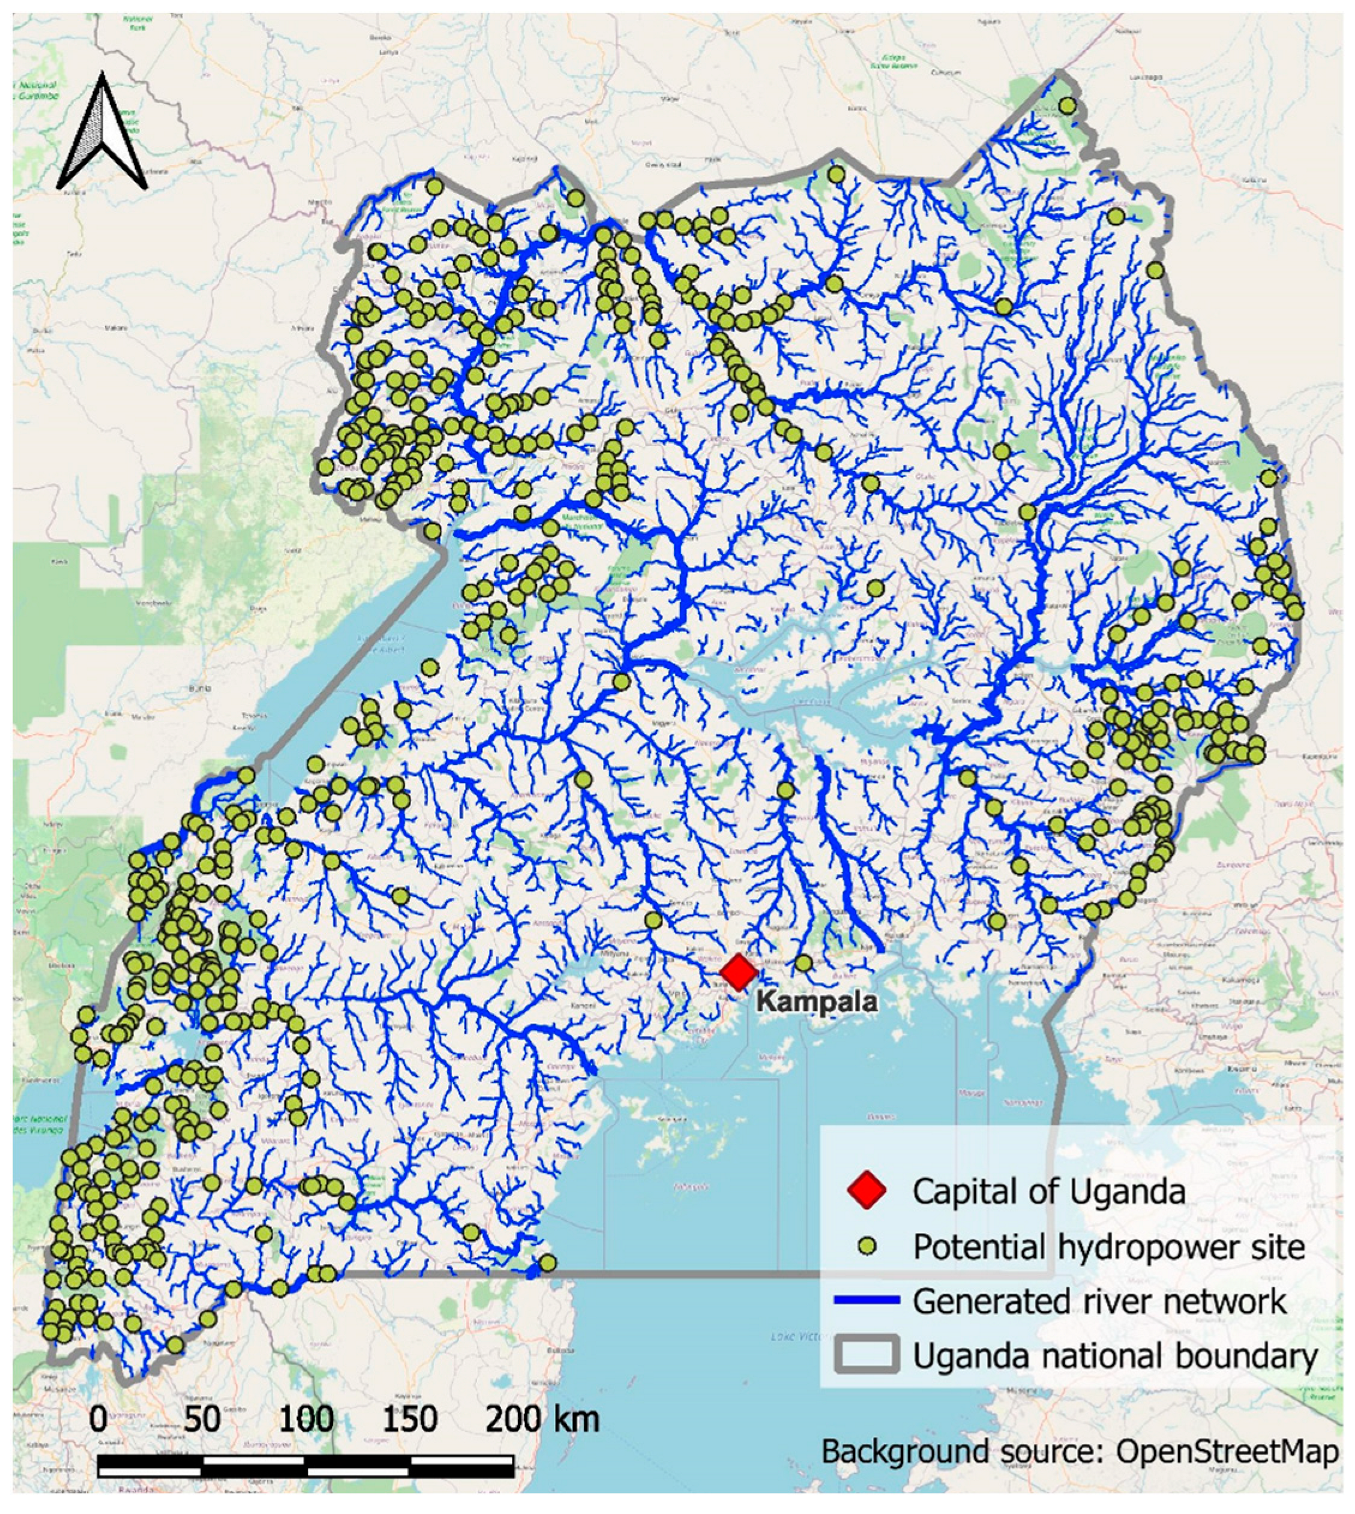
3.4.2. Potential Hydropower Sites
- Site type (e.g., run-of-the-river, reservoir, off-grid, or central grid);
- Address, stream or river name, basin (hydrologic unit or water management district name), coordinates (longitude and latitude);
- Approximate capacity (MW), flow (m3/s), and head (m);
- Environmental sensitivity (e.g., protected areas);
- Any opportunities for development (e.g., prior studies).
4. Conclusions
- This article presents a summary of Uganda’s hydropower characteristics that were extracted from the HYPOSO map and processed. The raw data are freely available. The latter provides practical opportunities to examine the prospective hydro schemes of specific areas in much more detail. However, in any case, the modelled estimates do not represent the actual numbers for engineering design; they provide the basis for follow-up studies to proceed with pre-feasibility or feasibility studies.
- The compiled HYPOSO DEM was validated. Longitudinal comparisons of stream profiles showed that the compliance was satisfactory. However, this analysis would not be valid in flat topographic areas, as the accuracy may be unsatisfactory.
- The boundaries of small sub-basins were identified, and the sizes of areas contributing to runoff were determined. This is core information that is needed in developing SHPs to reveal a first estimate of the river flow based on the normal specific runoff digital map.
- Uganda’s hydropower potential was determined, and its values were compared with prior estimates. Notable discrepancies were highlighted, and the reasons for them were briefly discussed.
- A dataset of potential SHP site locations for hydropower exploitation was compiled, covering some 500 points for Uganda and taking into account expected capacity, protected areas, the proximity of the grid, settlements, and concentration points of energy demand. Screening out of protected areas does not mean that hydropower development is completely excluded. The level of environmental sensitivity, legislation and social-economic factors should be taken into account.
- A concise statistical analysis of the hydropower potential datasets in consideration is presented. These summaries will be necessary for decision-makers to foster SHP development in this country.
Author Contributions
Funding
Acknowledgments
Conflicts of Interest
References
- MWE (Ministry of Water and Environment). Framework and Guidelines for Water Source Protection. V.5. In Guidelines for Protecting Water Sources for Hydroelectric Power Plants; MWE: Kampala, Uganda, 2013; p. 55. [Google Scholar]
- Jjunju, E.; Killingtveit, A.; Gimbo, F. A GIS tool for investigating potential hydropower sites in sparsely studied areas. In Proceedings of the Hydro 2015, Bordeaux, France, 26–28 October 2015; Hydropower & Dams, Aqua-Media International Ltd: Wallington, United Kingdom, 2015; p. 15. [Google Scholar]
- Jjunju, E. Integrating Climate Change in Hydropower Development in East Africa. Ph.D. Thesis, Norwegian University of Science and Technology, Trondheim, Norway, 2016. [Google Scholar]
- Kenfack, J.; Nzotcha, U.; Voufo, J.; Ngohe-Ekam, P.S.; Nsangou, J.C.; Bignom, B. Cameroon’s hydropower potential and development under the vision of Central Africa power pool (CAPP): A review. Renew. Sustain. Energy Rev. 2021, 151, 111596. [Google Scholar] [CrossRef]
- Katutsi, V.; Kaddu, M.; Migisha, A.G.; Rubanda, M.E.; Adaramola, M.S. Overview of hydropower resources and development in Uganda. AIMS Energy 2021, 9, 1299–1320. [Google Scholar] [CrossRef]
- Weiss, H.W.; Faeh, A. Methods for evaluating hydro potential. In Proceedings of the Conference Hydrology in Mountainous Regions I-Hydrological Measurements, the Water Cycle, Lausanne, Switzerland, 27 August–1 September 1990; IAHS Publication: Lausanne, Switzerland, 1990; pp. 80–93. [Google Scholar]
- Gismalla, Y.A.; Bruen, M. Use of a GIS in reconnaissance studies for small-scale hydropower development in a developing country: A case study from Tanzania. In Proceedings of the Conference HydroGIS 96: Application of Geographic Information Systems in Hydrology and Water Resources Management, Vienna, Austria, 16–19 April 1996; pp. 307–312. [Google Scholar]
- Larentis, D.G.; Collischonn, W.; Olivera, F.; Tucci, C.E.M. Gis-based procedures for hydropower potential spotting. Energy 2010, 35, 4237–4243. [Google Scholar] [CrossRef]
- Punys, P.; Dumbrauskas, A.; Kvaraciejus, A.; Vyciene, G. Tools for Small Hydropower Plant Resource Planning and Development: A Review of Technology and Applications. Energies 2011, 4, 1258–1277. [Google Scholar] [CrossRef]
- Szabó, S.; Bódis, K.; Huld, T.; Moner-Girona, M. Sustainable Energy Planning: Leapfrogging the Energy Poverty Gap in Africa. Renew. Sustain. Energy Rev. 2013, 28, 500–509. [Google Scholar] [CrossRef]
- Korkovelos, A.; Mentis, D.; Siyal, S.; Arderne, C.; Rogner, H.; Bazilian, M.; Howells, M.; Beck, H.; De Roo, A. A Geospatial Assessment of Small-Scale Hydropower Potential in Sub-Saharan Africa. Energies 2018, 11, 3100. [Google Scholar] [CrossRef]
- Kling, H.; Stanzel, P.; Fuchs, M. Regional Assessment of the Hydropower Potential of Rivers in West Africa. Energy Procedia 2016, 97, 286–293. [Google Scholar] [CrossRef]
- Results of ECOWAS Small Scale Hydropower Program. GIS Hydro Resource Mapping in West Africa. Available online: http://www.ecowrex.org/smallhydro (accessed on 3 January 2023).
- Tanzania—Small Hydro GIS Atlas. Available online: https://datacatalog.worldbank.org/search/dataset/0042290/Tanzania---Small-Hydro-GIS-Atlas (accessed on 1 February 2023).
- Madagascar—Small Hydro GIS Atlas. Available online: https://energydata.info/dataset/madagscar-small-hydro-gis-atlas-2017 (accessed on 3 January 2023).
- Sterl, S.; Devillers, A.; Chawanda, C.J.; van Griensven, A.; Thiery, W.; Russo, D. A spatiotemporal atlas of hydropower in Africa for energy modelling purposes. Open Res. Eur. 2021, 1, 29. [Google Scholar] [CrossRef]
- Bergström, D.J.; Malmros, C. Finding Potential Sites for Small-Scale Hydro Power in Uganda: A Step to Assist the Rural Electrification by the Use of GIS: A Minor Field Study; Lund University: Lund, Sweden, 2005; p. 82. [Google Scholar]
- Gimbo, F. Verification of a GIS-based system for identification of potential hydro power plant sites in Uganda. MSc Thesis, NTNU, Trondheim, Norway, 2015. [Google Scholar]
- HYPOSO Map. Available online: https://www.hyposo.eu/en/hyposo-map/ (accessed on 2 May 2023).
- ERA (Electricity Regulatory Authority). Available online: https://www.era.go.ug/index.php/download-repository/683-installed-capacity/download (accessed on 3 January 2023).
- Twaha, S.; Ramli, M.A.M.; Murphy, P.M.; Mukhtiar, M.U.; Nsamba, H.K. Renewable based distributed generation in Uganda: Resource potential and status of exploitation. Renew. Sustain. Energy Rev. 2016, 57, 786–798. [Google Scholar] [CrossRef]
- Fashina, A.; Mundu, M.; Akiyode, O.; Abdullah, L.; Sanni, D.; Ounyesiga, L. The Drivers and Barriers of Renewable Energy Applications and Development in Uganda: A Review. Clean Technol. 2018, 1, 9–39. [Google Scholar] [CrossRef]
- Nabutsabi, D.M. Framework Analysis and Research Needs in Uganda. HYPOSO (Hydropower Solutions for Developing and Emerging Countries). 2020. Available online: https://www.hyposo.eu/pdf/HYPOSO_Framework_Conditions_Uganda.pdf (accessed on 2 May 2023).
- Hydro 4 Africa. Available online: http://hydro4africa.net/HP_database/country.php?country=Uganda (accessed on 3 January 2023).
- MEMD (Ministry of Energy and Mineral Development). Generation Sites. Uganda. 2018. Available online: https://memd.go.ug/ (accessed on 2 May 2023).
- Bartle, A. World Atlas of Hydropower & Dams. 2019; Aqua Media International Ltd.: Wallington, UK, 2019; p. 303. [Google Scholar]
- Killingtveit, Å. Hydropower Resources Assessment—Potential for Further Development. In Comprehensive Renewable Energy; Letcher, T.M., Ed.; Elsevier: Oxford, UK, 2022; pp. 14–29. [Google Scholar]
- JICA (Japan International Cooperation Agency). Project for Master Plan Study on Hydropower Development in the Republic of Uganda. Final Report; JICA: Tokyo, Japan, 2011; p. 120. [Google Scholar]
- Uganda Vision 2040. Available online: https://www.greengrowthknowledge.org/sites/default/files/downloads/policy-database/UGANDA%29%20Vision%202040.pdf (accessed on 3 January 2023).
- NRFC (Norton Rose Fulbright). Investing in the Electricity Sector in Uganda. 2015. Available online: https://www.lexology.com/library/detail.aspx?g=776fe504-7d81-4ead-9ddf-11e73b95a686 (accessed on 2 May 2023).
- Bartle, A. World Atlas of Hydropower & Dams. 2022; Aqua Media International Ltd: Wallington, UK, 2022; p. 303. [Google Scholar]
- Gimbo, F.; Kalebbo, R. Uganda. In World Small Hydropower Development Report (WSHDR)UNIDO; ICSHP: Hangzhou, China, 2019; Volume 1.1.13. [Google Scholar]
- Nsubuga, F.; Namutebi, E.; Nsubuga-Ssenfuma, M. Water Resources of Uganda: An Assessment and Review. J. Water Resour. Prot. 2014, 6, 1297. [Google Scholar] [CrossRef]
- DWRM (Directorate of Water Resources Management). Consolidated Hydrological Year Book for Uganda—1978–2014; Ministry of Water & Environment: Kampala, Uganda, 2017; p. 104. [Google Scholar]
- Strahler, A.N. Quantitative analysis of watershed geomorphology. Eos Trans. Am. Geophys. Union 1957, 38, 913–920. [Google Scholar] [CrossRef]
- Musy, A.; Hingray, B.; Picouet, C.; Hydrology, A. Science for Engineers; CRC Press: Boca Raton, FL, USA, 2015; p. 592. [Google Scholar]
- River Discharge Data. Available online: https://www.bafg.de/GRDC/EN/02_srvcs/21_tmsrs/riverdischarge_node.html (accessed on 2 January 2003).
- SIEREM (Système d’Informations Environnementales sur les Ressources en Eau et Leur Modélisation). Available online: http://www.hydrosciences.fr/sierem (accessed on 3 January 2023).
- WMO (World Meteorological Organization). Guide to Hydrological Practices, Volume I: Hydrology—From Measurement to Hydrological Information; WMO: Geneva, Switzerland, 2020. [Google Scholar]
- Bahati, H.K.; Ogenrwoth, A.; Sempewo, J.I. Quantifying the potential impacts of land-use and climate change on hydropower reliability of Muzizi hydropower plant, Uganda. J. Water Clim. Change 2021, 12, 2526–2554. [Google Scholar] [CrossRef]
- Japan International Cooperation Agency. The Development Study on Water Resources Development and Management for Lake Kyoga Basin in the Republic of Uganda: Final report: Supporting Report; Japan International Cooperation Agency: Tokyo, Japan, 2011. [Google Scholar]
- BRL Ingenerie. Study on Current and Future Potential Water Resources, under Different Climate Scenarios, for the Mpanga River Basin (Uganda). 2015. Available online: https://www.mwe.go.ug/sites/default/files/library/2015_Current%20and%20Future%20Potential%20Water%20Resources%2C%20Under%20Different%20Climate%20Scenarios%2C%20for%20Mpanga%20River%20Basin.pdf (accessed on 2 May 2023).
- ECREEE (ECOWAS Centre for Renewable Energy and Energy Efficiency) and Pöyry Energy GmbH. Hydropower Resource Mapping and Climate Change Scenarios for the ECOWAS Region—Technical Report on Methodology and Lessons Learnt for ECOWAS Countries. 2017, p. 108. Available online: http://www.ecowrex.org/system/files/final_technical_report_on_methodology_and_lessons_learnt_for_ecowas_countries.pdf (accessed on 2 May 2023).
- E-Learning Project SOGA: Statistics and Geospatial Data Analysis. Department of Earth Sciences. Freie Universitaet Berlin. Available online: https://www.geo.fu-berlin.de/en/v/soga/Geodata-analysis/geostatistics/index.html (accessed on 3 January 2023).
- Inverse Distance Weighting (IDW) Interpolation. Available online: https://gisgeography.com/inverse-distance-weighting-idw-interpolation/ (accessed on 3 January 2023).
- Shekhar, S.; Xiong, H. Inverse Distance Weighting. In Encyclopedia of GIS; Shekhar, S., Xiong, H., Eds.; Springer: Boston, MA, USA, 2008; p. 600. [Google Scholar]
- Ly, S.; Charles, C.; Degre, A. Different methods for spatial interpolation of rainfall data for operational hydrology and hydrological modeling at watershed scale. A review. Biotechnol. Agron. Soc. Environ. 2013, 17, 392–406. [Google Scholar]
- Yamazaki, D.; Ikeshima, D.; Sosa, J.; Bates, P.D.; Allen, G.H.; Pavelsky, T.M. MERIT Hydro: A High-Resolution Global Hydrography Map Based on Latest Topography Dataset. Water Resour. Res. 2019, 55, 5053–5073. [Google Scholar] [CrossRef]
- Tarboton, D.G.; Bras, R.L.; Rodriguez-Iturbe, I. On the extraction of channel networks from digital elevation data. Hydrol. Process. 1991, 5, 81–100. [Google Scholar] [CrossRef]
- Jablonskis, J.; Jarockis, A.; Punys, P. Pirminiai Lietuvos upių hidroenergijos ištekliai (Hydropower potential of Lithuanian watercourses). Vandens Ūkio Inžinerija. Moksl. Darb. (Water Eng. Trans.) 2004, 25, 88–98. [Google Scholar]
- USACE (U.S. Army Corps of Engineers). National Hydroelectric Power Resources Study; USACE (U.S. Army Corps of Engineers): Washington, DC, USA, 1983; p. IWR-82-H-1. Available online: https://usace.contentdm.oclc.org/digital/api/collection/p16021coll2/id/606/download (accessed on 2 May 2023).
- Kao, S.; McManamay, R.A.; Stewart, K.M.; Samu, N.M.; Hadjerioua, B.; DeNeale, S.T.; Yeasmin, D. New Stream-Reach Development: A Comprehensive Assessment of Hydropower Energy Potential in the United States; U.S. Department of Energy: Washington, DC, USA, 2014; pp. 1–197. [Google Scholar] [CrossRef]
- The World Database on Protected Areas (WDPA). Available online: https://datasets.wri.org/dataset/64b69c0fb0834351bd6c0ceb3744c5ad (accessed on 3 January 2023).
- Landy, M. A Methodology to Quantify the Environmentally Compatible Potentials of Selected Renewable Energy Technologies. 2008. Available online: https://plonesaas.devel4cph.eea.europa.eu/Eionet/etcs/etc-cme/products/etc-cme-reports/etcacc_tp_2008_16_pots_ren_energy_techn-1/@@download/file/ETCACC_TP_2008_16_pots_re_energy_techn.pdf (accessed on 2 May 2023).
- Punys, P.; Kasiulis, E.; Kvaraciejus, A.; Dumbrauskas, A.; Vyčienė, G.; Šilinis, L. Impacts of the EU and national environmental legislation on tapping hydropower resources in Lithuania—A lowland country. Renew. Sustain. Energy Rev. 2017, 80, 495–504. [Google Scholar] [CrossRef]
- SRTM (Shuttle Radar Topography Mission). Available online: https://www2.jpl.nasa.gov/srtm/missionoverview.html#:~:text=The%20Shuttle%20Radar%20Topography%20Mission,topographic%20database%20of%20the%20Earth (accessed on 3 January 2023).
- Uuemaa, E.; Ahi, S.; Montibeller, B.; Muru, M.; Kmoch, A. Vertical Accuracy of Freely Available Global Digital Elevation Models (ASTER, AW3D30, MERIT, TanDEM-X, SRTM, and NASADEM). Remote Sens. 2020, 12, 3482. [Google Scholar] [CrossRef]
- Rodríguez, E.; Morris, C.S.; Belz, J.E. A Global Assessment of the SRTM Performance. Photogramm. Eng. Remote Sens. 2006, 72, 249–260. [Google Scholar] [CrossRef]
- MERIT DEM. Available online: https://www.usna.edu/Users/oceano/pguth/md_help/html/merit_dem.htm (accessed on 3 January 2023).
- Kennedy and Donkin Power Limited, Sir Alexander Gibb and Partners & Melvin Consulting Engineers. Hydrology and Hydropower Potential of Non-Nile Rivers. In Uganda Hydropower Master Plan; Final Report; 1997.
- Pandey, A.; Lalrempuia, D.; Jain, S.K. Assessment of hydropower potential using spatial technology and SWAT modelling in the Mat River, southern Mizoram, India. Hydrol. Sci. J. 2015, 60, 1651–1665. [Google Scholar] [CrossRef]
- Kouadio, C.A.; Kouassi, K.L.; Diedhiou, A.; Obahoundje, S.; Amoussou, E.; Kamagate, B.; Paturel, J.; Coulibaly, T.J.H.; Coulibaly, H.S.J.P.; Didi, R.S.; et al. Assessing the Hydropower Potential Using Hydrological Models and Geospatial Tools in the White Bandama Watershed (Côte d’Ivoire, West Africa). Front. Water 2022, 4, 844934. [Google Scholar] [CrossRef]


| References | Technical Potential | |
|---|---|---|
| GWh | MW | |
| World Atlas of Hydropower & Dams [26] | 20,833 1 | 6950 2 |
| E. Jjunju [3], Å. Killingtveit [27] | 103,000–114,000 | 22,190–24,622 |
| JICA [28] | 2000 3 | |
| NPA [29], NRFC [30], V. Katutsi et al. [5] | 4137–4500 | |
| References | Potential, MW | Installed Capacity, MW | |
|---|---|---|---|
| MW | GWh | ||
| World Small Hydropower Development Report (WSHDR) [32] | 200 1 | 52 | |
| World Atlas of Hydropower & Dams [26] | >400 | 110 | |
| A. Korkovelos et al. [11] | 49.8 2 | ||
| Source, Reference | Number of Gauging Stations (G.S.) | Description |
|---|---|---|
| Directorate of Water Resources Management (DWRM) | 69 | The record period covers from 1947 to 2020. with flow data length between 5 and 73 y. and an average of 46 y. Most G.S. (51) flow data series comprised 35 to 45 y. |
| Global Runoff Data Centre (GRDC) [37] | 12 | The record period covers from 1946 to 1982. with flow data lengths between 3 and 25 y. |
| SIEREM [38] | 63 | A list of G.S. with coordinates is presented but only six G.S. with flow data. The record period covers from 1976 to 1979. |
| DWRM [34] | 71 | A general description of G.S. operating (71) or closed (55) in major river basins. The record period covers from 1978 to 2014. Neither G.S. catchment areas nor coordinates are given for a number of G.S. Monthly flow statistics are summarised. |
| Statistics | Stream Name | |||||||
|---|---|---|---|---|---|---|---|---|
| Sipi | Simu | Ririrma | Sironko | |||||
| HYPOSO | GIS | HYPOSO | GIS | HYPOSO | GIS | HYPOSO | GIS | |
| Sample size | 110 | 110 | 168 | 168 | 54 | 54 | 141 | 141 |
| RMSE, m | 40.46 | 67.36 | 23.73 | 40.74 | 27.69 | 32.39 | 23.49 | 24.73 |
| Standard deviation of errors, m | 30.43 | 46.41 | 23.76 | 29.16 | 24.07 | 28.08 | 23.58 | 24.82 |
| Determination coefficient | 0.998 | 0.991 | 0.998 | 0.996 | 0.989 | 0.958 | 0.992 | 0.992 |
| Small Sub-Basins Area, km2 | |||
|---|---|---|---|
| Mean | 43.2 | Sample variance | 1176.9 |
| Standard error | 0.5 | Minimum | 0.1 |
| Median | 36.1 | Maximum | 332.5 |
| Standard deviation | 34.3 | Sample size | 4664 |
| Mean Annual River Flow, m3/s | Sample Size | Mean | Standard Deviation | Standard Error | Median | Sample Variance | Min | Max |
|---|---|---|---|---|---|---|---|---|
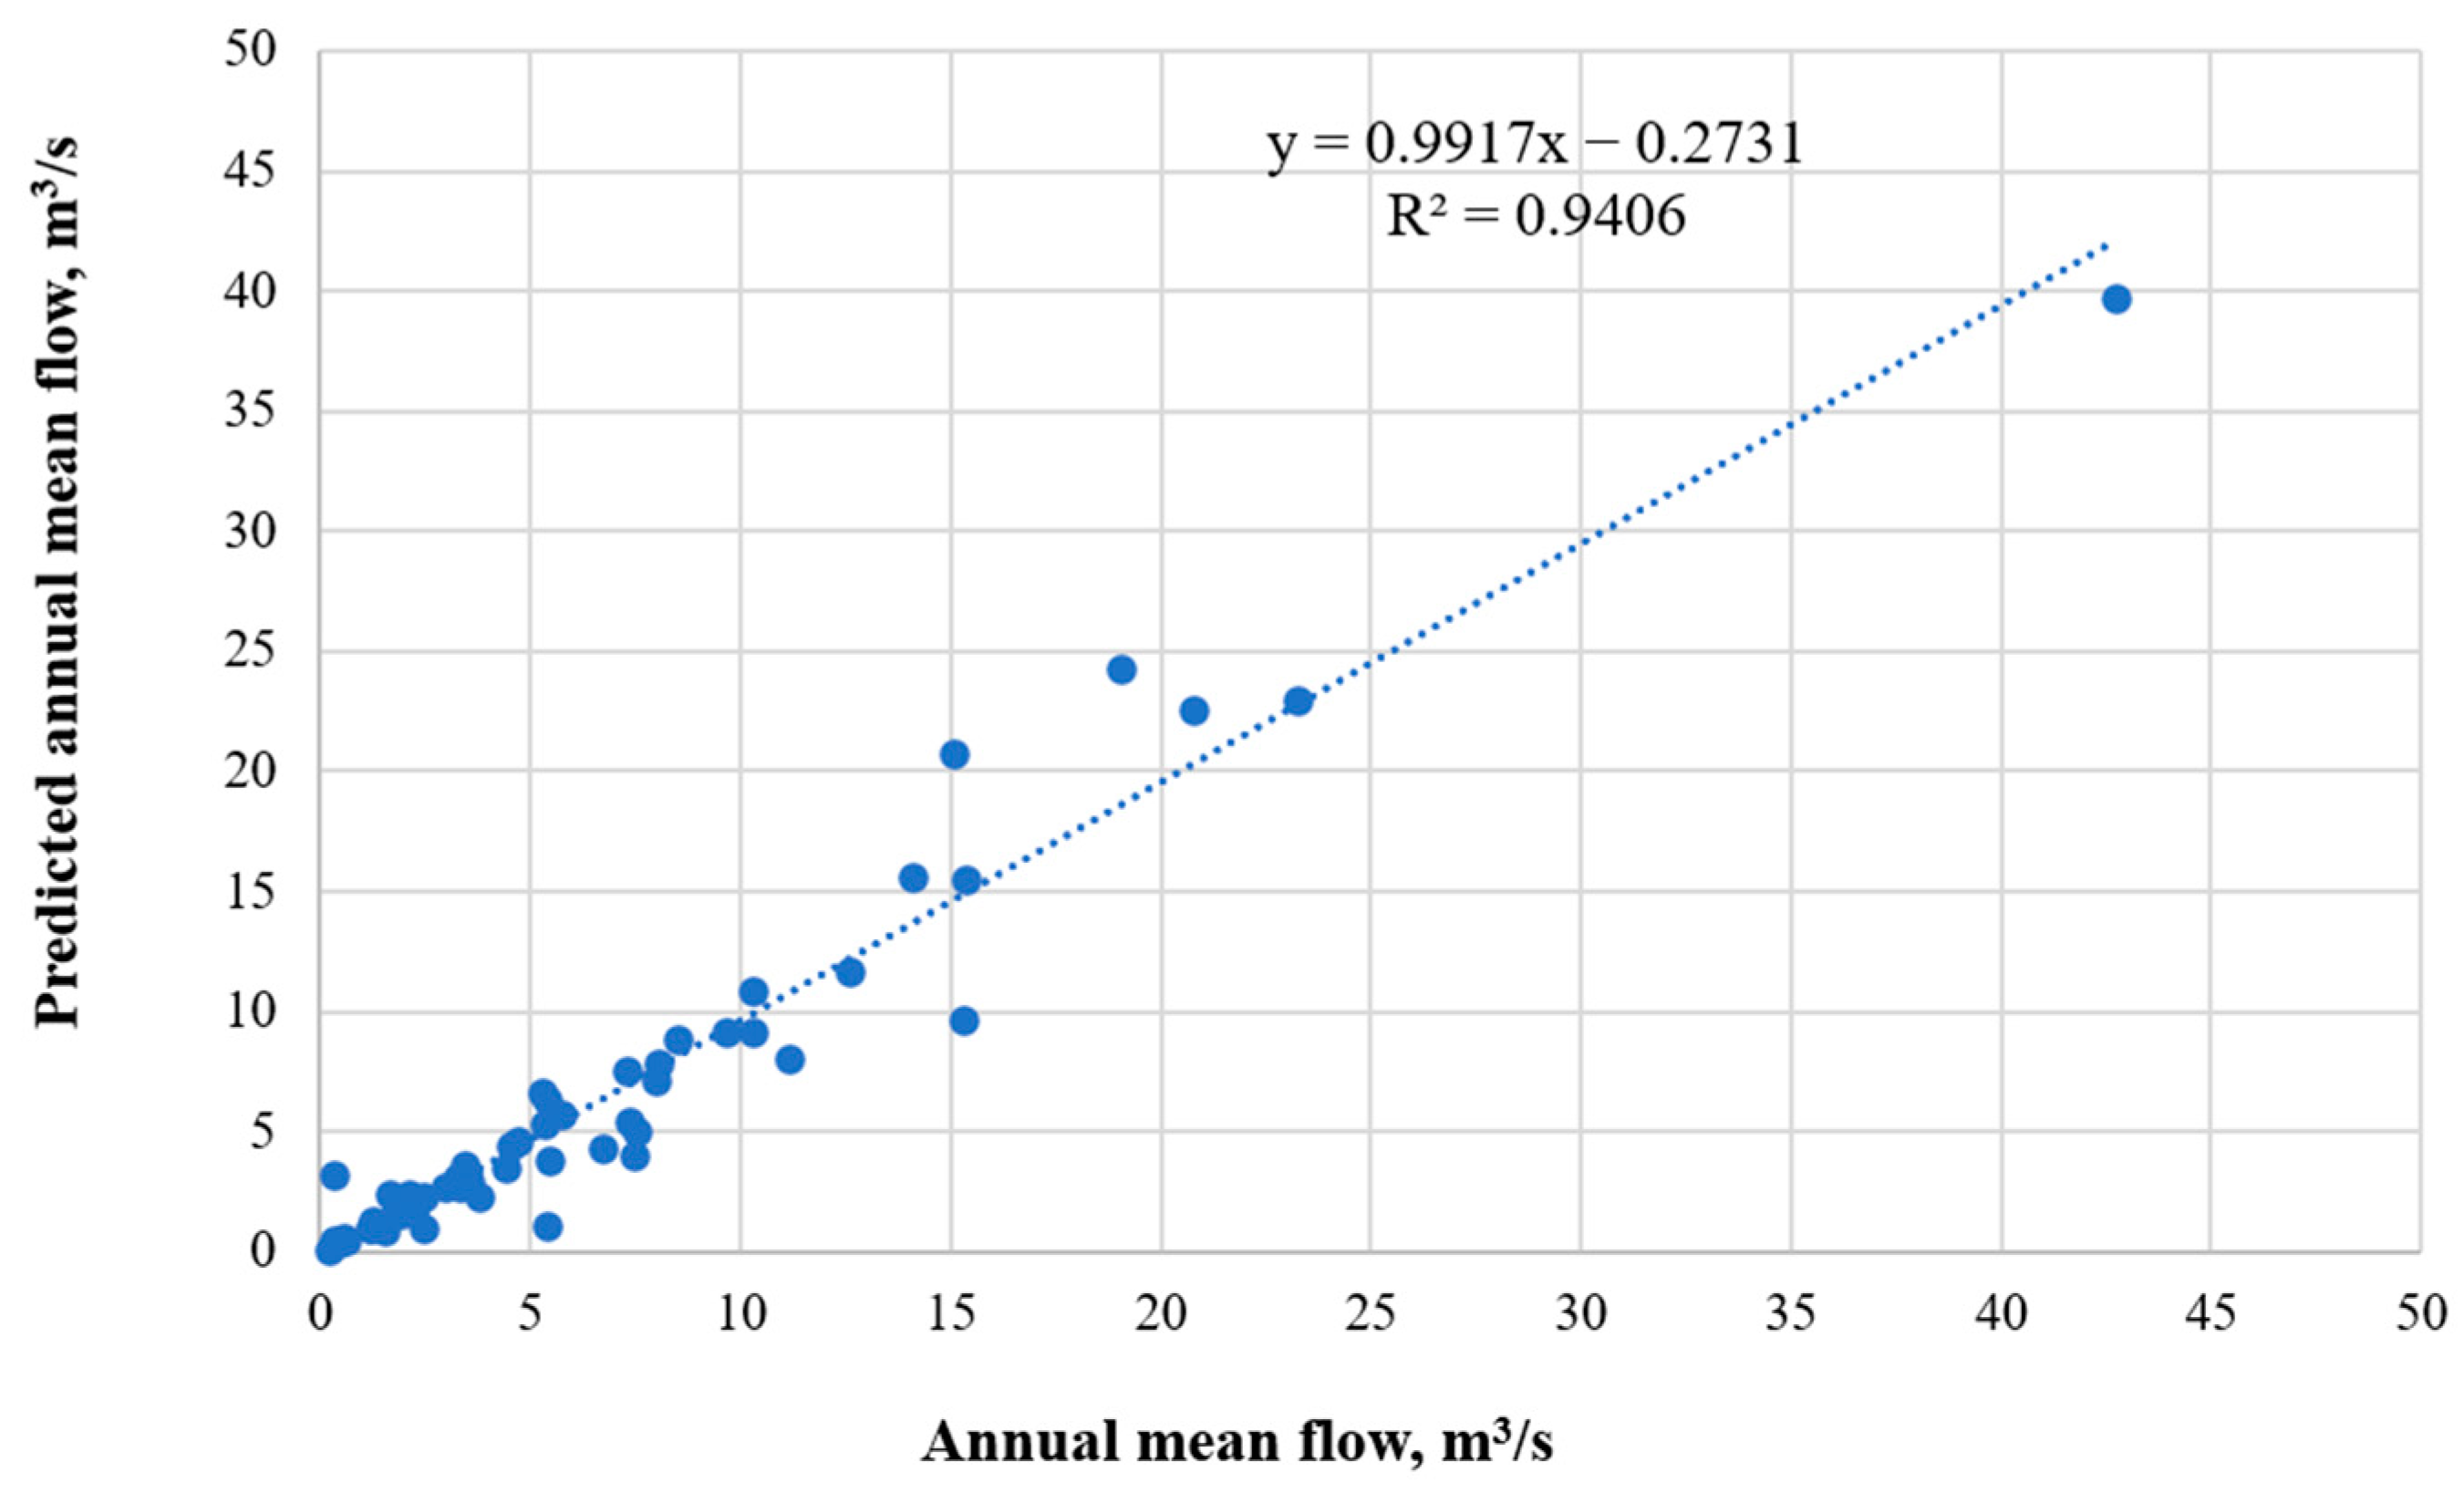
| Gauging stations | 55 | 6.81 | 7.35 | 0.99 | 4.71 | 54.04 | 0.20 | 42.70 |
| Predicted 1 | 55 | 6.48 | 7.51 | 1.01 | 3.79 | 56.50 | 0.12 | 39.70 |
| Stream Order | Number of Streams and Rivers | Total Power Capacity, MW | Percentage | Average Power Capacity Per Stream or River, MW |
|---|---|---|---|---|
| 1 | 2373 | 614.6 | 8.8 | 0.3 |
| 2 | 516 | 608.4 | 8.7 | 1.2 |
| 3 | 117 | 341.7 | 4.9 | 2.9 |
| 4 | 29 | 275.7 | 3.9 | 9.5 |
| 5 | 7 | 86.7 | 1.2 | 12.4 |
| 6 | 5 | 226.9 | 3.2 | 45.4 |
| 7 | 2 1 | 4831.4 | 69.2 | 1610.5 |
| Total: | 3050 | 6985.4 | 100.0 | 2.3 |
| No | Metric | All Rivers and Streams, Including the Nile (a) | The Nile (b) | Small and Medium-Sized Rivers(the Nile is Excluded) | |||
|---|---|---|---|---|---|---|---|
| Including Protected Areas (c) | Protected Areas Excluded (d) | Including Protected Areas | |||||
| p < 20 MW (e) | p < 10 MW (f) | ||||||
| 1 | Mean | 4.81 | 185.82 | 1.48 | 1.04 | 1.11 | 0.86 |
| 2 | Standard Error | 1 | 42.59 | 0.11 | 0.09 | 0.06 | 0.04 |
| 3 | Median | 0.36 | 78.98 | 0.35 | 0.30 | 0.34 | 0.33 |
| 4 | Standard Deviation | 37.95 | 217.16 | 4.20 | 2.72 | 2.31 | 1.42 |
| 5 | Variance | 1440 | 47,160 | 17.61 | 7.41 | 5.34 | 2.01 |
| 6 | Range | 673.52 | 664.53 | 58.19 | 41.77 | 19.51 | 9.71 |
| 7 | Minimum | 0.1 | 9.09 | 0.1 | 0.1 | 0.1 | 0.1 |
| 8 | Maximum | 673.62 | 673.62 | 58.29 | 41.87 | 19.61 | 9.81 |
| 9 | Sum | 6917 | 4831 | 2086 | 1033 | 1549 | 1181 |
| 10 | Sample size | 1439 | 26 | 1413 | 992 | 1396 | 1370 |
| Capacity MW | |||||||
|---|---|---|---|---|---|---|---|
| Mean | 2.51 | Mode | 1.37 | Range | 19.75 | Sum | 1217.5 |
| Standard Error | 0.14 | Standard Deviation | 3.19 | Min | 0.18 | Sample size | 485 |
| Median | 1.2 | Sample Variance | 10.15 | Max | 19.94 | ||
Disclaimer/Publisher’s Note: The statements, opinions and data contained in all publications are solely those of the individual author(s) and contributor(s) and not of MDPI and/or the editor(s). MDPI and/or the editor(s) disclaim responsibility for any injury to people or property resulting from any ideas, methods, instructions or products referred to in the content. |
© 2023 by the authors. Licensee MDPI, Basel, Switzerland. This article is an open access article distributed under the terms and conditions of the Creative Commons Attribution (CC BY) license (https://creativecommons.org/licenses/by/4.0/).
Share and Cite
Punys, P.; Vyčienė, G.; Jurevičius, L.; Kvaraciejus, A. Small Hydropower Assessment of Uganda Based on Multisource Geospatial Data. Water 2023, 15, 2051. https://doi.org/10.3390/w15112051
Punys P, Vyčienė G, Jurevičius L, Kvaraciejus A. Small Hydropower Assessment of Uganda Based on Multisource Geospatial Data. Water. 2023; 15(11):2051. https://doi.org/10.3390/w15112051
Chicago/Turabian StylePunys, Petras, Gitana Vyčienė, Linas Jurevičius, and Algis Kvaraciejus. 2023. "Small Hydropower Assessment of Uganda Based on Multisource Geospatial Data" Water 15, no. 11: 2051. https://doi.org/10.3390/w15112051