Article

Research on Drainage Rights Allocation Based on Game Combination Weight-Improved Matter-Element Extension Model

1
College of Agricultural Engineering, Hohai University, Nanjing 210098, China
2
Business School, Hohai University, Nanjing 211100, China
*
Author to whom correspondence should be addressed.
Water 2023, 15(11), 2044; https://doi.org/10.3390/w15112044
Submission received: 3 May 2023 / Revised: 24 May 2023 / Accepted: 25 May 2023 / Published: 27 May 2023
(This article belongs to the Section Water Resources Management, Policy and Governance)

Abstract

:
The frequent occurrence of floods poses a serious threat to various aspects such as socio-economic development, ecological stability, and safety of people’s lives and properties. In order to reduce flood losses and improve the overall regional flood control efficiency, the DPSIR model is used to construct an index system affecting the allocation of drainage rights considering the characteristics and allocation principles of drainage rights. The objective and subjective weights determined by the hierarchical analysis and entropy method are optimally combined according to the game theory idea, and finally, the drainage rights allocation model of the game combination weight-improved matter-element extension model is constructed. In addition, this paper conducts a case study with data from 2017–2021 in the south Jiangsu canal region, and the results show that the drainage rights allocation is influenced by social, economic, and ecological aspects, among which the most influential are ecological and economic aspects; the drainage rights quota size from 2017–2021 is in the order of Wuxi, Suzhou, Changzhou, and Zhenjiang.

1. Introduction

Frequent human activities lead to excessive greenhouse gas emissions and global warming problems. Global warming causes an increase in the global average temperature, which increases the water vapor content in the air, further increasing the average annual precipitation and the likelihood of heavy precipitation, and greatly increasing the likelihood of flooding [1]. This will greatly increase the possibility of flooding. In terms of geographical distribution, Asia is the region most severely affected by floods [2]. In 2021, China had 42 heavy rainfall processes with an average precipitation of 659 mm, causing a total of 59.01 million people affected by floods, 590 deaths and disappearances, 152,000 collapsed houses, and direct economic losses of 245.89 billion yuan.
As can be seen, the frequent occurrence of floods has brought incalculable losses and serious impacts on social stability, economic development, and ecological stability. The report to the 20th National Congress of the Communist Party of China (CPC) pointed out: “We should improve the capacity of disaster prevention, disaster reduction, disaster relief and major public emergencies, strengthen the construction of national and regional emergency response forces, and improve the level of public safety management”. Therefore, Since the founding of the People’s Republic of China, the state and local departments have taken relevant measures to reduce the serious impact of floods.
At present, the measures taken are mainly divided into two categories: engineering measures and non-engineering measures. In terms of engineering measures, the concerned state and local departments have invested a large amount of money to establish flood control projects, such as embankments, reservoirs, and flood storage areas to improve flood prevention and mitigation capabilities. Flood control projects are under the territorial jurisdiction system and are managed by the relevant departments of each local government. However, when the sudden heavy rainfall makes the flood volume in the river exceed the capacity of the river, the cities upstream and downstream on the left and right banks of the river aim at maximizing their own interests and compete to drain the river in a disorderly manner, resulting in the water level of the river soaring. Thus, the cities in the middle and lower reaches will not be able to drain the river, causing a serious conflict of interests. At this time, the existence of engineering measures can no longer meet the requirements of flood prevention and mitigation. In addition, there is an urgent need for other ways to reduce the impact of flooding. In terms of non-engineering measures, measures, such as flood forecasting, flood scheduling, and construction of flood storage areas, have also achieved corresponding results for flood mitigation. For example, Li Zhen et al. established a comprehensive control platform for intelligent water services in the Zhupi River basin to predict and warn against floods and provide sufficient support for timely scheduling [3]. The prediction of floods in the Zhupi River basin is supported by the non-linear regression model [4] and CNN models [5] to predict floods; Chen Hui et al. [6] applied joint scheduling techniques to solve the scheduling problems in floods. In addition, according to the historical experience of flood prediction and flood scheduling, certain engineering measures will be established to minimize the disaster loss. To a certain extent, the combination and unification of engineering and non-engineering measures are realized. With the development of society in many aspects, the ideas of “co-existence with flood” and “adhering to the harmony between human and nature” have been deeply rooted in people’s minds. The concept of drainage rights has been proposed to provide a new approach to flood management, and solving the problem of drainage rights allocation is the basis of drainage rights trading. Based on this, this paper focuses on the initial allocation of drainage rights and proposes reference suggestions for future drainage rights-related research.

2. Literature Review

At present, domestic and foreign research on drainage rights is in its initial stage, and no complete research system has been formed. Cunfeng Yu [7] proposed the basic concept of drainage rights and the principles of drainage rights allocation considering the problems of drainage conflict and food security brought by heavy rainfall and flooding events. After that, Jinsong Zhang [8] explored the feasibility and necessity of drainage rights allocation and trading considering the frequent occurrence of floods in Jiangsu Province. The feasibility is reflected in the fact that drainage rights have a good legal basis, policy orientation, scheduling scheme, etc., and the necessity is reflected in the fact that the reasonable allocation and trading of drainage rights are beneficial to achieve intra-regional drainage coordination and maximize the benefits of regional flood control. Therefore, drainage rights are defined as the rights given to regional subjects to discharge flood water under heavy rainfall in order to reduce flood losses and maximize the overall regional flood control benefits.
In the study of drainage rights allocation, Xiuping Lai [9] obtained the factors affecting the allocation of drainage rights with the help of the physics–matter–human theory method, such as precipitation factor, subsurface factor, flood control and drainage capacity, etc. In addition, the theories of water rights, sewage rights, carbon emission rights, flood control, and ecological compensation have been used to determine the five characteristics of drainage rights: compulsory, exclusion, tradability, variability, and urgency. Juqin Shen et al. [10,11,12] constructed a model of drainage rights allocation using the ideas of game theory and synergy theory, environmental optimization-projection tracing technique, and Gini coefficient optimization entropy-TOPSIS method to determine the order of drainage rights allocation; Fang Wu [13] constructs a drainage rights allocation model based on the environmental Gini coefficient method that takes into account the interests of all parties; Dandan Zhang, Xiaoyan Zhang, Kaize Zhang, Fuhua Sun [14,15,16,17], etc. use a multi-objective optimization model, fuzzy optimal and inferior-TOPSIS method, harmony diagnosis, and PSR model to further expand the drainage rights allocation method and improve the drainage rights allocation system. At present, there are abundant research results on scarcity resources such as sewage rights and water rights [18], which have strong reference value for the study of drainage rights allocation. In summary, the initial allocation of drainage rights is at a preliminary stage. No complete system has been formed. The results of relevant studies are still relatively few and need to be supplemented.
DPSIR (Driving force-Pressure-State-Impact-Response) model [19] is a new model proposed by the European Environment Agency (EEA) on the basis of a PSR (Pressure-State-Response) model. This model system provides more flexibility to evaluate the relationship between human activities and the environment, including natural, economic, social, and other factors. The DPSIR model consists of five components: Driving, Pressure, State, Impact, and Response. The improvement of the model makes it clearer to research the relationship between human activities and the environment. In this model, the relationship between the components is as follows: first, the driving force drives pressure. Then, pressure forces certain states to change in a particular environment. Next, the change of state has favorable or adverse effects on a particular environment. Finally, these effects drive humans to make direct or indirect responses to solve the problems that arise. In recent years, the DPSIR model has not only been applied to the study of the interaction between human systems and ecosystems, but also has been used for research in other non-environmental fields, such as rural e-commerce, regional tourism, public transportation [20,21,22]. Therefore, the DPSIR framework model has good applicability in the construction of indicator systems for climate change and natural disaster risks.
The matter-element extension theory was proposed by domestic scholars [23]. This method consists of two parts: matter-element theory and mathematical tools. It uses extension sets and correlation functions to identify fuzzy things, which can solve decision-making problems of complex systems and combine qualitative and quantitative analysis. At present, it has been applied to infrastructure, public utilities, and other aspects, but the application research in the field of drainage rights is still few. In addition, most of the previous applications of matter-element extension theory used a single method to determine the weight of the indicators: subjective weight and objective weight. The determination of subjective weight has strong subjectivity, which is affected by the judgment of different subjects, and it even requires experts to score. The objective weight depends more on the characteristics of the data itself and is analyzed by a mathematical model. In order to make up for the advantages and disadvantages of these two methods in determining weight, the idea of game theory is introduced to minimize the deviation of weight determined by different methods and realize the rationality of weight determination, which is the method of weighting with a game combination weight mentioned in this paper.
In summary, this paper considers the characteristics of drainage rights and their allocations, which involve natural, economic, and social aspects, to be a complex aggregate. Therefore, the game combination weight-improved matter-element extension model is used to evaluate the allocation of drainage rights in this paper. This paper has three contributions as follows:
(1)
Improves the index system affecting the allocation of drainage rights. The DPSIR model is used to further improve the factors affecting the initial allocation of drainage rights, and this paper emphasizes the process of influencing the allocation of drainage rights compared with previous studies, presenting a “driving force-pressure-state-influence-response” logical relationship;
(2)
Provides a reasonable determination of drainage rights index weights. In this paper, we use subjective and objective methods to determine the weights of the indicators affecting the allocation of drainage rights, which makes the indicator weighting results more reasonable;
(3)
Extends the application of an improved matter-element extension model in the field of drainage rights. This paper takes a different approach from other scholars to evaluate the allocation of drainage rights and further expands the research results of the evaluation method of drainage rights allocation.

3. Materials and Methods
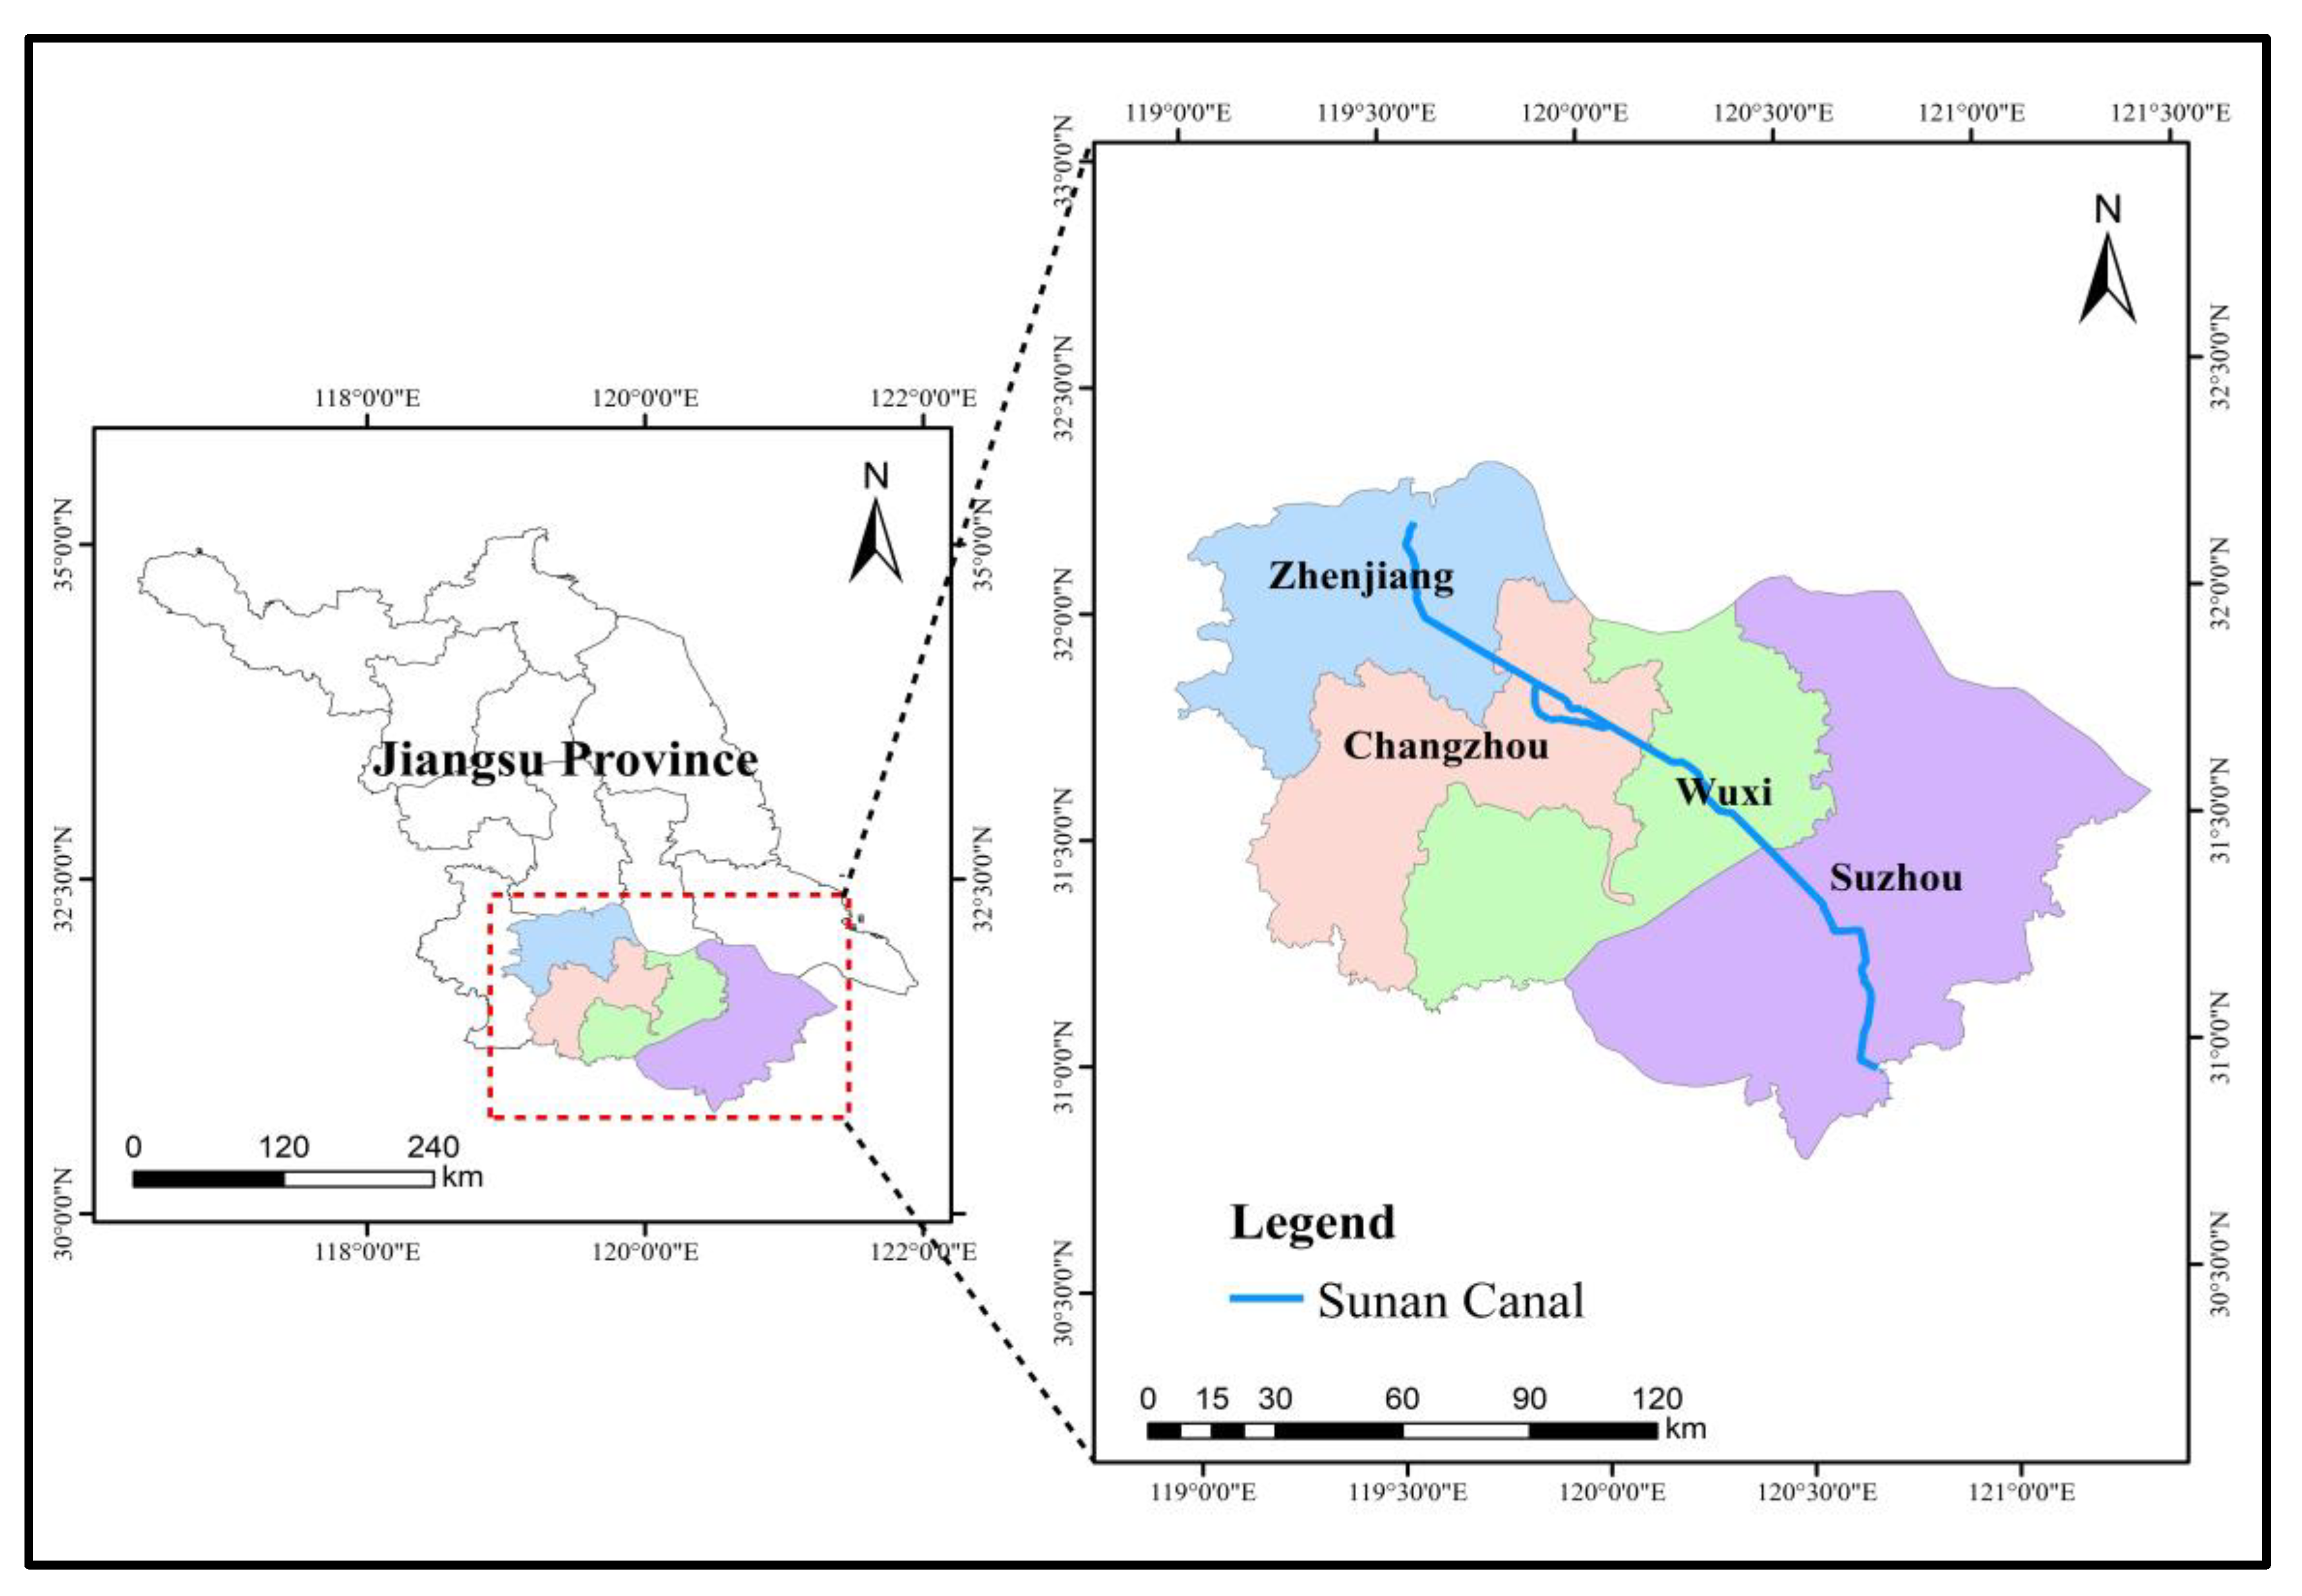
3.1. Study Area

Sunan Canal, located in Jiangsu Province, is an important part of the Beijing-Hangzhou Grand Canal, the main national water transport channel. It is located in the Taihu Lake water network plain in the lower reaches of the Yangtze River, running through Suzhou, Wuxi, Changzhou, and Zhenjiang. It starts from Jianbikou gate of the Yangtze River in Zhenjiang in the north and ends at Yaoba, which borders Jiangsu and Zhejiang in the south, with a total length of about 212 km. The study area is shown in Figure 1 below.

3.2. Methods

3.2.1. Principles of Drainage Rights Distribution

The construction of the drainage rights index system based on the DPSIR model framework should comprehensively consider that drainage rights have the characteristics of exclusivity, tradability, variability, and urgency while considering that the drainage rights allocation should satisfy the principles of fairness, effectiveness, and acceptability. First, the principle of fairness is for heavy rainfall conditions when the river flooding capacity exceeds the river’s capacity. The main bodies of the basin will compete for the drainage, causing incalculable losses. Therefore, it is necessary to adhere to the leading role of government departments and make full use of the “invisible hand” to ensure the reasonable allocation of drainage rights to achieve a balanced overall interest of the river basin and promote social equity. Second, the principle of effectiveness is to allocate the drainage rights reasonably and through government. This is to solve the drainage conflicts and water disputes, to avoid the loss of downstream inundation and flooding, and to maximize the benefits of flood control in the basin. Finally, the principle of acceptability is based on objective reality in setting indicators in the model, which is determined by reviewing the literature, consulting experts, etc., making the model indicator system more reasonable. In the DPSIR model, the driving forces are the potential factors causing environmental changes, including socio-economic development and ecological civilization aspects. In terms of ecological civilization, two indicators are selected. Green coverage rate is the ratio of regional green area to administrative area. The larger the green coverage rate, the stronger the region’s ability to hold water. Water surface rate is the ratio of regional water area to administrative area. The larger the water surface rate, the stronger the region’s storage capacity. In terms of socio-economic development, GDP per capita, disposable income per capita, urbanization rate, and employment rate are chosen to measure. GDP per capita is the ratio of regional GDP to total population. The larger the ratio, the greater the economic value created by the region. Disposable income per capita reflects the living standard and economic condition of residents. The larger the value, the greater the economic creativity. Urbanization rate is the ratio of urban population to total population. The value reflects the level of urbanization of the region. The greater the level of urbanization, the greater the need for protection. Employment rate is the ratio of the number of employed people to the number of resident population, which reflects the socio-economic benefits and the development potential of the region, and it is conducive to the recovery of the region.
The driving forces can lead to changes in pressure, especially in hydrology, which can cause extreme precipitation, mudslides, and other phenomena. In this paper, annual precipitation, maximum seven-day storm return period, and water level were indicators selected for measurement. The annual precipitation reflected the intensity of the drainage point needed in the region. The maximum seven-day storm recurrence period reflected the strength of the storm. The larger the value, the greater the disaster risk. The water level reflected the urgency of drainage; the region needed timely flooding to reduce the risk of disaster.
The state was the change under pressure. It meant the measures taken to cope with flooding, including both improving the level of flood control and early warning capacity. Flood control capacity was measured by the length of embankment and the density of drainage pipes. The longer the length of embankment and the more dense the drainage pipes, the stronger the flood control capacity. Meanwhile, considering the existence of monitoring and early warning measures, the number of regional hydrological stations was used to reflect the regional flood control and early warning level.
Impacts were the result of the combined effect of drivers, pressures, and states, especially in terms of social and economic development. Considering the impact of floods over the years and the principle of life first, the affected population, crop damage area, and direct economic loss were chosen to respond to the impact caused by floods, all of which were negative impacts.
The response was based on the negative impact of the driving force, pressure, and state system, and the response measures taken by the relevant departments were reflected in improving the level of flood prevention capacity, strengthening flood prevention awareness, and maintaining ecological stability. In terms of maintaining ecology, the wastewater treatment rate was selected for measurement, and the larger the index was, the greater it was for ecological stability and reducing the risk of flooding. In terms of improving flood prevention awareness, the continuous increase in the number of highly educated population was conducive to improving the resistance to flooding. In terms of improving the level of flood prevention capacity, each regional department should increase investment in drainage facilities and improve disaster command response to reduce flood. In terms of improving the level of flood prevention capacity, regional departments should increase investment in drainage facilities and improve disaster command and response to reduce flood losses and maximize overall regional benefits.

3.2.2. Indicator System Construction

According to the five criterion layers established in the DPSIR model, the drainage rights allocation should satisfy the principles of fairness, effectiveness, and acceptability to establish the drainage rights allocation index system as shown in Table 1. The process of indicator selection also considered the clarity of indicator definition, data availability, and reliability to facilitate the realization of a comprehensive evaluation of regional drainage rights allocation.

3.2.3. Model Construction

Game Combination Weights Determination

(1)
Hierarchical analysis to determine the subjective weights
Hierarchical analysis (AHP) is a decision-making method for solving multi-level, multi-criteria problems proposed by American operations researcher Thomas L Saaty in the 1970s [24]. The method is widely applicable. The method has wide applicability and can be used to solve a variety of complex problems. It treats a single objective problem as a system and splits it into multiple levels for analysis, simplifying complex problems and making them easy to analyze.
The basic steps of the hierarchical analysis are as follows:
(1) Define goals and establish hierarchical results
The initial allocation of drainage weight was stratified, which was successively divided into target layer, criterion layer, and index layer. Combined with the characteristics of the study area, the index system affecting drainage weight allocation was established from five dimensions according to the research framework of DPSIR model.
(2) Constructing the judgment matrix
The impact factors at the same level were compared with each other, and the judgment matrix of the same level was constructed according to the scale values of 1–9 proposed by Saaty. Several experts were invited to rate the scale values, and the final determination was made after repeated adjustments. The judgment matrix A is shown below:
A = α 11 α 12 α 1 n α 21 α 22 α 2 n α n 1 α n 2 α n n = A α i j
(3) Calculate the relative weights
The relative weights of the comparison factors were calculated based on the results of the judgment matrix. The formula calculated based on the eigenvectors is shown below:
A W = λ max W
In the formula, λ max was the maximum characteristic root of the judgment matrix. W was the weight vector. The weight vector W could be normalized to find the corresponding weights of each index.
(4) Preform a consistency test
To avoid logical errors in judging the importance of impact factors, for example, A 1 was more important than A 2 and A 2 was more important than A 3 , but there was a contradiction that A 3 was more important than A 1 , it was necessary to perform a consistency test based on the matrix results, which is calculated as shown below:
I C = λ max n n 1
R C = I C / I R
In the formula where λ max was the maximum characteristic root of the judgment matrix, n was the order of the judgment matrix, and I R was the random consistency index. R C < 0.1 indicated that the consistency of the judgment matrix was good and met the requirements; otherwise, further adjustment was made.
(2)
Entropy weighting method to determine objective weights
The entropy method is an objective assignment method that calculates the entropy weight corresponding to each index by information entropy according to the dispersion degree of data indicators. Greater information entropy indicated that the degree of data variation was smaller and played a smaller role in the evaluation. Smaller information entropy indicated that the degree of data variation was larger and played a larger role in the evaluation.
The basic steps of the entropy method are as follows:
(1) Data standardization
When using the entropy weighting method to calculate the indicator weights, the data should be standardized first. Suppose there are k indicators, and the vector of j indicators is established as X j = X 1 j , X 2 j , X n j T , then the normalization formulae for positive and negative indicators are as follows:
Positive indicators:
Y i j = X i j X j max X j min X j
Negative indicators:
Y i j = max X j X i j max X j min X j
(2) Calculate the characteristic weight
To avoid the influence of the traditional entropy weighting method, the standardized results were non-zeroed, thus making the data more consistent with the actual situation. The formula for calculating the characteristic weight is shown below:
F i j = Y i j + 0.0001 i = 1 n Y i j + 0.0001
(3) Calculate information entropy
H j = ln n 1 i = 1 n F i j ln F i j
(4) Calculate the entropy weights
The results of information entropy were brought in to find the entropy weights of each indicator:
W j = 1 H j k H j
(3)
Game theory to determine the portfolio weights
Game theory, also known as response theory, is one of the important branches of modern mathematics and an important discipline of operations research. In this paper, game theory was introduced to seek the balance of interests among different empowerment methods to make the empowerment more reasonable and minimize the deviation between different empowerment results.
(1) Calculate the weights
Assuming that the weights of the model indicators were determined using the s method, the set of indicator weights was W t = W t 1 , W t 2 , , W t n t = 1 , 2 , s , which corresponded to any linear combination expressed as follows:
W = t = 1 s α t w t T α t > 0
W is the linear combination of weights, α t is the weight coefficients, and w t T was the transpose matrix of the basic weight vector set w t .
(2) Optimize the portfolio
The optimal weights w could be found by optimizing the weight coefficients α t in the linear combination such that the standard deviation between the requested weight vector W and the different basic weight vectors were minimized and the model equation was as follows:
W = min t = 1 s α t w t T w 2 ,   t = 1 , 2 , s
(3) Solve for the optimal combination coefficients
Differentiating the optimal combination model matrix, the linear equations were obtained as follows:
w 1 w 1 T w 1 w s T w s w 1 T w s w s T α 1 α s = w 1 w s T w s w s T
The weight coefficients were derived from the above linear equation α 1 , α 1 , α s , and the final indicator weight vector was solved by bringing the derived weight coefficients into the linear combination equation.

Improved Matter-Element Extension Evaluation Model

(1)
Determine the classical domain
The initial allocation of drainage rights as a thing N constructed with a multidimensional object element R = N , C , V , where C was the system of indicators affecting the allocation of drainage rights and V was the quantity value of C .
Let R l be the classical domain of the object R , then we have:
R l = U l , C , V l = U l c 1 a l 1 , b l 1 c i a l i , b l i c m a l m , b l m
C = c 1 , , c i , , c m is the set of indicators for the initial allocation of drainage rights. U l is the drainage priority assigned by the initial allocation of drainage rights. b l i , a l i is the upper and lower limits of the indicator set C in the drainage priority U l .
(2)
Determine the object element
Let R i be the element to be evaluated for R , then:
R i = B i , C i , v i = B i c i 1 v i 1 c i j v i j c i n v i n
B i is the region to be evaluated i , C i = c 1 , , c i , , c n is the set of indicators for the region to be evaluated B i , and V i is the quantity of the indicator C i for B i .
(3)
Closeness calculation
Referring to the definition of distance in classical mathematics in the matter-element extension model, the distance between the evaluation index v i measurement and the classical domain V l ρ v i , V l was calculated according to the existing literature, replacing the principle of asymmetric closeness with the principle of maximum affiliation, and the distance between the point and the two ends of the interval was as follows:
ρ v i , V l = v i a l i + b l i 2 1 2 b l i a l i
Accordingly, the formula for the closeness is shown below:
K i j B i = 1 1 n ( n + 1 ) 1 n α i ρ ( v i , V l ) ( j = 1 , 2 , 3 , l )
K i j B i is the closeness of the i region to the j rank, α i is the weight of each indicator according to the hierarchical analysis and entropy weight method. When K i j B i is less than zero, let K i j B i = 0 and increase K i j B i by shifting the proximity of the other levels of the i region to be evaluated.
(4)
Allocation weight of drainage rights
According to the principle of asymmetric proximity correlation, the greater the comprehensive proximity of the area to be evaluated B i , the greater the demand for drainage rights in the area, and the more drainage rights need to be allocated. In order to fully consider different closeness information, assuming different levels of contribution to β j , the formula for calculating the comprehensive closeness of the evaluation area B i is shown as follows:
K i T = j l β j K i j ( B i )
Considering the long study interval in the paper, the combined degrees of different evaluation regions B i in the same year were normalized, and then, the assigned weights of different regional drainage rights W i were obtained, calculated as shown below:
W i = K i T K i T

3.2.4. Data Sources

The data in this paper were obtained from the statistical yearbooks of Zhenjiang, Changzhou, Suzhou, and Wuxi; the water resources bulletin of the Water Resources Bureau; the soil and water conservation bulletin; the national disaster reduction network; etc. The sectoral qualitative indicators were determined by consulting experts. The data range was from 2017 to 2021.

3.2.5. Model Application

First, this paper considered the characteristics of drainage rights and their allocation principles and used the DPSIR model to construct a system of indicators affecting the allocation of drainage rights. The drainage rights allocation index system included a total of twenty indicators in five criterion layers. The driving force system included green coverage rate, water surface rate, per capita GDP, per capita disposable income, employment rate, and urbanization rate. The pressure system included annual precipitation, maximum seven-day rainstorm recurrence period, and water level; the state system included total length of embankment, drainage pipe density, and number of hydrological stations. The impact system included affected population, crop affected area, and direct economic loss. The response system included sewage treatment rate, drainage facilities construction investment, the number of undergraduates and above, disaster command and control, and emergency management capabilities.
Second, according to the results of the drainage rights allocation index system, the game theory combination weighting model was used to calculate the weight of each index. The subjective weight was determined by the analytic hierarchy process (AHP), which allowed experts and scholars to score at the criterion layer and the index layer, respectively. The objective weight was determined by the entropy weight method considering the characteristics of data information. According to the determined subjective and objective weights, the idea of game theory was adopted to minimize the difference between the two weights so that the weight result was more reasonable. Then, the final index weight of the drainage weight allocation index system was obtained.
Third, the improved matter-element extension model was used to evaluate the allocation of drainage rights. Next, the allocation weight of drainage rights in the four cities from 2017 to 2021 was obtained. When using the model, the upper and lower limits of each index and the priority of drainage rights allocation were determined at first. Then, the asymmetric closeness was calculated according to the matter-element characteristics. Considering the contribution degree of each level again, the comprehensive closeness degree of each city was calculated. Last, the comprehensive closeness was normalized to obtain the proportion of drainage rights allocation in each region in each year.
Finally, further discussion and analysis were carried out according to the results of the matter-element extension model, and corresponding countermeasures and suggestions were put forward according to the discussion results of drainage rights allocation, which provided reference values for subsequent research on drainage rights.

4. Results

4.1. Indicator Weights

First, the determination of subjective weights in this paper invites several experts and scholars to evaluate and score the index system and, then, get the hierarchical analysis method weights, and the weights determined by the hierarchical analysis method all pass the consistency test. Next, the objective weights of the article determine the entropy weights according to the entropy weight method. Finally, the optimal weight is obtained according to the method of game combination weighting. The results are shown in Table 2 below. From the criterion layer, the weights of the driving force, pressure, state, impact, and response layers are 46.02%, 17.72%, 11.86%, 11.94%, and 12.47%, among which the most influential is the driving force system and the least is the state system. From the indicator layer, the three indicators with the greatest impact are the maximum seven-day storm recurrence period, GDP per capita, and water surface rate. The least influential ones are the sewage treatment rate, drainage facilities construction, and the number of people with bachelor degree or above.

4.2. Determining the Classical Domain and Object Elements

Comprehensive consideration of the actual situation of each prefecture-level city queries the classic domain determination criteria, and experts repeatedly modify the communication so as to determine the classic domain of each qualitative and quantitative indicator. The priority level of drainage rights allocation is divided into five levels, which are used. I, II, III, IV, and V represent very urgent, urgent, general, not urgent, and very non-urgent, in that order.

4.3. Closeness Results

According to the model design results, the contribution of different levels are 0.9, 0.6, 0.5, 0.2, and 0.1, respectively. Then, the comprehensive closeness of the four prefecture-level cities from 2017 to 2021 were calculated as shown in Table 3.
In 2017, the comprehensive proximity degrees of Changzhou, Suzhou, Wuxi, and Zhenjiang are 1.53, 2.40, 2.41, and 0.76, respectively. Among them, Wuxi has the largest comprehensive closeness degree, and Zhenjiang has the smallest. In 2018, the comprehensive proximity degrees of Changzhou, Suzhou, Wuxi, and Zhenjiang were 1.84, 3.01, 3.11, and 0.82, respectively. Among them, Wuxi has the largest comprehensive closeness degree, and Zhenjiang has the smallest. In 2019, the comprehensive proximity degrees of Changzhou, Suzhou, Wuxi, and Zhenjiang were 2.13, 3.27, 3.39, and 0.92, respectively. Among them, Wuxi has the largest comprehensive closeness degree, and Zhenjiang has the smallest. In 2020, the comprehensive proximity degrees of Changzhou, Suzhou, Wuxi, and Zhenjiang are 1.81, 2.23, 2.70, and 1.09, respectively. Among them, Wuxi has the largest comprehensive closeness degree, and Zhenjiang has the smallest. In 2021, the comprehensive proximity degrees of Changzhou, Suzhou, Wuxi, and Zhenjiang are 2.68, 3.20, 3.40, and 1.82, respectively. Among them, Wuxi has the largest comprehensive closeness degree, and Zhenjiang has the smallest.

4.4. Results of Drainage Rights Allocation

According to the results of comprehensive closeness, the distribution proportion of drainage rights in the four regions in each year is obtained after normalization, as shown in Table 4. In 2017, the allocation proportion of drainage rights in Changzhou, Suzhou, Wuxi, and Zhenjiang was 21.58%, 33.79%, 33.90%, and 10.72%, respectively. In 2018, the allocation proportion of drainage rights in Changzhou, Suzhou, Wuxi, and Zhenjiang was 20.98%, 34.24%, 35.41%, and 9.37%, respectively. In 2019, the allocation proportion of drainage rights in Changzhou, Suzhou, Wuxi, and Zhenjiang was 21.93%, 33.70%, 34.87%, and 9.49%, respectively. In 2020, the distribution proportions of drainage rights in Changzhou, Suzhou, Wuxi, and Zhenjiang were 23.08%, 28.49%, 34.49%, and 13.95%, respectively. In 2021, the allocation proportion of drainage rights in Changzhou, Suzhou, Wuxi, and Zhenjiang was 24.14%, 28.83%, 30.64%, and 16.39%, respectively.

5. Discussion

5.1. System Evaluation

According to the results of the indicator weights, it is shown that the most influential impact from the criterion level is the driver system, and the least influential is the state system.

5.1.1. Driving Force System

The most influential factors in the driver system are environmental and economic: GDP per capita (12.12%), water surface rate (11.57%), and disposable income per capita (9.97%). With the development of social economy, the call of “both the silver mountain and the green mountain” has been put forward to make the economic and environmental development synergistic, which is conducive to improving the regional defense against flooding. The drainage should also take into account the ecological and economic development of each region. In this paper, the maximum integrated proximity region is transformed as the standard, and the changes of the driving force system of each city from 2017 to 2021 are shown in Figure 2. From the results of Figure 2, it can be found that the closeness of Suzhou and Wuxi are larger and closer to each other in 2017–2021, and farther away from Zhenjiang and Changzhou. This is caused by the fact that Wuxi and Suzhou are far ahead of Changzhou and Zhenjiang in terms of economic development. However, the relative value of the closeness of the cities in 2020 decreases significantly. The reason for this is the decline in economic development caused by the New Crown Pneumonia epidemic, the arrival of the New Crown epidemic leading to the stagnation of multiple industries, and the decline in the level of consumption of the population. The relative values all improve until 2021, which mainly comes from the improvement of medical care and the gradual economic recovery with the liberalization of policies.

5.1.2. Pressure System

The most influential of the stress systems is the maximum seven-day storm period (12.20%). The larger this indicator is, the greater the rainfall, which can easily lead to the outbreak of flooding and requires special attention to the impact it brings, even to social, ecological, and economic problems in many aspects. In this paper, the maximum integrated proximity region is transformed as a criterion, and the change of pressure system of each city from 2017 to 2021 is shown in Figure 3. The order of relative value from 2017 to 2021 is as follows: Changzhou, Wuxi, Zhenjiang, and Suzhou. The change is mainly caused by the fact that the maximum seven-day rainstorm period in Changzhou is larger than the other three cities, and the weight of this indicator is larger. The larger the maximum seven-day rainstorm period is, the more drainage rights are needed to reduce the risk of flooding.

5.1.3. State System

The most influential drainage rights is pipe density (6.56%) in the state system, and the construction of drainage pipes helps to improve the regional drainage capacity and reduce the risk caused by flooding. In this paper, the maximum integrated proximity region is transformed into the standard, and the changes of the state system of each city from 2017 to 2021 are shown in Figure 4. The relative values of Suzhou from 2017 to 2021 are at the bottom mainly because Suzhou has a strong drainage capacity, which in turn will make the region need less drainage rights to a certain extent. The other regions take into account the differences in monitoring capacity and dike lengths, which in turn lead to variations in the drainage rights demand by city from year to year.

5.1.4. Impact System

The largest impact in the impact system is the affected population (7.50%). The larger this indicator is, the greater the impact of flooding. The basic concept of people first and life first is always reflected in this level. In this paper, the maximum integrated proximity region is transformed as a criterion, and the change of the driving force of each city from 2017 to 2021 is shown in Figure 5, and it can be found that the relative value of each city from 2017 to 2021 is not significantly different; that is, there is no significant change in the demand for drainage rights.

5.1.5. Response System

The capability of regional government departments in disaster command and control and management (8.27%) in the response system, which is closely related to the regional government’s socio-economic development and other aspects, is conducive to the whole process of flood disaster defense, including beforehand, during, and afterwards. In this paper, the maximum integrated proximity region is transformed as a criterion. The corresponding system changes from each city from 2017 to 2021 are shown in Figure 6. In this figure, we found that Changzhou and Suzhou have larger relative values, and Wuxi and Zhenjiang have smaller relative values, which may be the result of the combined effect of disaster management capacity and personnel flood prevention awareness.

5.2. Comprehensive Evaluation

The drainage rights allocation results are shown in Figure 7. The order of regional drainage rights allocation is further derived; the order of drainage rights quota sizes from 2017 to 2021 are all Wuxi, Suzhou, Changzhou, and Zhenjiang, among which Suzhou and Wuxi have similar drainage rights quotas and have a larger gap with Zhenjiang’s quota. The specific analysis is as follows:

5.2.1. Wuxi and Suzhou

Wuxi and Suzhou are relatively close to each other in terms of drainage rights quota size from 2017–2021, and both Wuxi’s quota is slightly larger than Suzhou’s, reaching a maximum of 35%. There are two reasons for the larger proportion of drainage rights quotas in Wuxi and Suzhou. First, in the driver system, Wuxi and Suzhou have larger GDP per capita, disposable income per capita, urbanization rate, and employment rate in these indicators. Among the important indicators, Wuxi’s GDP per capita and disposable income per capita will be slightly higher than Suzhou’s. Moreover, the driving force system is the most important system in the model. The underlying data for Wuxi and Suzhou are much higher than the other two regions. This is because both Wuxi and Suzhou have much higher GDP per capita than other regions and, thus, need to obtain more drainage rights to improve the overall flood control efficiency and minimize regional losses. In addition, Wuxi and Suzhou also have higher urbanization and employment rates than other regions, implying a degree of population density and the ability to generate income in the region. In case of flooding, the people of Wuxi and Suzhou will be the most affected by flood disasters, so they need to obtain more drainage rights. Therefore, more drainage rights need to be obtained to protect people’s lives. Second, among the other systems, the maximum seven-day storm period indicator has the greatest impact. Since the maximum seven-day storm period in Suzhou is smaller than that in Wuxi, the risk of flooding in Wuxi will be greater than that in Suzhou, and thus, more drainage rights need to be allocated.

5.2.2. Changzhou

The size of Changzhou’s drainage rights quota for 2017–2021 is second only to Suzhou and Wuxi, with a maximum ratio of 24%. There are two main reasons for this. First, in the driver system, Changzhou has a higher GDP per capita and disposable income per capita than Zhenjiang and is in a position to allocate more drainage rights for the purpose of improving overall flood control efficiency. Second, among the other systems, Changzhou has a much higher maximum seven-day storm period than Zhenjiang, which means that Changzhou will have a much higher risk of flooding than Zhenjiang and, in turn, will receive more drainage rights.

5.2.3. Zhenjiang

The drainage rights of Zhenjiang from 2017–2021 are all ranked at the bottom with low drainage rights quota size. However, with the passage of time, the quota of drainage rights in Zhenjiang will also show an upward trend. The main reason is that at any development of time, the economic and social development of Zhenjiang will make the basic data in the drive system improve. In order to protect the development of their own region, which in turn will also improve the demand for drainage rights, they would therefore obtain more drainage rights.
In addition, Kaize Zhang et al. [25] also used other methods to study the drainage right issue in the region. In that study, this author used the data from 2009 to 2018 for an analysis and came up with four regions of Zhenjiang, Changzhou, Suzhou, and Wuxi with the proportion of drainage rights allocation: 20.03%, 22.69%, 29.18%, and 28.10%, with the drainage rights allocation ranked as: Suzhou, Wuxi, Changzhou, and Zhenjiang. It is seen that Suzhou and Wuxi are also closer to each other in terms of the allocation ratio of drainage rights, and the allocation ratio remains close. Changzhou has the second highest allocation ratio, and Zhenjiang is ranked last. At the same time, this paper further expands the time range of the study. The time range is 2017–2021. Considering the continuity of the research findings, the article’s findings are found to have good stability.

6. Conclusions

The purpose of this study is to determine the size of regional drainage rights in order to reduce flood losses and maximize the overall regional flood control benefits under heavy rainfall. Considering the characteristics and allocation principles of drainage rights, the DPSIR model is used to construct a system of indicators affecting the allocation of drainage rights, and a drainage rights allocation model is constructed with a game combination weight-improved matter-element extension model. The model is applied to the South Jiangsu Canal region for research, and the results show the following:
(1)
Drainage rights allocation is affected by various aspects, such as social, economic, and ecological. It is a complex decision problem. The DPSIR model was used to construct a system of indicators affecting the allocation of drainage rights, and 20 indicators were finally selected, taking into account the availability and accuracy of the data. The most influential indicators are ecological and economic: water surface rate, maximum seven-day rainfall return period, and GDP per capita. Therefore, the coordination of ecology and economy should be fully considered in the process of social development, taking into account both ecological and economic development.
(2)
The method of comprehensive subjective and objective assignment is adopted in the determination of weights, which makes up for the arbitrariness of subjective assignments and the dependence of objective assignments on the data, and the experts were repeatedly consulted in the process of weight determination, making the assignment results more reasonable.
(3)
The final determination of the size of the drainage rights allocation of the four cities in the south Jiangsu canal region from 2017 to 2021 was according to the game combination weight-improved matter-element extension model. The 2017–2021 drainage rights quota size order the cities as Wuxi, Suzhou, Changzhou, and Zhenjiang. Ddeveloped areas have priority over the less developed areas, where Suzhou and Wuxi drainage rights fall. The quotas are similar, and the difference between the quotas of Suzhou and Wuxi and Zhenjiang is large. The determination of the size of drainage rights allocation in the south Jiangsu canal region provides a reference value for drainage rights trading in the south Jiangsu region.
(4)
The drainage rights allocation method of the game combination weight-improved matter-element extension model provides a new research idea for the drainage rights allocation of the basin, and the results of the case analysis provide a direction and reference for improving the flood control and drainage system. A reasonable and efficient allocation of drainage rights can reduce flood losses for the region and lay the foundation for drainage rights trading.

Author Contributions

Conceptualization, Formal analysis, Writing—original draft, Y.L. and F.S.; Methodology, Writing, Soft—original draft, F.S.; Writing—review & editing, J.S. All authors have read and agreed to the published version of the manuscript.

Funding

This research was funded by the Water Resources Science and Technology Project of Jiangsu Province (No. 2019013).

Data Availability Statement

The data presented in this study are available on request from the corresponding author upon reasonable request.

Conflicts of Interest

The authors declare no conflict of interest.

References

  1. Wentz, F.J.; Ricciardulli, L.; Hilburn, K.; Mears, C. How much more rain will global warming bring? Science 2007, 317, 233–235. [Google Scholar] [CrossRef]
  2. Li, S.; Goldberg, M.D.; Sjoberg, W.; Zhou, L.; Nandi, S.; Chowdhury, N.; Straka, W.; Yang, T.; Sun, D. Assessment of the Catastrophic Asia Floods and Potentially Affected Population in Summer 2020 Using VIIRS Flood Products. Remote Sens. 2020, 12, 3176. [Google Scholar] [CrossRef]
  3. Li, Z.; Li, Q.; Bai, C.; Che, T.; Liu, M. Design and application of intelligent water integrated management and control platform system in Zhusi River Basin. China Water Supply Drain. 2023, 39, 118–126. [Google Scholar]
  4. Cui, Y.; Luo, Q.; Liu, L. Flood prediction algorithm based on improved nonlinear autoregressive network. J. Shenyang Univ. Technol. 2023, 45, 84–89. [Google Scholar]
  5. Wu, X.; Zhao, X.; Ding, Q.; Xu, Z.; Qiu, C. Flood evolution prediction method based on data-driven CNN. J. Hydropower 2021, 40, 79–86. [Google Scholar]
  6. Chen, H.; Zhao, Y.; Liang, Z. Technology and practice of joint dispatching in the lower reaches of Jinsha River and Three Gorges Cascade reservoirs. People’s Chang. River 2022, 53, 203–210. [Google Scholar]
  7. Yu, F.; Wang, Y.; Yuan, X.; Jiang, S. The concept of drainage rights and its basic characteristics. J. Irrig. Drain. 2014, 33, 134–137. [Google Scholar]
  8. Zhang, J.; Zhang, C.; Liu, L.; Shen, J.; Zhang, D.; Sun, F. The necessity and feasibility of allocation and transaction of drainage rights in Jiangsu Province. Water Resour. Conserv. 2019, 35, 25–28+130. [Google Scholar]
  9. Lai, X.; Sun, F.; Shen, J.; Gao, X.; Zhang, D. Influencing factors of regional drainage rights allocation based on WSR. Water Conserv. Econ. 2020, 38, 74–80+4. [Google Scholar]
  10. Shen, J.; Li, L.; Zhang, K.; Sun, F.; Zhang, D. Initial allocation of drainage weight based on chaotic Optimization-projection pursuit. Resour. Ind. 2019, 21, 39–47. [Google Scholar]
  11. Shen, J.; Zhao, M.; Wang, C.; Zhang, D.; Zhan, Q.; Sun, F. Research on the allocation of drainage rights based on the game-theoretic combined empowerment-TOPSIS model. Water Conserv. Econ. 2021, 39, 42–49+96. [Google Scholar]
  12. Shen, J.; Yang, J.; Wang, L.; Sun, F. Research on initial allocation of drainage rights based on Gini Coefficient optimization entropy weight-TOPSIS method. Water Conserv. Econ. 2022, 40, 46–50+6+89. [Google Scholar]
  13. Wu, F.; Cao, Q.; Zhang, D.; Sun, F.; Shen, J. Allocation of drainage rights in Southern Jiangsu Canal based on environmental Gini coefficient. J. Hohai Univ. (Nat. Sci. Ed.) 2020, 48, 314–319. [Google Scholar]
  14. Zhang, D.D.; Shen, J.Q.; Sun, F.H.; Liu, B.; Wang, Z.Y.; Zhang, K.Z.; Li, L. Research on the Allocation of Flood Drainage Rights of the Sunan Canal Based on a Bi-level Multi-Objective Programming Model. Water 2019, 11, 1769. [Google Scholar] [CrossRef]
  15. Sun, F.H.; Lai, X.P.; Shen, J.Q.; Nie, L.B.; Gao, X. Initial allocation of flood drainage rights based on a PSR model and entropy-based matter-element theory in the Sunan Canal, China. PLoS ONE 2020, 15, e0233570. [Google Scholar] [CrossRef]
  16. Zhang, X.Y.; Shen, J.Q.; Sun, F.H.; Wang, S.; Zhang, S.X.; Chen, J. Allocation of Flood Drainage Rights in Watershed Using a Hybrid FBWM-Grey-TOPSIS Method: A Case Study of the Jiangsu Section of the Sunan Canal, China. Int. J. Env. Res. Public Health 2022, 19, 8180. [Google Scholar] [CrossRef]
  17. Shen, J.Q.; Zhu, T.T.; Sun, F.H. A Study on the Mechanism and Pricing of Drainage Rights Trading Based on the Bilateral Call Auction Model and Wealth Utility Function. Water 2022, 14, 2269. [Google Scholar] [CrossRef]
  18. Zhang, L.; Shi, Y.; Liu, H.; Li, F. Research on initial water rights allocation of reservoir based on matter-element extension theory. China Popul. Resour. Environ. 2019, 29, 110–117. [Google Scholar]
  19. Zhu, Y.; He, H.; Zhang, W.; Du, S. Water resource vulnerability assessment in Changchun based on DPSIR-TOPSIS model. Bull. Soil Water Conserv. 2022, 42, 174–180. [Google Scholar]
  20. Li, J.; Zeng, X.; Cao, Q.; Ji, Y. Safety assessment and trend prediction of karst mountain tourism ecosystem: A case study of Guizhou International mountain tourism destinations. Ecol. Econ. 2022, 38, 145–151. [Google Scholar]
  21. Ma, X.; Shao, L.; Zhang, D.; Li, F.; Huang, L.; Chen, J. DPSIR based coordination evaluation and analysis model for HSR and rail transit transfer systems. J. Railw. Sci. Eng. 2023, 20, 1232–1241. [Google Scholar]
  22. Sun, C.; Gao, J.; Xu, J. Research on the improvement of regional public cultural service level based on DPSIR framework: A case study of 11 provinces and cities in the Yangtze River Economic Belt. Libr. Theory Pract. 2022, 258, 53–60+7. [Google Scholar]
  23. Cai, W. Extension theory and its applications. Chin. Sci. Bull. 1999, 44, 1538–1548. [Google Scholar] [CrossRef]
  24. Hasekiogullari, G.D.; Ercanoglu, M. A new approach to use AHP in landslide susceptibility mapping: A case study at Yenice (Karabuk, NW Turkey). Nat. Hazards 2012, 63, 1157–1179. [Google Scholar] [CrossRef]
  25. Zhang, K.; Shen, J.; Guo, L.; Boyer, E.W.; Mello, C.R.; Lan, P.; Liu, H.; Gao, J.; Fan, B. Flood drainage rights in watersheds based on the harmonious allocation method. J. Hydrol. 2021, 601, 126627. [Google Scholar] [CrossRef]
Figure 1. Study area.
Water 15 02044 g001
Figure 2. Driving force system.
Water 15 02044 g002
Figure 3. Pressure system.
Water 15 02044 g003
Figure 4. State system.
Water 15 02044 g004
Figure 5. Impact System.
Water 15 02044 g005
Figure 6. Response system.
Water 15 02044 g006
Figure 7. Results of drainage rights allocation.
Water 15 02044 g007
Table 1. Indicator system display.
Target LayerGuideline LayerIndicator LayerSymbolsNature of IndicatorReferences
Initial allocation of drainage rightsDriving forceGreen CoverageD1Negative[8,10]
Water surface rateD2Negative[8,10]
GDP per capitaD3Positive[13,14,15]
Disposable income per capitaD4Positive[13,14,15]
Employment rateD5Positive[13,14,15]
Urbanization rateD6Positive[13,14,15]
PressureAnnual precipitationP1Positive[8,9,10]
Maximum seven-day rainstorm recurrence periodP2Positive[8,9,10]
Water levelP3Positive[8,9,10]
StateTotal length of embankmentS1Negative[8,9]
Drainage pipe densityS2Negative[8,9]
Number of hydrological stationsS3Negative[8,9]
ImpactAffected PopulationI1Positive[10]
Crop damage areaI2Positive[10]
Direct economic lossI3Positive[10]
ResponseSewage treatment rateR1Negative[9,11]
Construction of drainage facilitiesR2Negative[9,11]
Number of people with bachelor’s degree or aboveR3Negative[23]
Disaster command and control capabilitiesR4Negative[14]
Disaster Emergency Management CapabilityR5Negative[14]
Table 2. Indicator weights.
Target LayerGuideline LayerWeightsIndicator LayerAHPEntropy PowerGaming Portfolio WeightsSort by
Initial allocation of drainage rightsDriving force46.02%Green Coverage0.090.040.085
Water surface rate0.130.060.123
GDP per capita0.150.050.122
Disposable income per capita0.120.040.104
Employment rate0.050.020.049
Urbanization rate0.020.050.0312
Pressure17.72%Annual precipitation0.030.020.0315
Maximum seven-day rainstorm recurrence period0.130.080.121
Water level0.030.050.0410
State11.86%Total length of embankment0.010.070.0313
Drainage pipe density0.050.080.077
Number of hydrological stations0.010.060.0314
Impact11.94%Affected Population0.080.040.086
Crop damage area0.020.040.0316
Direct economic loss0.020.030.0217
Response12.47%Sewage treatment rate0.000.050.0218
Construction of drainage facilities0.010.020.0120
Number of people with bachelor’s degree or above0.000.040.0219
Disaster command and control capabilities0.010.080.0311
Disaster Emergency Management Capability0.030.080.058
Table 3. Integrated Proximity, 2017–2021.
YearRegion K I   B i K II   B i K III   B i K IV   B i K V   B i K   B i
2017Changzhou0.430.710.990.950.351.53
Suzhou1.291.160.860.570.002.40
Wuxi1.251.200.900.600.002.41
Zhenjiang0.010.280.561.130.770.76
2018Changzhou0.690.971.000.690.101.84
Suzhou1.961.160.860.570.003.01
Wuxi2.031.200.900.600.003.11
Zhenjiang0.030.320.601.170.750.82
2019Changzhou0.951.180.890.590.002.13
Suzhou2.261.160.860.570.003.27
Wuxi2.341.190.900.600.003.39
Zhenjiang0.060.360.661.250.720.92
2020Changzhou0.650.921.020.720.121.81
Suzhou1.101.160.860.570.002.23
Wuxi1.561.200.900.590.002.70
Zhenjiang0.160.450.731.210.621.09
2021Changzhou1.541.200.900.590.002.68
Suzhou2.171.160.860.570.003.20
Wuxi2.341.200.900.600.003.40
Zhenjiang0.640.941.030.740.141.82
Table 4. Allocation ratio of drainage rights for 2017–2021.
YearRegionAllocation Ratio
2017Changzhou21.58%
Suzhou33.79%
Wuxi33.90%
Zhenjiang10.72%
2018Changzhou20.98%
Suzhou34.24%
Wuxi35.41%
Zhenjiang9.37%
2019Changzhou21.93%
Suzhou33.70%
Wuxi34.87%
Zhenjiang9.49%
2020Changzhou23.08%
Suzhou28.49%
Wuxi34.49%
Zhenjiang13.95%
2021Changzhou24.14%
Suzhou28.83%
Wuxi30.64%
Zhenjiang16.39%
Disclaimer/Publisher’s Note: The statements, opinions and data contained in all publications are solely those of the individual author(s) and contributor(s) and not of MDPI and/or the editor(s). MDPI and/or the editor(s) disclaim responsibility for any injury to people or property resulting from any ideas, methods, instructions or products referred to in the content.

