Article

Study on Preparation of Rabbit Manure Biochar and Activation of Peroxymonosulfate for Rhodamine B Degradation

1
Faculty of Geosciences and Environmental Engineering, Southwest Jiaotong University, Chengdu 611756, China
2
School of Materials and Environmental Engineering, Chengdu Technological University, Chengdu 611730, China
3
Sichuan Development Environmental Science and Technology Research Institute Co., Ltd., Chengdu 610094, China
*
Author to whom correspondence should be addressed.
Water 2023, 15(11), 2015; https://doi.org/10.3390/w15112015
Submission received: 5 April 2023 / Revised: 16 May 2023 / Accepted: 24 May 2023 / Published: 26 May 2023
(This article belongs to the Special Issue The Application of Electrochemical Methods in Water Treatment)

Abstract

:
Using rabbit manure as raw material, three distinct types of rabbit manure biochar (RBC400, RBC500, and RBC600) were prepared via pyrolysis at 400 °C, 500 °C, and 600 °C, respectively. The effects of pyrolysis temperature on the physicochemical properties of biochar were examined by scanning electron microscopy, Brunauer–Emmett–Teller analysis, Fourier transform infrared spectroscopy, X-ray photoelectron spectroscopy, and X-ray diffraction techniques. Rabbit manure biochar was used to activate permonosulfate (PMS) to degrade rhodamine B (RhB). The findings revealed that RBC600 prepared at 600 °C showed the strongest catalytic activity due to its abundant pores and pore structure, high graphitization, and high carbonization degree. Under optimal reaction conditions (0.4 g/L PMS and 0.6 g/L RBC600), the degradation rate of 50 mg/L RhB reached 93.38% within 60 min. RBC600 can be effectively recovered, and effective catalytic activity can be sustained after five cycles. The quenching and EPR experiments showed that both free-radical (SO4 and ·OH) and non-free-radical (1O2) pathways contributed to the degradation of RhB, in which 1O2 performed a dominant role. In conclusion, the new PMS activator prepared in this study not only realizes the “waste to waste” use of manure waste but also provides technical support for the efficient resource-based treatment of organic wastewater.

1. Introduction

Printing and dyeing wastewater has caused severe water pollution due to its content of highly saturated colors, high toxicity, complex composition, and difficulty of degradation [1,2]. Owing to the considerable progress in synthetic dye technology, dye antiphotolysis, antibiodegradation, and anti-oxidation abilities, a substantial amount of refractory dye wastewater has emerged. Rhodamine B (RhB), a type of synthetic dye, has emerged as one of the dyes that are being widely implemented in industrial production, and its impact on the environment cannot be underestimated. Traditional wastewater treatment methods, such as physical adsorption, electrochemical methods, and biodegradation [3,4,5], pose considerable challenges in terms of their applicability to printing and dyeing wastewater. In this context, how printing and dyeing wastewater can be efficiently degraded has become an urgent problem that necessitates immediate resolution.
The Opinions on Implementing the Strategy of Rural Revitalization issued by the CPC Central Committee and the State Council in 2018 clearly emphasized the importance of realizing waste resources, replacing organic fertilizers with chemical fertilizers, treating livestock and poultry manure waste, and promoting comprehensive utilization of crop straw. As the largest rabbit-raising province in China, Sichuan Province has ranked first in the country in recent years. According to statistics, since 2020, the annual output of rabbits in Sichuan Province has stabilized at approximately 170 million, accounting for approximately 50% of the national output during the same period. Although a relatively mature treatment mode has been developed for the resulting large amount of rabbit manure, several challenges persist. Under the backdrop of this new era, it is essential to explore a novel resource-based treatment approach for rabbit manure.
Biochar is a type of carbon-rich, porous solid material (similar to charcoal); its production can be realized through solid waste transformation under anaerobic or anoxic conditions. It features inexpensive prices, an elevated carbon content, a large cation exchange capacity, a stable structure, a large specific surface area, and a strong adsorption capacity, among other desirable properties [6,7,8]. When evaluating the application potential of biochar, most researchers focus on its adsorption of organic pollutants [9]. However, many recent studies have shown that in the presence of biochar and oxidants, some organic contaminants may decompose [10,11,12]. Simultaneously, due to the electronic conductivity of the carbon structure, biochar can also obtain electrons from electron donors or provide electrons to acceptors and act as electron shuttles or electron conductors to degrade organic pollutants [13,14].
PMS can be activated in a variety of ways, such as ultraviolet activation, microwave irradiation activation [15], ultrasonic activation, alkali activation [16], metal activation [17], carbon material activation, etc. These methods possess their own advantages and disadvantages. RhB degradation via UV/PMS, US/PMS, and other systems has been investigated before, and some scholars have even studied the degradation of RhB through persulfate catalyzed by carbonaceous materials [18,19]. However, studies exploring the reaction process and mechanism of RhB degradation using rabbit manure biochar/PMS are scarce. In this paper, the reaction mechanism was preliminarily explored through the study of the system. It was found that the rabbit manure biochar/PMS system possesses a good degradation effect on RhB, and the rabbit manure biochar exhibits excellent material stability and recyclability. A novel RhB degradation system was proposed in this paper. Carbon activation is easier to control and more economical than UV activation, ultrasonic activation, etc. This important conclusion is a breakthrough and contribution to previous studies and lays the foundation for subsequent studies. Therefore, in this study, rabbit manure served as a raw material in the preparation of biochar material, which served as a catalyst and activator in the activation of permonosulfate (PMS) to degrade RhB in printing and dyeing wastewater. At the same time, the degradation efficiency of RhB in water via single biochar systems, single PMS systems, and rabbit manure biochar and PMS systems under different conditions was investigated. Combined with free-radical quenching and EPR experiments, the possible pathway of RhB degradation was analyzed. Finally, the application potential of the catalyst was evaluated via a stability experiment in an effort to provide a theoretical basis for an efficient, novel, and cheap dye wastewater treatment method.

2. Materials and Methods

2.1. Reagents and Instruments

Reagents: PMS (KHSO5·0.5KHSO4·0.5K2SO4, KHSO5 ≥ 42%) was purchased from Shanghai Aladdin Biochemical Technology Co., Ltd. (Shanghai, China), Methanol (MeOH), ethanol (ETA), tert-butanol (TBA), p-benzoquinone (BQ), L-histidine (L-His), sodium hydroxide, sodium bicarbonate, sodium chloride, sodium nitrate, hydrochloric acid, humic acid (HA), and RhB were all purchased from Chengdu Colon Chemicals Co., Ltd. (Chengdu, China). The chemical reagents used in the experiment were all analytically pure, and the laboratory water was ultrapure (resistivity of ≥18.25 MΩ/cm).
Instruments: Laboratory pH meter (PHSJ-3F, Shanghai Lei Magnetic (Shanghai, China)); numerical control ultrasonic cleaner (KH5200DB type, Kunshan Ultrasonic Instruments Co. Ltd. (Kunshan, China)); UPHW-IV-90T, Sichuan Upu Water Instrument (Chengdu, China); ultraviolet visible spectrophotometer (WFZ UV-4802H, Unique, Shanghai, China); electric blast drying oven (101-3AB, Tianjin Test (Tianjin, China)); constant-temperature oscillating box (BS-2E, Changzhou Jintan Liangyou (Changzhou, China)); table low-speed centrifuge (TD-420, Sichuan Shuke (Chengdu, China)); analytical balance, FA2004B, Shanghai Youke (Shanghai, China); muffle furnace (SX2-3-10, Shenyang Energy-saving Electric Furnace Factory (Shenyang, China)); and high-speed multifunctional crusher (SS-1022, Wuyi Haina (Wuyi, China)). Scanning electron microscope energy spectrometer (ZEISS Gemini SEM 300, ZEISS, Jena, Germany); Brunauer–Emmett–Teller (BET) ratio surface analyzer (Micromeritics ASAP 2460, Micromeritics Instruments Co., Norcross, GA, USA); Fourier transform infrared spectrometer (Thermo Scientific Nicolet 6700, Thermo Fisher Scientific, Waltham, MA, USA); X-ray photoelectron spectrometer (Thermo Scientific K-Alpha, USA); X-ray diffractometer (Rigaku Ultima IV, Rigaku, Tokyo, Japan); paramagnetic resonance spectrometer ESR/EPR (Bruker ELEXSYS-II E500, Bruker GmbH, Mannheim, Germany); and a temperament combination instrument (Agilent 7890A-5975C, Agilent Technologies, Santa Clara, CA, USA).

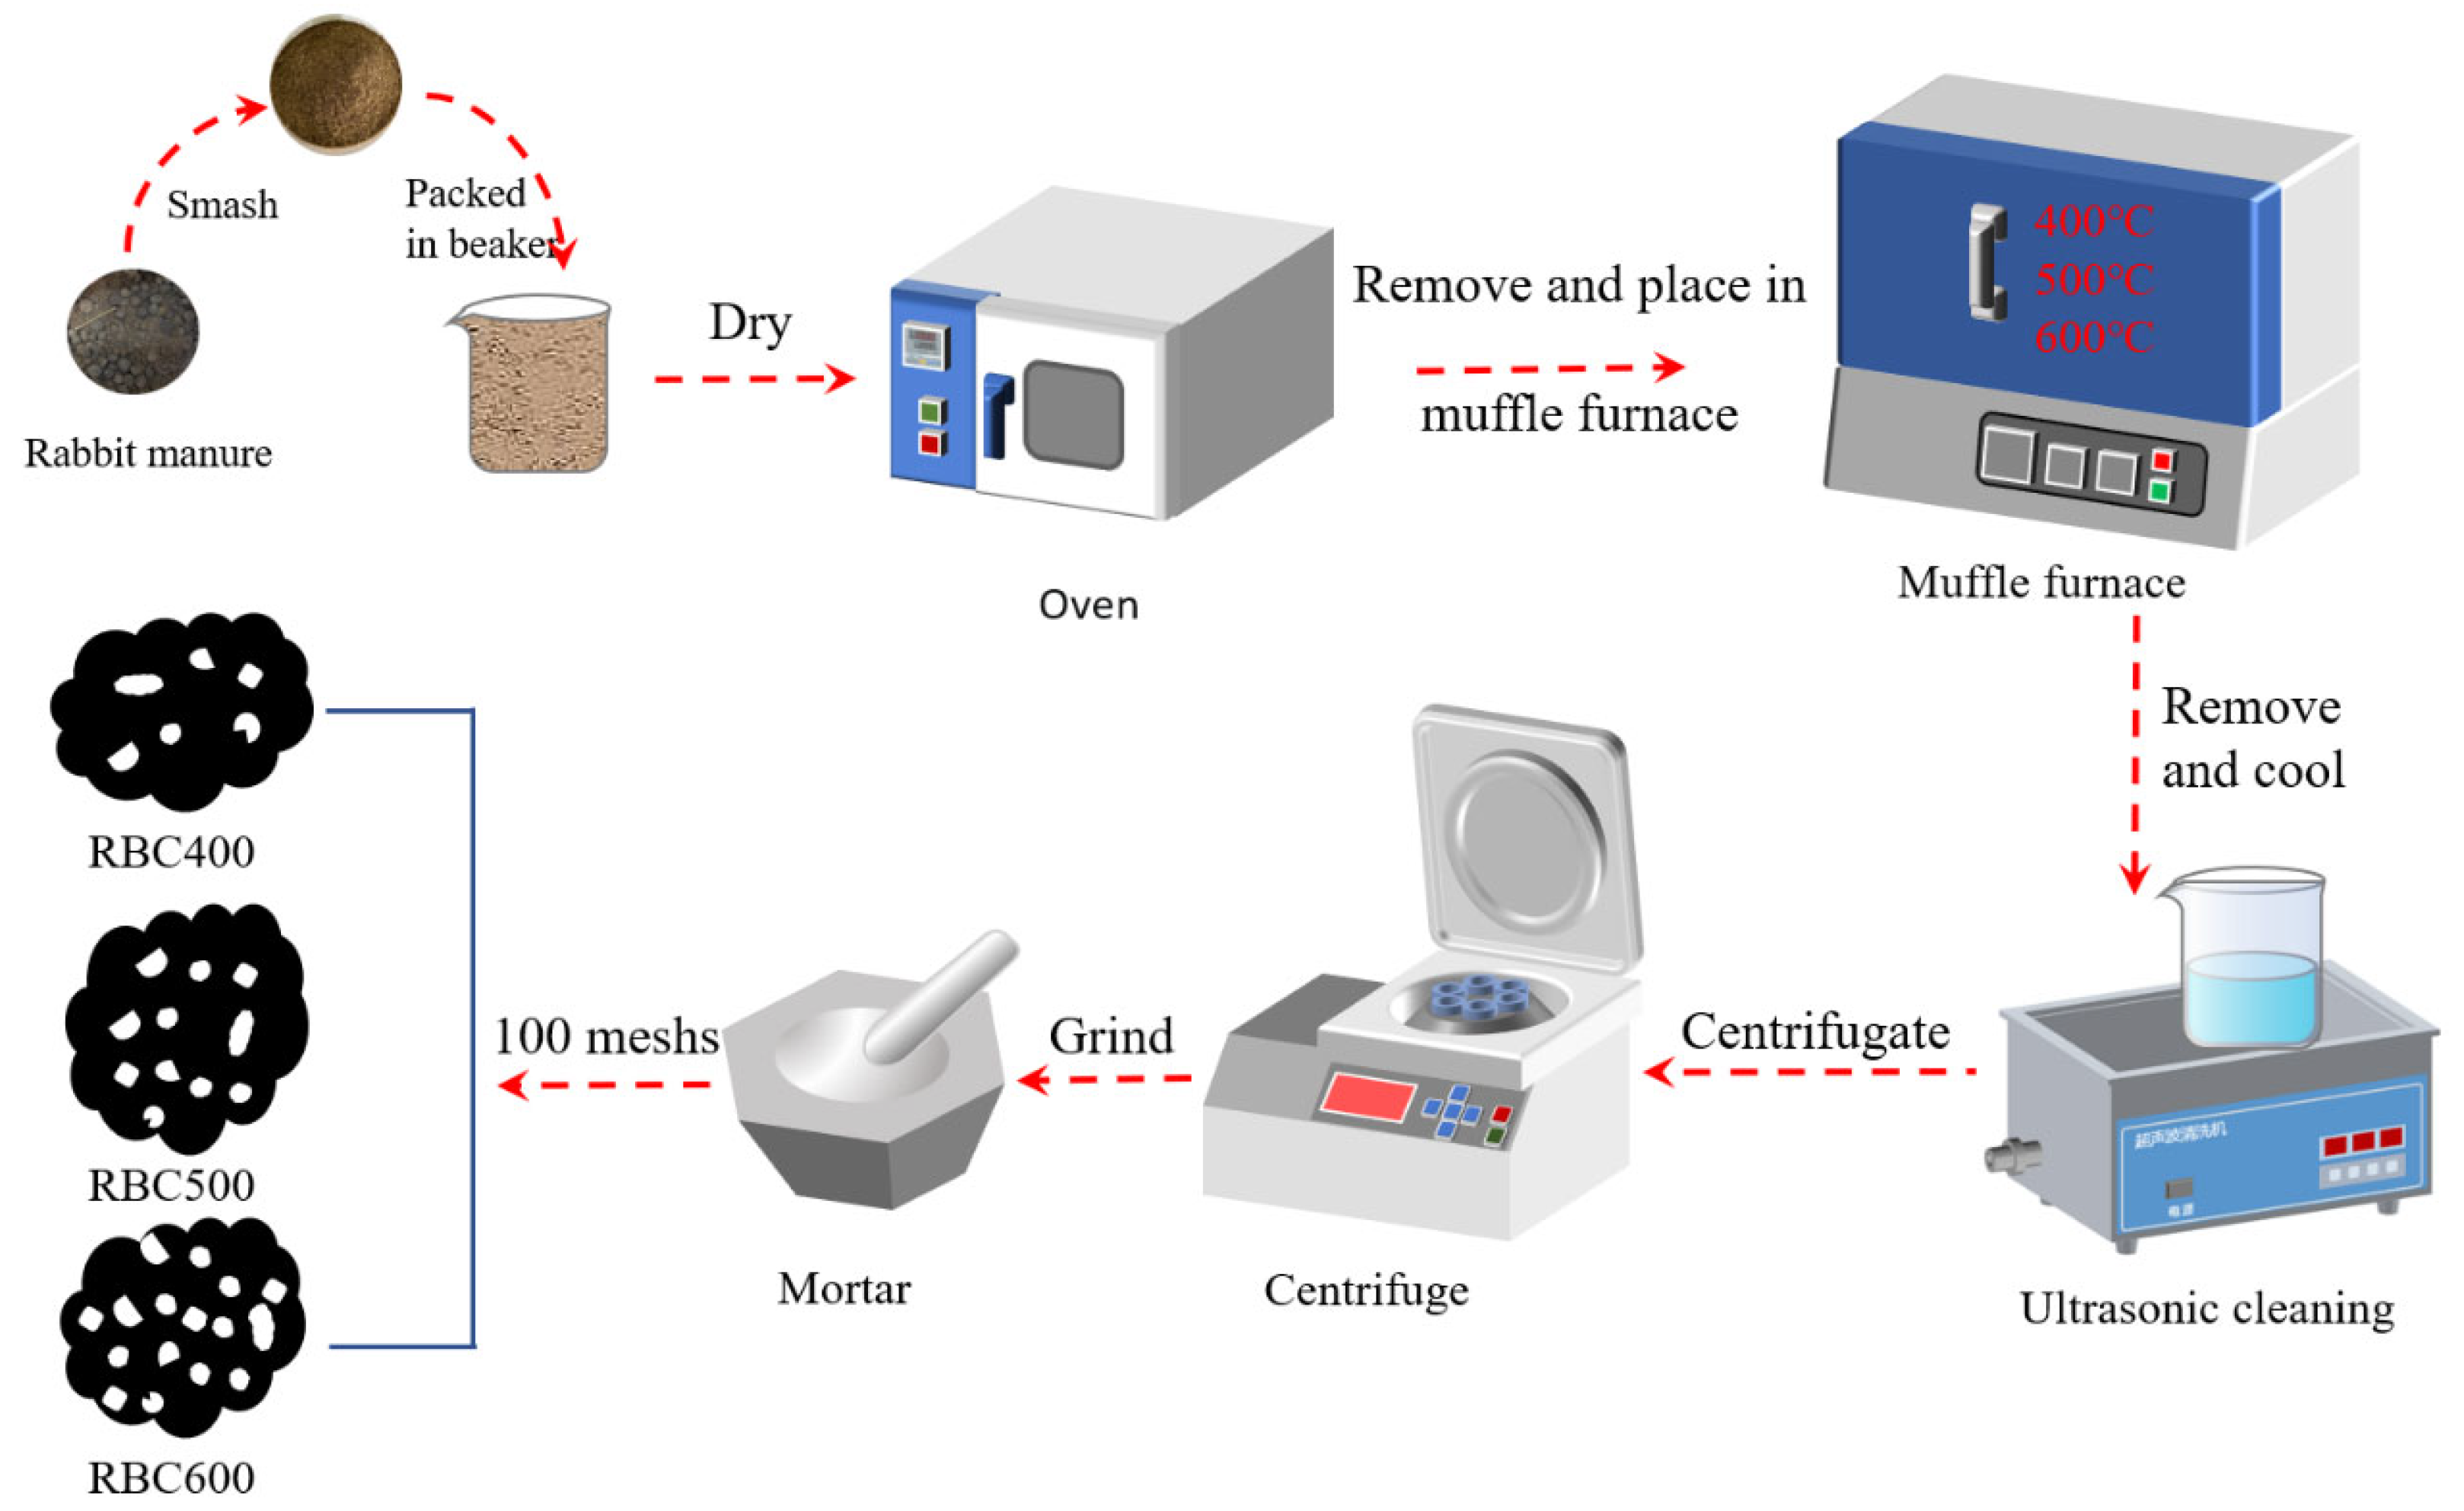
2.2. Preparation of Biochar

Rabbit manure from a rabbit breeding base in Chengdu City was selected as the raw material for biochar. Large impurities, including grass and leaves, were removed from the manure using a mesh sieve and tweezers. The manure was then broken up using a crusher. The crushed rabbit excrement was dried in an oven at 105 °C for 24 h. An appropriate amount of the material was collected for weighing, placed in a crucible, compacted, and covered with a tin foil-wrapped crucible in a muffle furnace. The material was heated in the muffle furnace at a speed of 10 °C/min at set temperatures (400 °C, 500 °C, and 600 °C). After constant-temperature heating for 2 h, the material was taken out and cooled to room temperature. After the cooling pyrolysis products were mixed with 1 mol/L HCl at a 1:25 (m/V, g/mL) solid–liquid ratio, ultrasonic cleaning was performed for 10 min, the supernatant was skimmed off, and the same volume of HCl was added. The process was repeated thrice. Finally, the pyrolysis products obtained after HCl cleaning were centrifuged and repeatedly rinsed with deionized water until the clear liquid was neutral. The collected solids were dried at 105 °C to a constant weight, then ground with a mortar and screened with 100 mesh (0.15 mm) to obtain RBC400, RBC500, and RBC600. The prepared rabbit manure biochar was sealed in a ziplock bag, marked, and kept in a brown vacuum dryer. Figure 1 depicts the precise preparation procedure.

2.3. Experimental Scheme

Certain amounts of PMS (0.2–1.0 g/L) and biochar (0.2–1.0 g/L) were added to 150 mL of a 50 mg/L RhB solution. Furthermore, the conical flask was placed in a constant-temperature oscillation chamber and oscillated at 200 r/min at 15–45 °C. A total of 2.0 mL of the reaction liquid was collected at the set time interval point. After the sample passed through the 0.45-μm filter membrane, 2 mL of MeOH solution was quickly added for quenching, and the absorbance of the mixture was determined by a spectrophotometer after dilution with pure water. To learn more about how diverse pH levels affect the activation properties of the solution, 1 mol/L of NaOH or HCl was used to adjust the pH of the solution. NaCl, NaHCO3, NaNO3, and HA were used to regulate the concentrations of different background components in the solution to study the effects of background components (Cl, HCO3, NO3, and HA) on the degradation of RhB. MeOH, TBA, BQ, and L-His were added to the solution as quenchers to investigate the formation of different active substances.

2.4. Analysis Method

The absorbance of RhB was determined by a UV-visible spectrophotometer (WFZ UV-4802H, Unic, Shanghai, China). The measurement wavelength range was 190–1100 nm, and the wavelength accuracy was ±0.3 nm. At the maximum visible wavelength of 554 nm, the absorbance of RhB was measured, and its concentration was calculated based on the standard curve of RhB. In this research, all experiments were performed thrice in parallel, and the degradation rate η (%) was calculated using the average data. The calculation formulas of RhB degradation rate η and first-order reaction kinetics are shown in Equations (1) and (2), respectively.
  η = C 0   -   C t C 0   ×   100 %
ln(C/C0) =kobst
where C0 and Ct are the mass concentrations of RhB in solution (mg/L), respectively, with 0 denoting the initial concentration and t denoting the concentration of RhB at time t; C is the concentration of RhB in the solution at any given time (mg/L); V is the volume of RhB solution (mL); and kobs is the pseudo-first-order reaction rate constant (min−1).

3. Results and Discussion

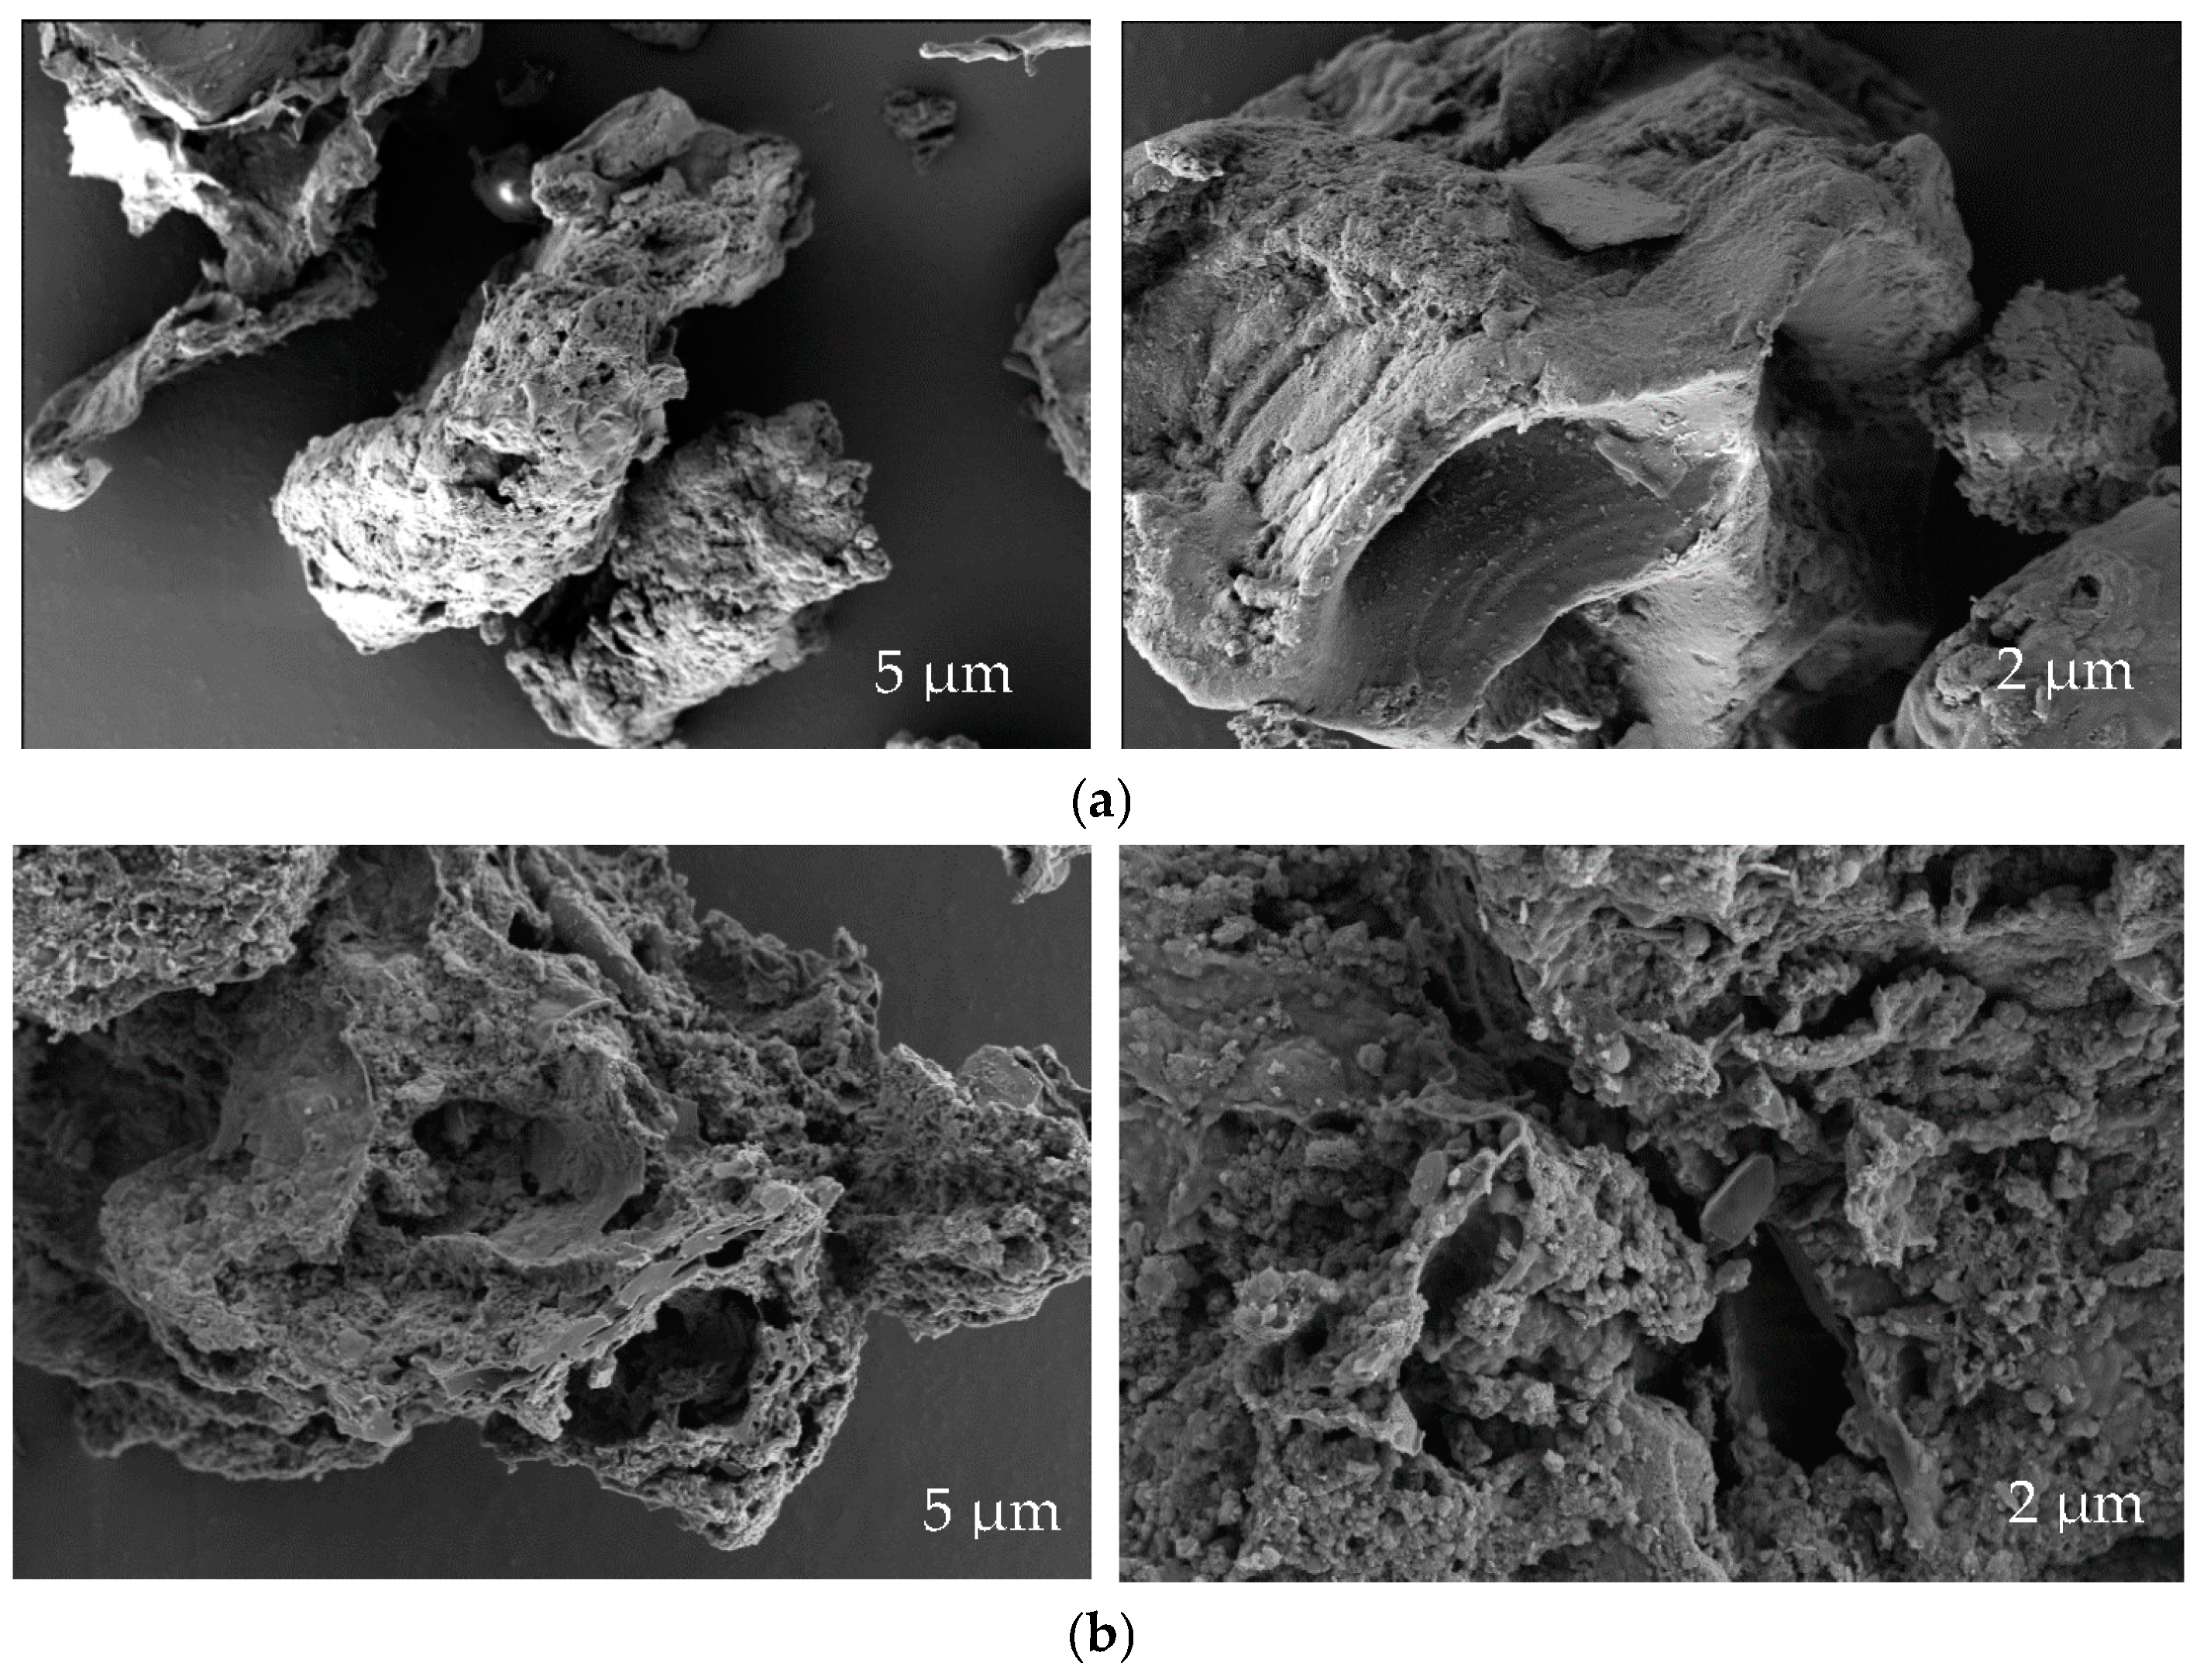
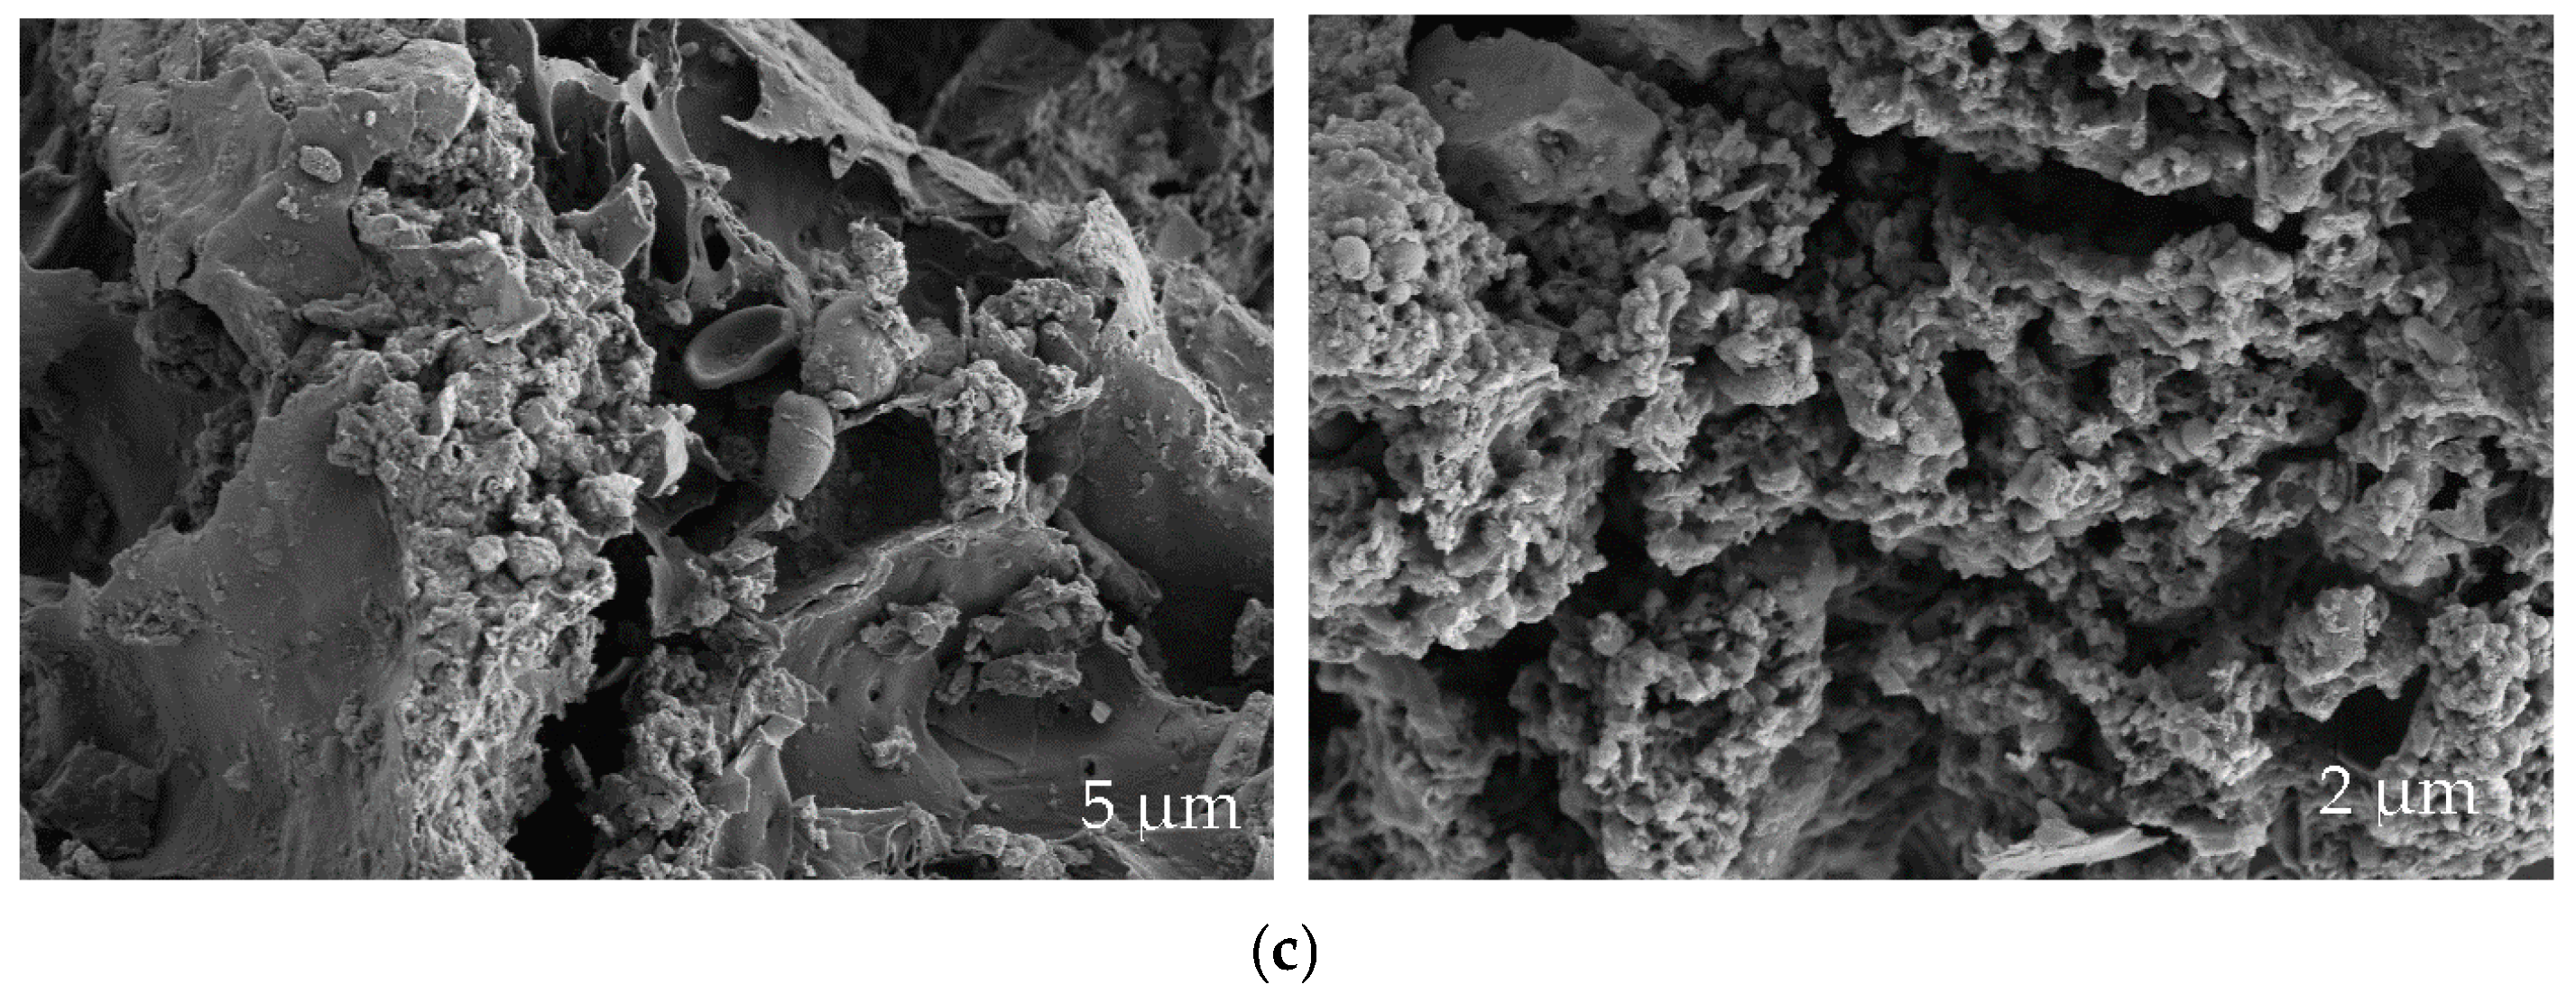
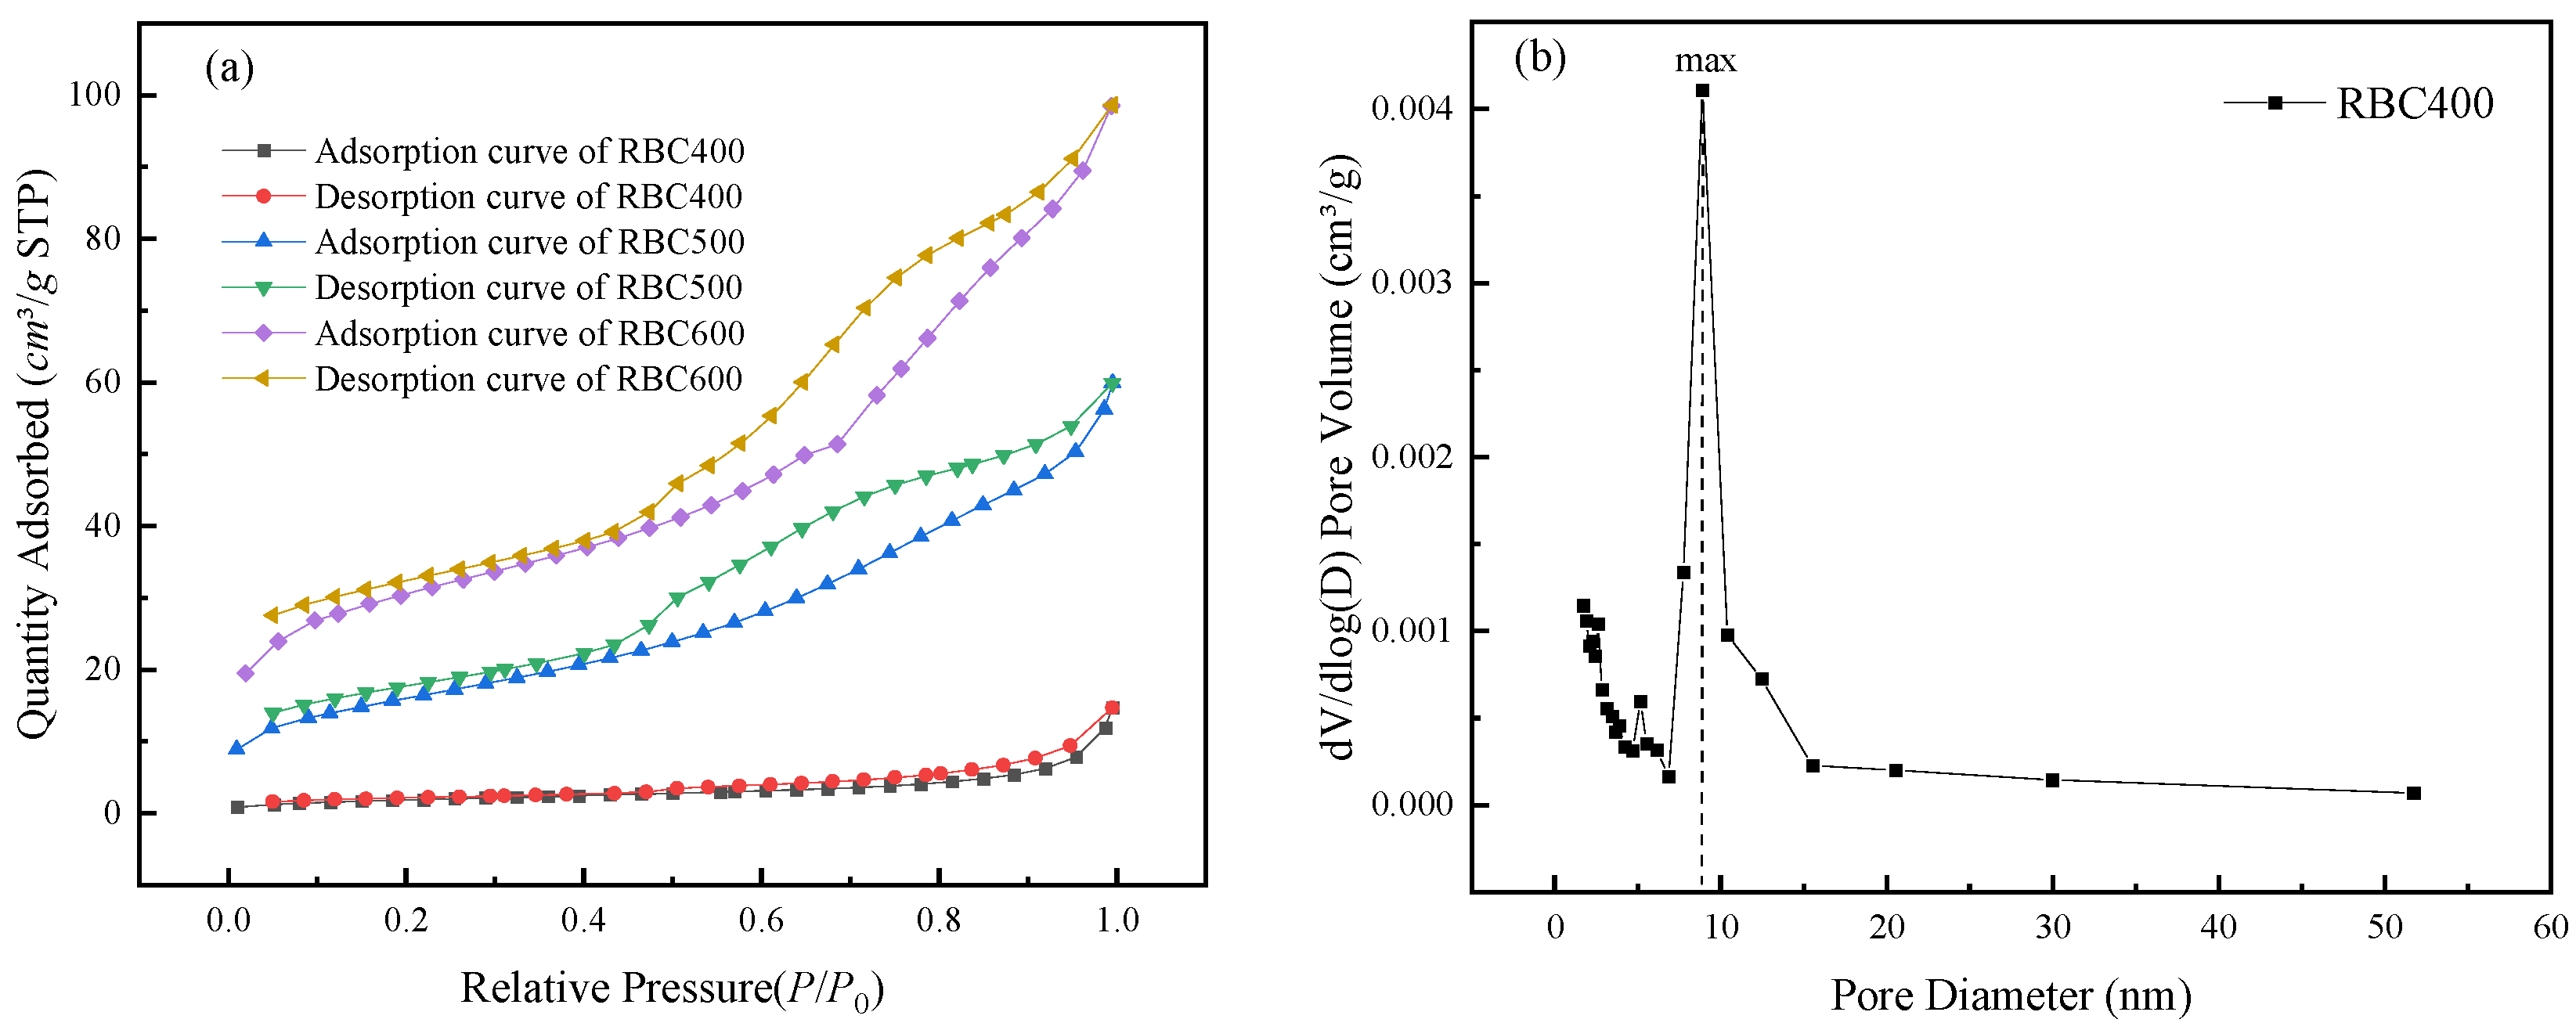
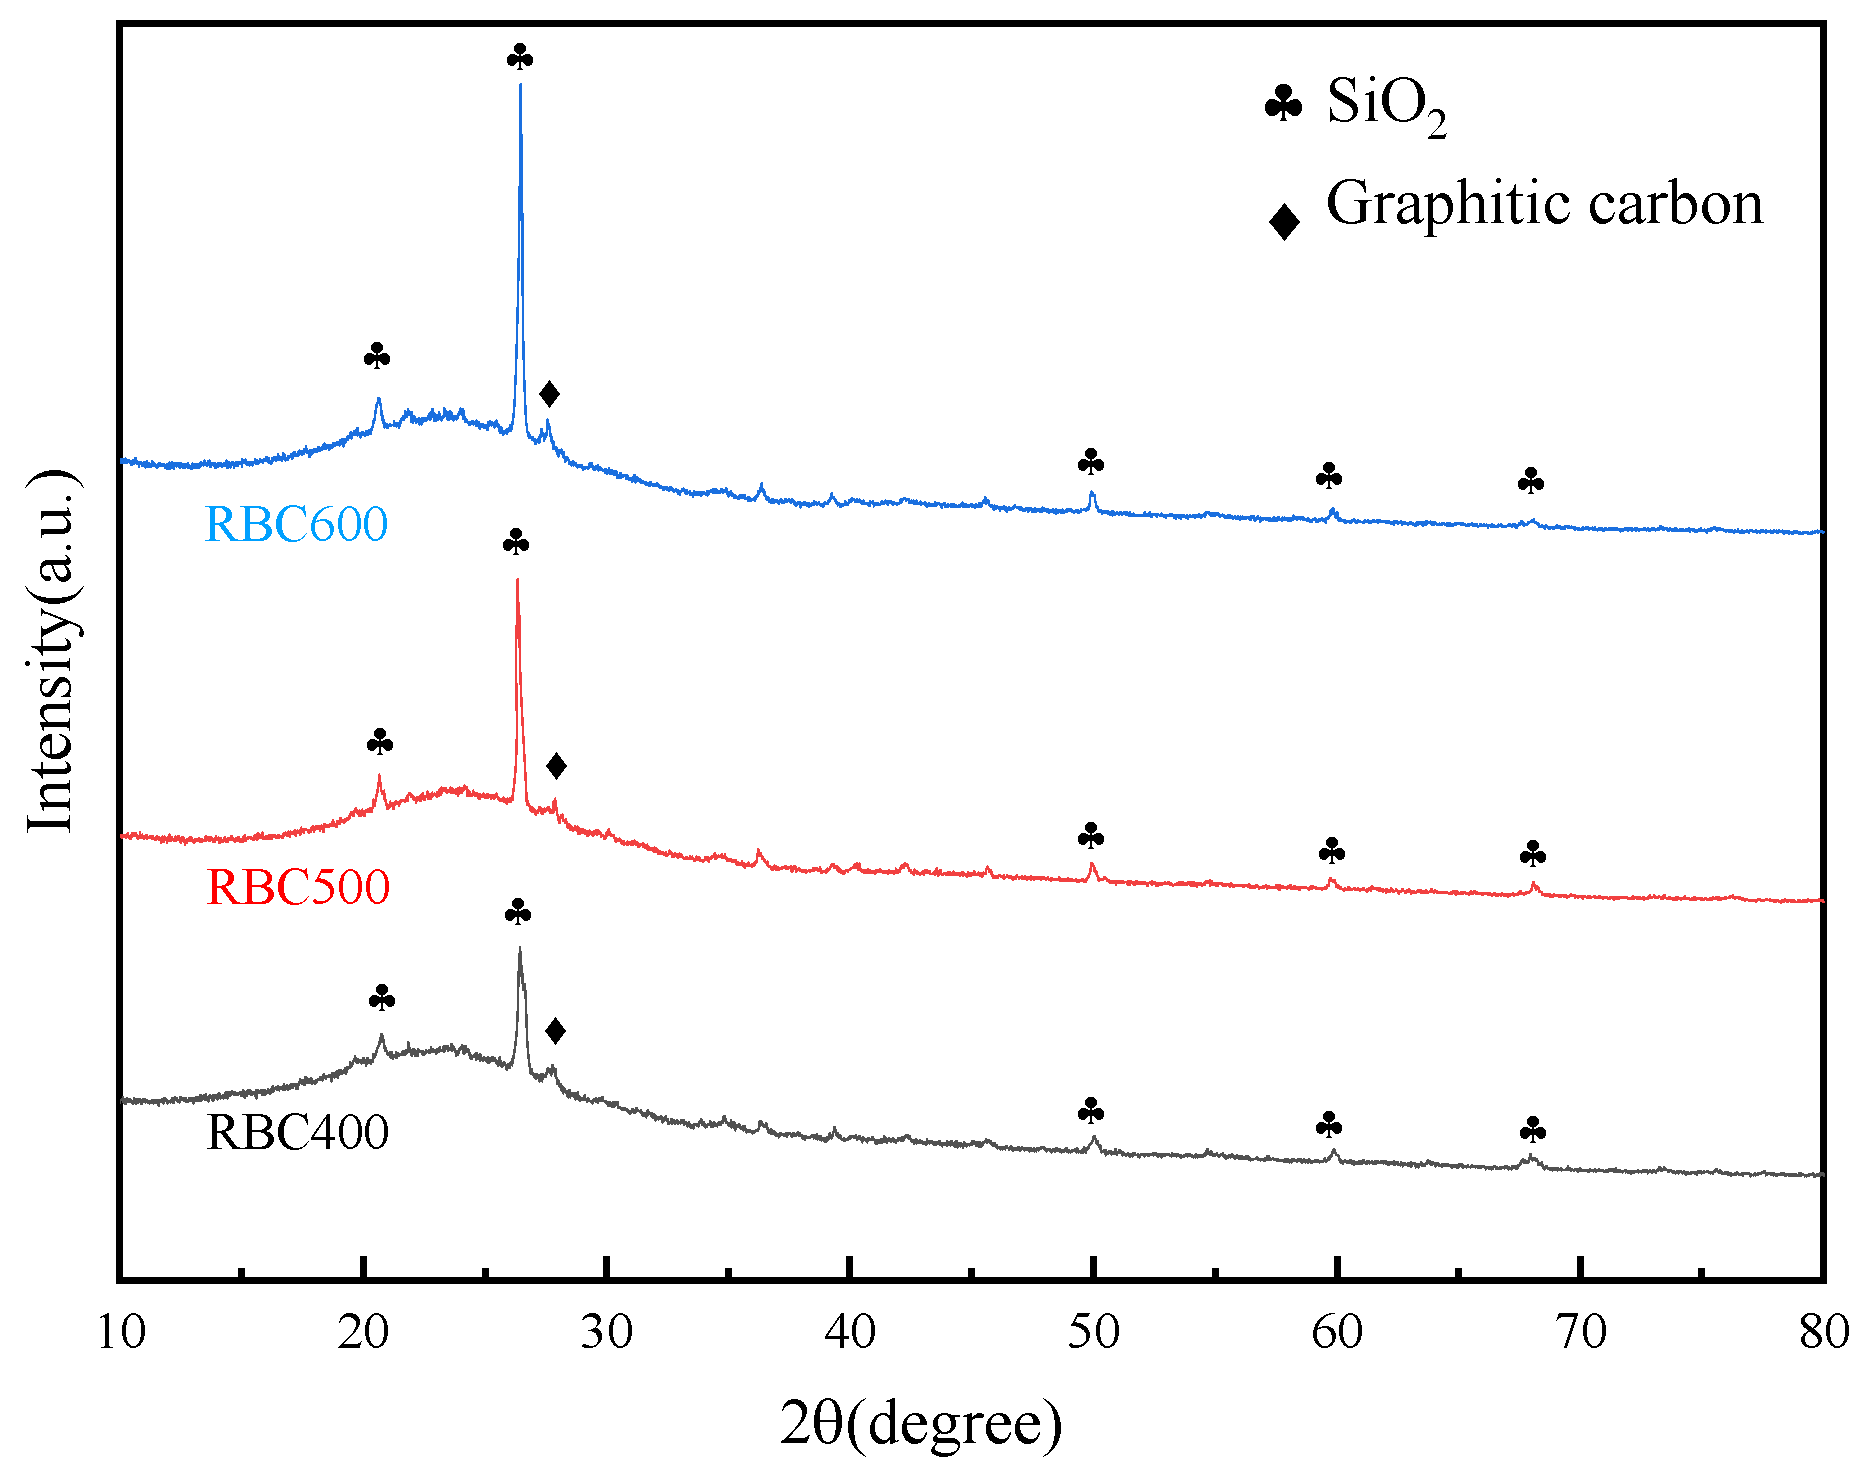
3.1. Structural Characteristics of RBC

The prepared rabbit manure biochar was placed under a scanning electron microscope, and its microstructure was observed (Figure 2). The acceleration voltage of the scanning electron microscope was 2 kV, and its magnification was 2–10 k. The sample preparation process is as follows: The powder sample was dispersed on the clean, smooth surface of the silicon wafer (0.2 cm × 0.2 cm). After natural drying, the other side of the silicon wafer is pasted on the conductive tape of the sample table. After gold spraying, the powder sample was placed in the sample room for testing. As depicted in Figure 2, after pyrolysis, the surfaces of the three types of biochar showed irregular concave–convex shapes. When the pyrolysis temperature was 400 °C, almost no pore structure was observed on the surface of the biochar, and the surface exhibited a rough and caked state. Some tiny particles were deposited on the surface (Figure 2a). This finding indicates that at 400 °C, the biomass pyrolysis was insufficient, and the pores were not fully opened. Figure 2b shows that when the pyrolysis temperature rose to 500 °C, the surface roughness of the biochar increased, and some pores appeared. However, the pore size was generally large. When the pyrolysis temperature was 600 °C, more pores and channels appeared on the biochar surface, and a certain amount of fold structure appeared, indicating that biochar generated at 600 °C formed abundant pore and channel structures after full pyrolysis at high temperature. According to the scanning electron microscopy (SEM) analysis, with increasing pyrolysis temperatures during rabbit feces biochar preparation, biochar pores, channels, and fold structures increased.
The specific surface area, total pore volume, and average pore size of the biochar were determined using the static volumetric method. N2 (99.999%) was used as an adsorbent, and the degassing time was 8 h. The BET results of biochar in Table 1 and Figure 3 showed that the pore sizes of the three types of biochar ranged from 2 nm to 50 nm, and they all belonged to mesoporous materials. Table 1 shows that the specific surface area, total pore volume, and micropore volume of RBC600 were significantly improved compared with those of RBC400 and RBC500. Combined with Figure 3, the surface characteristics and microstructure diagrams can be further comprehensively analyzed. The surface of RBC400 was rare with medium pores and folds, and the surface roughness was low, which resulted in a small specific surface area and total pore volume. Given the increase in the pyrolysis temperature, the pores of RBC500 were opened to a certain extent, and the surface roughness increased, displaying a specific number of folds and pores. When the pyrolysis temperature was further increased, RBC600 formed a more favorable surface structure, and compared with RBC500, the micropores, surface folds, and roughness further improved. The surface characteristic test results also showed that the specific surface area and total pore volume were larger.
The pore structural properties of biochar can also be obtained from the N2 adsorption–desorption curve and pore size analysis during BET characterization. Figure 3 shows the N2 adsorption–desorption curve and pore size distribution curves of three biochar types. Figure 3a displays that the three biochar species had a high adsorption pressure (P/P0 > 0.8). The gas adsorption line rose sharply, the adsorption rate of N2 accelerated significantly, and capillary condensation occurred in mesoporous pores, showing a VI N2 adsorption–desorption isotherm [20]. The hysteresis loops of RBC500 and RBC600 appeared when the relative pressure was between 0.4 and 1.0, and the width of the hysteresis loops was wider than that of RBC400; thus, the pore structure size distributions of RBC500 and RBC600 were wider, and their pore structure was mainly mesoporous [21].
Combined with the BET characterization results of the three types of rabbit manure biochar described above, the specific surface area of rabbit manure biochar showed a gradual increase with the increase in the pyrolysis temperature of rabbit feces biochar. Moreover, the pore size and pore structure of rabbit manure biochar gradually became complex. In general, with the increase in the pyrolysis temperature, the specific surface area, pore size, and pore volume of rabbit manure biochar changed in a direction conducive to the reaction.
The surface functional groups of three types of rabbit manure biochar were characterized by Fourier transform infrared spectroscopy (FT-IR). Before the test, the samples were first pressed and measured in the wavelength range of 400–4000 cm−1 after deducting the background value, and the FT-IR characterization results are shown in Figure 4. As shown in Figure 4, the types of functional groups on the surface of RBC400, RBC500, and RBC600 biochar were similar, and the main characteristic peaks appeared at 3438, 2958, 1630, 1388, and 1093 cm−1. The stretching peak near 3438 cm−1 was the characteristic peak of –OH, and the stretching peak near 2958 cm−1 was the C–H of alkane. The strength of the stretching peak of RBC500 and RBC600 was weak here, indicating that the carbonization degrees of both were high at high pyrolysis temperatures. The C=C or C=O bond of aromatic ring transformation in biomass wood fiber appeared at the stretching peak near 1630 cm−1 [22]; near 1388 cm−1, a small but sharp stretching peak appeared, which was the absorption peak formed by the deformation and vibration between aromatic C–H [23]. The stretching peak near 1093 cm−1 is an ether-type C–O stretching vibration absorption peak [24].
The surface element compositions of RBC400, RBC500, and RBC600 were characterized and analyzed using X-ray photoelectron spectroscopy (XPS) spectra. The test target was a copper target with a scanning range of 10–80° and a step size of 2°/min. Figure 5 depicts the XPS spectra of the three materials, and Table 2 shows the elemental composition of the materials. The XPS also showed that three main characteristic peaks were detected on the three biochar samples, corresponding to O 1 s (532.08 eV), C 1 s (400.08 eV), and N 1 s (248.08 eV), respectively. The elemental composition analysis showed that the main element components of the three biochar surfaces were O, C, and N. As shown in Table 2, with the increase in the pyrolysis temperature of rabbit biochar, the C content on the surface of the generated biochar also increased to a certain extent, which indicates that the increase in the pyrolysis temperature can improve the carbonization degree of rabbit coprobiochar to a certain extent, which matched the FT-IR characterization findings.
The crystal structure information inside rabbit manure biochar can be obtained using X-ray diffraction (XRD). Before the test, appropriate amounts of samples were taken, pressed, and affixed to the sample tray. Furthermore, the samples were placed in the sample chamber of a Thermo Scientific K-Alpha XPS instrument. When the pressure in the sample chamber was less than 2.0 × 10⁻⁷ mbar, the samples were sent to the analysis chamber. The spot size, working voltage, and filament current were 400 µm, 12 kV, and 6 mA, respectively. The full-spectrum scanning energy and step size were 150 eV and 1 eV, while the narrow-spectrum scanning energy and step size were 50 eV and 0.1 eV, respectively. The XRD characterization results are shown in Figure 6. After the phase index of three types of rabbit manure biochar was determined, two types of crystal structures were mainly found on their surface: SiO2 (PDF card number 46-1045) and graphitic carbon (PDF card number 26-1076). Thus, the three types of biochar produced graphitized crystal structures after high-temperature pyrolysis. Further comparison revealed that, unlike those of RBC400 and RBC500, the peaks of RBC600 were significant and sharp at 26.5°, indicating that its particle size and crystallinity were likely greater.

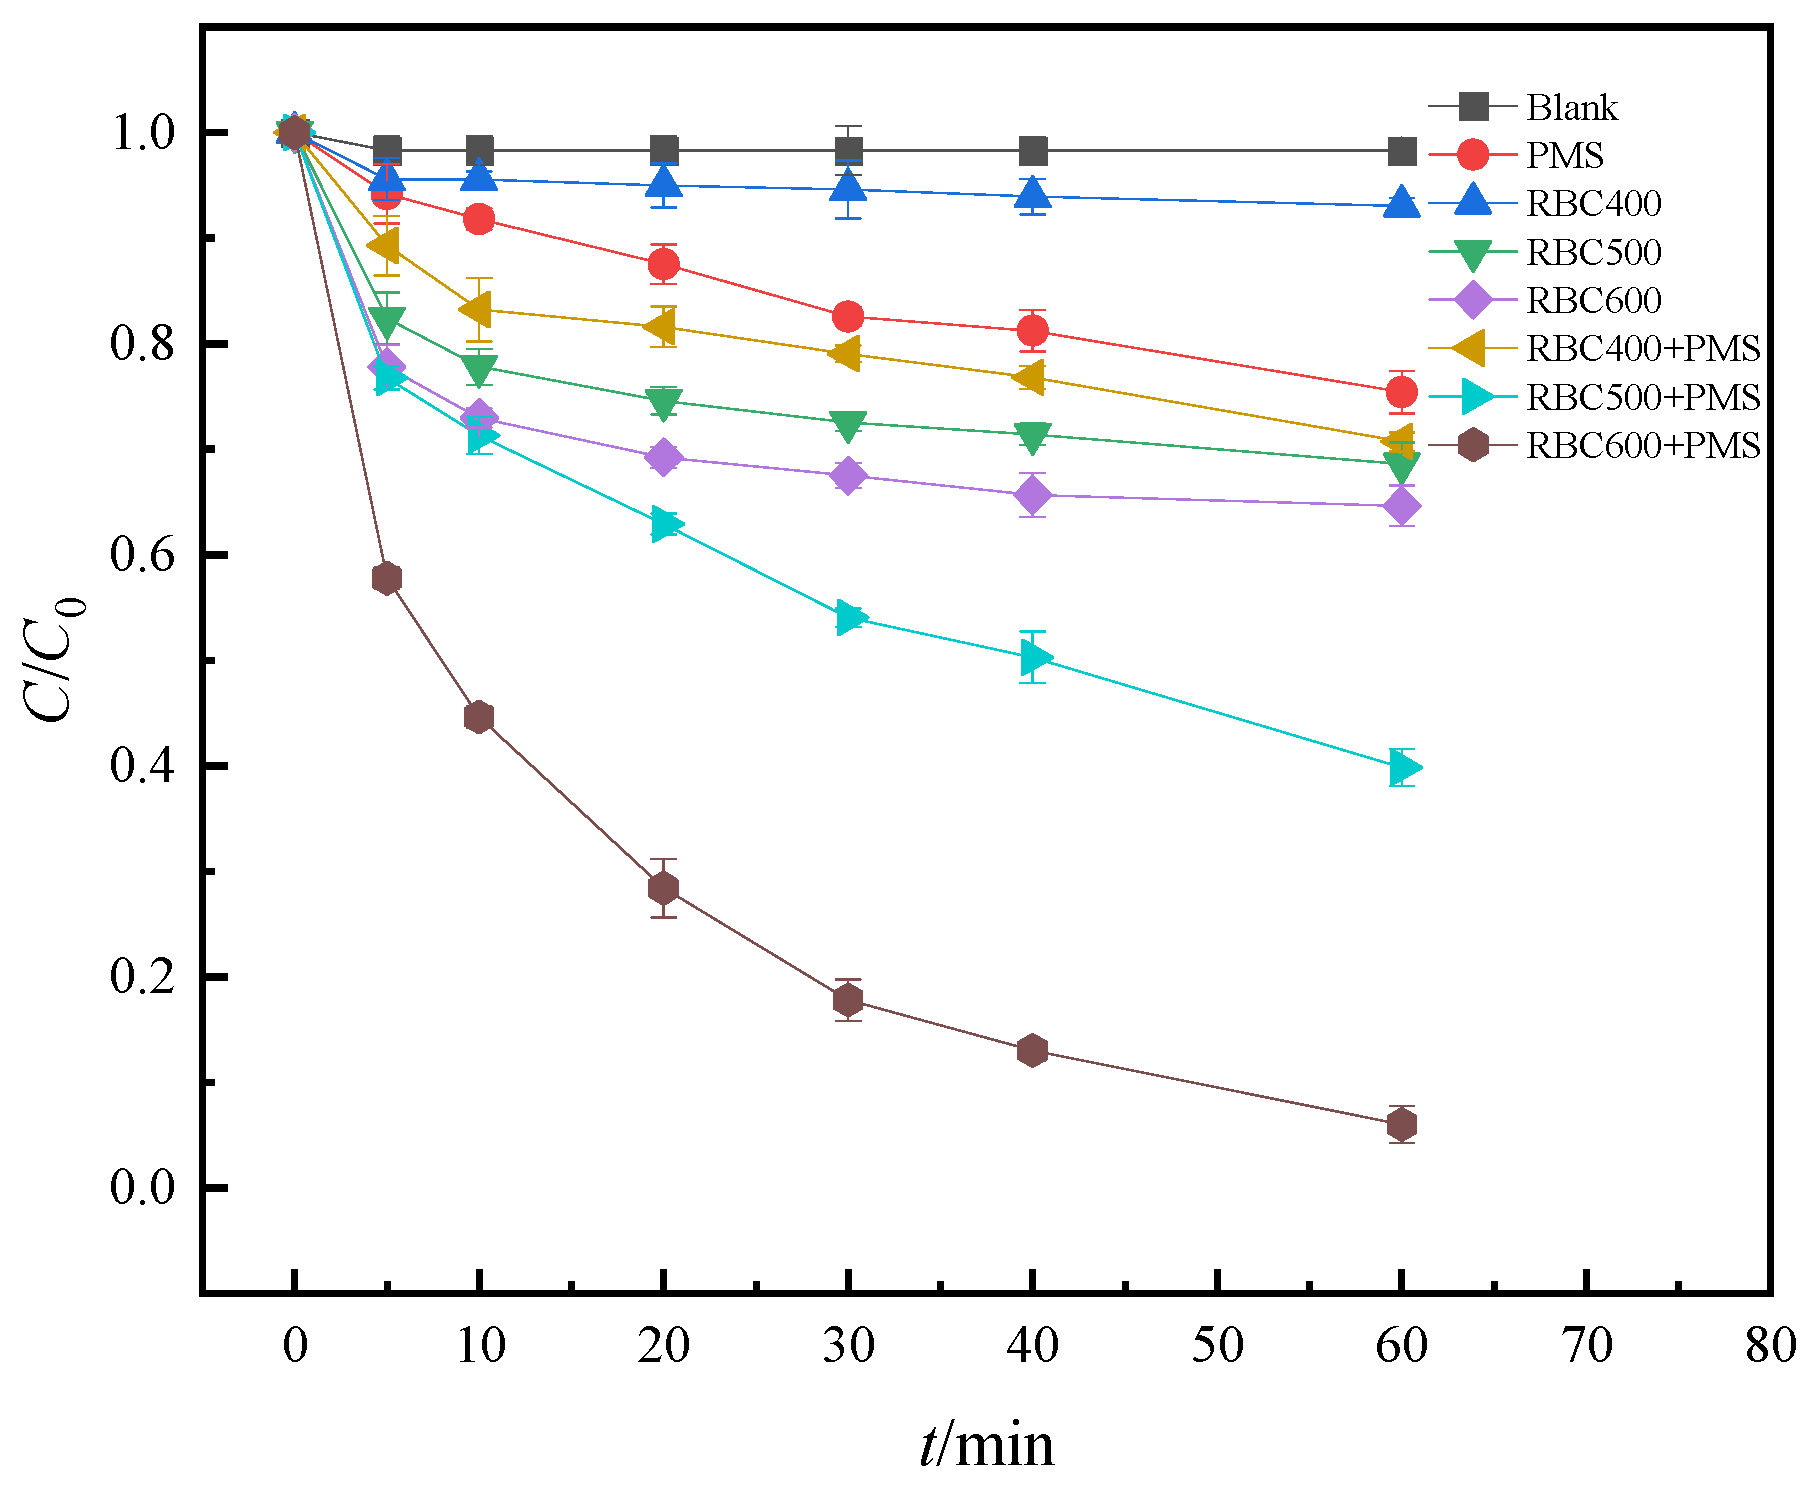
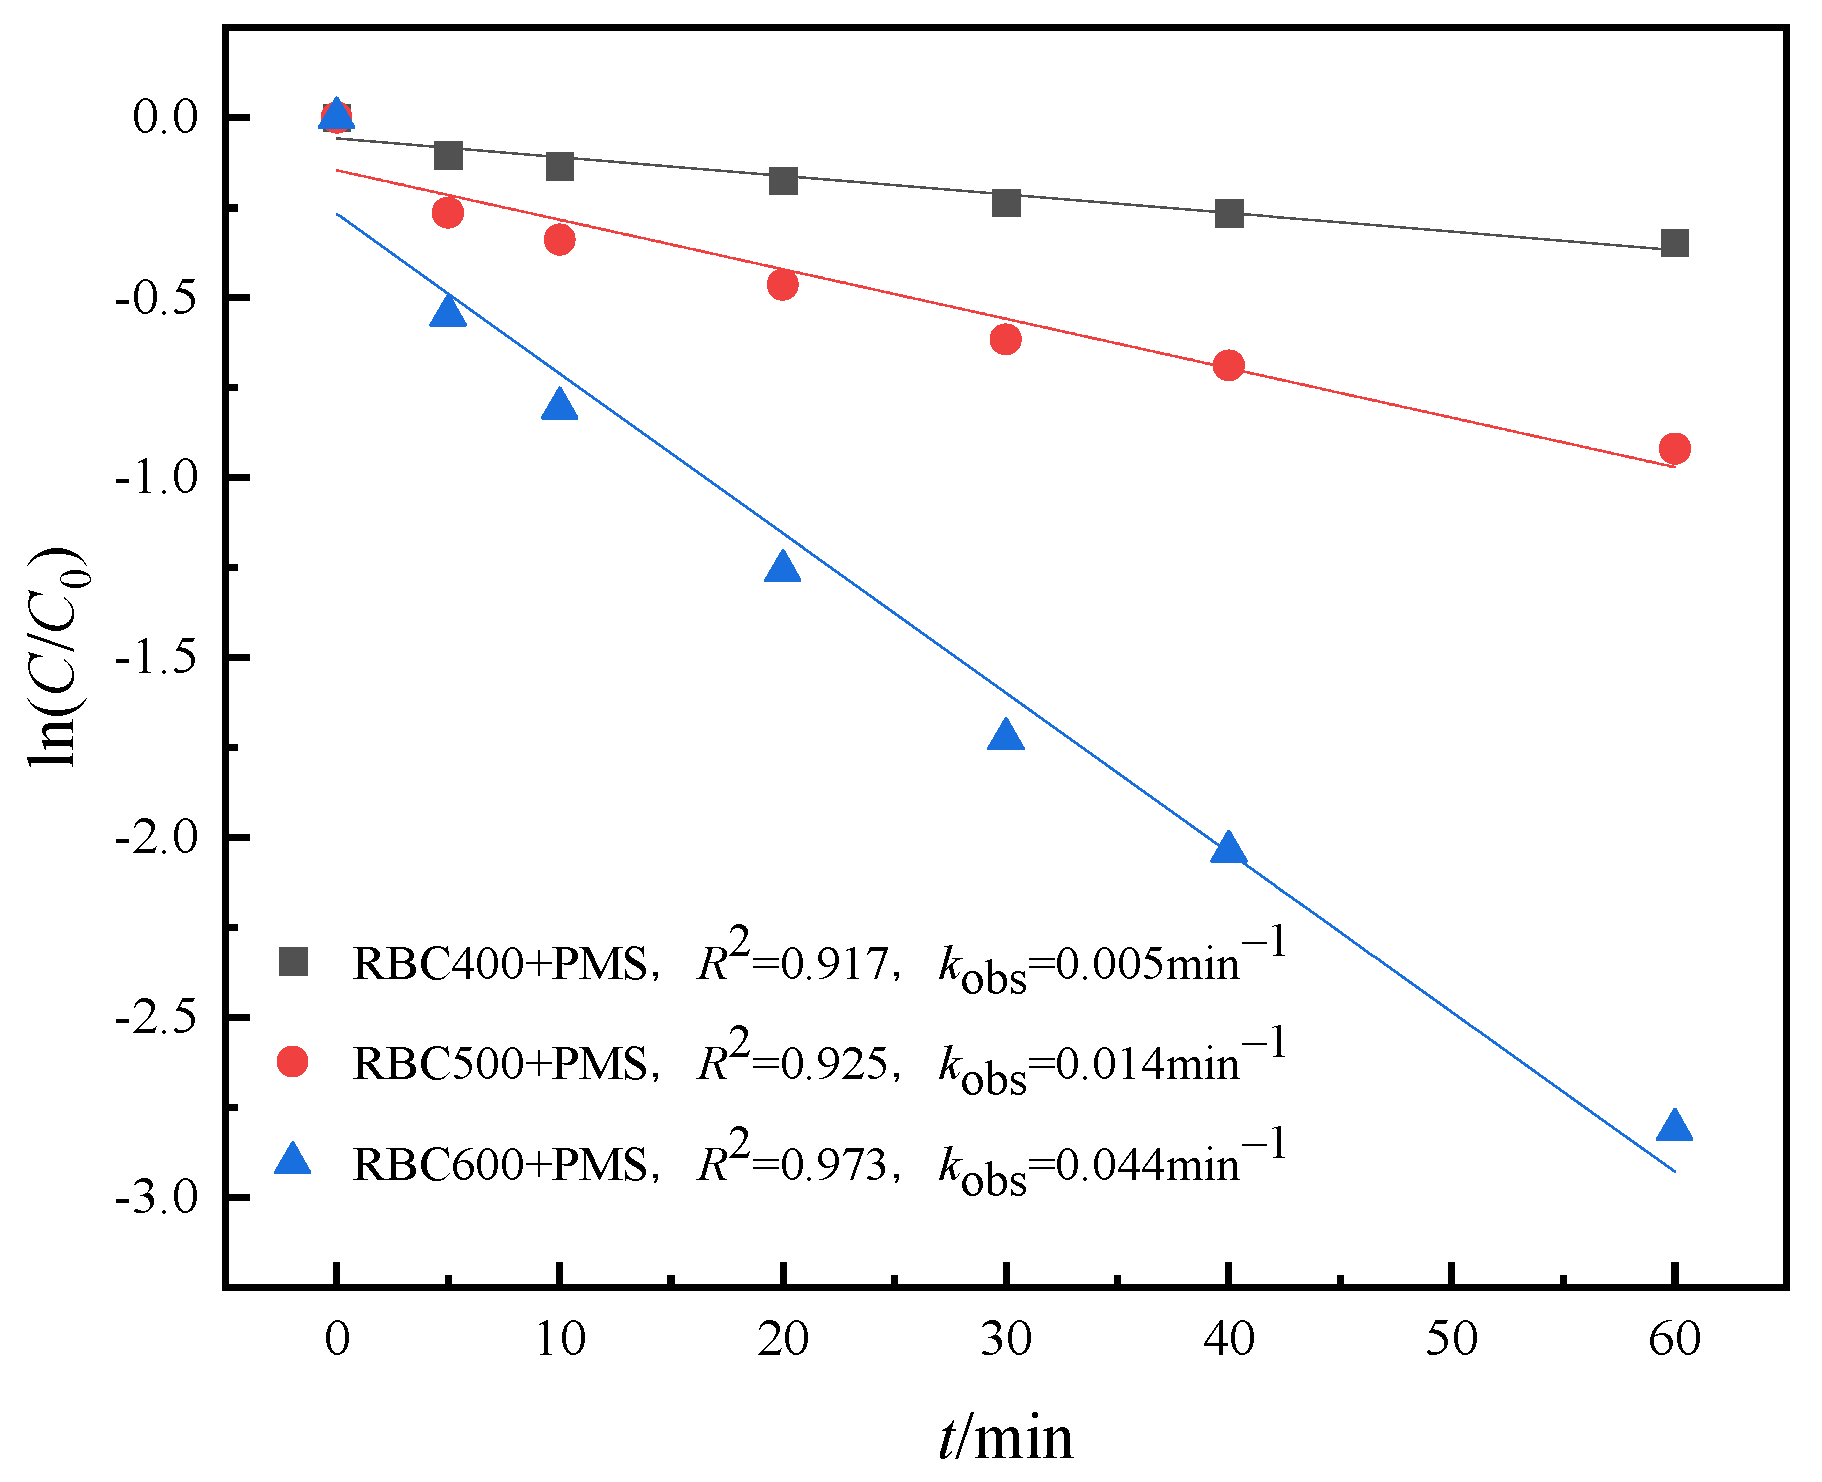
3.2. Evaluation of Catalyst Activity

For investigating the differences among the hB removal performance of different biochars and their activated PMS, this part of the experiment explored the RhB removal effect of different systems under the same reaction conditions, and the experimental results are depicted in Figure 7. The removal efficiencies of RhB in different systems from low to high were as follows: blank (1.7%), RBC400 (6.94%), PMS (24.61%), RBC400 + PMS (29.31%), RBC500 (32.39%), RBC600 (35.28%), RBC500 + PMS (60.15%), and RBC600 + PMS (93.98%). According to the analysis of the experimental results, the degradation rate of RhB in the blank control group was 1.7%. Given that the experiment was conducted under normal indoor light, a small amount of RhB was possibly photolyzed in this environment. However, the degree of photolysis was low and negligible. The addition of biochar alone can adsorb RhB, and RBC600 showed the best adsorption performance. RhB in water can be oxidized by a single PMS system because a small amount of SO4·− is produced through the hydrolysis of PMS in the solution, and RhB can be oxidized by SO4·− [25]. The RBC/PMS systems can degrade RhB in water more effectively than the RBC or PMS systems and the degradation rate of RhB in the RBC600/PMS system was significantly higher than that in the RBC400/PMS and RBC500/PMS systems. According to the analysis of Table 1 and Figure 3, this is due to the larger specific surface area and more abundant surface functional groups (C=O) of RBC600, which can provide more activation sites and facilitate the catalytic degradation reaction.
To better study the reaction kinetics of RhB degradation in the RBC/PMS system, a pseudo-first-order kinetic model was introduced to perform kinetic fitting on the reaction results of RhB catalytic degradation in the RBC/PMS system (Figure 8).
The fitting results revealed that the degradation process of RhB in RBC400/PMS, RBC500/PMS, and RBC600/PMS can follow well the pseudo-first-order reaction kinetics, and the corresponding kobs of the three systems were 0.005, 0.014, and 0.044 min−1, respectively. These findings show that the RBC600/PMS system had a higher apparent rate constant than the other two systems. To better explore the performance, we used the RBC600/PMS system under optimal reaction conditions and the reaction mechanism of RhB degradation by rabbit manure biochar-activated PMS for follow-up experiments.

3.3. Analysis of Adsorption Influencing Factors

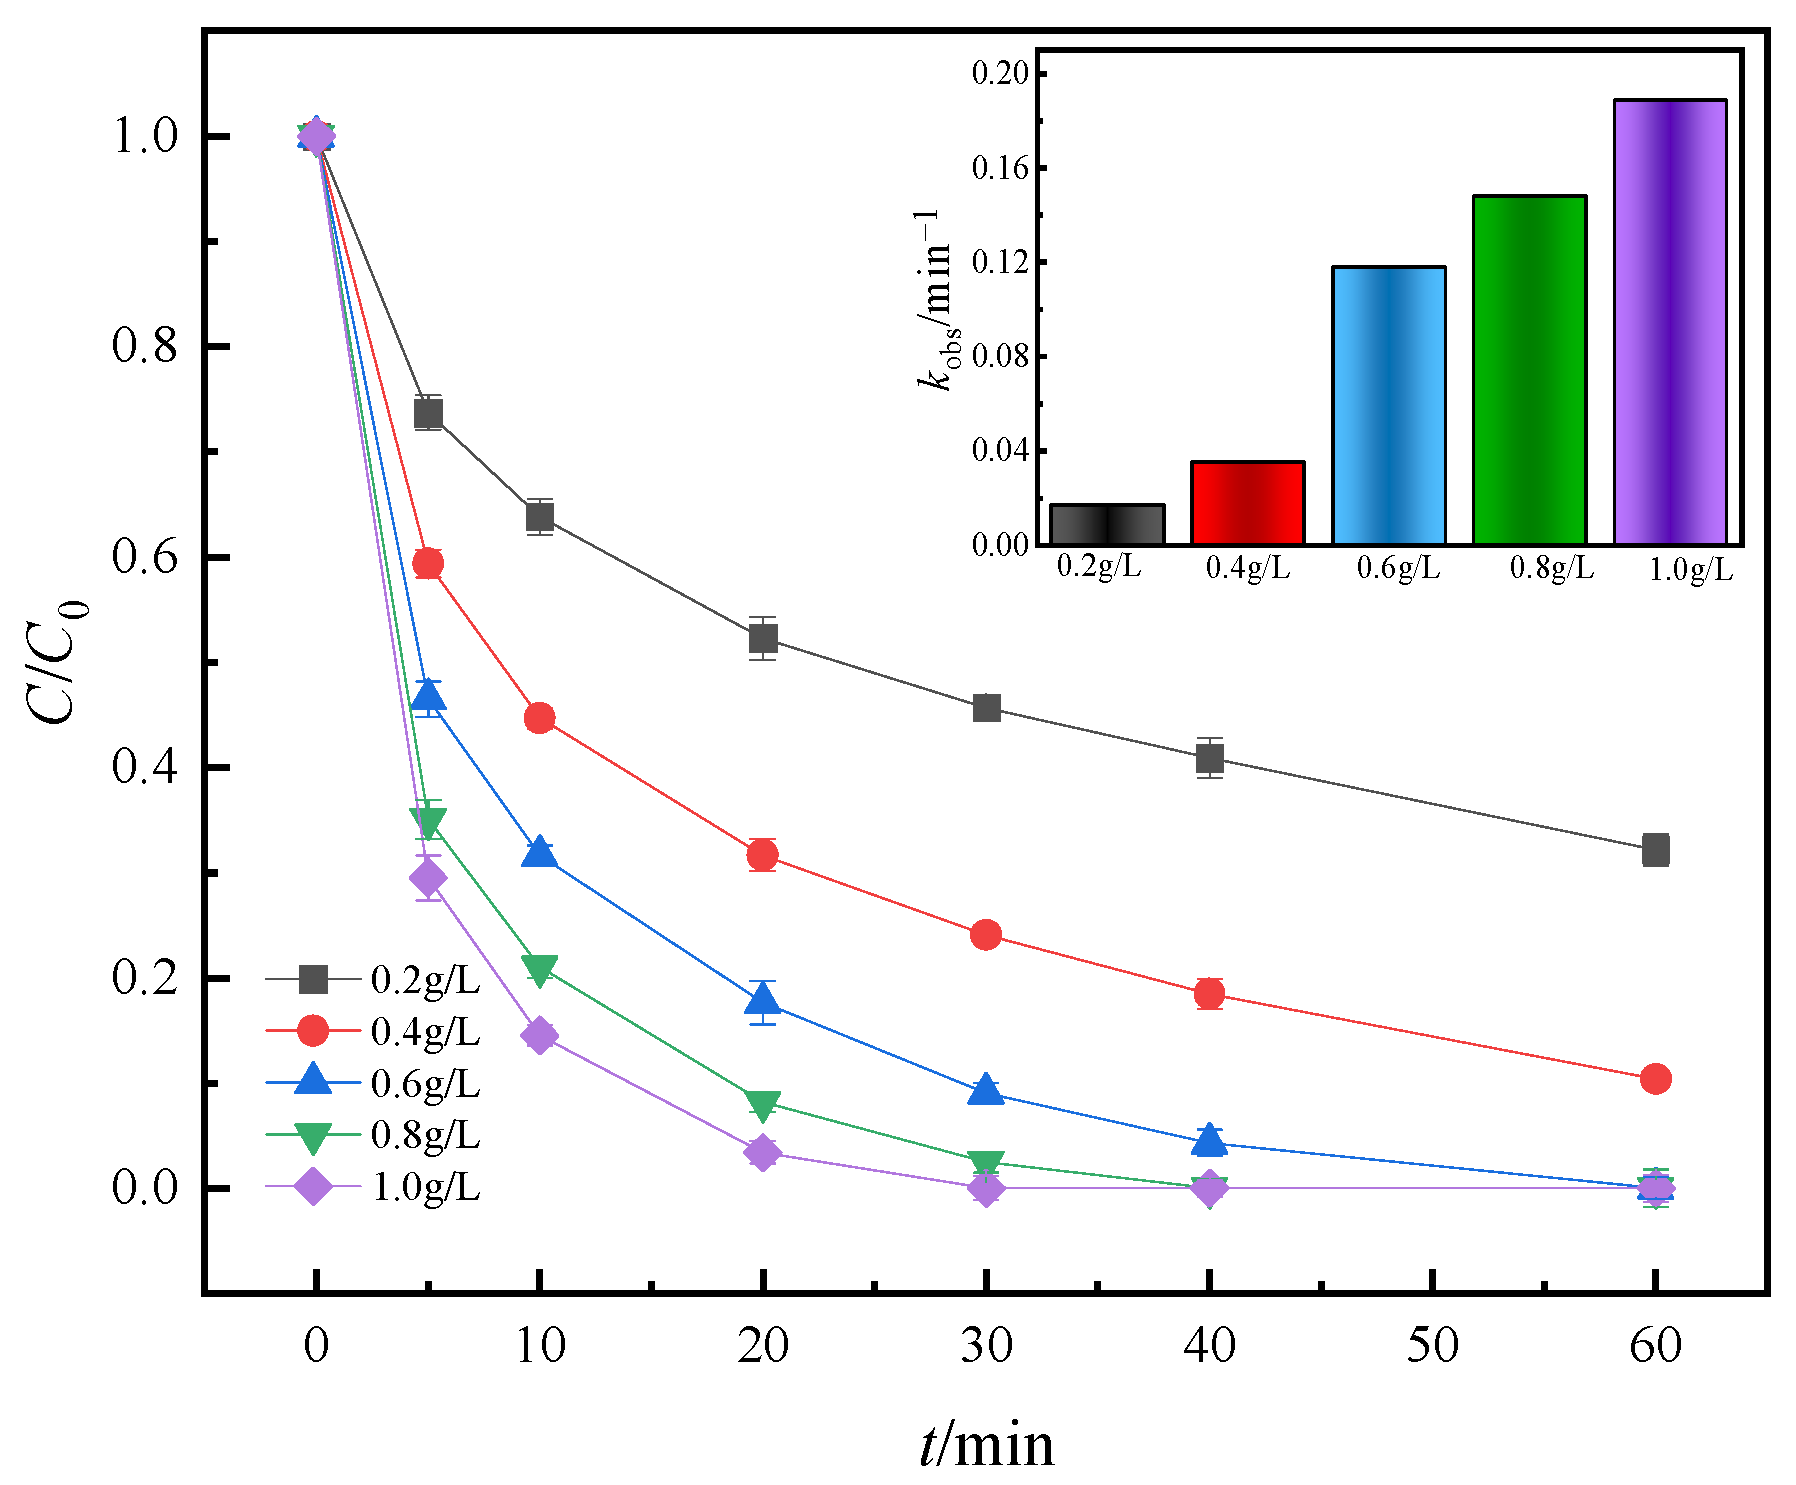
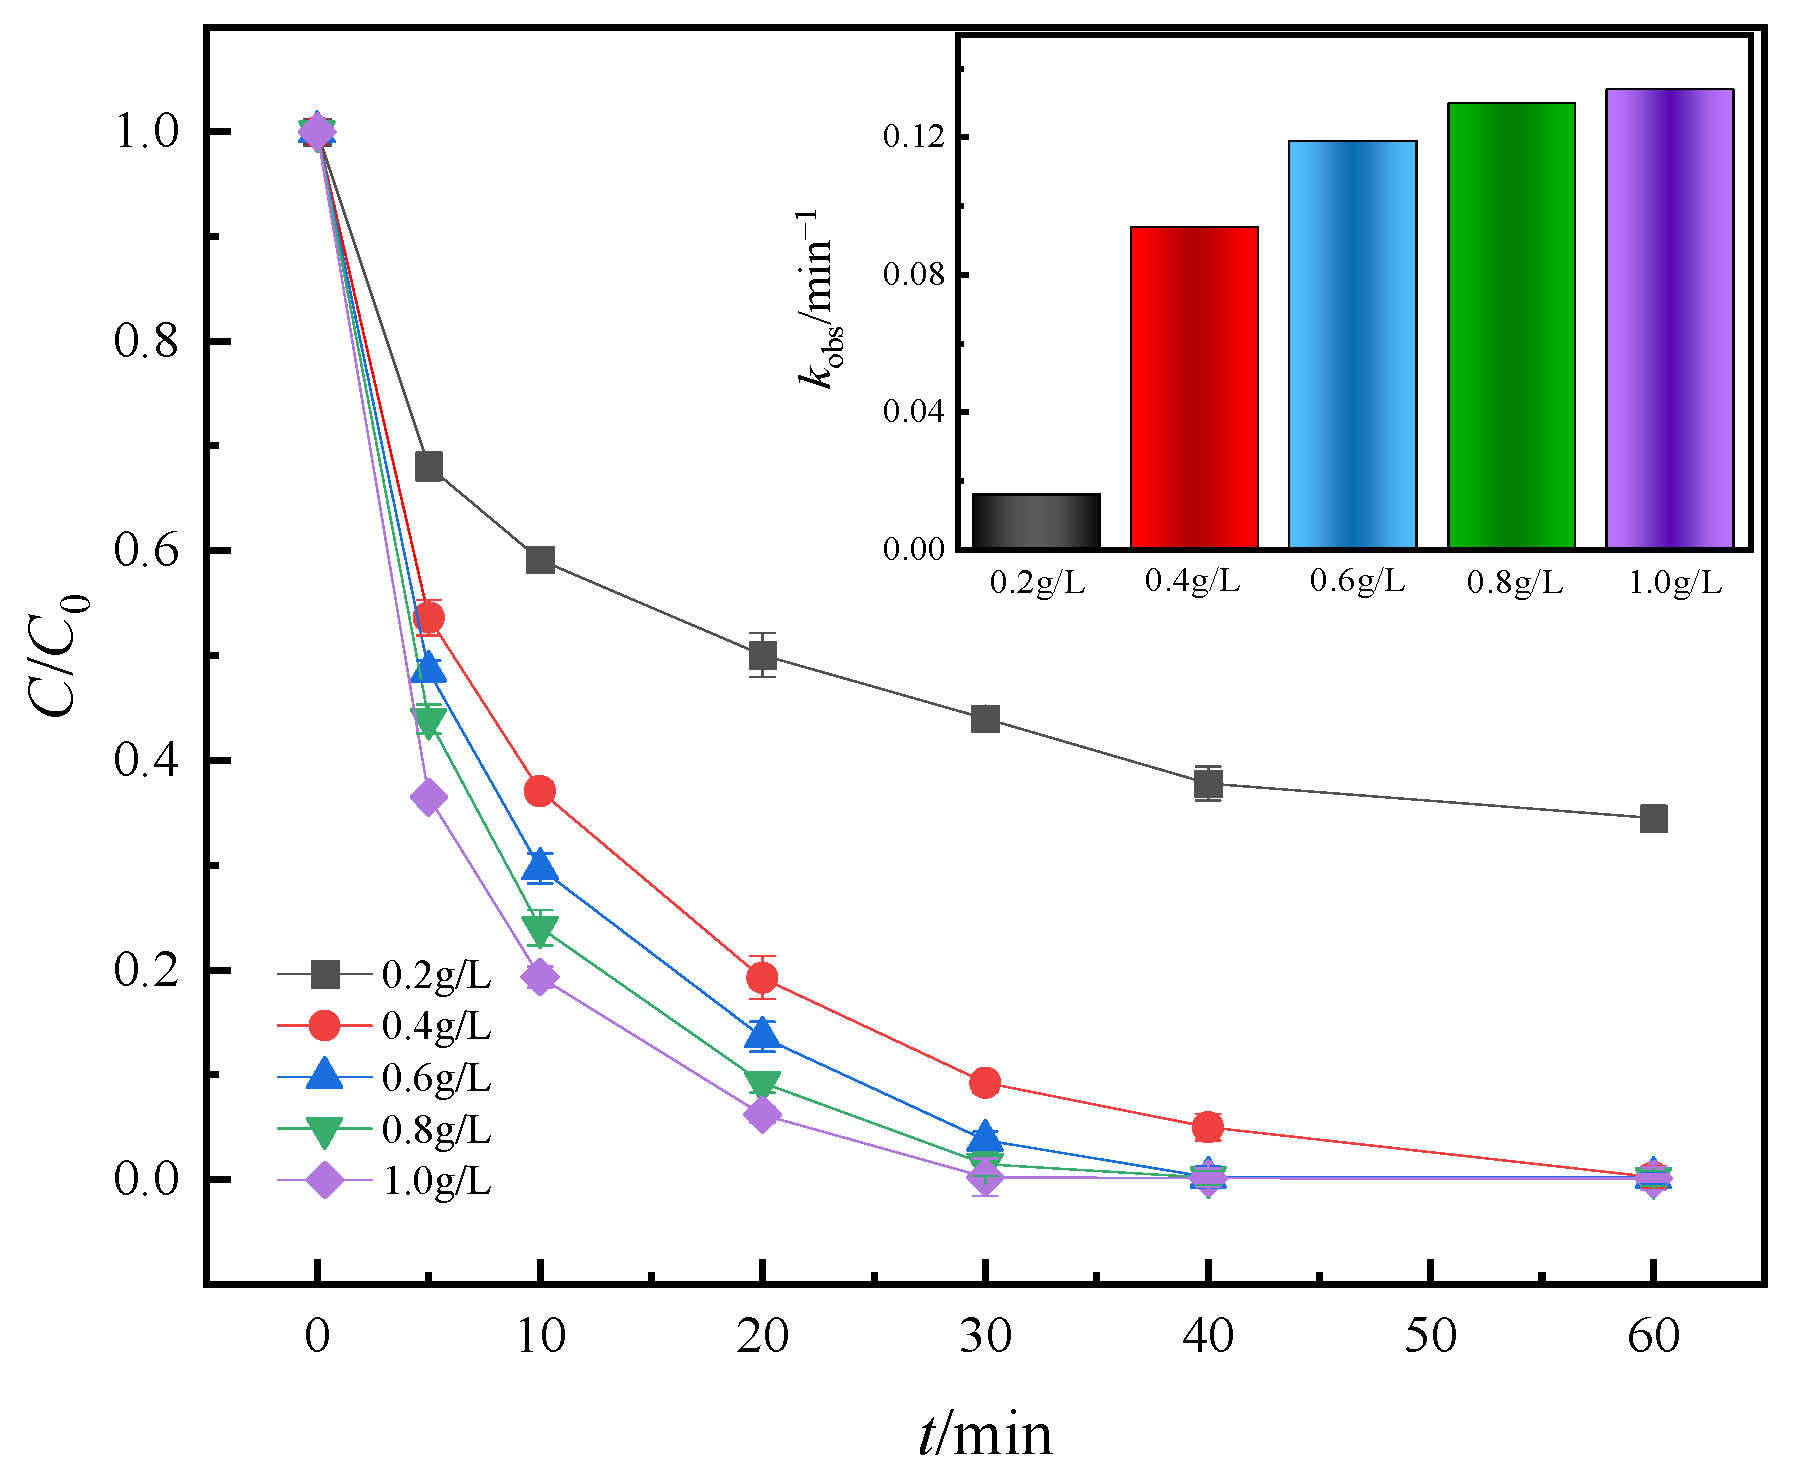
3.3.1. Effect of Biochar Dosage

Biochar dosage is an essential factor affecting the process of biochar-activated PMS in degrading pollutants. It determines the cost input required by the system to degrade pollutants to a certain extent. Therefore, it is crucial to select the most appropriate biochar dosage. The experimental results of the influence of biochar dosage are shown in Figure 9.
As depicted in Figure 9, when the biochar dosage increased from 0.2 g/L to 0.6 g/L, the degradation rate of RhB increased from 67.83% to 99.97%, showing an evident upward trend, and the degradation rate of kobs increased from 0.017 min−1 to 0.118 min−1. On the one hand, with the increase in biochar dosage, the biochar surface area and the number of adsorption sites involved in pollutant adsorption increased, and the adsorption performance was gradually enhanced. On the other hand, increasing biochar dosage can provide more activation sites for PMS and improve the catalytic degradation efficiency of RhB in the RBC600/PMS system. When the dosage of RBC600 increased from 0.6 g/L to 1.0 g/L, the reaction kobs increased from 0.118 min−1 to 0.189 min−1, but the catalytic degradation efficiency did not improve significantly. This result may be due to the limited number of free radicals generated by biochar-catalyzed PMS at certain dosages of PMS. With the increase in the dosage of RBC600, the excess active sites provided by biochar cannot be effectively utilized, and the degradation efficiency of RhB cannot be significantly increased by increasing the dosage of biochar; this condition resulted in a “plateau” in the degradation rate of RhB. Huong et al. [26] also reached a similar conclusion in their study on the degradation of organic contaminants in wastewater by activating PMS with rice husk biochar.

3.3.2. Effect of PMS Dosage

The dosage of PMS is one of the key parameters of persulfate advanced oxidation technology, and its dosage largely determines the amount of free radicals produced in the system, which has an important influence on the degradation efficiency of RhB. Figure 10 shows the effect of PMS dosage on the degradation efficiency of RhB.
As presented in Figure 10, with the increase in PMS dosage, the degradation rate of RhB and kobs also improved. When the PMS dosage increased from 0.2 g/L to 1.0 g/L, kobs increased from 0.016 min−1 to 0.134 min−1. This result was due to the continuous increase in the rate and amount of free-radical production with the increase in PMS, which increased the chance of free-radical reaction with biochar surface active site contact. However, when the dosage of PMS increased from 0.2 g/L to 0.4 g/L, the degradation efficiency of RhB increased by 34.26%. The apparent rate constant also increased by 4.875 times, from 0.016 min−1 to 0.094 min−1. However, when the dosage of PMS increased from 0.4 g/L to 1.0 g/L, the degradation efficiency and apparent rate constant of RhB were not significantly improved, and those of kobs increased by 42.6%, which was relatively slow compared with the 4.875 times mentioned above. This experimental result is consistent with the experimental finding of Chen et al. [27], who used straw-derived biochar to activate PMS to degrade the antibiotic ofloxacin. On the one hand, when the dosage of biochar is certain, the number of biochar surface active sites is limited. When these active sites are occupied, excessive free radicals cannot perform desirable functions in pollutant degradation. On the other hand, the excess free radicals generated by excess PMS may undergo self-quenching (Equations (3)–(5)).
SO4·− + HSO5 → SO5·− + HSO4
OH + HSO5 → SO5·− + H2O
SO4·− + H2O + HSO5 → HO2 + 2HSO4

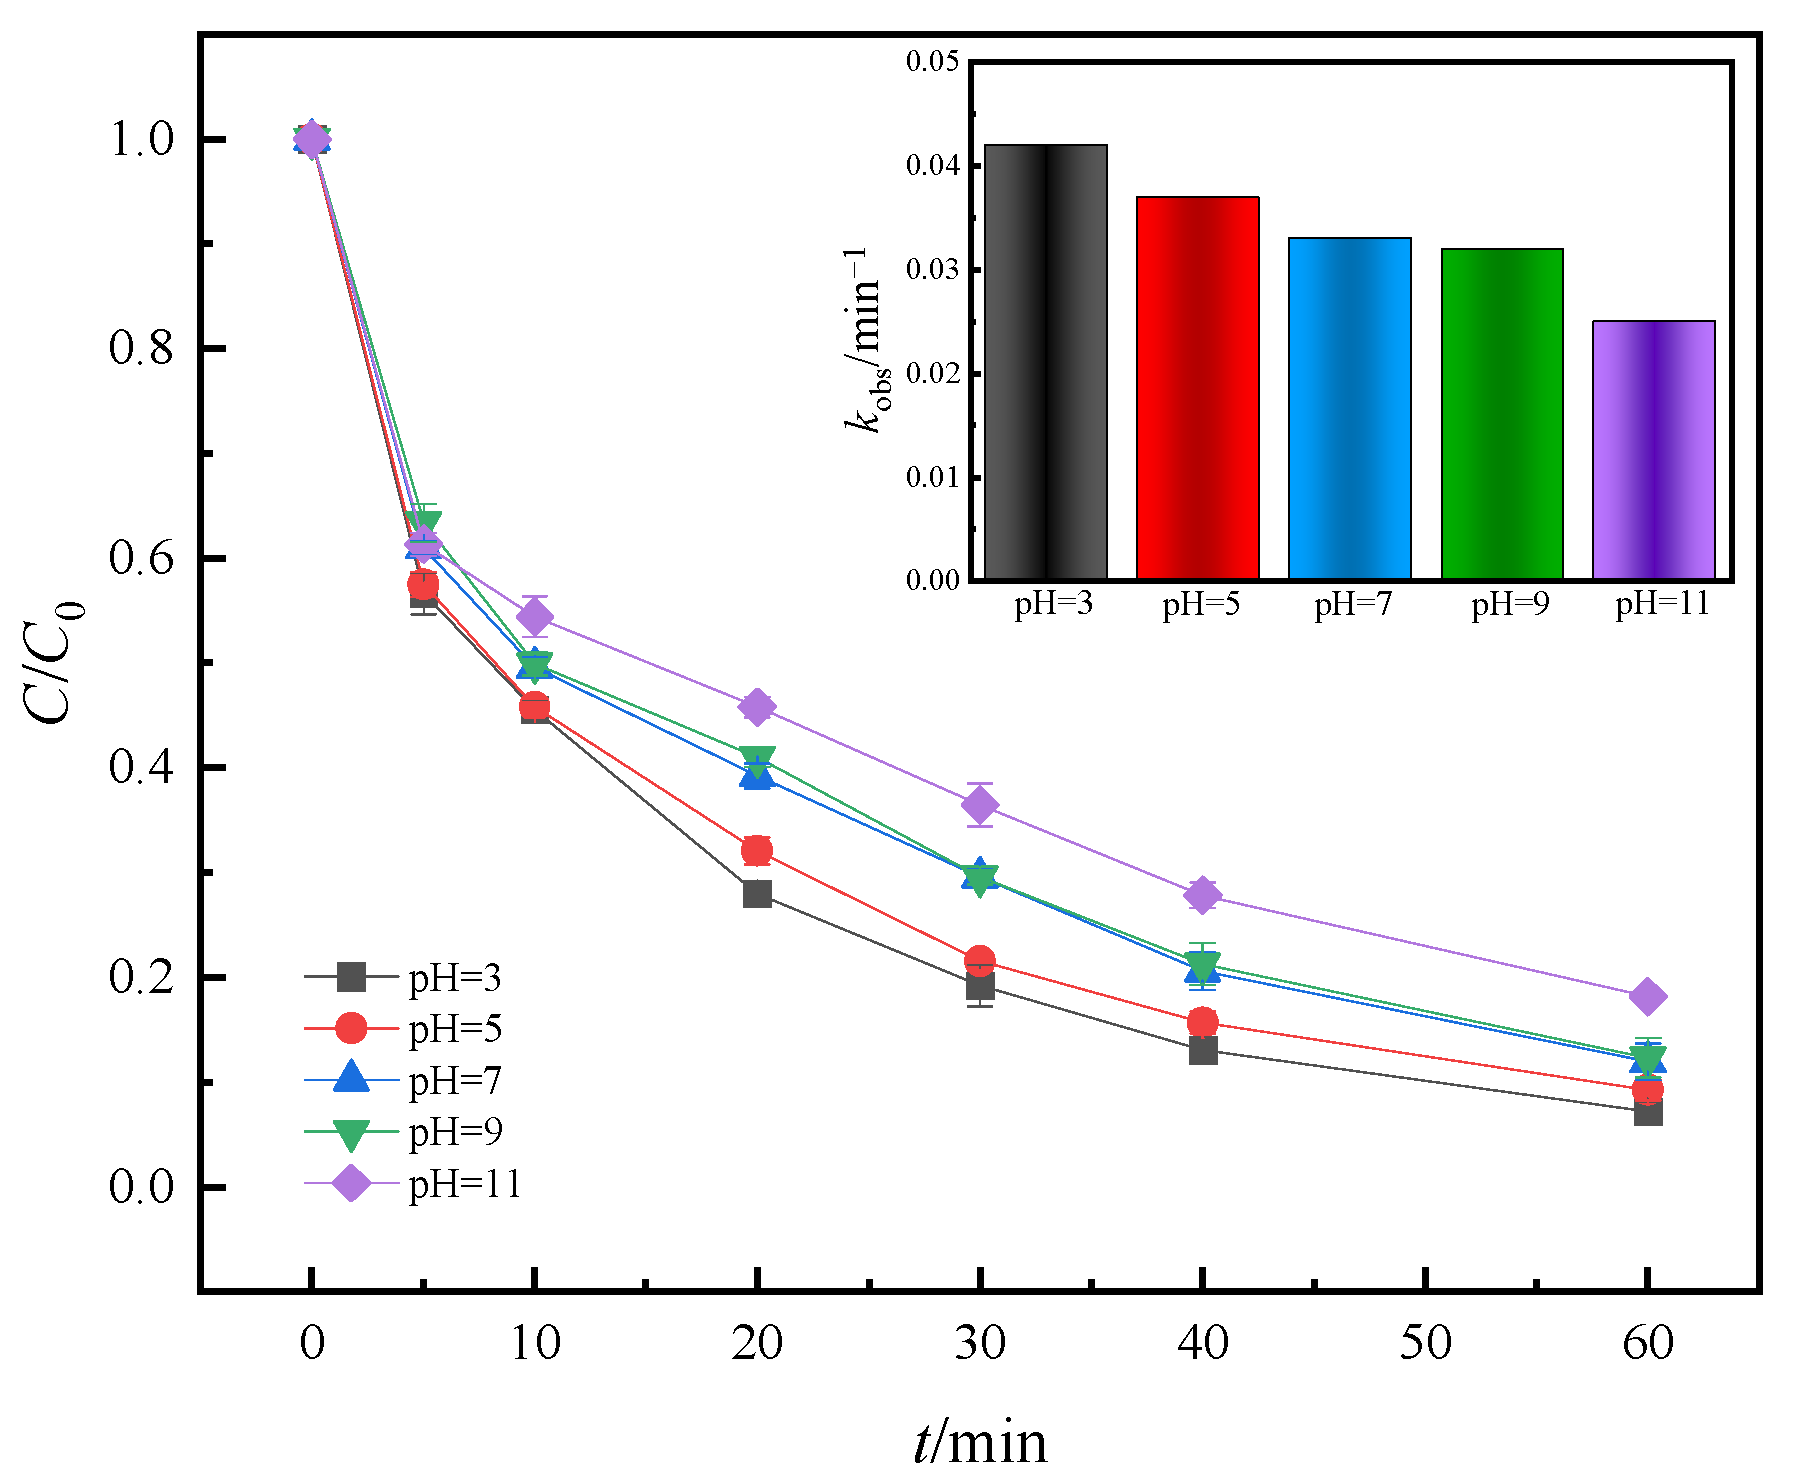
3.3.3. Effect of the Initial pH Value of the Solution

The initial pH of the solution is also an important factor affecting the degradation of pollutants in the persulfate system. Within the range of pH set in the experiment, the degradation efficiency of RhB in the system varied (Figure 11).
When the initial pH of the reaction increased from 3 to 11, the degradation rate of RhB decreased by 10.91%, and the corresponding kobs were 0.042, 0.037, 0.033, 0.032, and 0.025 min−1. The experimental results indicated that acidic conditions were more favorable for the reaction because the free radicals involved in the reaction in the solution changed with the pH. When the pH of the solution is lower than 9, more H+ in the system can be activated efficiently to produce more SO4·−. With the increase in pH, SO4·− gradually transformed into ·OH (Equations (6) and (7)). When the pH of the solution was greater than 9, ·OH quenched SO4·−. Thus, the SO4·− with a stronger oxidation capacity in the system became ·OH with a weaker oxidation capacity and shorter half-life. Therefore, in RhB degradation by RBC600/PMS, the degradation rate of RhB decreased with the increase in pH [28,29]. Wang Yan et al. [30] also came to a similar conclusion in their study on the degradation of golden oranges by persulfate. On the other hand, biochar can better adsorb RhB under acidic conditions, but when the solution pH is low, the biochar surface functions through group protonation. RhB exists in the form of a cation, which is conducive to the ion exchange between biochar and RhB and improves the RhB degradation rate. However, when the pH of the solution is higher, RhB exists as a zwitterion and forms a macromolecular dimer, which is difficult to be adsorbed by biochar [31]. In general, the RBC600/PMS system has various pH applications and a good degradation effect on RhB in the range of pH 3–11 (the degradation rate is over 80%).
SO4·− + H2O → HSO4 + ·OH
SO4·− + OH → SO42− + ·OH

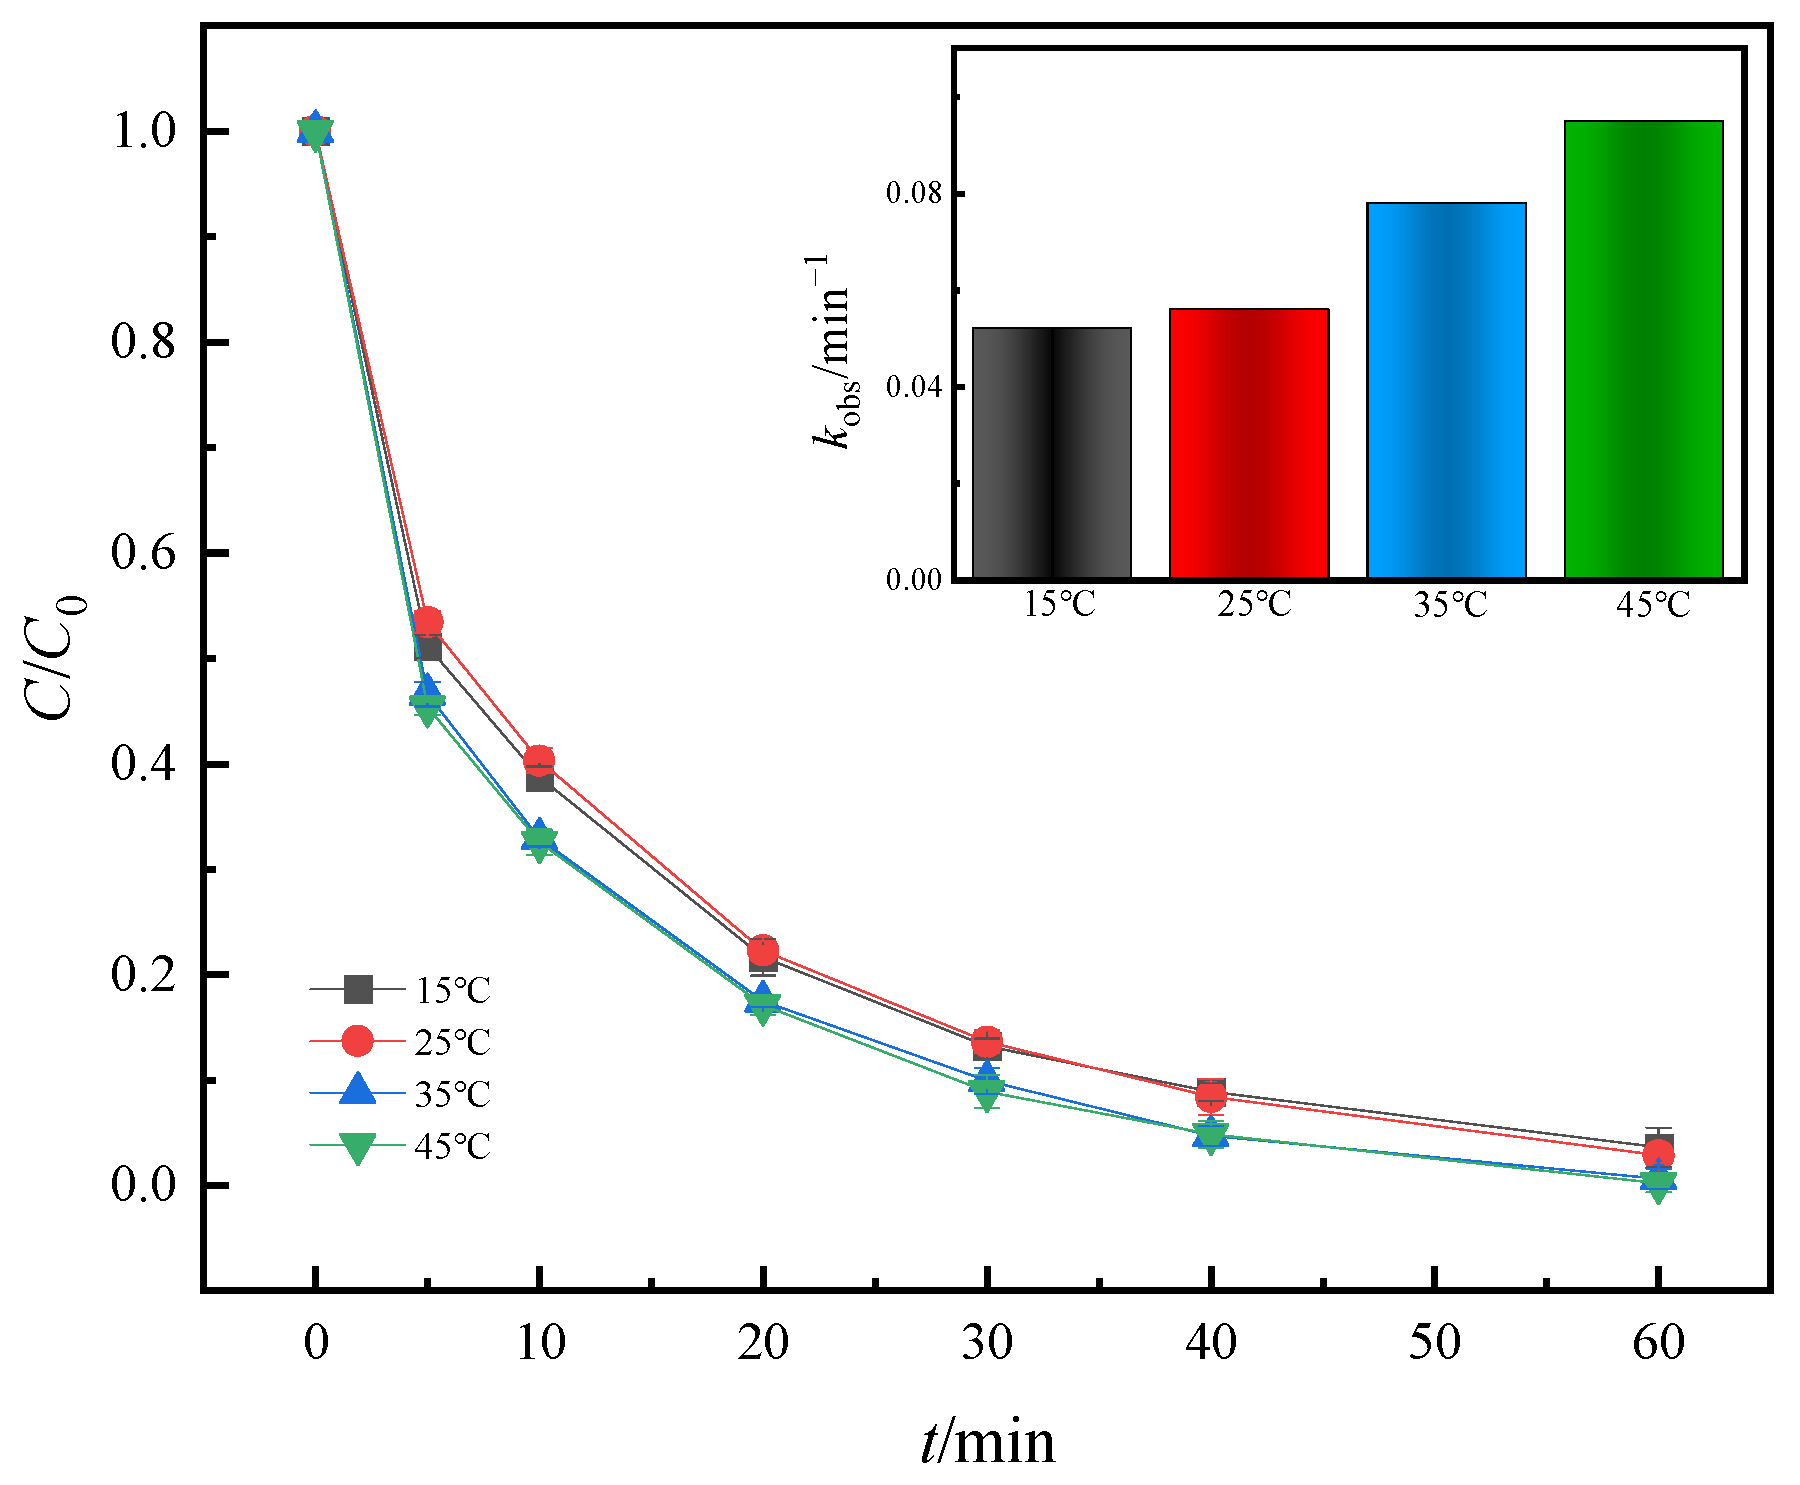
3.3.4. Effect of Reaction Temperature

The results showed that PMS could be activated by heating, and the increase in temperature may further improve the degradation effect of the RBC600/PMS system on RhB. This part of the experiment explored the effect of reaction temperature on RhB degradation efficiency, and the experimental results are shown in Figure 12.
As shown in Figure 12, the effect of the reaction temperature change (15–45 °C) on the degradation of RhB in the RBC600/PMS system was very limited, and the degradation rate of RhB in the RBC600/PMS system can reach more than 90% at four reaction temperatures. Although the increase in reaction temperature had no evident effect on the final degradation efficiency of RhB, the apparent rate constant increased with the increase in reaction temperature. The kobs at 15 °C, 25 °C, 35 °C, and 45 °C were 0.052, 0.056, 0.078, and 0.095 min−1, respectively, which indicated that the increase in the reaction temperature could accelerate the reaction. Shi Chenfei et al. [32] showed that compared with rice straw biochar activation of PS, the efficiency of thermal activation was lower. Therefore, the activation efficiency of rabbit manure biochar on PMS was significantly higher than that of thermal activation. In this study, RhB degradation was effectively achieved by activating PMS with rabbit manure biochar. Therefore, significant improvement of the RhB degradation efficiency by thermal activation of PMS was difficult compared with PMS activation by biochar.

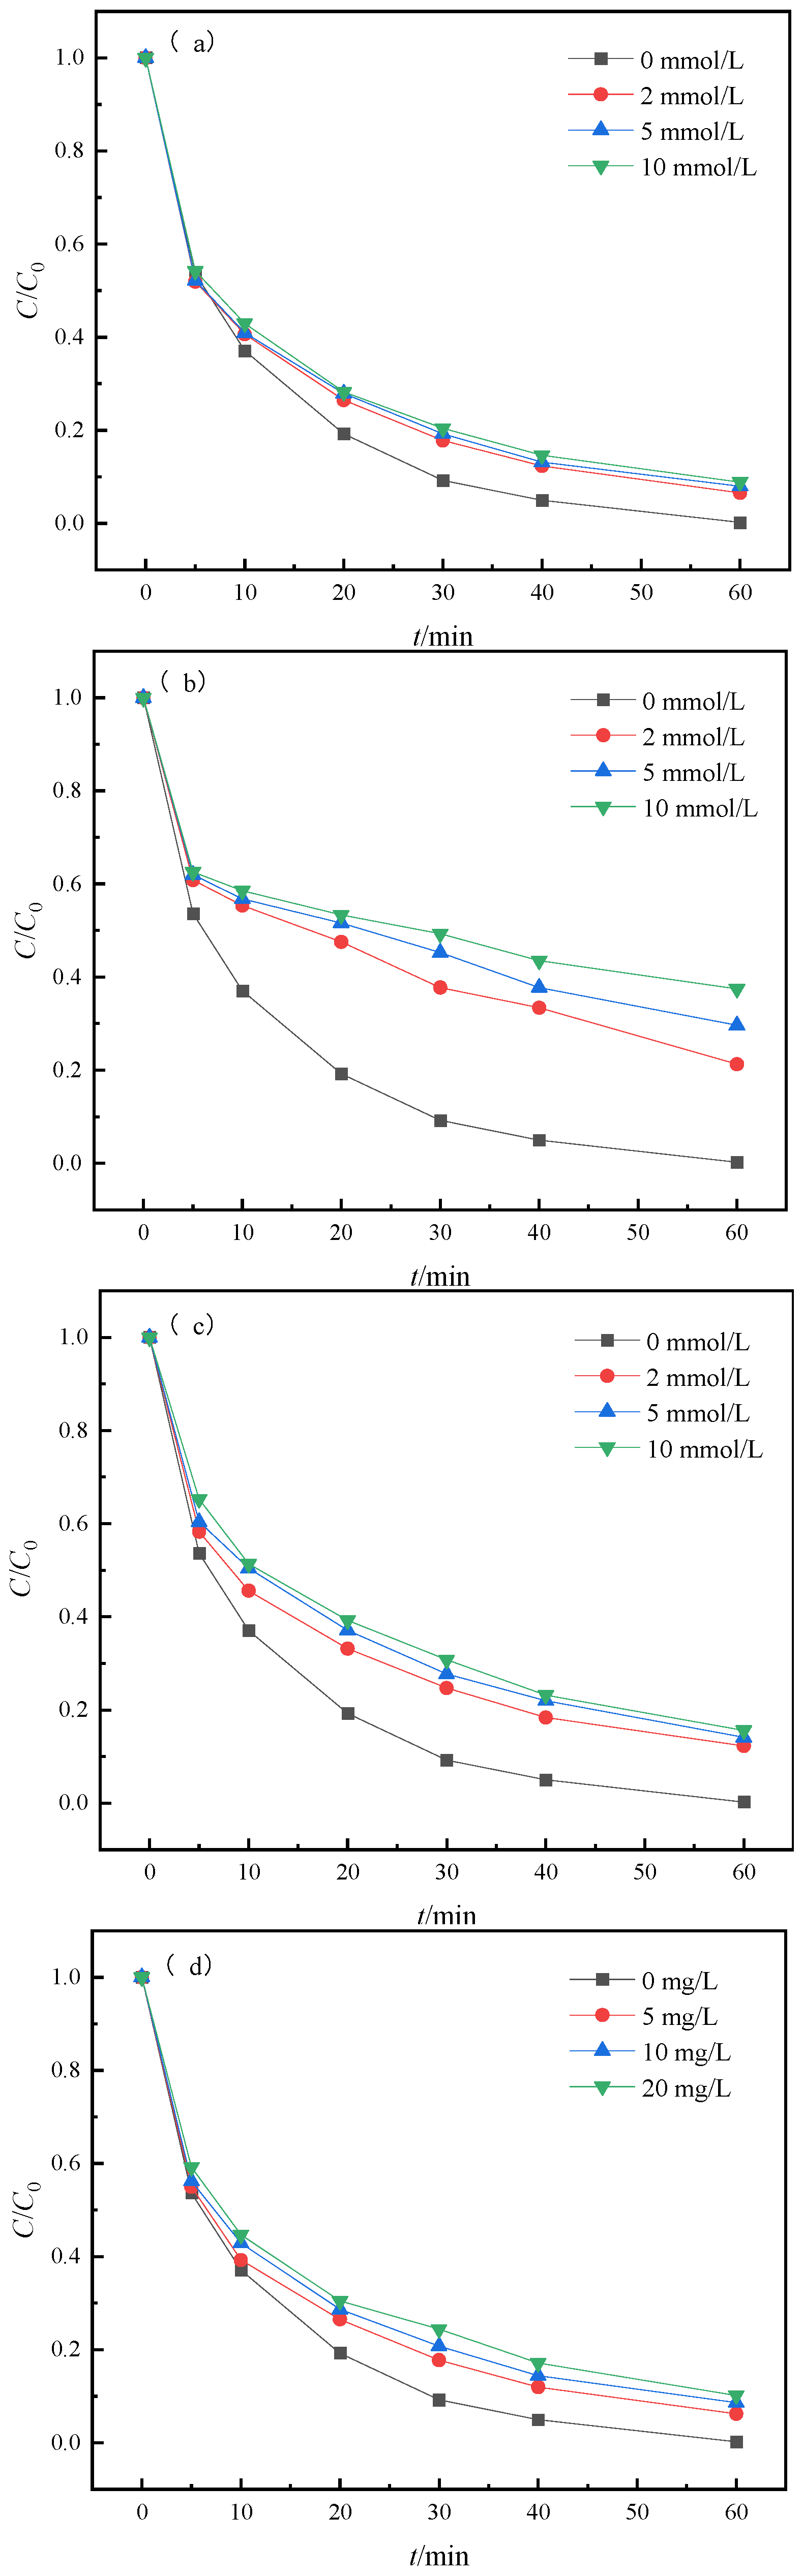
3.3.5. Effect of the Water Background Component

Various background components in water may have different degrees of influence on the degradation of RhB by the system. In this experiment, four common background components (Cl, HCO3, NO3, and HA) in water were selected to explore the degradation performance of RhB by the system under different concentrations of background components. Figure 13 shows the influence of water background components on RhB degradation efficiency.
As shown in Figure 13, the inhibitory effects of Cl, HCO3, NO3, and HA on the degradation of RhB in the system were HCO3 (37.23%), NO3 (15.52%), HA (9.96%), and Cl (8.63%) in descending order. As shown in Figure 13a, when Cl concentration increased from 0 mmol/L to 10 mmol/L, the degradation rate of RhB decreased from 99.79% to 91.16%, showing a slight inhibition. kobs decreased from 0.094 min−1 to 0.042, 0.039, and 0.038 min−1, respectively. This finding was due to the consumption of ·OH, SO4·−, or HSO5 by Cl to form Cl· and Cl2·− with lower activities (Equations (8)–(11)) [33,34,35,36]. Guan et al. [37] also reached a similar conclusion in their experiment on the influence of chloride ions on the UV/PMS system:
SO4·− + Cl → SO42− + Cl·
HSO5 + Cl → SO42− + HOCl
HSO5 + 2Cl + H+ → SO42− + Cl2 + H2O
·OH + Cl + H+ → HOCl·−
As shown in Figure 13b, when the concentration of HCO3 increased from 0 mmol/L to 10 mmol/L, the degradation rate of RhB decreased from 99.79% to 62.56%, indicating a decrease of approximately 37.31%. kobs decreased from 0.094 min−1 to 0.022, 0.016, and 0.013 min−1, showing an evident downward trend; this result indicated that the presence of HCO3 significantly inhibited the degradation of RhB [38]. This finding can be explained by the rate constant from the work of ·OH. Kang et al. [39] observed that the rate constant of HCO3 was greater than that of OH and that it had a certain scavenging effect on ·OH (Equation (12)). In addition, HCO3 reacted with SO4·− to produce CO3·− (Equation (13)) with a lower redox potential, which inhibited the degradation of RhB to a certain extent.
SO4·− + HCO3 → SO42− + CO3·− + H+
·OH + HCO3 → CO3·− + H2O
Figure 13c shows that when the NO3 concentration increased from 0 mmol/L to 10 mmol/L, the degradation rate of RhB decreased from 99.79% to 82.38%. This result indicated that the presence of NO3 inhibited the degradation of RhB to a certain extent. Such a result was observed because the NO3 in the solution reacted with SO4·− and ·OH to form NO3 (Equations (14) and (15), respectively), and the redox potential of NO3 is lower than that of ·OH and SO4·− [40], thus reducing the degradation rate of RhB.
NO3 + SO4·− → NO3· + SO42−
NO3 + ·OH → NO3· + HO
Figure 13d shows that when the HA concentration increased from 0 mg/L to 20 mg/L, the degradation rate of RhB decreased from 99.79% to 89.83%. kobs decreased from 0.094 min−1 to 0.043, 0.038, and 0.035 min−1, respectively, indicating that the presence of HA slightly inhibited the degradation of RhB. The inhibitory effect of HA is mainly reflected in competitive adsorption [41]. As a typical natural organic matter, HA contains groups that are easily degraded by oxidation (such as carboxylic and phenolic hydroxyl groups). These active groups may react with free radicals and compete with RhB to form ·OH and SO4·− [42]. The competitive adsorption of HA on biochar surface active sites and the spatial and electrostatic effects limited the contact between PMS and the biochar surface [43]. However, as the reactive groups of HA react more weakly with free radicals than ·OH and SO4·−, the addition of HA can only slightly inhibit the degradation of RhB in the system.

3.4. Exploration of Living Species and Possible Degradation Mechanisms

In general, in PMS catalytic reaction systems, researchers have shown that the degradation of pollutants can be based on free and non-free-radical pathways. To further explore the reaction path of the RBC600/PMS system in the RhB degradation process and the participation of various active substances in the reaction, we selected four different quenchers for the free-radical quenching experiment, and the experimental results are shown in Figure 14.
MeOH and TBA are usually used to assess the production of SO4·− and ·OH in a reaction system. MeOH can effectively quench the two free radicals (SO4·− and ·OH) with different reaction rates (kSO4·− = 1.1 × 10⁷ M−1s−1, k·OH = 9.7 × 10⁸ M−1s−1). The reaction rate of TBA with ·OH was 6 × 10⁸ M−1s−1, but that with SO4·− was significantly lower (4 × 10⁵ M−1s−1); thus, TBA can be used as a quencher of ·OH [44]. Figure 14a,b shows the experimental results of the quenching agent and PMS at different molar ratios, respectively. When the molar ratio of MeOH and PMS increased from 0 to 1000:1, the degradation rate of RhB decreased from 99.97% to 75.35%, denoting a decrease of 24.61%. kobs decreased from 0.118 min−1 to 0.022 min−1 (81.36%). When the molar ratio of TBA to PMS increased from 0 to 1000:1, the degradation rates of RhB were 99.97%, 98.47%, 96.19%, and 83.75%, and kobs decreased from 0.118 min−1 to 0.065, 0.051, and 0.028 min−1, respectively. These results indicated that both types of free radicals could inhibit the degradation of RhB, and the degree of inhibition of the reaction increased with the increase in the concentration of the quenching agent. Free-radical quenching experiments showed that both SO4 and ·OH participated in the degradation of RhB, but ·OH performed a more important role than SO4·−.
BQ is usually used as an inhibitor of O2·−. Therefore, BQ was used in this experiment to verify the presence of radical O2·−. Figure 14c shows the presence of O2·− in the reaction. The results showed that the degradation rate of RhB decreased by 7.99% when the concentration of BQ increased from 0 mmol/L to 20 mmol/L, and the corresponding kobs were 0.118, 0.065, 0.053, and 0.039 min−1. Free-radical quenching experiments showed that O2·− participated in the degradation of RhB, but the proportion was very low.
L-His is usually used as an inhibitor of 1O2 non-free radicals. In this study, L-His was used to verify the presence of 1O2. The participation of 1O2 in the reaction is shown in Figure 14d. The experimental results revealed that when the L-His concentration increased from 0 mmol/L to 20 mmol/L, the degradation rate of RhB decreased by 69.11% and 69.13%, and the corresponding kobs were 0.118, 0.006, 0.005, and 0.005 min−1. Kobs had a very significant decrease of 95.76%. Free-radical quenching experiments showed that 1O2 participated in the degradation of RhB and performed a relatively important role.
To further verify the reactive oxygen species generated during RhB degradation by the RBC600/PMS system, DMPO was used as the spin catcher of SO4, ·OH, and O2·− free radicals. TEMP was used as the spin catcher of 1O2 non-free radical. The free and non-free radicals generated during RhB degradation were captured by EPR. The EPR results are shown in Figure 15.
As shown in Figure 15a, four distinct characteristic peaks with an intensity ratio of 1:2:2:1 can be observed, which proves the existence of DMPO–SO4·−. Meanwhile, a six-row peak with an intensity ratio of 1:1:1:1:1:1 and partially overlapping with the characteristic peaks of DMPO–OH can also be observed, which proves the existence of DMPO–SO4·−. The radical quenching experiment revealed possible traces of O2·− in the system, but as shown in Figure 15b, EPR did not detect the evident characteristic peak of DMPO–O2·− possibly because O2·− wasprotonated, dismutated, and reduced to ·OH. It may also be caused by the extremely strong DMPO–OH and DMPO–SO4·– signals; similar results were found in the study of Huang Wen et al. [22]. As depicted in Figure 15c, when TEMP was used as the trapping agent, a triple peak with an intensity ratio of 1:1:1 appeared, demonstrating the presence of 1O2.
EPR experiments showed that RBC600 could activate PMS to produce SO4·−, ·OH free radicals, and 1O2 non-free radicals, which is consistent with the experimental results of radical quenching. Two free and non-free radical ways were used to degrade RhB in the RBC6000/PMS system, where the 1O2 non-free radical performed an important role in the degradation process of RhB.
The defective structure of biochar can be used as an electron donor to provide electrons to PMS, thus activating PMS to produce various active substances. In addition, as a good electron acceptor, C=O on biochar can stimulate PMS to produce active substances. Figure 16 shows the mechanism of RBC600 activates PMS to degrade RhB. The activation mechanism of RBC600 to PMS can be described as follows: PMS was first adsorbed on the surface of RBC600. Further, π electron on the RBC600 surface sp2-C activated PMS to produce SO4 and ·OH free radicals as oxidizing substances (Equations (16) and (17), respectively). The C=O functional group on RBC600 can promote the generation of non-free (1O2) radicals. In the presence of OH, HSO5 attacked the C=O located at the edge of carbon material to form peroxide adduction and then formed dioxane intermediates through intramolecular nucleophilic substitution. The SO52− molecule reacted with the dioxycyclothane intermediate to form 1O2. Finally, SO4, ·OH, and 1O2 attacked the central carbon of RhB to decolorize it. RhB was further degraded by N-deethylation, N-demethylation, and carboxylation, and the intermediate product was decomposed into smaller monocyclic aromatic compound intermediates. Finally, RhB was completely degraded into CO2 and H2O by ring opening and mineralization.
HSO5 + π-electrons → OH + SO4
HSO5 + π-electrons →·OH + SO42−

3.5. Investigation of Catalyst Stability

In addition to studying the degradation conditions of pollutants in the system, this paper explored the stability of materials. Strong stability of materials can not only reduce the environmental impact that may be caused by pollutant treatment but also save the cost of such process, thus increasing the possibility of its application in the actual pollutant degradation process. The experimental results of material recycling five times are shown in Figure 17.
As it depicted in the figure, the reactivity of RBC600 as a catalyst gradually decreased with the increase in the number of cycles. After recycling, the degradation rates of RhB in the RBC600/PMS system were 99.79%, 92.21%, 89.25%, 84.26%, and 81.73%. After five cycles, the degradation rate of RhB decreased by 18.06%. In the process of catalytic degradation, the coverage of byproducts and the collapse of the catalyst structure reduced the catalytic performance of RBC600 to varying degrees. However, in general, the degradation rate of pollutants of RBC600 can remain above 80% after five cycles, which indicates that RBC600 has a good recycling performance.

4. Conclusions

(1)
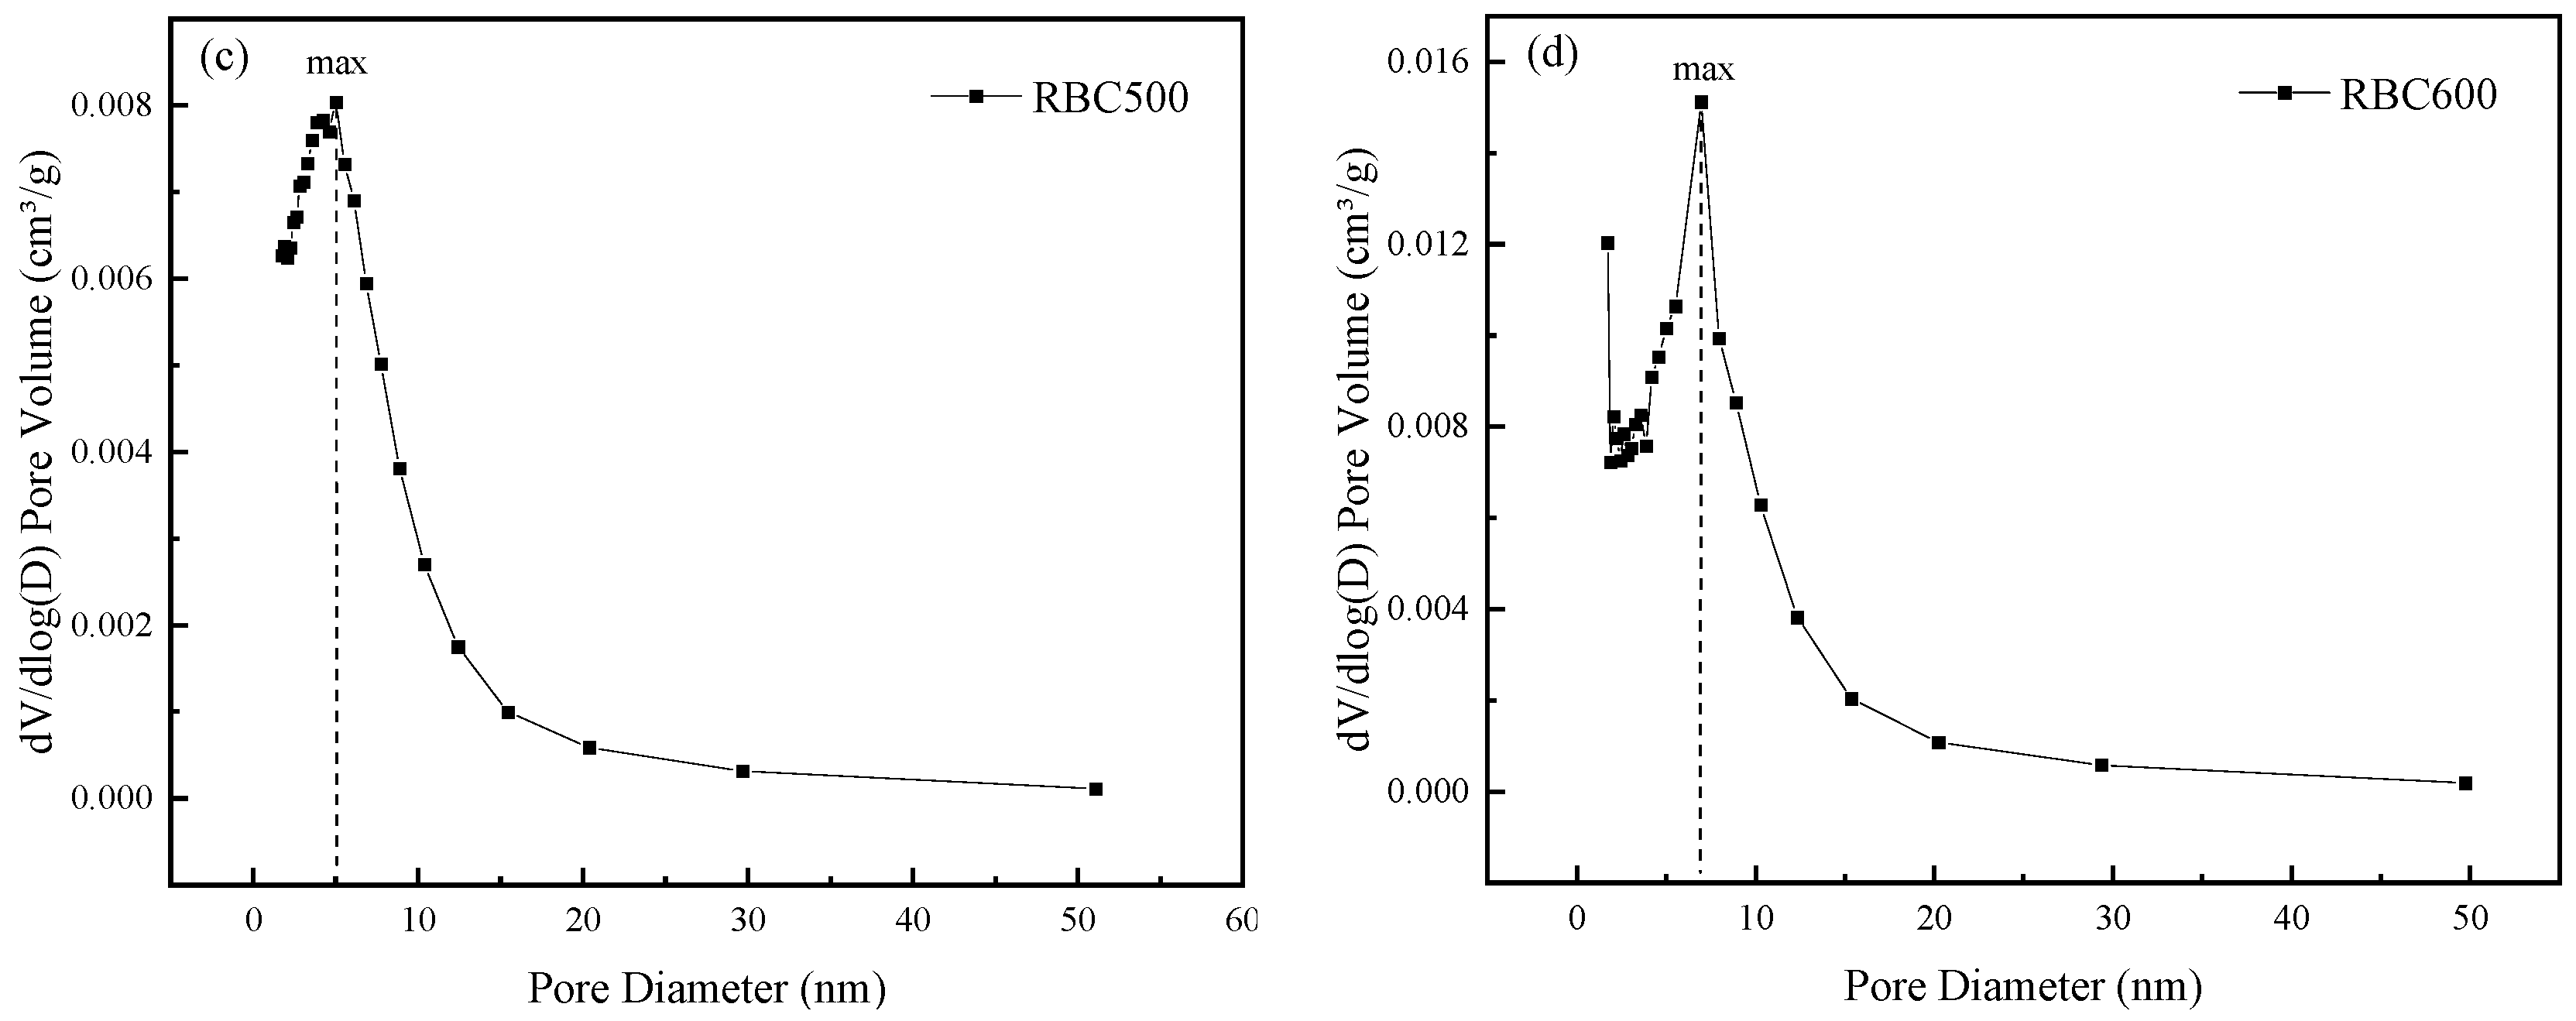
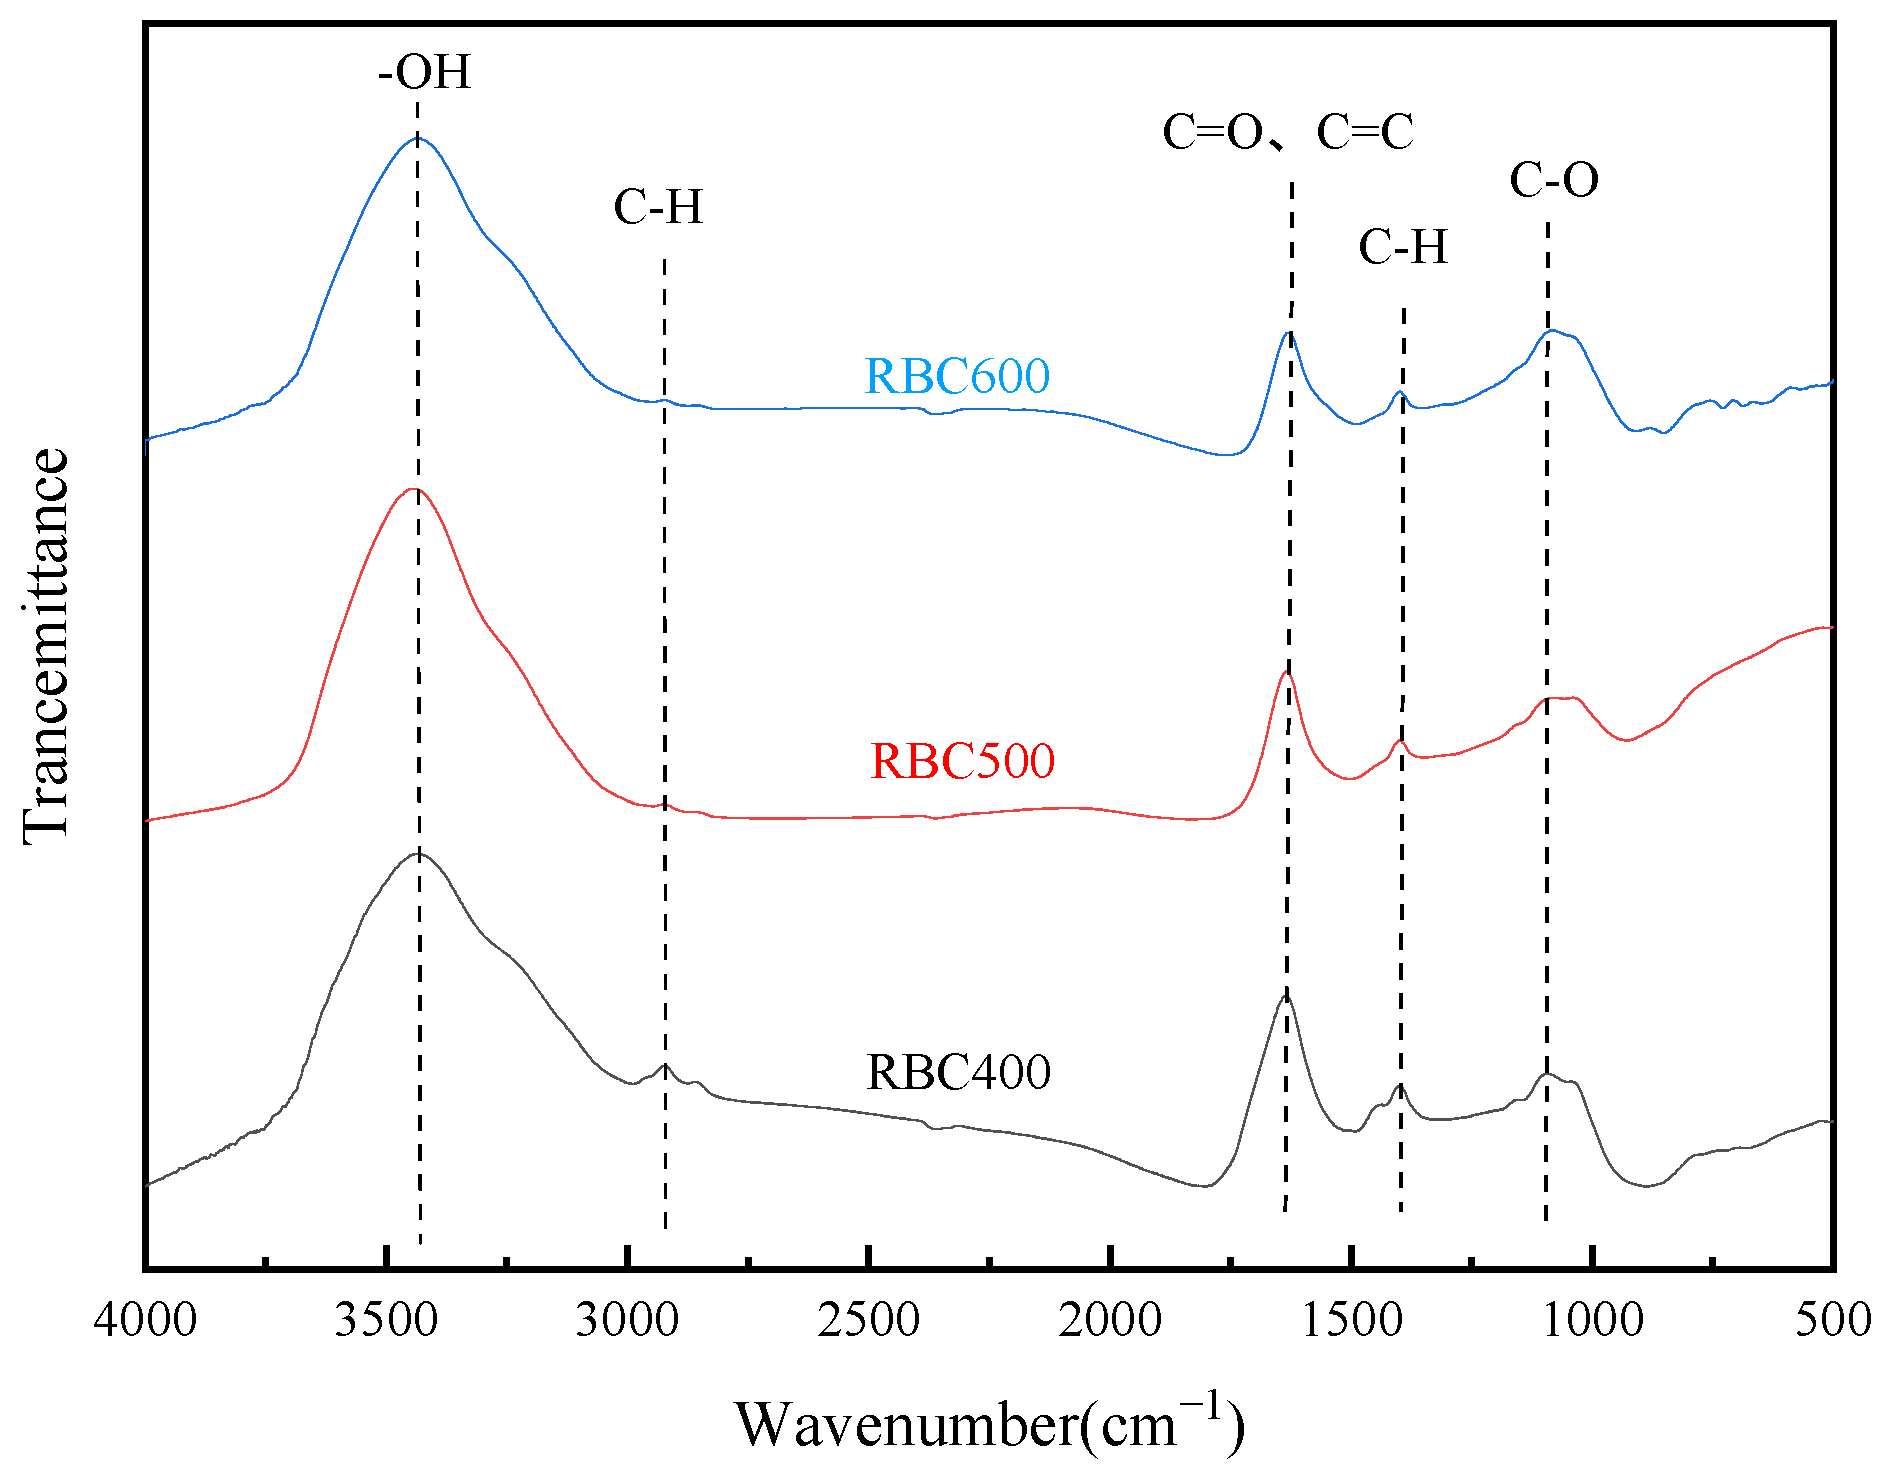
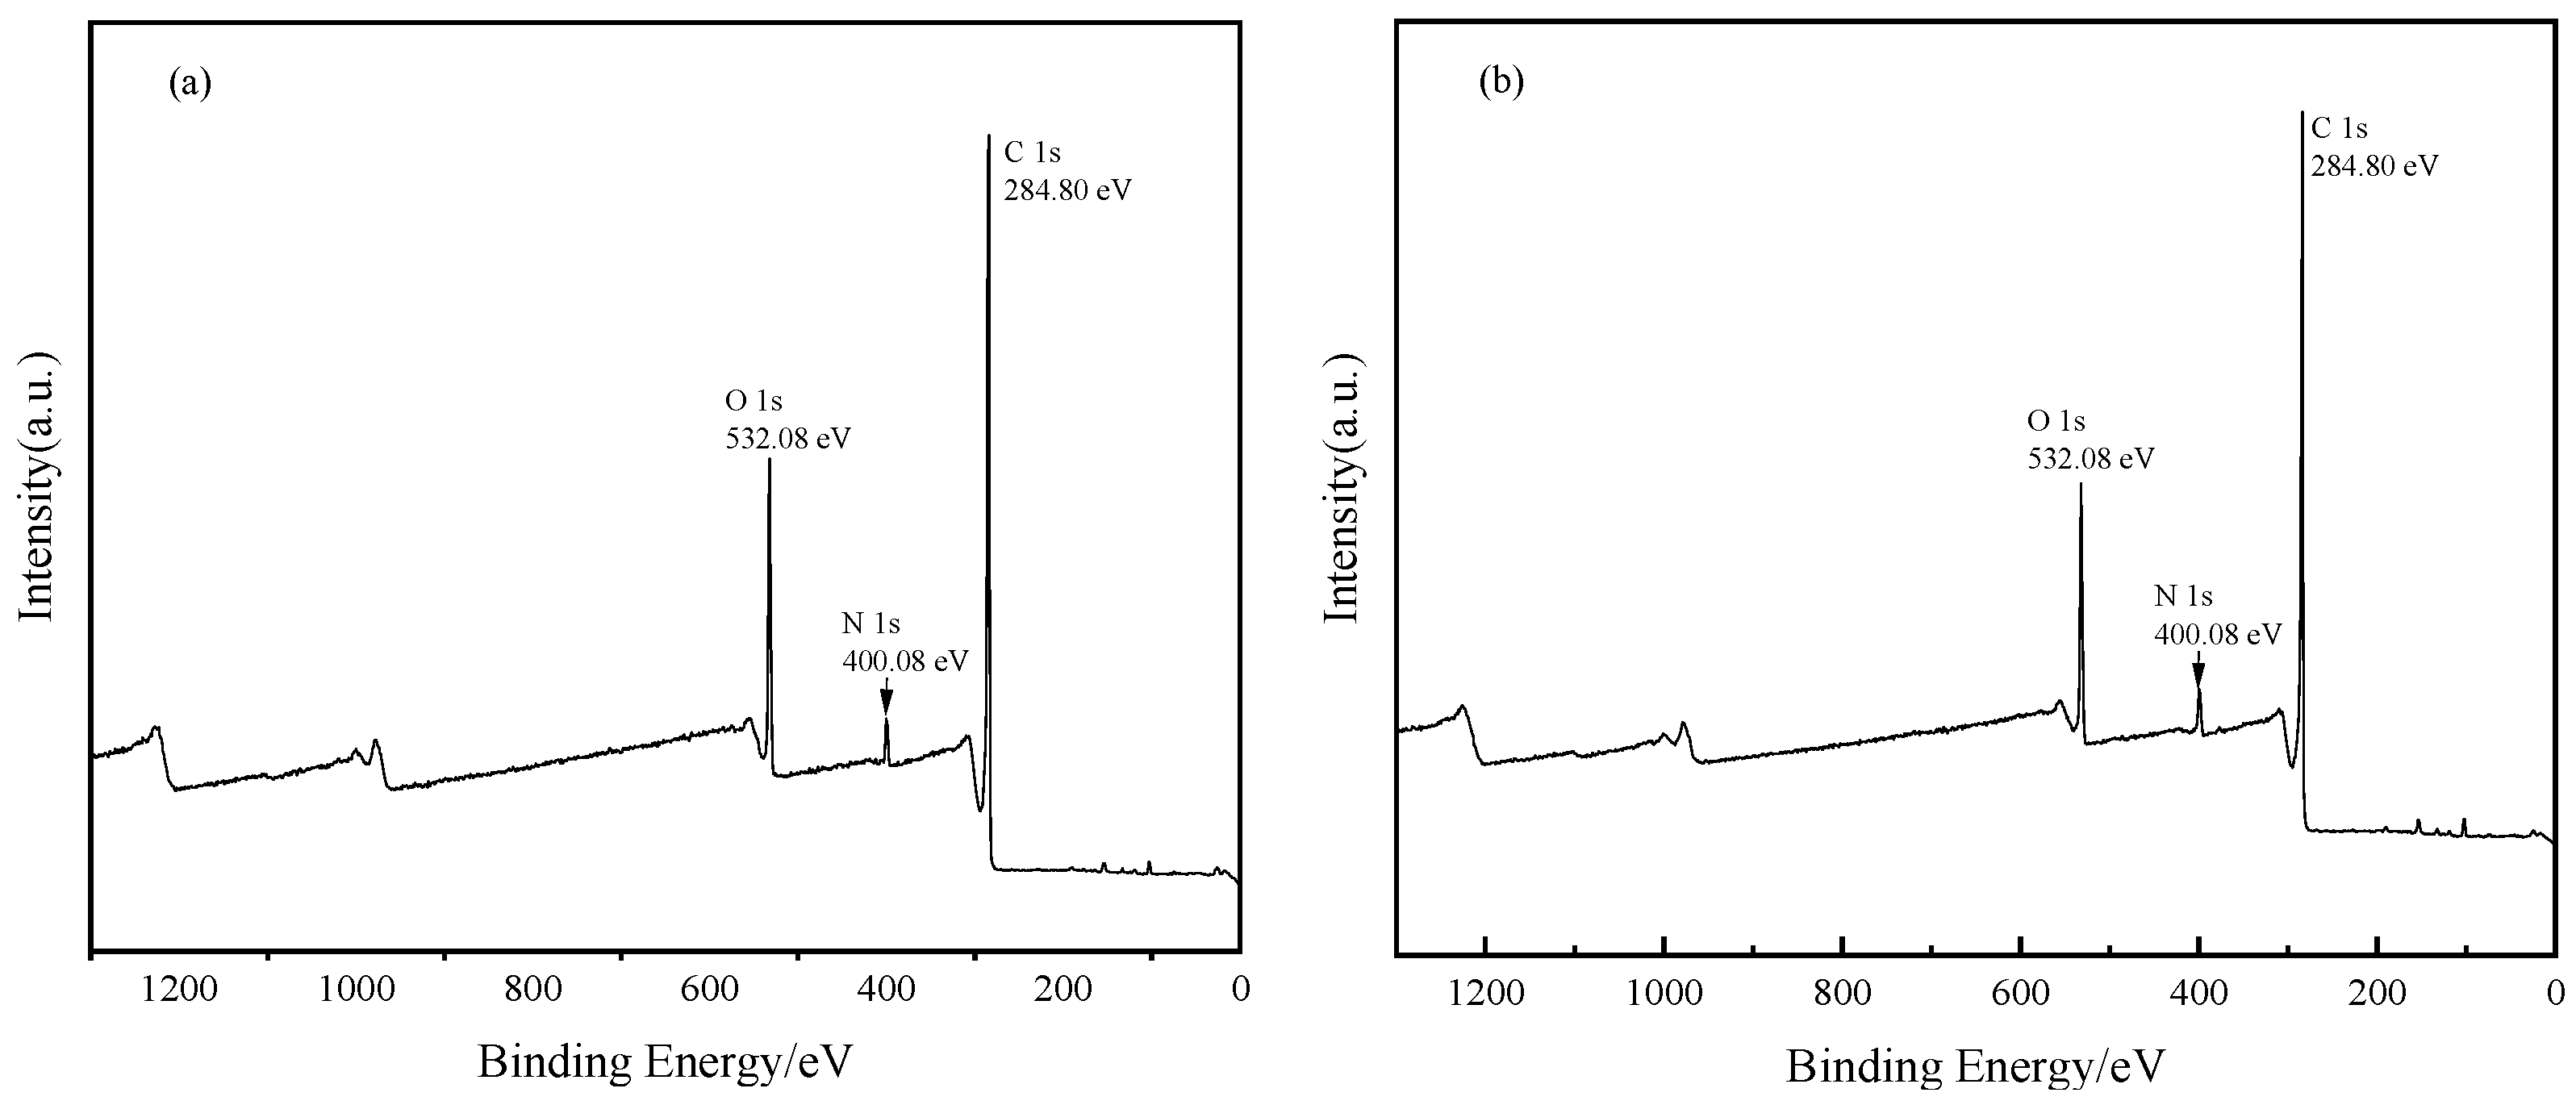
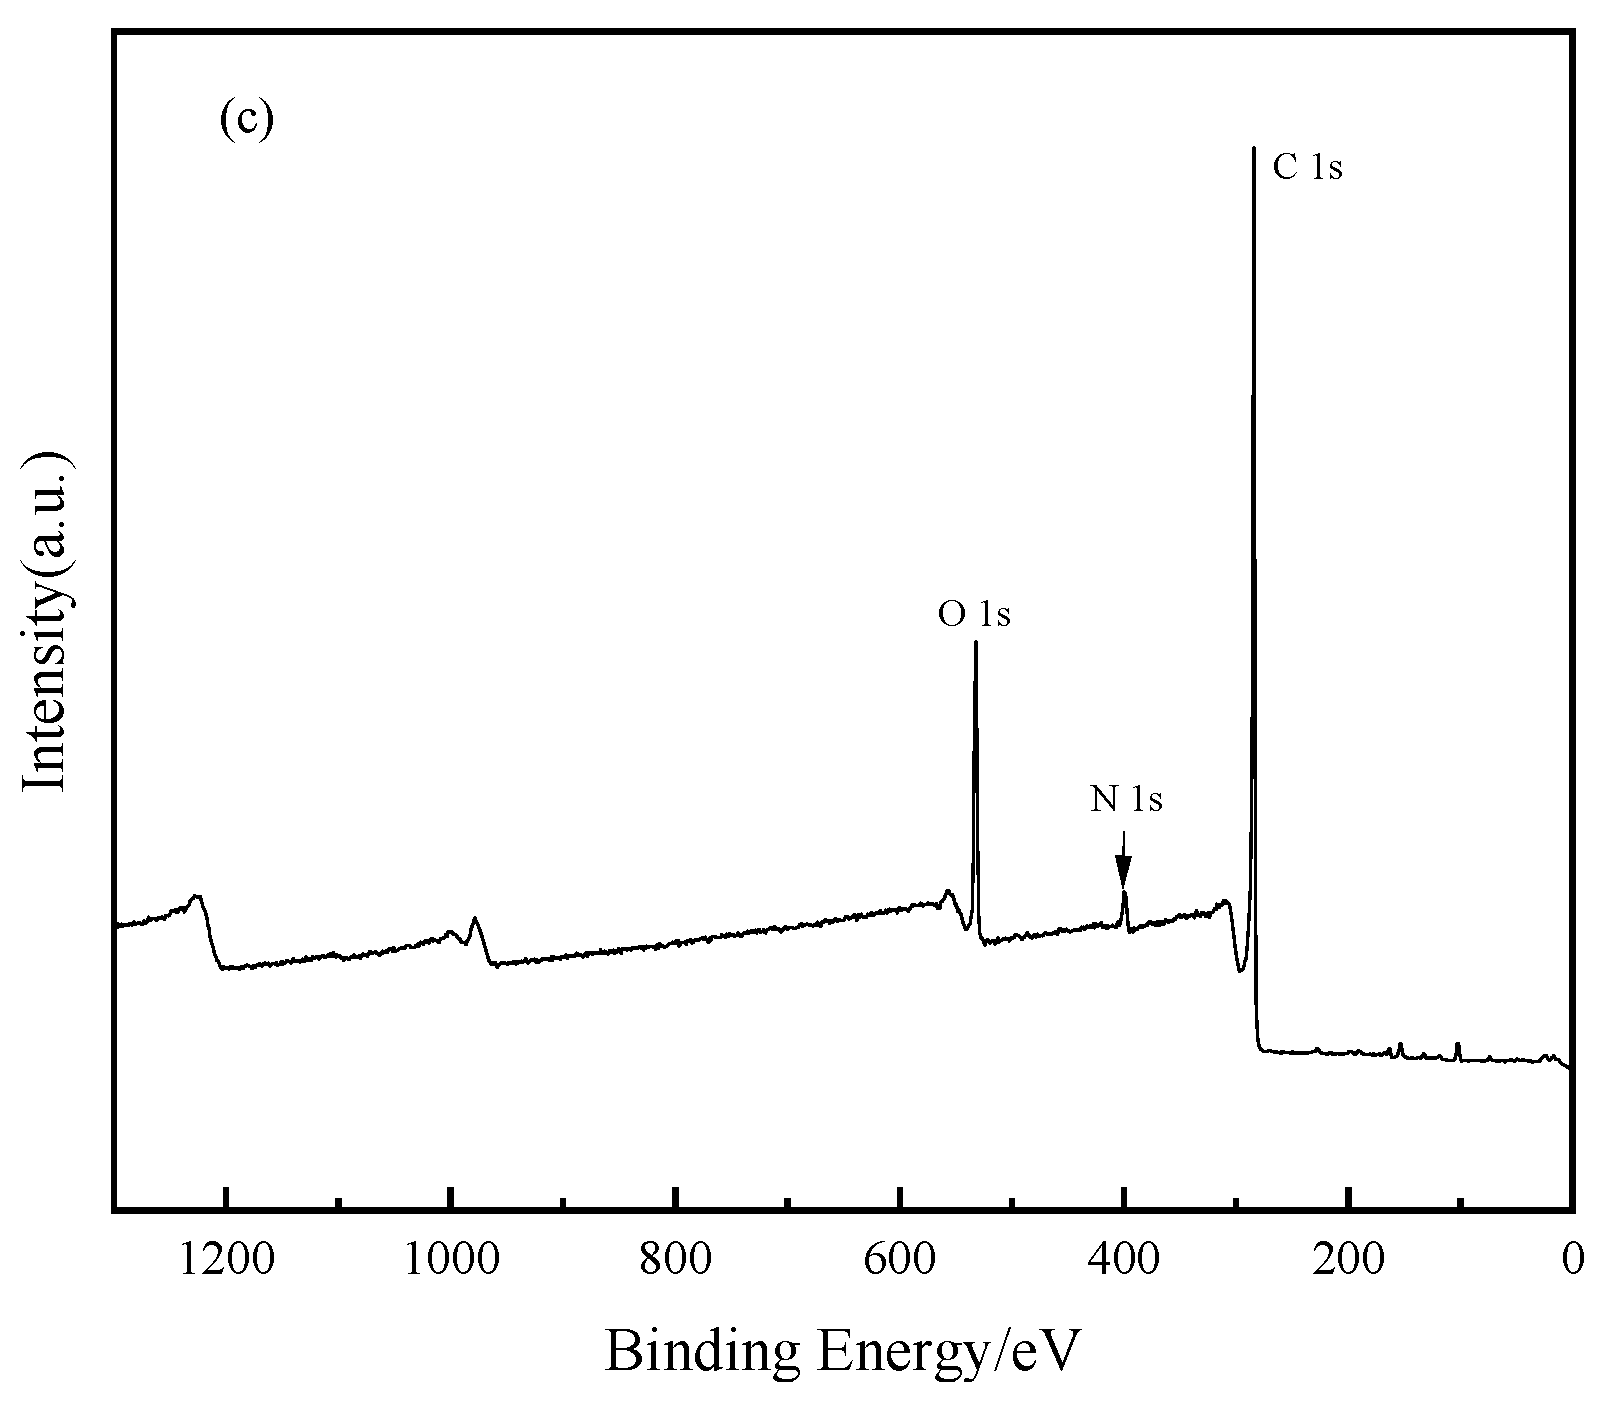
Using rabbit manure as raw material, RBC500 and RBC600 were prepared using pyrolysis and characterized via SEM, BET, FT-IR, XPS, and XRD. The results of characterization and catalytic degradation experiments showed that RBC600 had better catalytic activity than RBC400 and RBC500, which is closely related to its larger specific surface area, highly graphitized structure, and a higher degree of carbonization.
(2)
When the RhB concentration was 50 mg/L, the optimum biochar dosage of RBC600-activated PMS for RhB degradation was 0.6 g/L; the optimal dosage of PMS was 0.4 g/L, and the optimum pH was 3. Background components Cl, HCO3, NO3, and HA all exhibited different degrees of inhibition on RhB degradation, with HCO3 exhibiting the strongest inhibitory effect, followed by NO3, HA, and Cl having a weak inhibitory effect on RhB degradation.
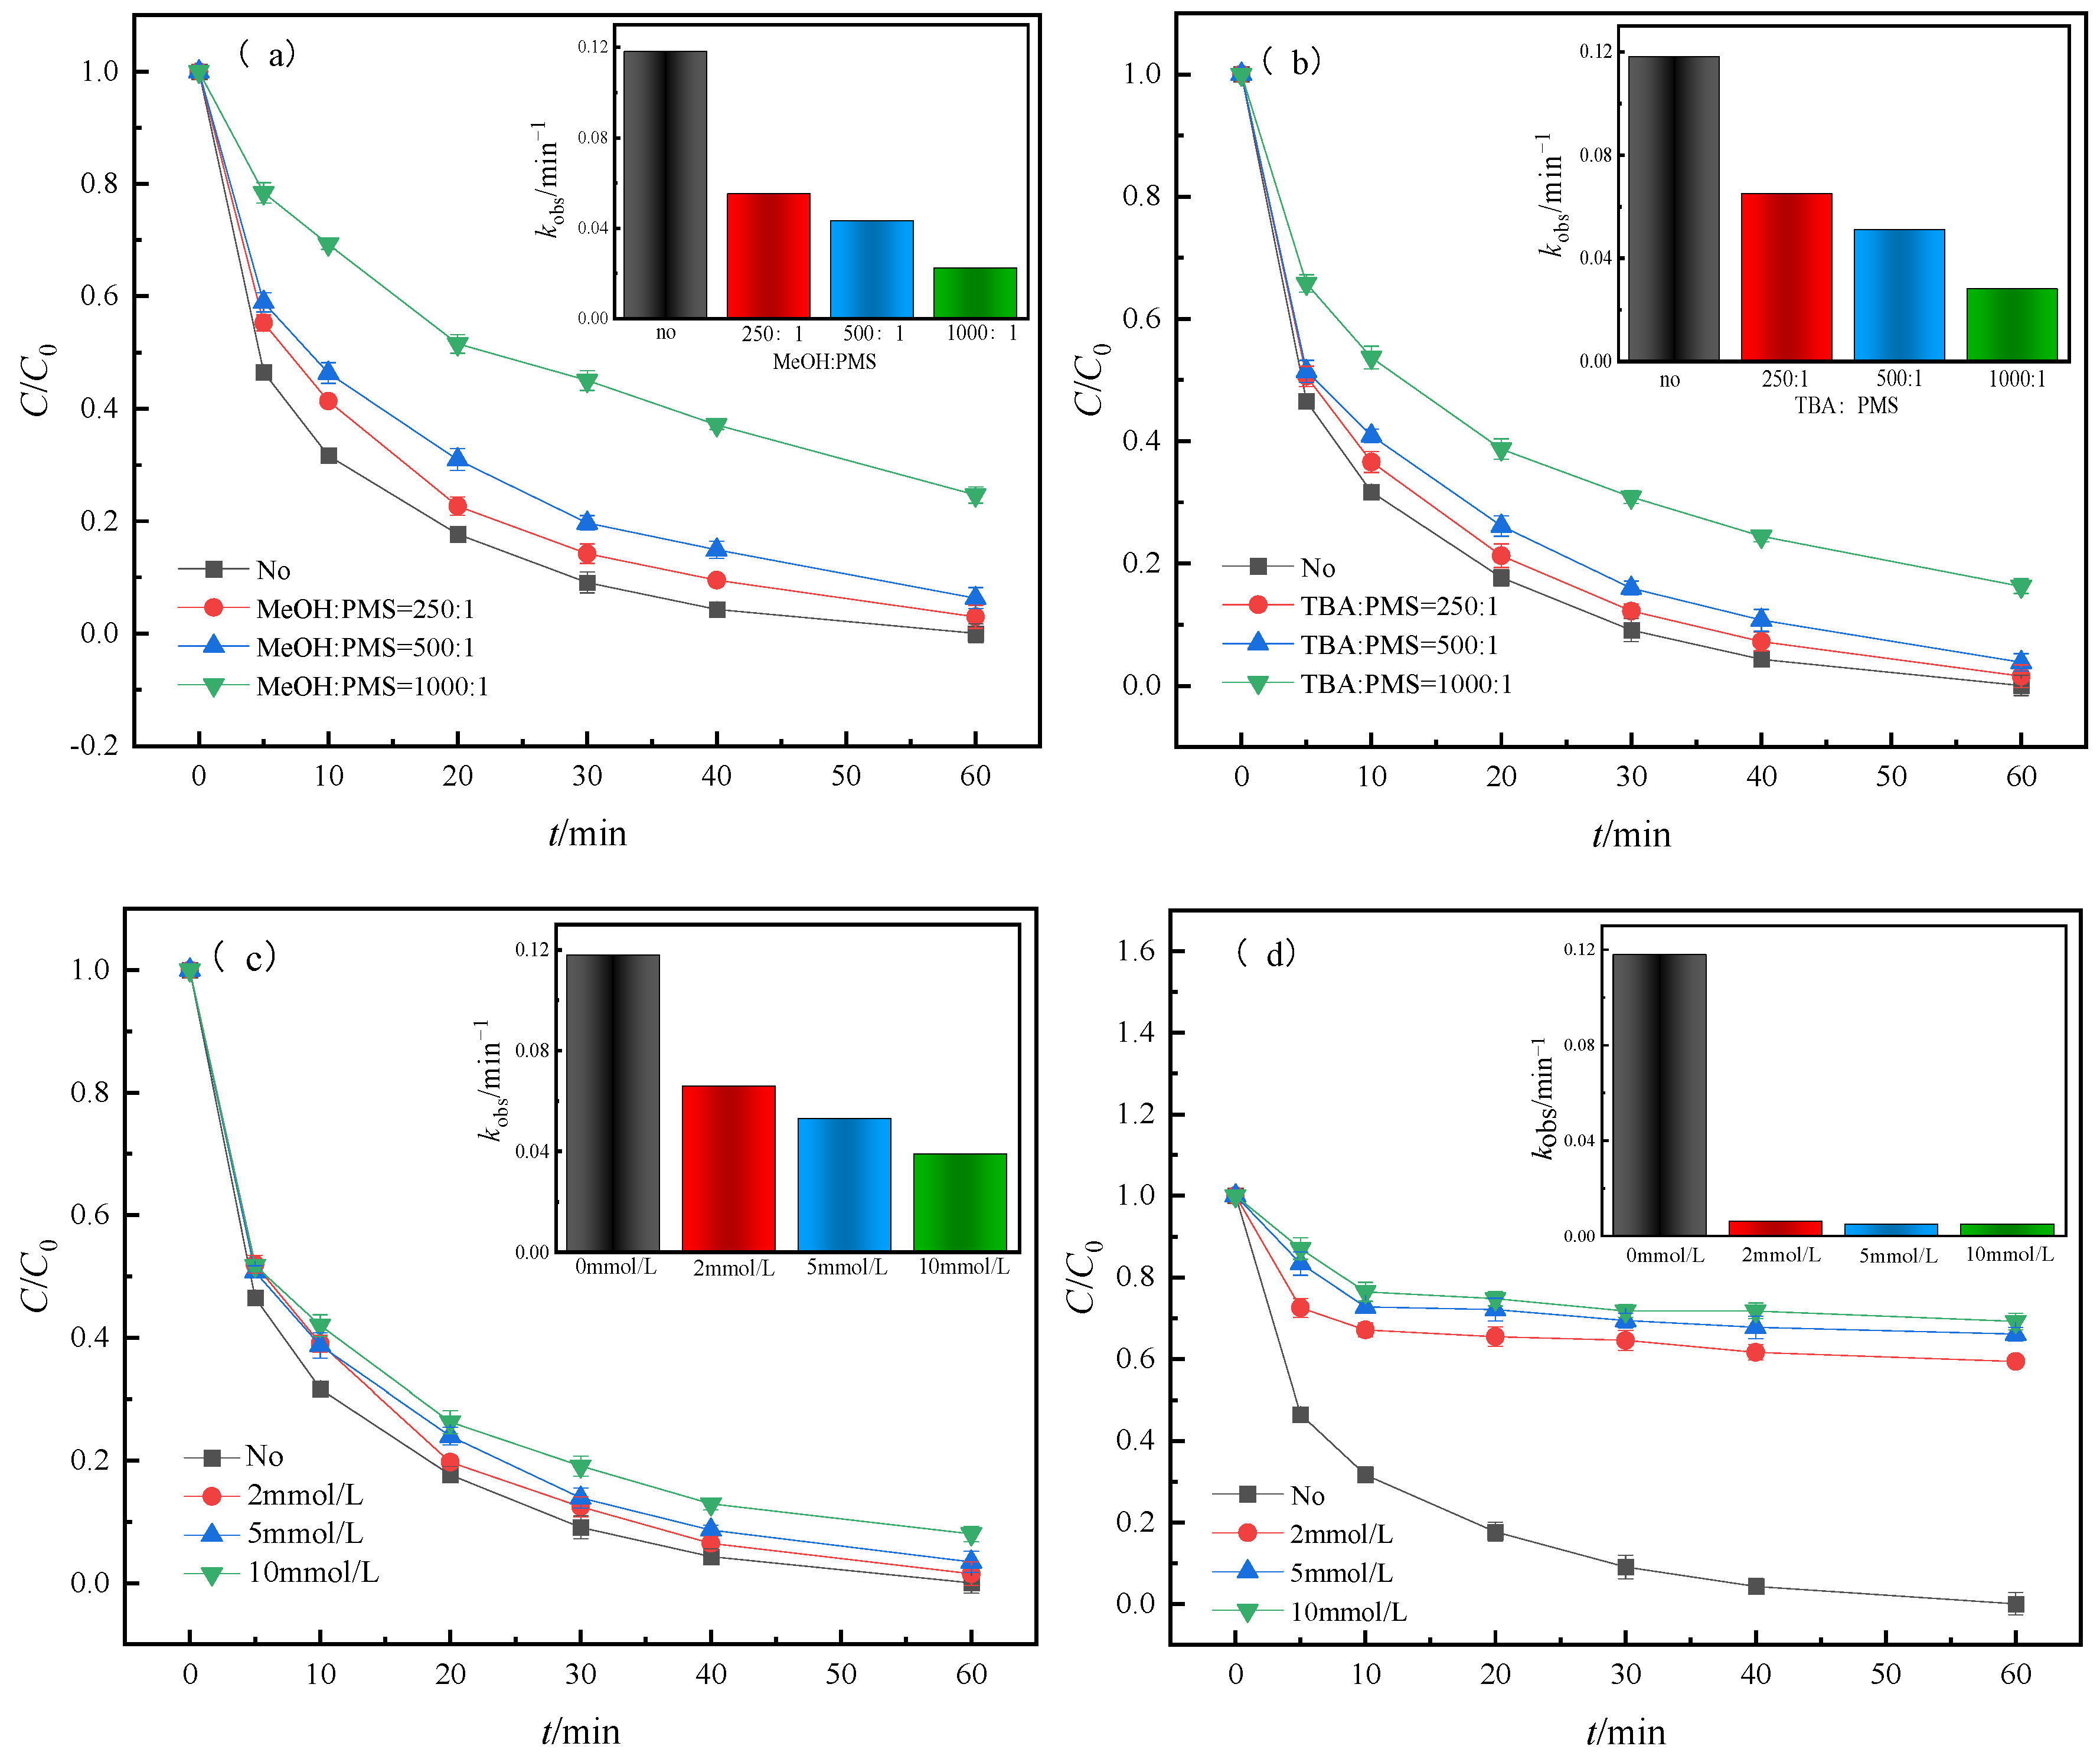
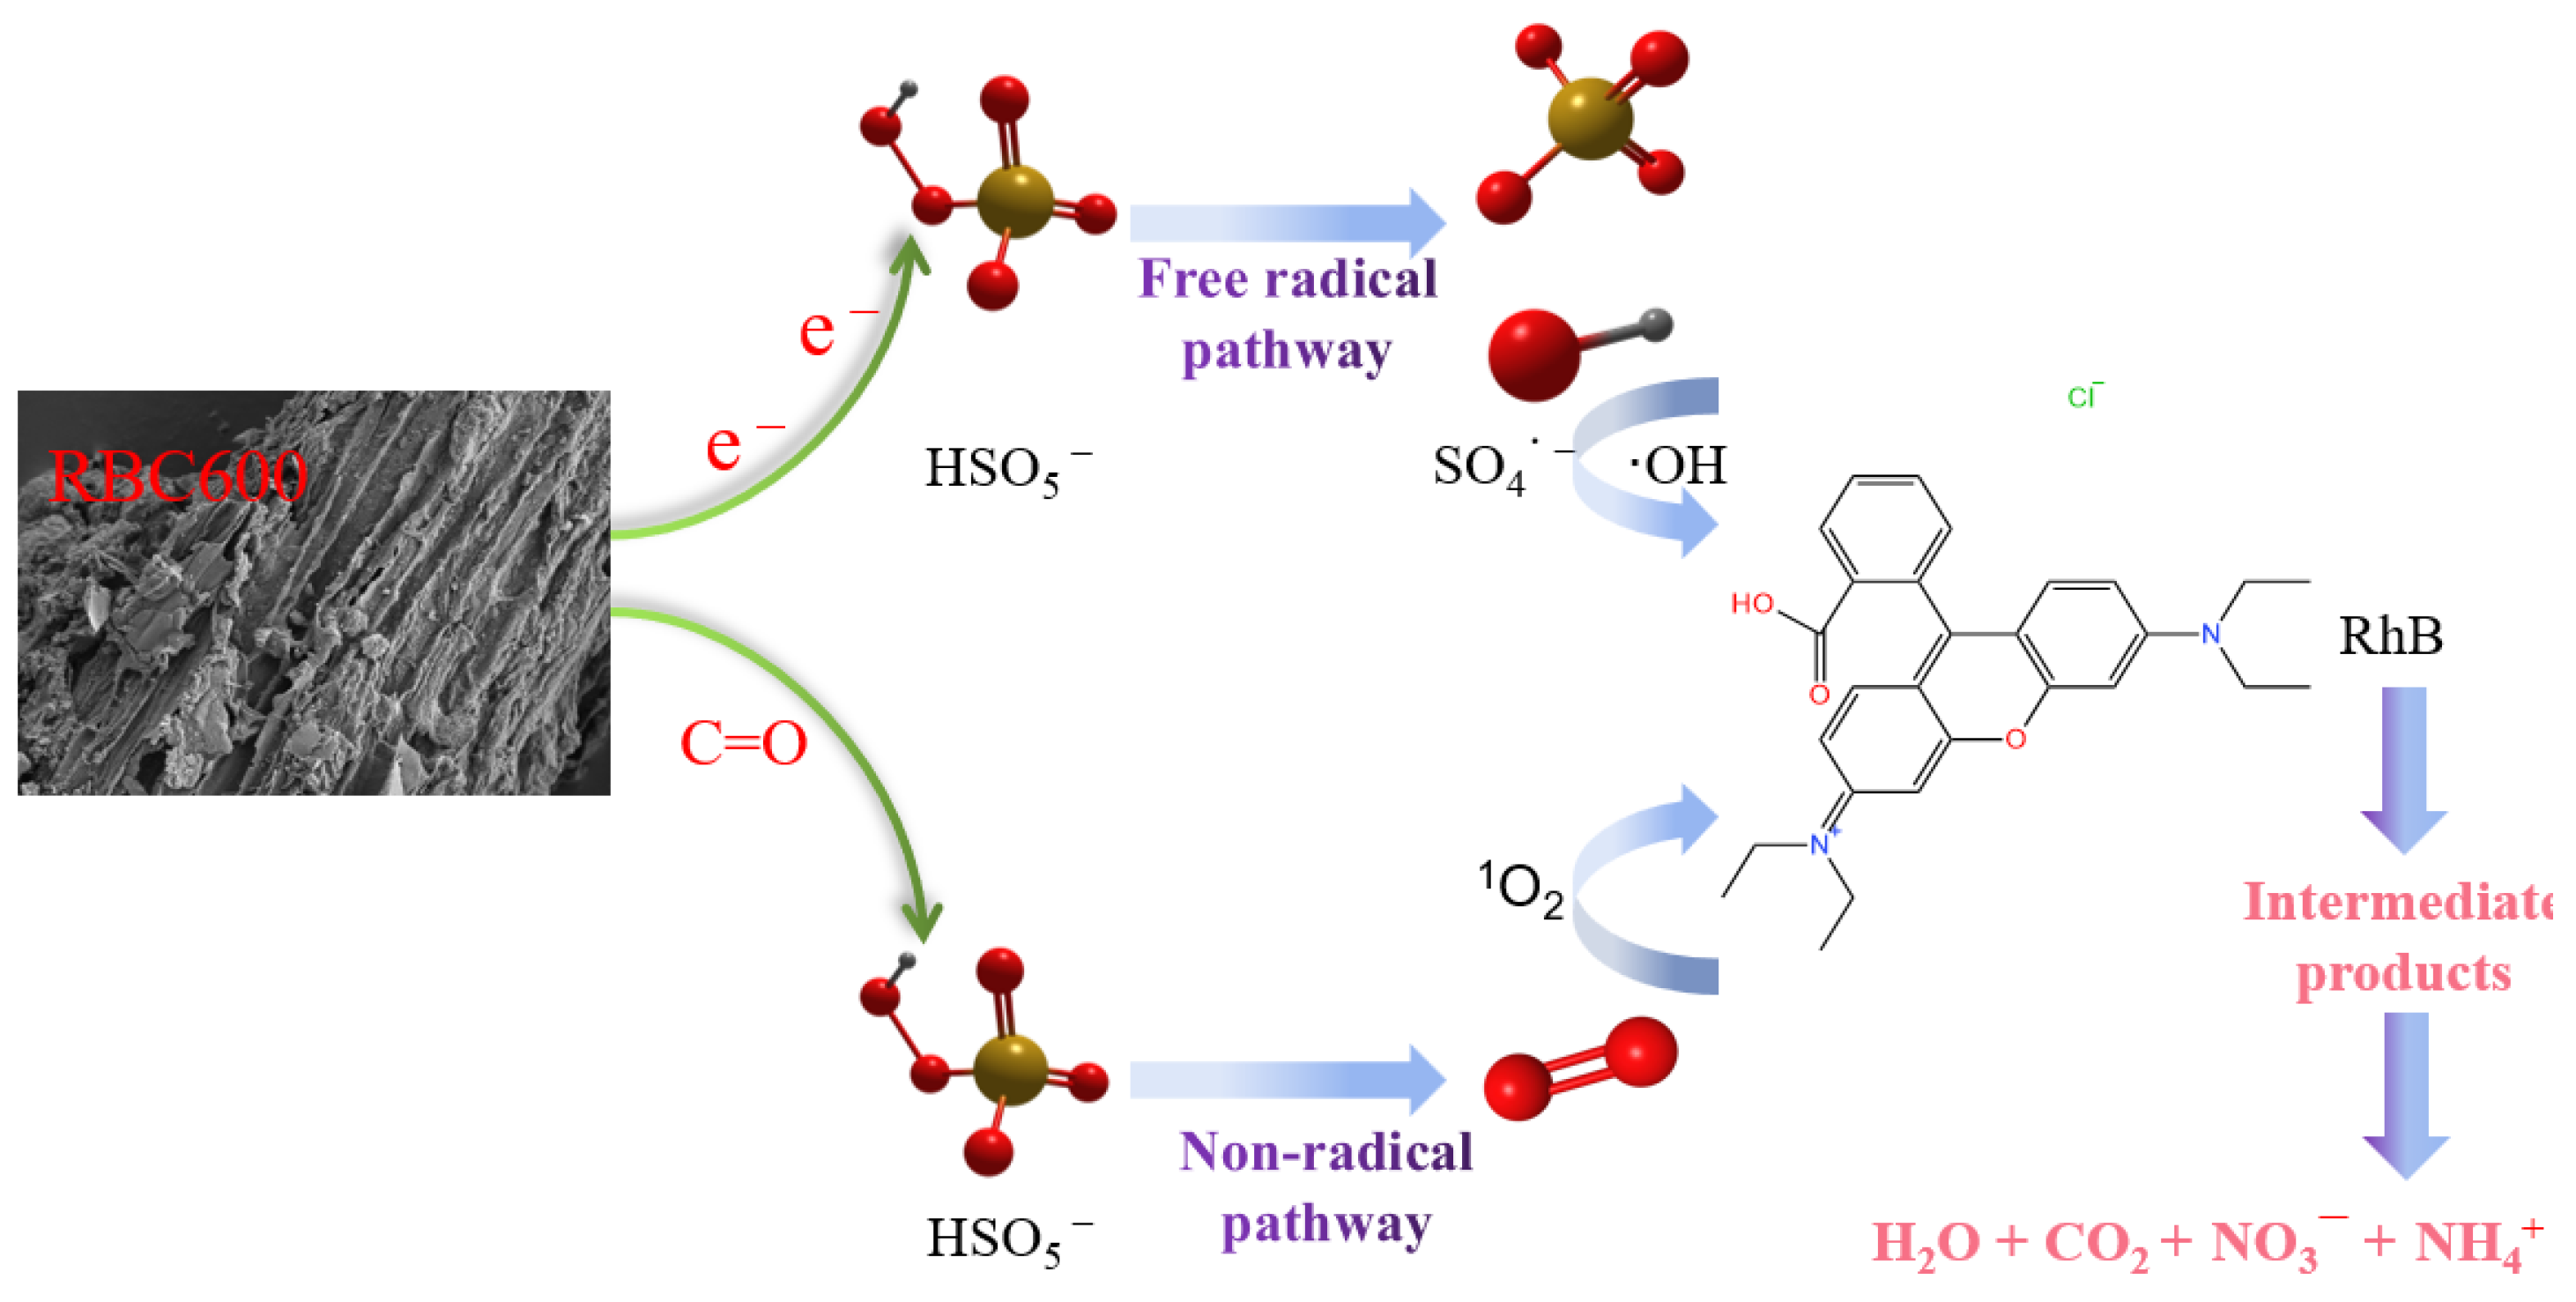
(3)
Free-radical quenching experiment results showed that the degradation rate of RhB decreased by 24.61%, 16.18%, 7.99%, and 69.11% after MeOH, TBA, BQ, and L-His were added, respectively. EPR analysis revealed that there are two free radicals (SO4 and ·OH) and one non-free (1O2) radical pathways for RhB degradation by activating PMS with RBC600, and 1O2 performs a leading role in various active substances.
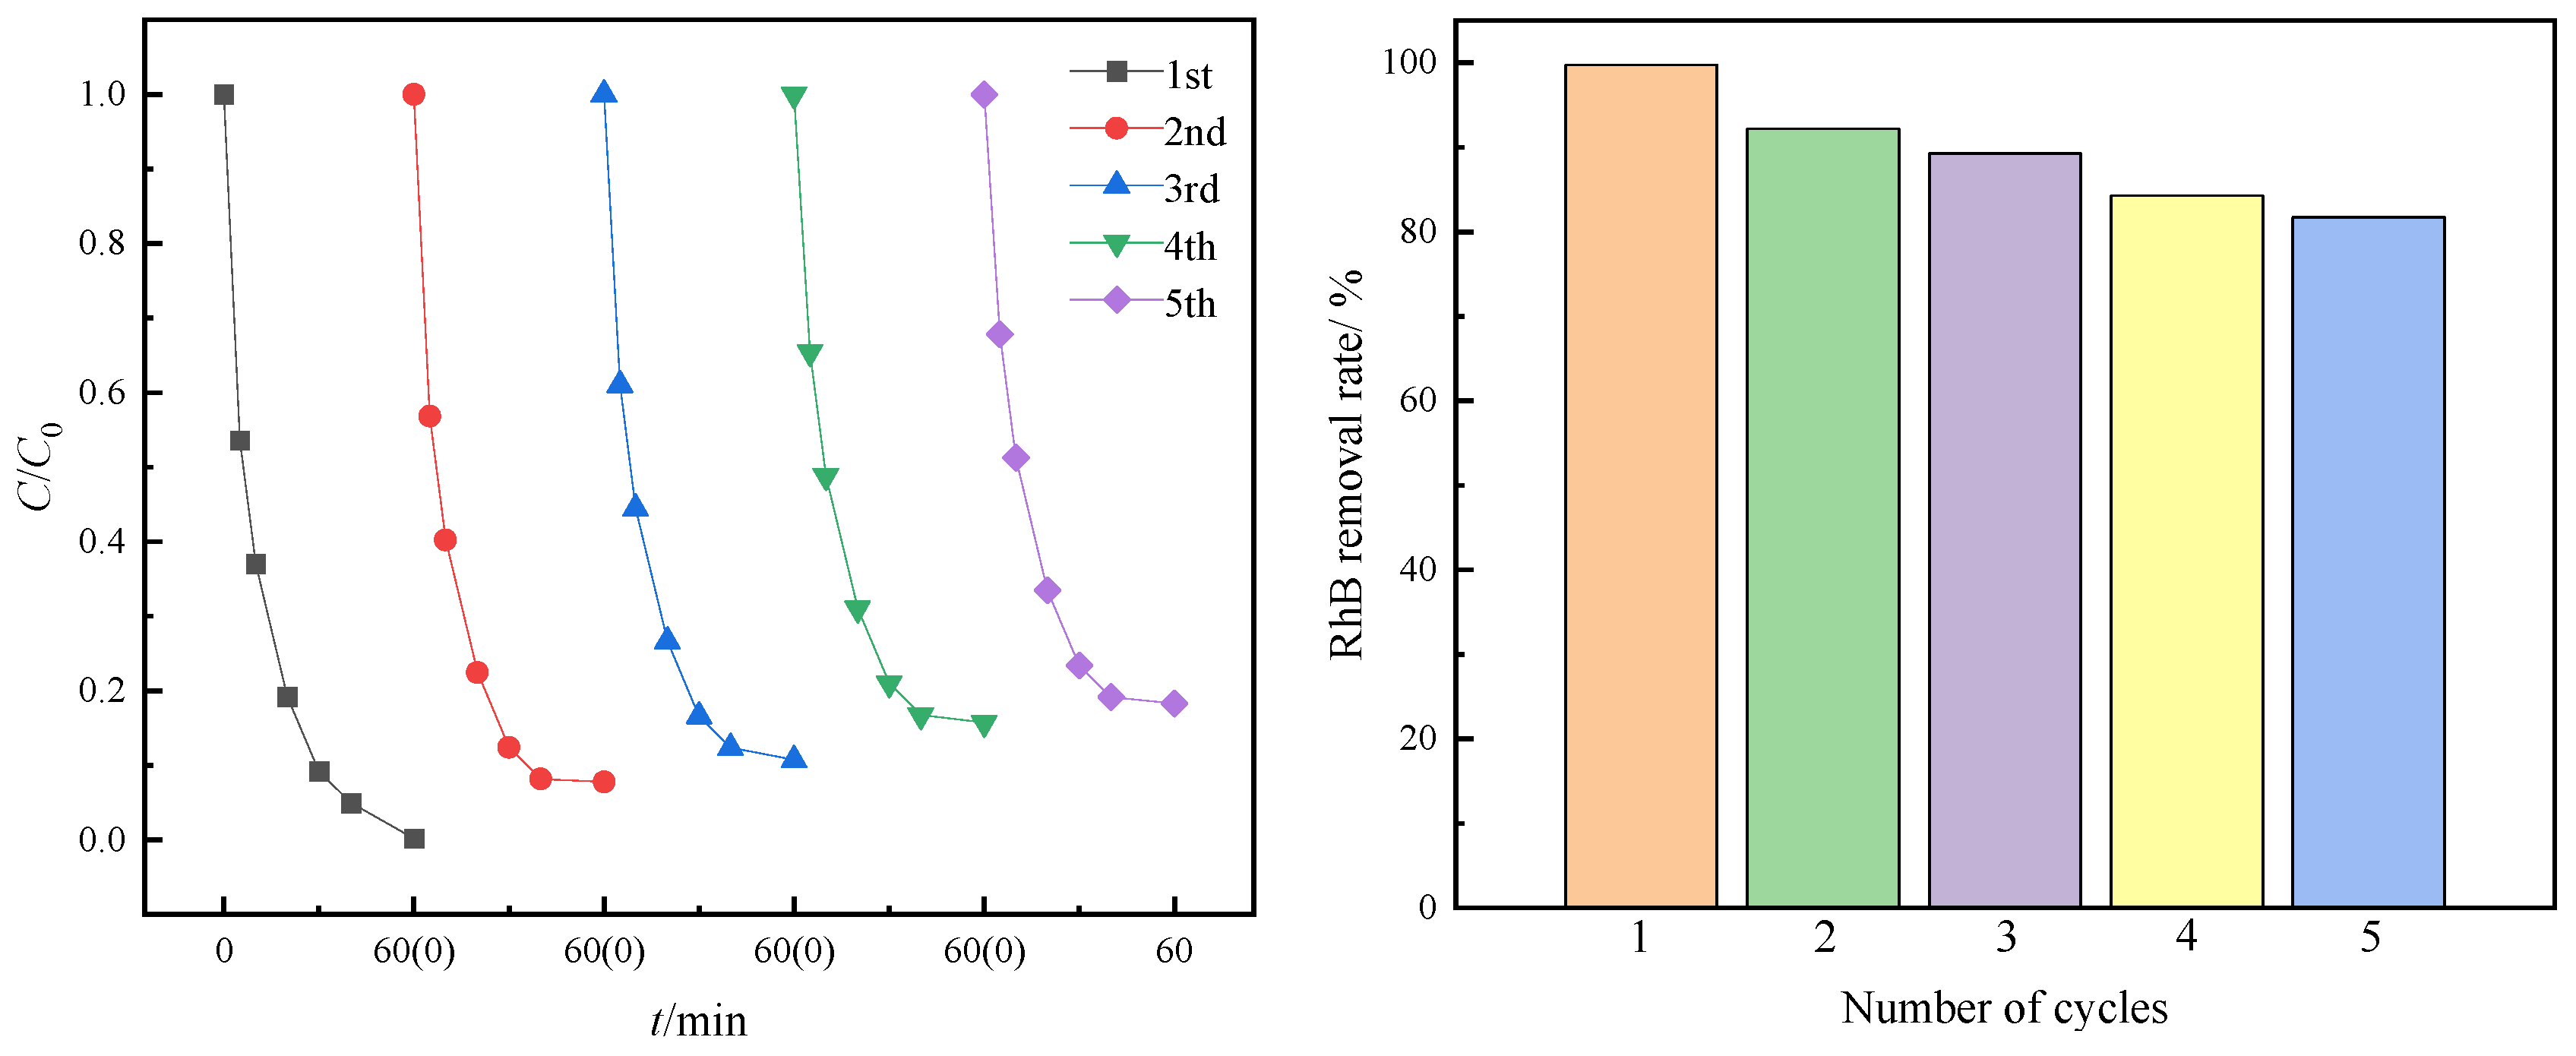
(4)
The experimental results of RBC600 material stability analysis showed that RBC600 still had a good activation effect after five cycles, and the degradation rate of RhB by the RBC600/PMS system could still reach 81.73% after five cycles.
The composition of the actual dye wastewater is more complex than that of the simulated dye wastewater studied in this experiment. In the practical application process, it is necessary to consider the control of reaction conditions, operating costs, and other realistic factors. These factors may have a certain restriction effect on the degradation of pollutants in the RBC600/PMS system, which requires further discussion and research. In this study, although RBC600 exhibited good material stability and could still achieve a good pollutant degradation effect after repeated use, it encountered problems, such as difficult material collection and large losses in the recycling process, in the actual process. In the follow-up research, a major research direction is to develop a more convenient and efficient method for material collection and solve the loss problem in material recycling collection.

Author Contributions

Conceptualization, F.O.; Data curation, A.W. and Y.L. (Yixin Lu); Formal analysis, J.C. and C.T.; Investigation, Y.Y. and F.O.; Methodology, Y.L. (Yujie Liu) and J.C.; Writing—original draft, Y.L. (Yujie Liu); Writing—review and editing, F.O. and Y.L. (Yujie Liu). All authors have read and agreed to the published version of the manuscript.

Funding

This work was financially supported by the Sichuan Science and Technology Program (2022YFG0307), Natural Science Foundation of Sichuan Province (2022NSFSC0393), National College Students’ Innovation Training Program (202211116025), and Young Seedling Program of CDTU (QM2021064).

Data Availability Statement

Data available on request from the authors.

Conflicts of Interest

The authors declare no conflict of interest.

References

  1. Lan, D.; Zhu, H.; Zhang, J. Adsorptive removal of organic dyes via porous materials for wastewater treatment in recent decades: A review on species, mechanisms and perspectives. Chemosphere 2022, 293, 133464. [Google Scholar] [CrossRef] [PubMed]
  2. Sarkar, P.; Dey, A. Phycoremediation-An emerging technique for dye abatement: An overview. Process. Saf. Environ. 2021, 147, 214–225. [Google Scholar] [CrossRef]
  3. Natarajan, S.; Bajaj, H.C.; Tayade, R.J. Recent advances based on the synergetic effect of adsorption for removal of dyes from waste water using photocatalytic process. J. Environ. Sci. 2018, 65, 201–222. [Google Scholar] [CrossRef] [PubMed]
  4. Pattnaik, P.; Dangayach, G.S. Sustainability of textile waste-water management by using an integrated fuzzy AHP-TOPSIS method: A case study. Int. J. Environ. Sustain. Dev. 2021, 20, 105–128. [Google Scholar] [CrossRef]
  5. Zhang, Y.; Chen, S. Research on the Advanced Oxidation Technology Based on Dyeing Waste-Water Treatment. Earth Environ. Sci. 2020, 495, 012080. [Google Scholar] [CrossRef]
  6. Ahmad, M.; Rajapaksha, A.U.; Lim, J.E.; Zhang, M.; Bolan, N.; Mohan, D.; Vithanage, M.; Lee, S.S.; OK, Y.S. Biochar as a sorbent for contaminant management in soil and water: A review. Chemosphere 2014, 99, 19–33. [Google Scholar] [CrossRef]
  7. Pan, X.Q.; Gu, Z.P.; Chen, W.M.; Li, Q.B. Preparation of biochar and biochar composites and their application in a Fenton-like process for wastewater decontamination: A review. Sci. Total Environ. 2021, 754, 142104. [Google Scholar] [CrossRef]
  8. Wang, J.L.; Wang, S.Z. Preparation, modification and environmental application of biochar: A review. J. Clean. Prod. 2019, 227, 1002–1022. [Google Scholar] [CrossRef]
  9. Wu, D.P.; Chen, Q.; Wu, M.; Zhang, P.; He, L.P.; Chen, Y.H.; Pan, B. Heterogeneous compositions of oxygen-containing functional groups on biochars and their different roles in rhodamine B degradation. Chemosphere 2022, 292, 133518. [Google Scholar] [CrossRef]
  10. Gonçalves, M.G.; Veiga, P.A.D.S.; Fornar, M.R.; Peralta–Zamora, P.; Mangrich, A.S.; Silvestri, S. Relationship of the physicochemical properties of novel ZnO/biochar composites to their efficiencies in the degradation of sulfamethoxazole and methyl orange. Sci. Total Environ. 2020, 748, 141381. [Google Scholar] [CrossRef]
  11. Yu, J.F.; Feng, H.P.; Tang, L.; Pang, Y.; Wang, J.J.; Zou, J.J.; Xie, Q.Q.; Liu, Y.N.; Feng, C.Y.; Wang, J.J. Insight into the key factors in fast adsorption of organic pollutants by hierarchical porous biochar. J. Hazard. Mater. 2021, 403, 123610. [Google Scholar] [CrossRef] [PubMed]
  12. Zhang, K.; Chen, B.L.; Mao, J.F.; Zhu, L.Z.; Xing, B.S. Water clusters contributed to molecular interactions of ionizable organic pollutants with aromatized biochar via π-PAHB: Sorption experiments and DFT calculations. Environ. Pollut. 2018, 240, 342–352. [Google Scholar] [CrossRef]
  13. Chen, G.H.; Zhang, Z.R.; Zhang, Z.Y.; Zhang, R.D. Redox-active reactions in denitrification provided by biochars pyrolyzed at different temperatures. Sci. Total Environ. 2018, 615, 1547–1556. [Google Scholar] [CrossRef]
  14. Xie, J.L.; Li, L.Y.; Sun, L.X.; Pei, Z.G.; Wen, B.; Xing, B.S. Reduced graphene oxide-catalyzed oxidative coupling reaction of 4-methoxyphenol in aerobic aqueous solution. Carbon 2017, 121, 418–425. [Google Scholar] [CrossRef]
  15. Qi, C.D.; Liu, X.T.; Lin, C.Y.; Zhang, H.J.; Li, X.W.; Ma, J. Activation of peroxymonosulfate by microwave irradiation for degradation of organic contaminants. Chem. Eng. J. 2017, 315, 201–209. [Google Scholar] [CrossRef]
  16. Qi, C.D.; Liu, X.T.; Ma, J.; Lin, C.Y.; Li, X.W.; Zhang, H.J. Activation of peroxymonosulfate by base: Implications for the degradation of organic pollutants. Chemosphere 2016, 151, 280–288. [Google Scholar] [CrossRef]
  17. Qi, C.D.; Wen, Y.N.; Zhao, Y.J.; Dai, Y.H.; Li, J.P.; Xu, C.M.; Yang, S.G.; He, H. Enhanced degradation of organic contaminants by Fe(III)/peroxymonosulfate process with l-cysteine. Chin. Chem. Lett. 2022, 33, 2125–2128. [Google Scholar] [CrossRef]
  18. Zang, T.C.; Wang, H.; Liu, Y.H.; Dai, L.; Zhou, S.; Ai, S.Y. Fe-doped biochar derived from waste sludge for degradation of rhodamine B via enhancing activation of peroxymonosulfate. Chemosphere 2020, 261, 127616. [Google Scholar] [CrossRef]
  19. Zhu, B.X.; Yu, Y.; Ding, Y.D.; Ge, S.F. Iron-modified granular sludge biochar-based catalysts for improved Rhodamine B degradation by activating peroxymonosulfate. Biomass Convers. Biorefinery 2022, 2022, 03340. [Google Scholar] [CrossRef]
  20. Liang, C.J.; Lin, Y.T.; Shin, W.H. Persulfate regeneration of trichloroethylene spent activated carbon. J. Hazard. Mater. 2009, 168, 187–192. [Google Scholar] [CrossRef]
  21. Sang, Q.Q.; Wang, F.J.; Zhao, Y.T.; Zhou, Q.; Cai, Y.Q.; Deng, Y.; Tian, W.Q.; Chen, Y.Z.; Ma, J. Application of Iron and Sulfate-Modified Biochar in Phosphorus Removal from Water. Huanjing Kexue 2021, 42, 2313–2323. [Google Scholar] [PubMed]
  22. Huang, W.; Zhang, X.P.; Zhang, J.Q.; Tang, Y.X.; Luo, Z. Preparation of ZVI-biochar derived from magnetically modified sheep manure and its activation of peroxymonosulfate to degrade AO7. Acta Sci. Circumstantiae 2022, 42, 196–208. [Google Scholar]
  23. Cui, Z.-W.; Ren, Y.-F.; Wang, W.; Zhang, L.-M.; Zhang, L.-Y.; Wang, X.-Y.; He, J.-Y. Adsorption Characteristics and Mechanism of Cadmium in Water by Alkali and Magnetic Composite Modified Wheat Straw Biochar. Huanjing Kexue 2020, 41, 3315–3325. [Google Scholar]
  24. Song, Y.Y.; Hu, J.W.; Liu, J.Y.; Evrendilek, F.; Buyukada, M. Catalytic effects of CaO, Al2O3, Fe2O3, and red mud on Pteris vittata combustion: Emission, kinetic and ash conversion patterns. J. Clean. Prod. 2020, 252, 119646. [Google Scholar] [CrossRef]
  25. Li, S.Z.; Zhang, Z.H.; Yi, X.H.; Huang, M.Z. Removal of Rhodamine B by modified pig manure made biochar-activated persulfate (PS). Environ. Chem. 2022, 41, 929–939. [Google Scholar]
  26. Huong, P.T.; Jitae, K.; Al Tahtamouni, T.M.; Tri, N.L.M.; Kim, H.H.; Cho, K.H.; Lee, C. Novel activation of peroxymonosulfate by biochar derived from rice husk toward oxidation of organic contaminants in wastewater. J. Water Process. Eng. 2020, 33, 101037. [Google Scholar] [CrossRef]
  27. Chen, L.W.; Yang, S.J.; Zuo, X.; Huang, Y.; Cai, T.M.; Ding, D.H. Biochar modification significantly promotes the activity of Co3O4 towards heterogeneous activation of peroxymonosulfate. Chem. Eng. J. 2018, 354, 856–865. [Google Scholar] [CrossRef]
  28. Neta, P.; Grodkowski, J.; Ross, A.B. Rate constants for reactions of aliphatic carbon-centered radicals in aqueous solution. J. Phys. Chem. Ref. Data 1996, 25, 709–1050. [Google Scholar] [CrossRef]
  29. Rani, S.K.; Easwaramoorthy, D.; Bilal, I.M.; Palanichamy, M. Studies on Mn(II)-catalyzed oxidation of alpha-amino acids by peroxomonosulphate in alkaline medium-deamination and decarboxylation: A kinetic approach. Appl. Catal. A-Gen. 2009, 369, 1–7. [Google Scholar] [CrossRef]
  30. Wang, Y.; Yang, S.; Zhang, M.X.; Li, C.; Yao, Z.Z.; Zhou, L.L. Degradation of Orange II by ZnFe /BC catalyzed persulfate. Environ. Chem. 2018, 37, 2630–2637. [Google Scholar]
  31. Wang, Z.H.; Guo, H.Y.; Shen, F.; Duan, D.Q. Production of biochar by vermicompost carbonization and its adsorption to Rhodamine-B. Acta Sci. Circumstantiae 2015, 35, 3170–3177. [Google Scholar]
  32. Shi, C.F.; Jia, S.M.; Li, Y.M.; Xue, R.J.; Song, Q.Q.; Wang, G.X. Degradation of p-nitrophenol using rice straw-based biochar and persulfate. Environ. Prot. Chem. Ind. 2017, 37, 632–637. [Google Scholar]
  33. Chen, T.M.; Chen, H.M.; Ma, H.Y.; Tang, K.X.; Zhao, Y.W. Biochar-Co3O4 composite activates peroxymonosulfate to degrade atrazine. China Environ. Sci. 2020, 40, 4786–4794. [Google Scholar]
  34. Shao, Z.C.; Lu, J.; Gao, S.Q.; Xu, J.; Zhang, Z.E. Covalent triazine-based framework activates peroxymonosulfate to degrade sulfamethoxazole. China Environ. Sci. 2020, 40, 135–142. [Google Scholar]
  35. Wang, Y.; Wei, C.; Huang, T.; Wu, W.; Chen, J. Activation of peroxymonosulfate by nitrogen-doped carbon nanotubes to decolorize acid orange 7. China Environ. Sci. 2017, 37, 2583–2590. [Google Scholar]
  36. Yuan, R.X.; Ramjaun, S.N.; Wang, Z.H.; Liu, J.S. Effects of chloride ion on degradation of Acid Orange 7 by sulfate radical-based advanced oxidation process: Implications for formation of chlorinated aromatic compounds. J. Hazard. Mater. 2011, 196, 173–179. [Google Scholar] [CrossRef] [PubMed]
  37. Guan, Y.H.; Ma, J.; Liu, D.K.; Ou, Z.F.; Zhang, W.Q.; Gong, X.L.; Fu, Q.; Crittenden, J.C. Insight into chloride effect on the UV/peroxymonosulfate process. Chem. Eng. J. 2018, 352, 477–489. [Google Scholar] [CrossRef]
  38. Ghauch, A.; Tuqan, A. Oxidation of bisoprolol in heated persulfate/H2O systems: Kinetics and products. Chem. Eng. J. 2012, 183, 162–171. [Google Scholar] [CrossRef]
  39. Kang, Y.M.; Kim, M.K.; Zoh, K.D. Effect of nitrate, carbonate/bicarbonate, humic acid, and H2O2 on the kinetics and degradation mechanism of Bisphenol-A during UV photolysis. Chemosphere 2018, 204, 148–155. [Google Scholar] [CrossRef]
  40. Fu, H.C.; Ma, S.L.; Zhao, P.; Xu, S.J.; Zhan, S.H. Activation of peroxymonosulfate by graphitized hierarchical porous biochar and MnFe2O4 magnetic nanoarchitecture for organic pollutants degradation: Structure dependence and mechanism. Chem. Eng. J. 2019, 360, 157–170. [Google Scholar] [CrossRef]
  41. Song, H.R.; Yan, L.X.; Ma, J.; Jiang, J.; Cai, G.Q.; Zhang, W.J.; Zhang, Z.X.; Zhang, J.M.; Yang, T. Nonradical oxidation from electrochemical activation of peroxydisulfate at Ti/Pt anode: Efficiency, mechanism and influencing factors. Water Res. 2017, 116, 182–193. [Google Scholar] [CrossRef] [PubMed]
  42. Guan, Y.H.; Ma, J.; Ren, Y.M.; Liu, Y.L.; Xiao, J.Y.; Lin, L.Q.; Zhang, C. Efficient degradation of atrazine by magnetic porous copper ferrite catalyzed peroxymonosulfate oxidation via the formation of hydroxyl and sulfate radicals. Water Res. 2013, 47, 5431–5438. [Google Scholar] [CrossRef] [PubMed]
  43. Guan, C.T.; Jiang, J.; Luo, C.W.; Pang, S.Y.; Yang, Y.; Wang, Z.; Ma, J.; Yu, J.; Zhao, X. Oxidation of bromophenols by carbon nanotube activated peroxymonosulfate (PMS) and formation of brominated products: Comparison to peroxydisulfate (PDS). Chem. Eng. J. 2018, 337, 40–50. [Google Scholar] [CrossRef]
  44. Buxton, G.V.; Greenstock, C.L.; Helman, W.P.; Ross, A.B. Critical review of rate constants for reactions of hydrated electrons, hydrogen atoms and hydroxyl radicals. Phys. Chem. Ref. Data 1998, 17, 513–886. [Google Scholar] [CrossRef]
Figure 1. Preparation process of RBCs.
Water 15 02015 g001
Figure 2. SEM images of different activators. (a) RBC400. (b) RBC500. (c) RBC600.
Water 15 02015 g002aWater 15 02015 g002b
Figure 3. Effect of pyrolysis temperature on N2 physisorption isotherms and pore characteristics.
Water 15 02015 g003aWater 15 02015 g003b
Figure 4. FT-IR diagrams of different activators.
Water 15 02015 g004
Figure 5. XPS diagrams of different biochar: (a) RBC400, (b) RBC500, and (c) RBC600.
Water 15 02015 g005aWater 15 02015 g005b
Figure 6. Effect of pyrolysis temperature on the crystal structure of rabbit manure biochar.
Water 15 02015 g006
Figure 7. RhB removal effect of different systems (Reaction condition: PMS = 0.4 g/L, RBC = 0.6 g/L, RhB = 50 mg/L, and T = 25 °C).
Water 15 02015 g007
Figure 8. Pseudo-first-order kinetic model of RhB degradation in different systems.
Water 15 02015 g008
Figure 9. Degradation performance under different biochar dosages. (Reaction condition: PMS = 0.4 g/L, RBC = 0.2, 0.4, 0.6, 0.8, 1.0 g/L, RhB = 50 mg/L, and T = 25 °C).
Water 15 02015 g009
Figure 10. Degradation performance under different PMS dosages. (Reaction condition: PMS = 0.2, 0.4, 0.6, 0.8, 1.0 g/L, RBC = 0.6 g/L, RhB = 50 mg/L, and T = 25 °C).
Water 15 02015 g010
Figure 11. Adsorption performance at different pHs. (Reaction condition: PMS = 0.4 g/L, RBC = 0.6 g/L, RhB = 50 mg/L, T = 25 °C, and pH = 3, 5, 7, 9, and 11).
Water 15 02015 g011
Figure 12. Adsorption performance under different reaction temperatures. (Reaction conditions: PMS = 0.4 g/L, RBC = 0.6 g/L, RhB = 50 mg/L, and T = 15 °C, 5 °C, 35 °C, 45 °C).
Water 15 02015 g012
Figure 13. Adsorption performance under different water background components. (a) Cl, (b) HCO3, (c) NO3, and (d) HA. (Reaction conditions: PMS = 0.4 g/L, RBC = 0.6 g/L, RhB = 50 mg/L, T = 25 °C, Cl, HCO3, NO3 = 2, 5, 10 mmol/L, and HA = 5, 10, and 20 mg/L).
Water 15 02015 g013
Figure 14. Effect of (a) MeOH, (b) TBA, (c) BQ, and (d) L-His on RhB degradation.
Water 15 02015 g014
Figure 15. (a) SO4 and ·OH, (b) O2, and (c) 1O2 EPR spectrum.
Water 15 02015 g015
Figure 16. Mechanism diagram of RhB degradation in the RBC600/PMS system.
Water 15 02015 g016
Figure 17. Repeated catalytic activity test of RBC600.
Water 15 02015 g017
Table 1. Test results of biochar surface characteristics.
BiocharSpecific Surface Area (m2/g)Total Pore Volume (cm3/g)Micropore Volume (cm3/g)Mean Aperture (nm)
RBC40016.8870.0230.000113.196
RBC50057.0950.0840.00086.493
RBC60089.0270.1360.00576.855
Table 2. Biochar surface element composition.
BiocharSurface Element Percentage/%
O 1 sC 1 sN 1 sOther
RBC40015.7879.244.550.43
RBC50014.3879.725.320.58
RBC60013.6181.444.440.51
Disclaimer/Publisher’s Note: The statements, opinions and data contained in all publications are solely those of the individual author(s) and contributor(s) and not of MDPI and/or the editor(s). MDPI and/or the editor(s) disclaim responsibility for any injury to people or property resulting from any ideas, methods, instructions or products referred to in the content.

