Article

Taxonomic Structure of Planktonic Protist Communities in Saline and Hypersaline Continental Waters Revealed by Metabarcoding

by
Elena A. Gerasimova
1,*,
Alexander S. Balkin
2,
Ekaterina S. Filonchikova
2,
Yulia V. Mindolina
2,
Dmitry G. Zagumyonnyi
1,3 and
Denis V. Tikhonenkov
1,3
1
AquaBioSafe Laboratory, University of Tyumen, Tyumen 625003, Russia
2
Laboratory of Biomedical Technologies, Institute for Cellular and Intracellular Symbiosis, Ural Branch of Russian Academy of Sciences, Orenburg 460000, Russia
3
Papanin Institute for Biology of Inland Waters, Russian Academy of Sciences, Borok 152742, Russia
*
Author to whom correspondence should be addressed.
Water 2023, 15(11), 2008; https://doi.org/10.3390/w15112008
Submission received: 19 April 2023 / Revised: 18 May 2023 / Accepted: 22 May 2023 / Published: 25 May 2023

Abstract

:
Saline and hypersaline waters are one of the most peculiar ecosystems of our planet, characterized by extreme life conditions. Despite their worldwide distribution, the diversity and abundance of protist communities in these ecosystems remain poorly studied. Here, we analyze planktonic communities of protists sampled across 38 saline and hypersaline water environments (2–390‰) from arid climatic zones of the South Urals and Crimea in light of environmental data using high-throughput 18S rDNA amplicon sequencing. A total of 9 eukaryotic supergroups, 34 phyla, 104 classes, 184 orders, 315 families and 548 genera have been identified. We revealed significant differences in the taxonomic structure of protist communities depending on salinity, geographic location and pH. The protist communities demonstrated linear regression of richness and diversity and growth of the percentage of unclassified Eukaryota (up to 43%) with the increase in salinity. Centrohelids demonstrated the ability to inhabit a broad range of salinities, up to 320‰, which is four times higher than previously reported. Centrohelid species Pinjata ruminata and Yogsothoth sp. are assumed to be specifically adapted to salinity of 3–210‰. The obtained results provide insight into the taxonomy and diversity of protists in saline and hypersaline environments and highlight the great potential for the discovery of new taxa due to the large number of unclassified 18S rDNA sequences.

1. Introduction

Extreme environments are widely distributed around the world and represented by terrestrial hot springs, deep sea hydrothermal vents, glaciers and permafrost, acid mine drainage and hypersaline habitats [1,2]. Despite extreme chemical and physical conditions, they are inhabited by a wide range of organisms from the three domains of life [3,4,5,6,7].
The hypersaline lakes are one of the most peculiar ecosystems with extreme life conditions due to high salinity, low oxygen concentration and unstable hydrology [8,9,10,11]. Hypersaline waters (from 40‰ to more than 300‰) have never been clearly classified [12]. In this study, by “hypersaline” we mean waterbodies with a salinity exceeding marine (>40‰) according to the Venice System [13] and classify them according to Por [12]. Hypersaline lakes are geographically widespread and usually originate as inland drainage basins and occur in arid and semi-arid climatic zones [10,14,15,16]. Most hypersaline lakes are located in South America, Africa, Spain, Australia, the south-western parts of the United States, China and Russia [17,18]. Hypersaline lakes still remain largely understudied despite their wide variety, large surface area, and intense microbial activity. Their detailed studies have been carried out in different areas of the world including the USA [19,20], Mongolia [21], Iran [22], Australia [23], Portugal [24], the Andean altiplano [25] and Spain [18], among others. Early biodiversity and ecological studies of these environments were mainly focused on the prokaryotic microbial communities [26,27,28,29,30,31,32,33], while much less attention has been paid to microbial eukaryotes [4]. It was found that high salinity causes high osmotic stress in organisms inhabiting hypersaline waters and is one of the main environmental factors influencing the composition of the microbial community [34,35].
High-throughput sequencing (HTS) technology has great potential for biodiversity studies and analysis of the influence of ecological and environmental factors [4,18,36,37]. Environmental DNA metabarcoding overcomes the limitations of traditional surveys [8,38,39] and has proven to be valuable for the study of many ecosystems [40], especially extreme environments [5]. Over the past 20 years, our knowledge of protist communities and taxa inhabiting hypersaline environments has significantly improved through the application of HTS [6,41,42]. Hypersaline environments have been shown to contain unexpectedly large genetic diversity and novelty of protists [6,8,43,44,45]. Diversity, distribution along salinity gradients and large-scale biogeography of protist communities from hypersaline waters have also been studied using HTS applications [18,44,46].
Crimea, the largest peninsula of the Black Sea, contains more than 50 saline and hypersaline lakes of continental and marine origin [11]. The extreme conditions of Crimean lakes are caused not only by high salinity, but also by unstable hydrology, high air and water temperatures (up to 35–40 °C in summer), and low oxygen concentration [11]. The investigated group of the South Ural hypersaline environments contains seven Sol-Iletsk lakes and a waterlogged area with a salinity gradient along the Tuzlukkol’ River. The Sol-Iletsk lakes have a karst-anthropogenic origin [47]. They belong to the national heritage of Russia and are recreation sources of Sol-Iletsk resort and are used for balneological and saline treatment. The lowland Tuzlukkol’ River is a small left-bank tributary of the Ural River. We investigated the waterlogged solonchak area within the natural boundary of the Tuzlukkol’ River. The solonchak has a geological origin and is associated with the occurrence of salts of the Kungurian stage of the Permian. There are numerous underground hypersaline springs of chloride–sulfate type, which merge with the main water flow and cause a salinity gradient within the natural boundary of the Tuzlukkol’ River. The waterlogged solonchak contains small lakes with therapeutic mud that are used for balneological and saline treatment. All studied saline and hypersaline water environments of the South Urals and Crimea have unstable hydrology and belong to a group of high mineralized water bodies of sodium–chloride type.
Here, we present the first study of the planktonic protist’s diversity from saline and hypersaline water environments (2–390‰) from the South Urals and Crimea in the light of 18S rDNA metabarcoding data. In addition, we discuss changes in the protist community composition from different locations and its dependence on salinity and pH.

2. Materials and Methods

2.1. Sampling Sites and Collection

Fifty-seven planktonic water samples were collected from saline and hypersaline continental water bodies (predominantly lakes) with a salinity of 2–390‰ from July to August 2021. Samples were obtained from geographically distinct water environments of arid climatic zones of the South Ural (Sol-Iletsk lakes, the Tuzlukkol’ River) and Crimea. Most of the studied habitats belong to the recreation zones or are located in specially protected areas but are publicly accessible (see Figure 1 and Table S1 for more detailed information about the sampling sites).
Planktonic water samples were taken in sterile containers at 1–30 cm depth. Samples were stored in a portable refrigerator at +4 °C. For DNA analysis, water samples were consequentially filtered through 5.0 µm and 0.45 µm pore-size nitrocellulose membranes using sterile reusable 25 mm syringe filter holders (Sartorius, Göttingen, Germany) within a few hours after collection. After filtration, each membrane filter was placed in a 1.5 mL Eppendorf tube and stored in 200 µL of 2× DNA/RNA Shield (Zymo Research, Tustin, CA, USA) at +4 °C (throughout the expedition). We studied a total of 114 environmental water samples collected from the Tuzlukkol’ River (14 sampling points, 28 samples), Sol-Iletsk (7 lakes, 14 samples) and Crimea (36 sampling points, 72 samples).
Salinity was measured in situ using the Master-S28a salinity refractometer (Atago, Tokyo, Japan). For salinity measurement exceeding the maximum range of 280‰, the sample was diluted v/v by distilled water. Samples were classified into six salinity categories: mixohaline (0.5–30‰), euhaline (30–40‰), alpha-hypersaline (40–100‰), beta-hypersaline (100–140‰), gamma-hypersaline (140–200‰) and delta-hypersaline (above 200‰).

2.2. eDNA Extraction, Amplification and 18S rDNA Library Preparation

The samples were stored in the laboratory at −80 °C until DNA extraction. For DNA extraction, each membrane was transferred into a Lysing Matrix E tube (MP Biomedicals, LLC, Solon, OH, USA) with the addition of 2× volume of tris-saline buffer (1M Tris-HCl; 0.5M EDTA; 5 M NaCl; MQ) and homogenized for 5 min at 50 Hz (TissueLyser LT, Qiagen, Hilden, Germany). Then, membranes were enzymatically digested (lysozyme, proteinase K, SDS in total conc. 1%) and DNA was phenol-chloroform extracted (phenol-chloroform 1:1 v/v; chloroform-isoamyl alcohol 24:1 v/v) as reported previously [45]. Purification and desalination of DNA were carried out using a DNA Clean and Concentrator-5 kit (Zymo Research, Tustin, CA, USA). The final quality of the DNA was checked using electrophoresis in 1% agarose gel. The concentration of DNA was quantified with a Qubit 4 fluorometer (Invitrogen, Carlsbad, CA, USA) using a Qubit 1× dsDNA HS Assay Kit (Invitrogen, Carlsbad, CA, USA). The nuclease-free water (Qiagen, Hilden, Germany) was taken as a negative control of water sample filtration, and ZymoBIOMICS Spike-in Control I (Zymo Research, Tustin, CA, USA) was used as a positive control of high-throughput sequencing. PCR amplification of the 18S rRNA gene (primers set according to [45]) and further sequencing were performed using the Illumina MiSeq platform and MiSeq Reagent Kit V3 2 × 300 bp (Illumina, San Diego, CA, USA) according to the Illumina workflow (Illumina protocol, Part #15044223, Rev. B).

2.3. eDNA Analysis

The quality of sequenced reads was checked using FastQC (https://www.bioinformatics.babraham.ac.uk/projects/fastqc/, accessed on 1 December 2022). Cutadapt v. 4.1 [48] was used for the removal of primer sequences from the reads. The DADA2 workflow v. 1.26 [49] was used for further sequence analysis, including quality filtering (maxEE = 2), reads merging, chimera removal, and amplicon sequence variants (ASVs) generation. The obtained ASVs were taxonomically classified using a pre-trained naive Bayes classifier, which was trained on the PR2 database version 4.14.0 [50]. The macrotaxonomy in the PR2 database does not always correspond to the latest taxonomic revisions of the eukaryotic tree [51,52], in particular for Excavata and Hacrobia, but we used it for consistency of our data with the results of previous metabarcoding analyses. The identity of the ASVs assigned to the centrohelids (Centroplasthelida) was additionally checked using the BLAST algorithm identity against the NCBI nucleotide database.
The raw reads dataset was deposited in the National Center for Biotechnology Information (NCBI) and is available under project accession number PRJNA971617.

2.4. Phylogenetic Analysis of Centrohelids’ ASVs

Sequences of centrohelid 18S rDNA from NCBI and ASVs were aligned using the L-INS-i algorithm in MAFFT version 7.475 [53] and trimmed using the ‘-gappyout’ method in TrimAl version 1.2 [54]. Maximum likelihood phylogeny for 311 taxa (255 centrohelids, 45 ASVs and 11 noncentrohelid protist taxa as the outgroup) was inferred using IQ-TREE v1.6.12 [55] with 816 unambiguously aligned positions, 1000 nonparametric bootstraps under the best fit model (TN + F + R5) determined by the in-built ModelFinder.

2.5. Statistical Analysis

All statistical analyses and visualization were performed in the R environment using phyloseq [56], ggplot2 [57], MicrobiotaProcess [58] and microbiome [59] packages. Indexes of alpha diversity were calculated using the alpha function from the microbiome R package. The Bray–Curtis dissimilarity was used for beta diversity comparison in the get_pcoa function. Pearson’s rank correlation coefficient was used to analyze a possible dependence between alpha diversity indexes and the mineralization or pH of water samples. The statistical differences in community composition by mineralization, pH and geographical location were evaluated with PERMANOVA using the adonis2 function with 999 permutations.
Rarefaction curves were constructed based on the observed ASVs after filtering of non-eukaryotic and metazoan sequences. The ratio of the total number of detected ASVs to the species richness index (Chao1 index) was used to quantify the coverage of protist communities.

3. Results

3.1. Sequence Data Overview

A total of 5,249,054 paired-end reads of the 18S rRNA gene were obtained, of which 5,163,087 (98.4%) remained after quality filtering. The average depth of pair-end reads was about 46,000 per sample. After the removal of non-specific amplification sequences, filtering by quality, dereplication, removal of chimeric sequences and reads merging at the output of the DADA2 pipeline, an average of 46.1% of the reads were retrieved (Table S2). Non-eukaryotic and metazoan ASVs were removed from further analysis. Among the remaining 7604 ASVs, 3237 (42.6%) were assigned to supergroups, 2783 ASVs (36.6%) to phyla, 2533 ASVs to classes (33.3%), 2338 ASVs to orders (30.7%), 2161 ASVs to families (28.4%) and 1768 ASVs to genera (23.3%).
The highest number of the ASVs were observed in the Tuzlukkol’, Kyzyl-Yar and Opuk samples, the smallest ones in delta-hypersaline lakes Krasnoe (Zelenoe), Razval and Novoe. An average of 163 ± 92.7 ASVs per sample were found in the 38 saline and hypersaline water environments. We detected a total of 4367 ASVs (16% of total reads) belonging to eukaryotic supergroups and lineages of uncertain affiliation. Unclassified ASVs averaged 57.4% at the supergroups level, 63.4% at the phyla level, 66.7% at the classes level, 69.3% at the orders level, 71.6% at the families level and 76.6% at the genera levels.
The rarefaction curves reached a plateau after a point of 5000 sequences in the majority of sequencing libraries (Figure 2). The sequencing coverage value for the samples varied from 75.8% in Dunino Lake to 100% in Krugloe Lake (an average of 96.38 ± 0.004% for all samples), indicating that the protist communities in all studied water habitats were analyzed almost completely (Table S3).

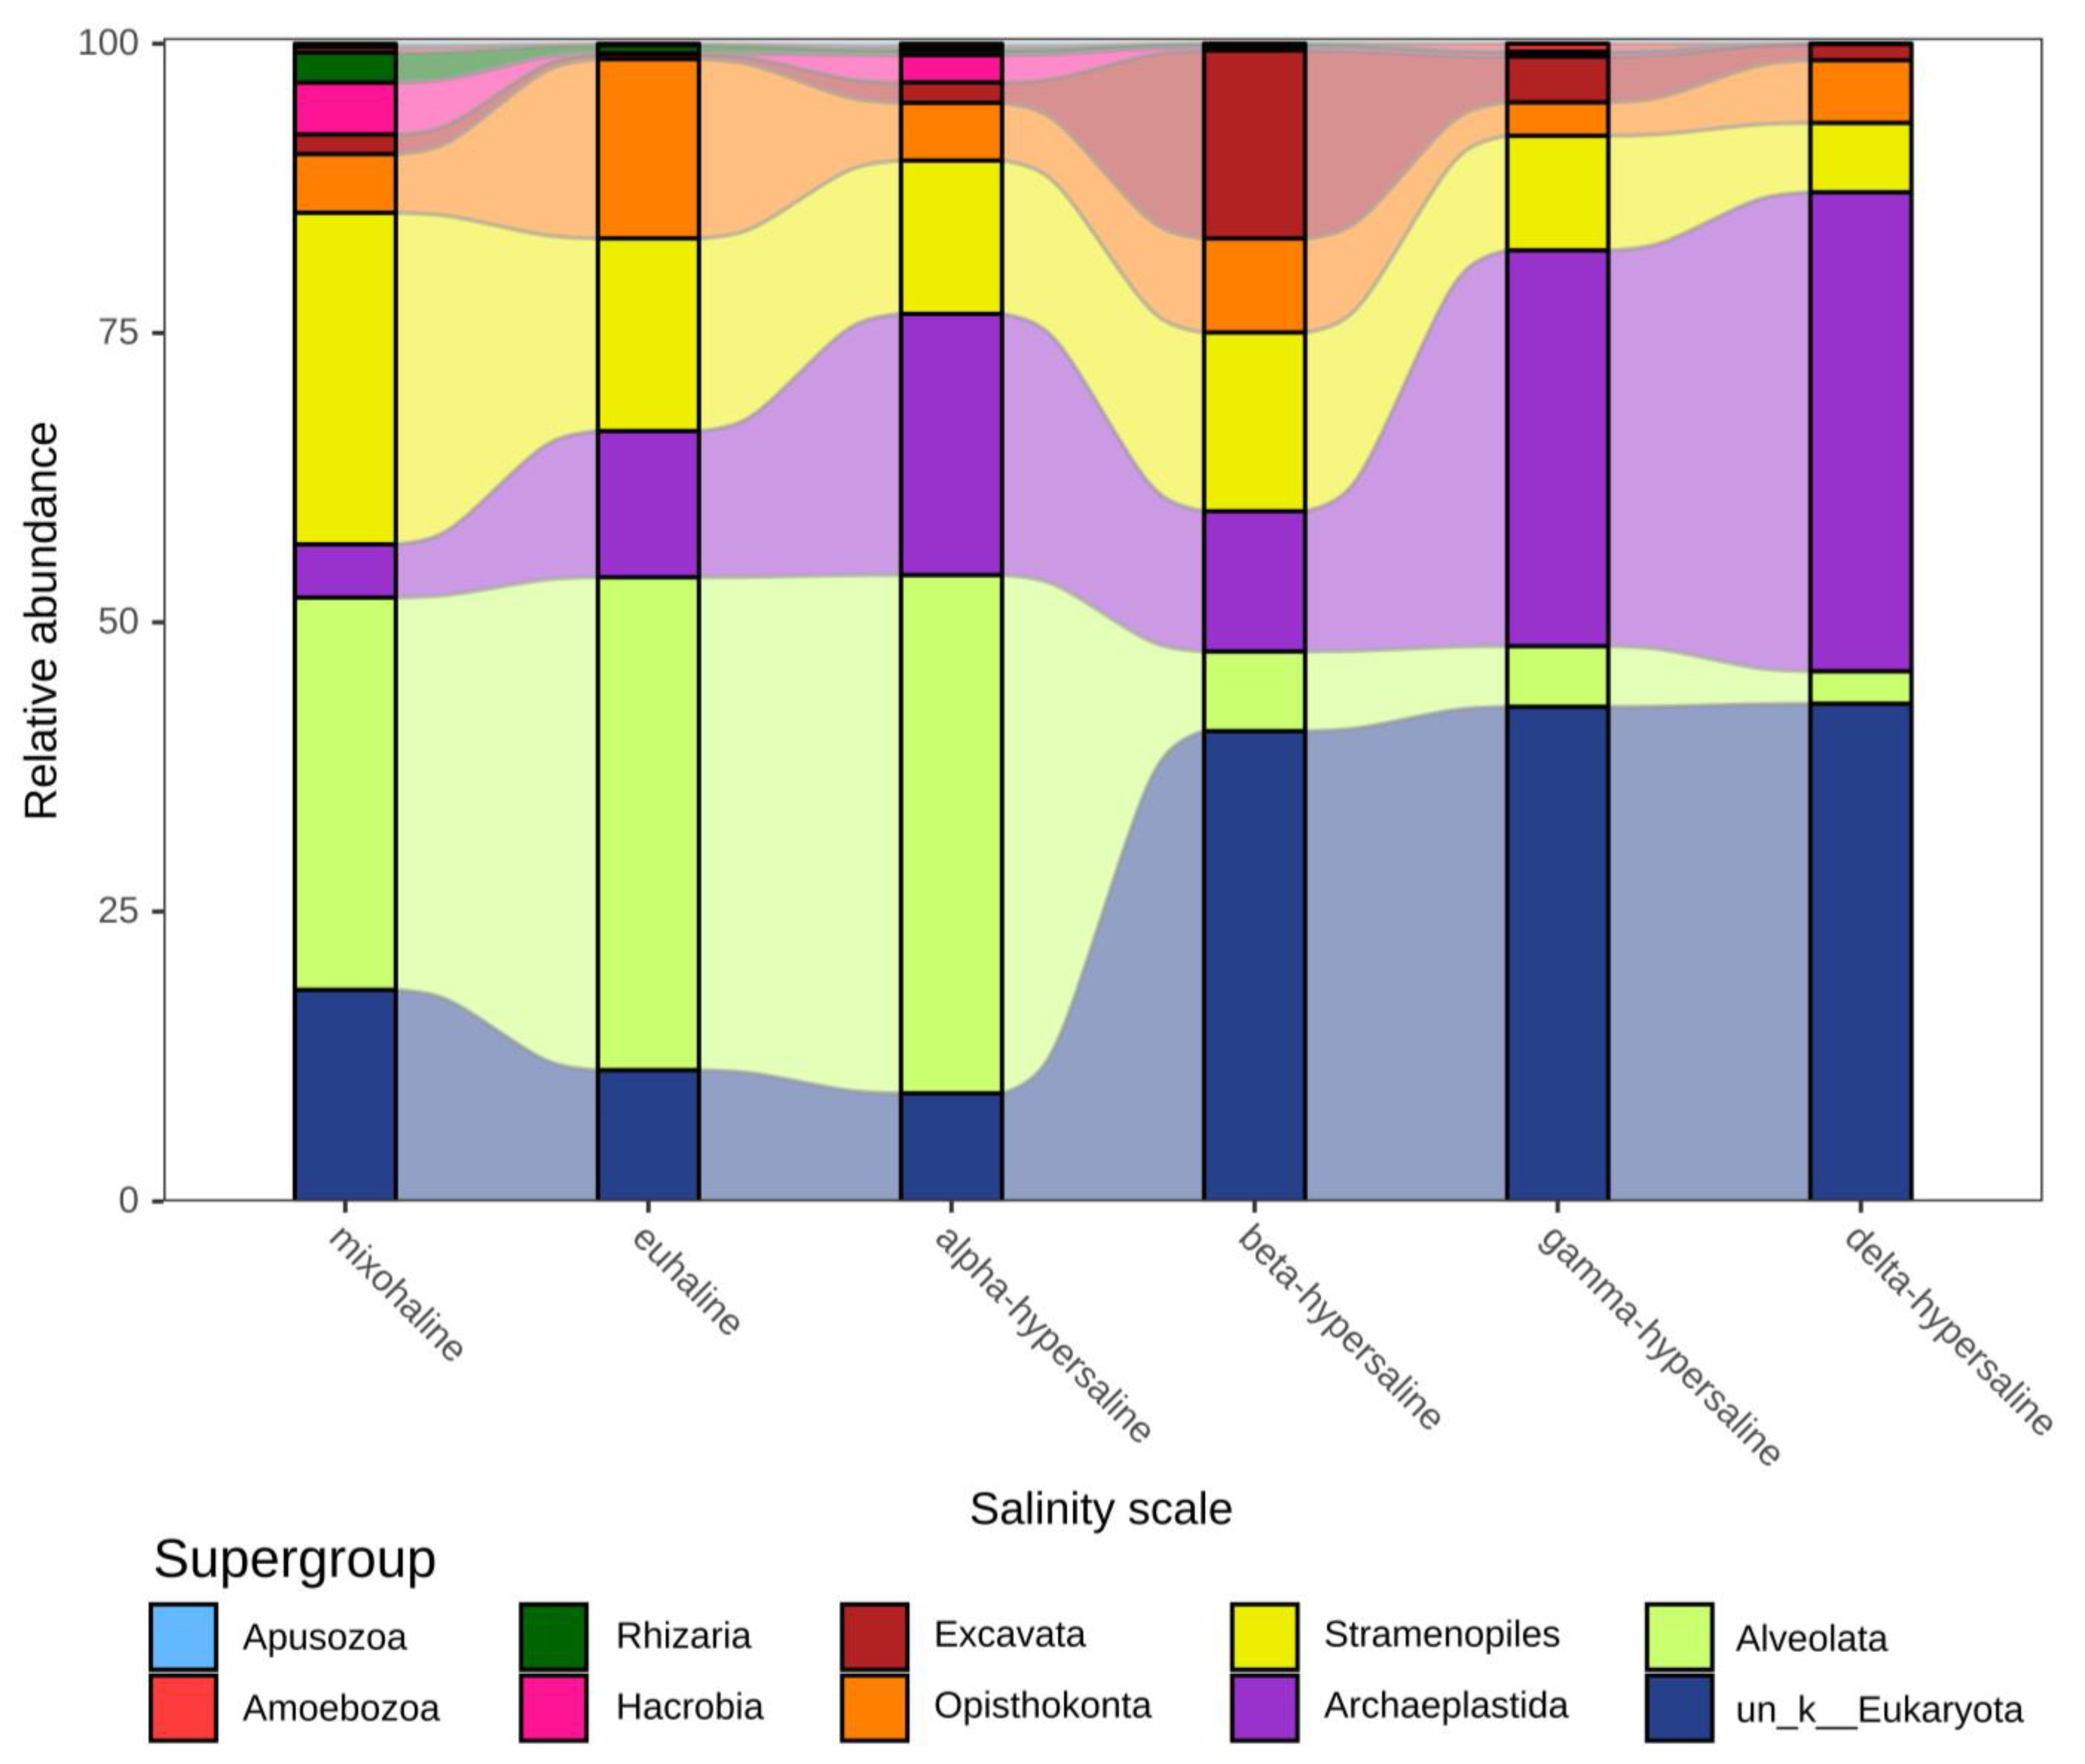
3.2. Taxonomic Composition and Distribution of Protists Communities

A total of 9 eukaryotic supergroups, 34 phyla, 104 classes, 184 orders, 315 families and 548 genera have been identified (Table S4). The communities of protists were represented by Alveolata, Amoebozoa, Apusozoa, Archaeplastida, Excavata, Hacrobia, Opisthokonta, Rhizaria and Stramenopiles supergroups (Figure 3). Archaeplastida (30.7%), Alveolata (24.9%) and Stramenopiles (16.6%) were dominant in studied environments (Table S5), whereas the amount of Amoebozoa, Apusozoa and Rhizaria were scarce (<1%). The relative abundance of unclassified Eukaryota at the supergroups level accounted for 16% of total reads (Table S5). Chlorophyta, Ciliophora, Ochrophyta, Dinoflagellata, Fungi and Discoba were the most abundant phyla of protists in saline and hypersaline environments (Tables S6 and S7). According to sequencing data, Chlorophyta, Ciliophora, Ochrophyta, Dinoflagellata, Fungi, Discoba, Opalozoa and Cercozoa predominate in all samples of the studied ecosystems. The taxonomic composition of the investigated water bodies is shown in Figure 3 and Table S4.
Archaeplastida was clearly the dominant group in the samples from Sol-Iletsk and Crimea, accounting for 36.8% and 22.5% in terms of relative abundance, respectively (Figure 4).
Chlorophyta dominated among Archaeplastida and were especially abundant in the Sol-Iletsk (36.8%) and Crimea (21.7%) samples (Figure 5).
Overall, the top three dominant genera among the Archaeplastida were Chlamydomonas, Dunaliella and Sphaeroplea (Figure 6). Dunaliella appeared as the dominating genus of green alga in the Sol-Iletsk and Crimea samples, accounting for 18.2% and 18.1% of the reads, respectively.
Alveolata was the most prevalent group in the samples from Tuzlukkol’ and the second dominating supergroup in the Crimea samples (Figure 4). The most common phylum among alveolates was Ciliophora, namely the genera Platyophryida, Fabrea, Strombidium, Frontonia, Ancistrum and Euplotes. The representatives of Ciliophora were one of the dominants in the Tuzlukkol’ samples (Figure 5). At the genus level, Strombidium, Fabrea, Ancistrum and Frontonia were most prevalent in Tuzlukkol’ habitats, followed by unclassified Choreotrichida and Scuticociliatia (Figure 6). Alveolate phylum Dinoflagellata (Figure 5) was the most represented in Crimea samples and mainly includes genera Prorocentrum, Gyrodinium, Diplopsalis and Ansanella (Figure 6).
Stramenopiles was the second dominating supergroup in the Tuzlukkol’ samples and third dominating supergroup in the Crimean samples, accounting for 24.9% and 16.1%, respectively (Figure 4). Among them, Diatomea genera Cyclotella, Cylindrotheca, Navicula and Chaetoceros were prevalent (Figure 6). In particular, the stramenopiles genus Halocafeteria (Opalozoa) was specific for the Crimea samples (Figure 6).
Amoebozoa and Apusozoa were detected at a relative abundance of <1% in the protist communities of saline and hypersaline water bodies of the investigated areas (Figure 3 and Figure 4). Notably, Amoebozoa were absent in the Sol-Iletsk samples (Figure 4).
Hacrobia were mainly found in samples from Crimea and Tuzlukkol’, accounting for 2.3% and 1.9% of the reads, respectively, and were one of the less represented groups in the Sol-Iletsk lakes (Figure 4). The most represented phyla of Hacrobia in all samples were Cryptophyta, Haptophyta and Centroheliozoa. The representatives of the Cryptophyta were mainly affiliated with genera Cryptomonas, Guillardia, Hemiselmis, Rhodomonas and Teleaulax (Tables S6 and S7).
The remaining ASVs belonged to Excavata and Opisthokonta supergroups (Figure 3 and Figure 4). Notably, excavates were mainly represented in the Sol-Iletsk samples, accounting for 10.6% of the reads, whereas opisthokonts were more typical for samples from Crimea (6.4%) and Tuzlukkol’ (5.6%) (Figure 4). Excavate phylum Discoba was the third most prevalent group in the Sol-Iletsk samples, accounting for 36.5% of the reads. At the genus level, Discoba was mainly affiliated with Euplaesiobystra (Heterolobosea), accounting for 10.5% of the reads in the samples from Sol-Iletsk (Figure 6). Overall, a high percentage of the total reads belonging to Opisthokonta was assigned to Fungi (Figure 5). Choanoflagellida was present in a low percentage, almost entirely belonging to the order Craspedida.
Unclassified eukaryotes were the most represented in Sol-Iletsk and Crimea samples, accounting for 39.5% and 28.4% of the total number of sequenced reads, respectively (Figure 4). At the same time, 17.5% of reads in the samples from Tuzlukkol’ could not be precisely assigned to any known eukaryotic taxonomic group (Figure 4).
Considering the taxonomic structure of protist communities in three geographically distinct water environments (Table S6), it is noteworthy that the most represented supergroups in the Crimea samples were Archaeplastida, Alveolata, Stramenopiles and Opisthokonta (Figure 4). The most prevalent genera in the Crimean lakes were Euplotes, Fabrea, Platyophryida, Strombidium (Ciliophora, Alveolata), Oxyrrhis, Prorocentrum (Dinoflagellata, Alveolata), Dunaliella (Chlorophyta, Archaeplastida), Navicula, Chaetoceros (Ochrophyta, Stramenopiles) and Exobasidiomycetes (Fungi, Opisthokonta) (Figure 6). The protist communities in the Sol-Iletsk lakes are mostly represented by Archaeplastida, Excavata, Stramenopiles and Alveolata supergroups (Figure 4). Genera Dunaliella, Sphaeroplea, Chlamydomonas and Carteria (Chlorophyta, Archaeplastida), Euplaesiobystra (Discoba, Excavata), Cyclotella (Ochrophyta, Stramenopiles) and Fabrea (Ciliophora, Alveolata) were especially abundant in the Sol-Iletsk lakes (Figure 6). Protist communities in the Tuzlukkol’ samples were mainly represented by Alveolata, Stramenopiles, Archaeplastida and Opisthokonta (Figure 4). The most abundant genera were Strombidium, Fabrea, Ancistrum, Frontonia, Parallelostrombidium (Ciliophora, Alveolata), Chlamydomonas (Chlorophyta, Archaeplastida) and Cylindrotheca, Navicula, Entomoneis (Ochrophyta, Stramenopiles) (Figure 6).

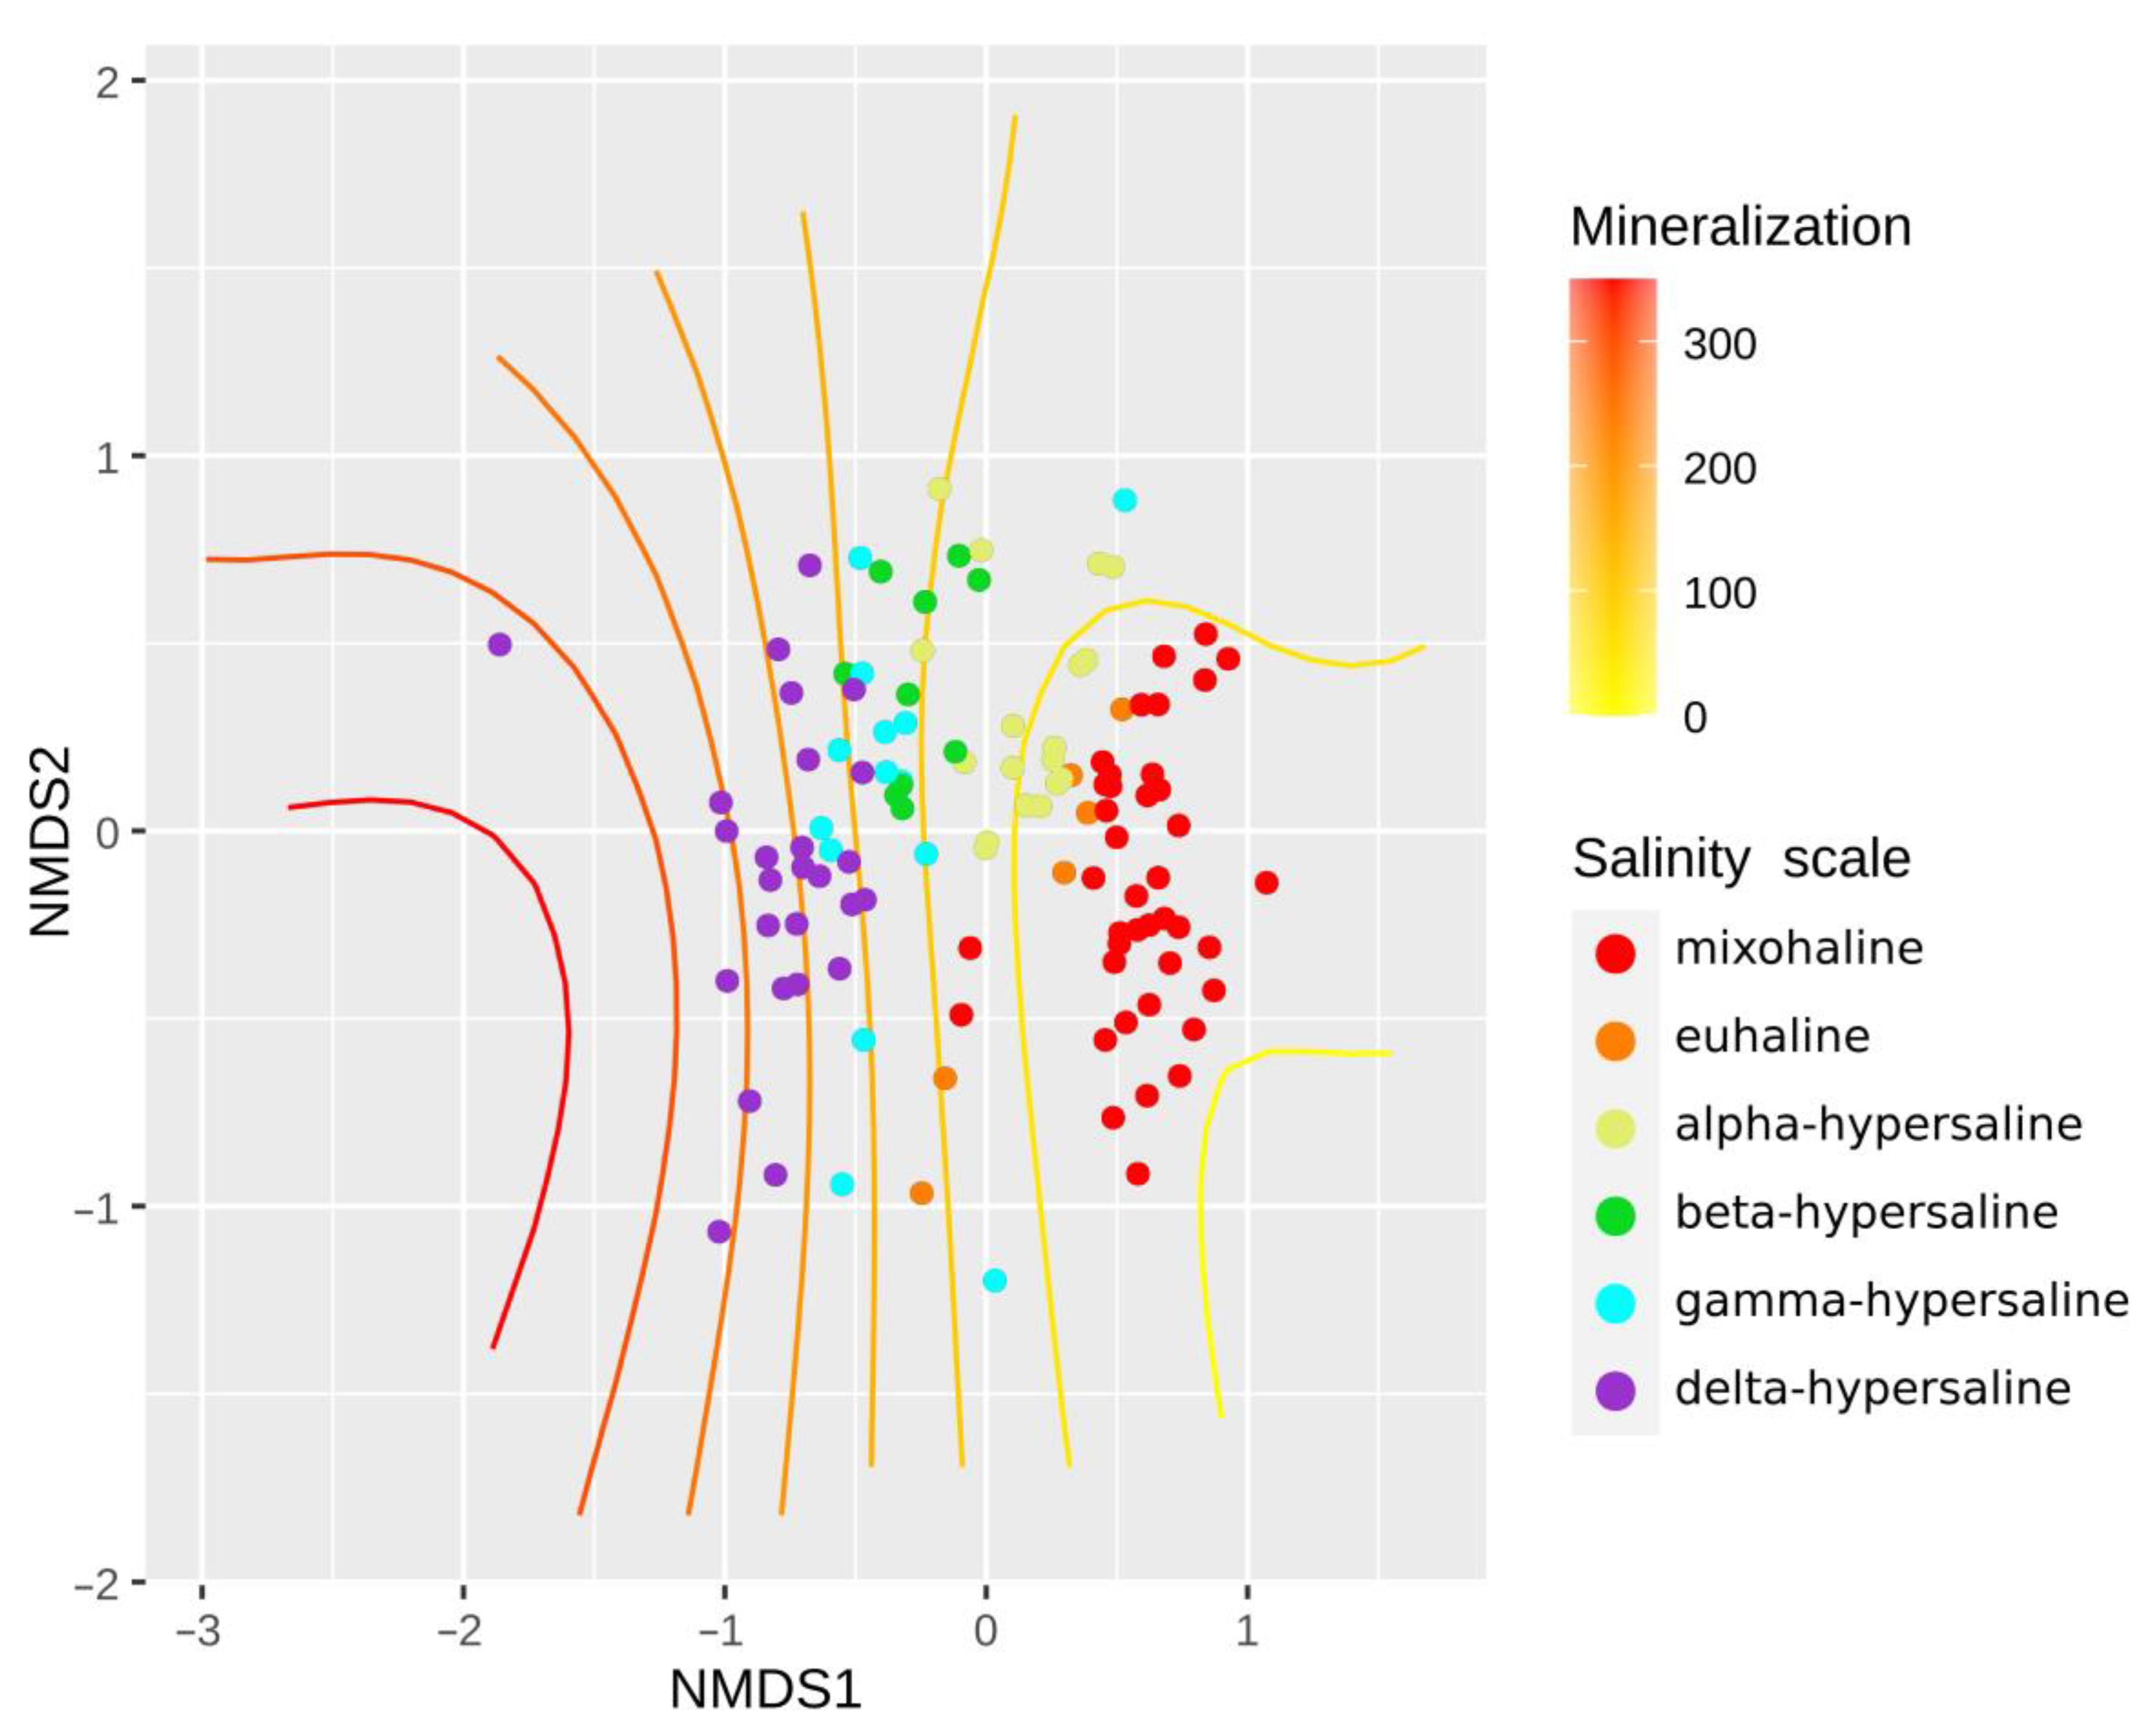
3.3. Protist Diversity and Salinity

We analyzed the diversity of the protist community across a broad salinity range (2–390‰). In mixohaline waters, Alveolata (33.6%) and Stramenopiles (28.6%) were the most abundant supergroups, while Amoebozoa and Apusozoa were scarce (<1%) (Figure 7, Table S7).
The abundance of all other supergroups ranged from 1.6% to 5% of the total reads. The phyla Ochrophyta (24.1%) and Ciliophora (23.2%) were clearly dominant in mixohaline waters (Figure 8).
In particular, the most prevalent classes among Ochrophyta were Chrysophyceae and Diatomeae, and Spirotrichea and Oligohymenophorea were prevalent among Ciliophora. A total amount of unclassified eukaryotes in the mixohaline waters was 18.3% at the level of supergroups (Figure 7).
In euhaline waters, Alveolata (42.5%), Stramenopiles (16.7%), Opisthokonta (15.5%) and Archaeplastida (12.6%) were the most represented supergroups (Figure 7). Relative abundance of Alveolata, Archaeplastida and Opisthokonta was higher compared to mixohaline waters, while the abundance of Stramenopiles decreased by almost two times.
In general, Alveolata (44.5%) and Archaeplastida (22.6%) tend to increase in relative abundance in alpha-hypersaline waters compared to mixohaline and euhaline ones, while Stramenopiles (13.3%) show the opposite. The relative abundance of the Ciliophora and Chlorophyta increased compared to mixohaline and euhaline waters, while the abundance of dinoflagellates decreased. In addition, the number of unclassified eukaryotes decreased to 9.3% in alpha-hypersaline waters (Figure 8).
In beta-, gamma- and delta-hypersaline waters, a significant increase in the relative abundance of unclassified eukaryotes (to 40.6%, 42.7% and 43%, respectively) and a decrease in the representation of known supergroups were noted (Figure 8). Archaeplastida (especially Dunaliella) demonstrates considerable growth in relative abundance in gamma- (34.2%) and delta-hypersaline waters (41.4%), but their abundance drops to 12% in beta-hypersaline waters (Figure 9).
Alveolates and Stramenopiles are characterized by a significant decrease in their abundance in beta-, gamma- and delta-hypersaline waters (Figure 7). The relative abundance of Opisthokonta decreased from beta- to delta-hypersaline water habitats. The abundance of Hacrobia, Amoebozoa and Rhizaria supergroups was insignificant (<1%). Interestingly, despite the insignificant abundance of Excavata (0.4–3.9%) at all other salinities, they reach a significant relative abundance in beta-hypersaline waters (16.3%) (Figure 7).
Considering the distribution of representatives of the main supergroups, it is notable that Alveolata was more represented in alpha-hypersaline, euhaline and mixohaline water bodies. The most common alveolate phylum here was Ciliophora. Chlorophyta (Archaeplastida) were confined mainly to gamma-hypersaline and delta-hypersaline water bodies, accounting for 34% and 39.8% of reads, respectively. Dunaliella was one of the most prevalent genus of Chlorophyta in the hypersaline water bodies of Sol-Iletsk and Crimea, with a salinity of more than 140‰. The abundance of Stramenopiles and Rhizaria decreased with the increasing salinity. The most represented group of Stramenopiles, Ochrophyta, prevailed at a salinity of less than 40‰. Chrysophyceae were mainly affiliated with mixohaline water bodies. It is noteworthy that members of Opisthokonta and Excavata were present at both the lowest and highest salinity. The largest share of representatives of opisthokonts and excavates (>15% of reads) was associated with euhaline and beta-hypersaline water bodies, respectively. Euplaesiobystra (Discoba) was mainly presented in beta-hypersaline Sol-Iletsk water bodies. Amoebozoa, Apusozoa and Hacrobia were less represented in the investigated water bodies and absent at the higher salinities. Unclassified eukaryotes were especially abundant (>40% of reads) in hypersaline waters with salinities over 100‰.

3.4. Alpha- and Beta-Diversity Metrics

The protist communities from 38 saline and hypersaline water environments (114 samples) were assessed for alpha-diversity (Chao1 richness and Shannon diversity indexes from the pooled habitat dataset, Table S3) and beta-diversity (Bray–Curtis) metrics. Pearson’s rank correlation coefficient, PCoA and NMDS ordination were used to assess the impact of four environmental factors on the microbial eukaryotic community diversity and structure.
The alpha-diversity analyses (Figure 10) showed a strong negative correlation between diversity indexes and salinity (R = −0.64 for Chao1 and R = −0.6 for Shannon).
Based on the linear regression analysis (explanatory power: R2 = 0.3208, p-value = 3.072 × 10⁻¹¹ for Chao1 and R2 = 0.2612, p-value = 3.753 × 10⁻⁹ for Shannon diversity), a decrease in the richness and diversity of protist communities with an increase in salinity has been shown. Protist communities in Sol-Iletsk and Tuzlukkol’ differed most strongly in terms of alpha-diversity metrics (Chao1 = 2.7 × 10⁻⁷; Shannon = 7.8 × 10⁻⁶). Sol-Iletsk and Crimean communities are characterized by moderate differences (Chao1 = 1.1 × 10⁻⁵; Shannon = 3.2 × 10⁻⁵), while the Tuzlukkol’ and Crimean communities were more similar (Chao1 = 3.9 × 10⁻⁴; Shannon = 1.86 × 10⁻³). The nonmetric multidimensional scaling (NMDS) analysis shows that eukaryotic community composition was ordinated along the salinity gradient with a gradual separation (Figure 11).
The PCoA analysis based on the Bray–Curtis similarity indices has revealed significant differences between communities (PERMANOVA, p < 0.05) depending on the geographical location and pH value (Figure 12). At the same time, the PCoA plot has not revealed clearly defined groups of samples by pH. The analysis of 18S rDNA sequences and the principal coordinates analysis of protist communities found a significant influence of geographic location in shaping the protist community composition (Figure 12).
Alpha-diversity index metrics also confirm the evidence that community composition depends on geographic location (Figure 13).
In addition, we observed no significant correlation between membrane pore sizes (5.0 µm and 0.45 µm) with alpha-diversity indexes and protists community composition.

3.5. Centohelid Taxonomy and Diversity

In this survey, we especially focused on centrohelid heliozoans, as a target group to estimate its distribution across a broad range of salinities. A total of 1419 reads belonging to 45 ASVs of Centroheliozoa were revealed. Centrohelid diversity includes 14 ASVs belonging to Pterocystida, 1 ASV belonging to Acanthocystida and 30 ASVs of Centroheliozoa with an undetermined affiliation according to the PR2 database. The revealed centrohelid ASVs were additionally checked using the BLAST algorithm to determine their identity against the NCBI nucleotide database. Only 13 centrohelid ASVs had matches with known genera or species (ASV1553, ASV3052 with Pinjata ruminata MK641802, 100% identity; ASV2965 with Marophrys nikolaevi ON152764, 100%; ASV2977 with Triangulopteris lacunata OL739463, 99.6%; ASV3099, ASV4221 and ASV6608 with Pterocystis sp. AY749608, 100%, 93% and 96.4%, respectively; ASV3698 with Pterocystis jongsooparkii MW298843.1, 99.5%; ASV5804 with Clypifer cribrifer MW700077, 96.2%; ASV6064 with Choanocystis sp. AY749615, 97.6%; ASV6259 with Pterocystis sp. AY749604, 100%; ASV6320 with Heterophrys marina AF534710, 96.8%; ASV6379 with Raphidiophrys drakena KU178911, 98.9%). At the same time, the majority of centrohelid ASVs were related to the unknown environmental sequences with 93.9–100% identity.
The majority of centrohelid sequences were revealed in the Tuzlukkol’ and Crimea samples in mixohaline (38 ASVs) and alpha-hypersaline (8 ASVs) waters. Significantly fewer numbers of centrohelid ASVs were detected at other salinities. The majority of centrohelid sequences were revealed in 5 µm pore size fraction, while the nanoplankton fraction (0.45 µm) was less represented and occurred mostly in the Tuzlukkol’ samples.

3.6. Phylogenetic Position of Revealed ASVs and Marine/Freshwater Divergence of Centrohelids

Further analysis was focused on the assessment of the phylogenetic position of centrohelid ASVs and analyzing marine/freshwater divergence in comparison with other sequences on the phylogenetic tree (Figure 14). Centrohelid ASVs were revealed from a broad salinity range (2–320‰) of water samples and attributed to both Pterocystida and Panacanthocystida clades.
The majority of resulting sequences (33 ASVs) form diverse phylogenetic lineages and are placed within Pterocystida. The ASV3565 from 30‰ Crimean lake clustered in the Ch1 clade at an unresolved phylogenetic position. This clade contains a well-supported freshwater subclade uniting Ozanamia sp. (AY749605, LC682599), Ozanamia symna KF990487, Ozanamia curvata AY749616 and environmental sequences (DQ409130, DQ409105, DQ409132). The majority of revealed ASVs were attributed to the well-supported (81%) environmental NC6 clade, whose representatives demonstrate a considerable level of salinity tolerance from freshwater (AY821944, AY821943) to extremely hypersaline (250‰) habitats. The ASV6259 from mixohaline biotope (2‰) of the South Urals has an uncertain position inside Pterocystidae A. Interestingly, Pterocystidae A mainly contains sequences from freshwater biotopes, except ASV6259 and environmental sequence MH008568 from marine samples (31–33‰). The group of ASVs (4274, 5804, 4295, 7541, 4442, 5073) from the euhaline to gamma-hypersaline samples (10–160‰) and two environmental sequences (AY749520, JQ782283) of marine origin form a new clade of uncertain position within Pterista, albeit without support. The ASV4379 from the 2‰ sample of the South Urals was grouped with freshwater sequences of Pterocystis canadensis AY749633, Raineriophrys erinaceoides AY268043 and environmental sequences AY749497, AY749606 and AY749487 with low bootstrap support (68%) within Pterocystidae C. Besides this grouping, Pterocystidae C also includes a low-supported subclade (MH009909, MH009653, MH008558) of marine origin and two environmental freshwater sequences (AY749549, AY749610), though with negligible bootstrap support (51%). In general, Pterocystidae C can be characterized by moderate salinity tolerance (0–33‰). The ASV7981 from the 50‰ Crimean sample has an uncertain position within “Heterophryidae” without support. The H1 clade (bootstrap support 67%) is another group within Pterocystida with moderate salinity tolerance (0–33‰). Along with marine and freshwater environmental sequences, it contains ASV6566 from the sample with 2‰ salinity.
The unsupported H2 clade consists of environmental sequences and Triangulopteris lacunata OL739463 and is characterized by low salinity tolerance due to the freshwater origin of its constituent sequences, including ASV2977 found in a 2‰ sample. The environmental H3 clade was one of the best-supported clades (89%) and was characterized by moderate salinity tolerance. The H3 clade contains two ASVs from 10 to 18‰ Crimean and Southern Urals samples and environmental sequences from freshwater and marine biotopes (26–35‰). ASV5588 (10–22‰) and ASV360 (30–280‰) were grouped with the environmental sequence H30.9 AY749517 of unknown salinity origin with 90% bootstrap support. This grouping is sister to Pterocystis jongsooparkii MW298843 from a marine sample of South Korea with moderate support (74%). Mixohaline ASVs 7319 and 7795 form a strongly supported group of uncertain phylogenetic position.
The rest of the revealed ASVs belonged to Panacanthocystida. The Yogsothothidae clade contains five ASVs from Crimean samples and demonstrates a considerable level of salinity tolerance (3–210‰). The ASVs from 18 to 210‰ water samples grouped with Pinjata ruminata MK641802 from the brackish environment (22‰) with 93% bootstrap support. The subclade contained Pinjata ruminata MK641802 + two ASVs robustly grouped with ASV6320 from a 12.5‰ salinity sample. Together, they grouped (97%) with Yogsothoth knorrus MH445507 and MH445508 from marine (34‰) habitats. Overall, the Yogsothothidae clade contains sequences from mixohaline to extremely hypersaline environments and demonstrates a remarkable level of euryhalinity (3–210‰). The ASV2965 from 18 to 50‰ environments was grouped with two marine strains of Marophrys nikolaevi (ON152763, ON152762) from the Black Sea (16–19‰) within the Marophryidae clade with 96% bootstrap support. The subclade Marophrys nikolaevi + ASV2965 was grouped with maximum support with Marophrys marina AY268041 from a biotope of unknown salinity. ASV7326 and ASV2383 revealed a broad range of salinities (6–150‰) in the South Urals and were grouped together with maximum support. The ASV6379 from the 16‰ Crimean lake is related to Marophrys marina AF534710.
Two Crimean ASVs, 3099 and 6608, and 4221 from mixohaline salinity have uncertain positions in the basal part of the phylogenetic tree.

4. Discussion

4.1. High-Throughput Sequencing and Promise in Biodiversity Studies

Hypersaline waters still remain largely understudied despite their worldwide distribution and a wide variety [60]. Protist communities in high-salinity waters of the South Urals and Crimea have been studied mostly in morphological surveys using different microscopic techniques [15,61,62,63,64,65,66,67,68,69]. The review on the biodiversity of hypersaline waters in the Crimean arid zone [70] reported 190 unicellular eukaryotic organisms. Authors noted that diatoms and ciliates were the most diverse groups [70]. Diatoms have been recorded only from seven lakes of marine origin and not throughout all seasons and their presence in the sulfate lakes on the Kerch peninsula has not been checked [70]. The diatom-related metabarcodes were obtained in 33 investigated environments (68 libraries), including six lakes of the Kerch peninsula. Diatom ASVs were related to 35 genera, with Cyclotella, Cylindrotheca, Navicula and Chaetoceros being the most abundant. The review [70] reported that planktonic ciliates have been examined in two lakes of marine origin, and a large number of undetermined species have been revealed in anoxic layers under filamentous algal mats. In our study, planktonic ciliates were the most prevalent phylum among alveolates and account for more than 100 genera. The most abundant were Platyophryida, Fabrea, Strombidium, Ancistrum and Euplotes. It is possible that ciliates from anoxic layers differ sharply from those in planktonic communities, and the list of genera and species of ciliates identified in hypersaline waters will be significantly expanded in future studies.
In other research, Prokina [68] reported 29 species of heterotrophic flagellates belonging to 20 genera obtained from 10 saline and hypersaline lakes of the Crimean Peninsula. Our data confirm almost all Prokina’s findings except for four genera, Ministeria, Ciliophrys, Bordnamonas and Phyllomitus. Interestingly, Pseudobodo tremulans have been identified only in the Sivash Lake [68], and this finding was confirmed by the observations of related ASVs, again only in this lake. However, the salinity of the water samples was different, 99‰ in Prokina’s sample and 64‰ in our sample. In addition to the species identified by Prokina [68], the eDNA analysis reveals more species for the genera Salpingoeca, Caecitellus, Cafeteria, Goniomonas and Ancyromonas.
The taxonomic composition of microeukaryotes in Sol-Iletsk saline lakes includes about 100 species of protists, mainly belonging to heterotrophic flagellates [61,65], microalgae [71,72] and centrohelid heliozoans [73,74]. The most abundant flagellates in the Sol-Iletsk samples were Cafeteria roenbergensis, Monosiga ovata, Spumella sp., Paraphysomonas sp. and Neobodo (Bodo) designis [65]. Our data confirmed the observation of Cafeteria, Monosiga and Paraphysomonas genera. In general, our data revealed only one-third of the taxa previously described from the Sol-Iletsk samples and do not match the majority of microscopically identified heterotrophic flagellates and centrohelid heliozoans. Our data confirm previously reported observations [71,72] related to the microalgal genera Dunaliella, Navicula, Chlamydomonas, Amphora, Cryptomonas and Nitzschia. The weak agreement with previously obtained microscopic observations may be due to the fact that other types of biotopes were investigated in these studies, including bottom sediments [65,68]. In addition, some taxa are characterized by pronounced seasonality, for example, those reported for diatoms [70], ciliophora and foraminifera [75]. A seasonal variation in protist composition and abundance has been reported for many protist taxa [76,77,78,79], which have exhibited a clear seasonal pattern. A pronounced effect on the protist community composition has been also noted for meromictic lakes, where fluctuations in temperature, oxygen concentration and salinity play an important role in the formation of the composition of protists [80,81,82,83,84]. The lack of 18S rDNA data for many microscopically identified taxa in the reference databases is another important factor in the observed differences.
The protist community of the Tuzlukkol’ River remains almost undescribed, with the exception of centrohelid heliozoans [85,86,87,88]. The 18S rDNA metabarcoding approach has been applied to examine centrohelid heliozoan communities in the Sol-Iletsk lakes and the Tuzlukkol’ River [45]. Centrohelid OTUs have been grouped within Pterocystidae B, Pterocystidae C, Heterophryidae, Marophryidae, Raphidocystidae and Ch1 clades, as well as in environmental H1, H3, NC1, NC2 and NC9 (=NC6) clades [45]. Additionally, some centrohelid OTUs formed a new clade and belonged to the new phylotypes [45]. The current study expands our understanding of the phylogenetic diversity of the environmental lineages of centrohelids, especially for Yogsothothidae.
In general, NGS amplicon sequencing was shown as superior in detecting rare species in comparison with microscopic surveys [8,39]. Our high-throughput sequencing survey of protist diversity in saline and hypersaline environments revealed 446 protist genera in Crimea and 325 genera in the South Urals and highlighted the gap between the current knowledge of microscopically described protists diversity [61,65,71,72,73,74] and 18S rDNA metabarcoding. The taxonomic structure of the protist community in saline and hypersaline environments of the South Urals and Crimea is shown to be poorly understood. A gap between described and undescribed protist taxa is still large and points to the necessity of a comprehensive study of 18S rDNA along with microscopy.

4.2. Protist Communities and Their Relationships with Salinity and Geographic Location

The taxonomic composition of the studied planktonic communities was represented mainly by Archaeplastida, Alveolata and Stramenopiles, while amoebozoans, apusozoans and rhizarians were less represented. A similar composition was noted in other studies of microeukaryotic communities in hypersaline environments [7,24,42,43,89]. In our study, Alveolata showed the highest affinity to mixohaline and euhaline waters, whereas Archaeplastida prevailed in extreme ones. Amoebozoa, Apusozoa, Rhizaria, Excavata and Hacrobia were insufficiently present in all salinities, with a few exceptions. Apusozoa is completely lacking from beta- to delta-hypersaline waters. Stramenopiles were the most represented from mixohaline to beta-hypersaline environments and decreased in their abundance in gamma- and delta-hypersaline environments. It is noteworthy that protist communities demonstrated a gradual separation along the salinity gradient. Alveolata, Archaeplastida, Excavata, Opisthokonta and Stramenopile supergroups have wide transitional boundaries along the salinity gradient and are represented in all salinity classes, but are characterized by gradual decreasing with increasing salinity. Archaeplastida demonstrated considerable growth through the wide transitional boundaries with increasing salinity. Apusozoa and Rhizaria had an affinity to mixohaline, euhaline and alpha-hypersaline waters with a gradual decrease in relative abundance. Rhizaria was scarce in beta- to delta-hypersaline waters, whereas Amoebozoa was absent in the three last salinity classes.
The attempts to identify the transition boundaries of protistan communities across high-salinity gradients are not numerous [44,90,91,92]. Casamayor and co-authors [90] described salinities of 80‰ and 150‰ as boundaries of an abrupt decrease in protist richness from 30 to 10 taxa. Other research [91] identified 50‰, 150‰ and 250‰ salinities as transitional boundaries for protistan communities from two multipond solar saltern systems. Close results were shown for protistan communities from three different solar saltern ponds in Portugal [24] and salt works of Sfax in Tunisia [92], indicating 120‰ and 150‰ salinities as transition boundaries, respectively. The transitional boundary between alpha- and beta-hypersaline waters was shown as a critical point in a harsh reduction in the representation of the protistan community at the genus level.
The tendency of a reduction in diversity in protist communities with growing salinity was shown almost in all ecological research [7,12,44]. We observed a decrease in the relative abundance for the majority of protist taxa with growing salinity, with some exceptions. Dunaliella (Archaeplastida) demonstrates considerable growth in relative abundance with increasing salinity and was the most represented in delta-hypersaline waters with salinity from 200‰ to 390‰. In some similar studies, Dunaliella is reported to be found in high-salinity environments, including waters with NaCl saturation [7,89,93]. Dunaliella is described as a key component of protist communities in hypersaline waters worldwide and the main or even the sole primary producer in these environments [94,95]. It has been shown that Dunaliella is able to live in hypersaline waters due to the presence of photosynthetically produced glycerol as an osmotic stabilizer [95]. We described Dunaliella from all salinity classes and as one of the most prevalent genera in Sol-Iletsk and Crimean lakes. Some other genera revealed in hypersaline waters in our study, Euplaesiobystra (Heterolobosea, Discoba), Halocafeteria (Bicoecea, Opalozoa), Navicula (Diatomea, Ochrophyta), Exobasidiomycetes (Basidiomycota, Fungi) and Fabrea (Heterotrichea, Ciliophora), were also noted in hypersaline environments, but were more rarely abundant [7,89]. Some species of Heterolobosea, Bicosoecida and Ciliophora have been characterized as extreme or borderline extreme halophiles [4]. In our study, ciliates were mainly affiliated with a salinity <100‰, but such genera as Fabrea, Strombidium, Chlamydodon, Ancistrum and Euplotes were detected in alpha-hypersaline, beta-hypersaline and gamma-hypersaline water bodies.
The assessment of the taxonomic structure of eDNA biodiversity revealed significant differences in protist communities depending on the geographic location of sampling sites, but the salinity was the strongest selection factor, which was also reported in a recent study [44].

4.3. Salinity Tolerance and Marine/Freshwater Divergence in Centrohelids

The vexed question about marine/freshwater divergence of centrohelids arose on the assumption suggested by Mikrjukov [96,97] based on morphological data, which contradicts the suggestion by Cavalier-Smith and Heyden [98] based on molecular phylogenetic data. Mikrjukov [96,97] concluded that centrohelids are a group with remarkable levels of euryhalinity and cosmopolitism. Conversely, sanger sequencing data by Cavalier-Smith and Heyden [98] demonstrated that “almost all clades contain exclusively either marine or freshwater lineages” and suggested that “strong physiological and ecological barriers exist to successful dispersal between these environments, probably generally preventing effective colonization of freshwater… species into marine environments and vice versa”.
Used in taxonomic research and to test different evolution hypotheses, 18S rRNA is a main marker gene for molecular phylogenetic studies of centrohelids [98,99]. Additionally, the 18S rRNA gene was shown as an efficient barcoding marker for centrohelids in environmental studies, indicating a considerable diversity and novelty of centrohelids in the environmental samples [6,98]. It was suggested by 18S rDNA sequencing that about 90% of centrohelids still remain undescribed [98]. Actually, new species of centrohelids have been described in almost every research focused on this group in marine [100,101,102], freshwater [103,104], saline [85,87,88] and soil biotopes [105,106]. In addition, the 18S rDNA amplicon sequencing was applied to metabarcoding research and estimation of taxonomic diversity of centrohelids in saline and hypersaline inland waters (2–78‰) and the assessment of marine/freshwater divergence within the group [45]. The phylogenetic analysis focused on centrohelid heliozoans revealed freshwater/low salinity (0–2‰) clades, some presumably marine/brackishwater clades and seven clades, demonstrating broad salinity tolerance (from 1–2‰ to 78‰) [45].
In this study, we estimated taxonomic diversity and analyzed marine/freshwater divergence of centrohelids from continental water environments in a wide salinity range (2–320‰), and have shown the new cases of broad salinity tolerance, demonstrated by separate lineages. Phylogenetic analysis attributed most of the obtained ASVs to previously established clades; however, the topology of the basal branches of the tree was unsupported.
We revealed that ASV297 from a mixohaline sample with low salinity (2‰) was grouped with the H2 clade, previously described as freshwater [45,98]. In the current analysis, we attribute this clade to the freshwater/low salinity group and consider that the distribution of their members will be restricted by high-salinity barriers.
Two ASVs (6259, 4379) from mixohaline samples with low salinity (2‰) were grouped with freshwater subclades within Pterocystidae A and Pterocystidae C, respectively. Due to the fact that Pterocystidae A and Pterocystidae C also contained subclades or sequences of marine origin, we assume that members of these clades can probably overcome freshwater and low-salinity barriers up to marine waters and back again in the evolutionary course. Similar cases were observed in the Ch1 and environmental H3 clade, which include sequences of marine, mixohaline and freshwater origins. The members of both Ch1 and H3 clades have a moderate level of salinity tolerance and perhaps also can overcome freshwater and marine barriers there and back again. However, it is noteworthy that a well-supported subclade containing Ozanamia sp. + three environmental sequences within Ch1 has a freshwater origin.
The well-supported NC6 clade unites the majority of revealed ASVs and is also characterized by a considerable level of salinity tolerance (0–250‰) and attributed to a clade with freshwater/marine/hypersaline origin. In the previous analysis [45], the NC6 clade, mistakenly distinguished as the new NC9, also unites the majority of revealed Operational Taxonomic Units with high support and has been shown as a clade with the most significant level of salinity tolerance (2–78‰), among others.
Some clades from our analysis demonstrated a considerable level of salinity tolerance and contained sequences of exclusively mixohaline, marine or hypersaline origin, namely Yogsothothidae (3–210‰), Marophryidae 2 (6–150‰) and an unnamed clade sister to OP101620 (10–320‰). Additionally, Marophryidae (6–50‰) and the unnamed clade containing H30.9 + Pterocystis jongsooparkii (6–280‰) also demonstrated a considerable level of salinity tolerance, but due to the uncertain origin of H30.9 and Marophrys marina AY268041, we only tentatively assign it to clades with mixohaline/marine/hypersaline origins.
Along with Raphidocystis contractilis, which has been described as a species specifically adapted to the waters of 5–15‰ salinity in our previous research [38], here we characterize Pinjata ruminata MK641802 and Yogsothoth sp. as species with a potentially considerable high level of salinity tolerance (3–210‰) within Yogsothothidae. Initially, Pinjata ruminata was described from inland brackish water of 22‰ of Russia [85] and Yogsothoth knorrus from a 34‰ marine sample from India [100].
Our understanding of the marine/freshwater divergence of separate clades or species distribution of centrohelids is changing dramatically as data on centrohelid eDNA diversity accumulate. In comparison with the previous research [45], here we show a higher salinity tolerance for the NC6 clade, and significantly higher salinity tolerance for the clade containing H30.9 (up to 280‰ in comparison with 78‰ in the previous study). Additionally, we show a high level of salinity tolerance for the Yogsothothidae clade, whose marine/freshwater divergence has not been previously analyzed due to the absence of related environmental sequences. A significantly higher salinity tolerance was revealed for Marophryidae members, up to 150‰ in comparison with 14‰ in the previous study.
The current survey significantly expanded our understanding of euryhalinity of separate clades (up to four times) and highlighted the novelty of revealed centrohelid ASVs, also demonstrated in previous research [6,45,98], including hypersaline biotopes. Phylogenetic analysis has identified clades with both high and low ranges of salinity tolerance, which does not negate the validity of the assumptions of both Mikrjukov and Cavalier-Smith and Heyden. Mikryukov’s assumption about the absence of endemism in centrohelids is confirmed by the presence of the clades uniting lineages of freshwater/marine/hypersaline origin (NC6). Cavalier-Smith’s and Heyden’s suggestion is also not rejected, since within the euryhaline clades, there are subclades that are exclusively of freshwater (Ozanamia) or marine origin (Pterocystidae C, Yogsothothidae).

5. Conclusions

The obtained results provide the first molecular reference into the taxonomy and diversity of protist communities in saline and hypersaline environments of the South Urals and Crimea and highlighted the gap between the current knowledge of microscopically described protist diversity and 18S rDNA metabarcoding data. The taxonomic structure of the protist community was represented by Alveolata, Amoebozoa, Apusozoa, Archaeplastida, Excavata, Hacrobia, Opisthokonta, Rhizaria and Stramenopiles supergroups. Unclassified Eukaryota accounted for 16% of the total reads. The assessment of the taxonomic structure of 18S rDNA biodiversity revealed significant differences in protist communities depending on the geographic location of sampling sites, with salinity being the strongest selection factor. The protist communities showed a tendency to reduce diversity and richness with growing salinity and demonstrated a gradual separation along the salinity gradient. The transitional boundary between alpha- and beta-hypersaline waters was shown as a critical point in a harsh reduction in the representation of the known protist taxa. The taxonomic structure of the protist community of the South Urals and Crimea is shown to be poorly understood and has great potential for the discovery of new taxa in future biomonitoring surveys. A gap between described and undescribed protist taxa in saline and hypersaline waters of the South Urals and Crimea is still large and points to a necessity for a comprehensive study of 18S rDNA along with microscopy.
The current survey highlighted the novelty of revealed centrohelid ASVs and significantly expanded our understanding of the euryhalinity of some clades, presumably capable of overcoming marine salinity barriers for their distribution there and back again. Centrohelids demonstrated the ability to inhabit a broad range of salinities, up to 320‰, which is four times higher than previously reported. A high level of salinity tolerance was suggested for centrohelid species Pinjata ruminata and Yogsothoth sp. due to the wide salinity ranges of related ASVs.

Supplementary Materials

The following supporting information can be downloaded at: https://www.mdpi.com/article/10.3390/w15112008/s1. References [107,108] are cited in the Table S1.

Author Contributions

Conceptualization, E.A.G., A.S.B., D.V.T. and Y.V.M.; methodology, E.A.G., E.S.F. and D.V.T.; software, A.S.B. and D.G.Z.; validation, A.S.B.; formal analysis, A.S.B. and E.S.F.; investigation, A.S.B., E.A.G., Y.V.M., E.S.F. and D.G.Z.; resources, E.A.G.; data curation, A.S.B., Y.V.M., D.G.Z. and E.S.F.; writing—original draft preparation, E.A.G., A.S.B. and Y.V.M.; writing—review and editing, E.A.G. and D.V.T.; visualization, A.S.B. and D.G.Z.; supervision, D.V.T.; project administration, E.A.G.; funding acquisition, E.A.G. All authors have read and agreed to the published version of the manuscript.

Funding

This research was funded by the Russian Science Foundation grant No. 21-74-00043, https://rscf.ru/en/project/21-74-00043/.

Data Availability Statement

Sequencing data generated during this study are available in the NCBI SRA under project PRJNA971617.

Acknowledgments

The sequencing was carried out in the “Persistence of microorganisms” Science Resource Center of the Institute for Cellular and Intracellular Symbiosis of the Ural Branch of the Russian Academy of Sciences (Orenburg, Russia). E.A.G. is grateful to Vladimir Kataev for sampling and technical assistance with HTS. The authors are grateful to Anastasia Borodina for the English language corrections. The infrastructure of the laboratory of microbiology (D.V.T.; D.G.Z.) of the Papanin Institute for Biology of Inland Waters was supported by IBIW RAS program 121051100102-2.

Conflicts of Interest

The authors declare that there are no conflict of interest.

References

  1. Rothschild, L.J.; Mancinelli, R.L. Life in Extreme Environments. Nature 2001, 409, 1092–1101. [Google Scholar] [CrossRef] [PubMed] [Green Version]
  2. Schmid, A.K.; Allers, T.; DiRuggiero, J. Snap Shot: Microbial Extremophiles. Cell 2020, 180, 818–818.e1. [Google Scholar] [CrossRef] [PubMed]
  3. Post, F.J.; Borowitzka, L.J.; Borowitzka, M.A.; Mackay, B.; Moulton, T. The Protozoa of a Western Australian Hypersaline Lagoon. Hydrobiologia 1983, 105, 95–113. [Google Scholar] [CrossRef]
  4. Harding, T.; Simpson, A.G.B. Recent Advances in Halophilic Protozoa Research. J. Eukaryot. Microbiol. 2018, 65, 556–570. [Google Scholar] [CrossRef] [PubMed]
  5. Shu, W.-S.; Huang, L.-N. Microbial Diversity in Extreme Environments. Nat. Rev. Microbiol. 2022, 20, 219–235. [Google Scholar] [CrossRef] [PubMed]
  6. Triadó-Margarit, X.; Casamayor, E.O. High Genetic Diversity and Novelty in Planktonic Protists Inhabiting Inland and Coastal High Salinity Water Bodies. FEMS Microbiol. Ecol. 2013, 85, 27–36. [Google Scholar] [CrossRef] [Green Version]
  7. Menéndez-Serra, M.; Triadó-Margarit, X.; Casamayor, E.O. Ecological and Metabolic Thresholds in the Bacterial, Protist, and Fungal Microbiome of Ephemeral Saline Lakes (Monegros Desert, Spain). Microb. Ecol. 2021, 82, 885–896. [Google Scholar] [CrossRef]
  8. Wang, J.; Wang, F.; Chu, L.; Wang, H.; Zhong, Z.; Liu, Z.; Gao, J.; Duan, H. High Genetic Diversity and Novelty in Eukaryotic Plankton Assemblages Inhabiting Saline Lakes in the Qaidam Basin. PLoS ONE 2014, 9, e112812. [Google Scholar] [CrossRef] [Green Version]
  9. Rich, V.I.; Maier, R.M. Aquatic Environments. In Environmental Microbiology; Elsevier: Amsterdam, The Netherlands, 2015; pp. 111–138. ISBN 978-0-12-394626-3. [Google Scholar]
  10. Williams, W.D. Environmental Threats to Salt Lakes and the Likely Status of Inland Saline Ecosystems in 2025. Environ. Conserv. 2002, 29, 154–167. [Google Scholar] [CrossRef] [Green Version]
  11. Shadrin, N.V.; Anufriieva, E.V.; Belyakov, V.P.; Bazhora, A.I. Chironomidae Larvae in Hypersaline Waters of the Crimea: Diversity, Distribution, Abundance and Production. Eur. Zool. J. 2017, 84, 61–72. [Google Scholar] [CrossRef] [Green Version]
  12. Por, F.D. A Classification of Hypersaline Waters, Based on Trophic Criteria. Mar. Ecol. 1980, 1, 121–131. [Google Scholar] [CrossRef]
  13. Venice System (1958) Symposium on the Classification of Brackish Waters, Venice. Arch. Oceanogr. Limnol. 1958, 11, 1–248.
  14. Williams, W.D. The Largest, Highest and Lowest Lakes of the World: Saline Lakes. SIL Proc. 1922–2010 1996, 26, 61–79. [Google Scholar] [CrossRef]
  15. Shadrin, N.V.; Anufrieva, E.V.; Shadrina, S.N. Brief Review of Phototrophs of Hypersaline Lakes and Lagoons of Crimea. Diversity, Ecological Role, Possibilities of Use. Mar. Biol. J. 2017, 2, 80–85. [Google Scholar] [CrossRef] [Green Version]
  16. Waiser, M.J.; Robarts, R.D. Saline Inland Waters. In Encyclopedia of Inland Waters; Likens, G.E., Ed.; Academic Press: Oxford, UK, 2009; pp. 634–644. ISBN 978-0-12-370626-3. [Google Scholar]
  17. Saccò, M.; White, N.E.; Harrod, C.; Salazar, G.; Aguilar, P.; Cubillos, C.F.; Meredith, K.; Baxter, B.K.; Oren, A.; Anufriieva, E.; et al. Salt to Conserve: A Review on the Ecology and Preservation of Hypersaline Ecosystems. Biol. Rev. 2021, 96, 2828–2850. [Google Scholar] [CrossRef]
  18. Casamayor, E.O.; Triadó-Margarit, X.; Castañeda, C. Microbial Biodiversity in Saline Shallow Lakes of the Monegros Desert, Spain. FEMS Microbiol. Ecol. 2013, 85, 503–518. [Google Scholar] [CrossRef] [Green Version]
  19. Dillon, J.G.; McMath, L.M.; Trout, A.L. Seasonal Changes in Bacterial Diversity in the Salton Sea. Hydrobiologia 2009, 632, 49–64. [Google Scholar] [CrossRef]
  20. Parnell, J.J.; Rompato, G.; Latta, L.C.I.V.; Pfrender, M.E.; Van Nostrand, J.D.; He, Z.; Zhou, J.; Andersen, G.; Champine, P.; Ganesan, B.; et al. Functional Biogeography as Evidence of Gene Transfer in Hypersaline Microbial Communities. PLoS ONE 2010, 5, e12919. [Google Scholar] [CrossRef] [Green Version]
  21. Pagaling, E.; Wang, H.; Venables, M.; Wallace, A.; Grant, W.D.; Cowan, D.A.; Jones, B.E.; Ma, Y.; Ventosa, A.; Heaphy, S. Microbial Biogeography of Six Salt Lakes in Inner Mongolia, China, and a Salt Lake in Argentina. Appl. Environ. Microbiol. 2009, 75, 5750–5760. [Google Scholar] [CrossRef] [Green Version]
  22. Makhdoumi-Kakhki, A.; Amoozegar, M.A.; Kazemi, B.; Pašić, L.; Ventosa, A. Prokaryotic Diversity in Aran-Bidgol Salt Lake, the Largest Hypersaline Playa in Iran. Microbes Environ. 2012, 27, 87–93. [Google Scholar] [CrossRef] [Green Version]
  23. Narasingarao, P.; Podell, S.; Ugalde, J.A.; Brochier-Armanet, C.; Emerson, J.B.; Brocks, J.J.; Heidelberg, K.B.; Banfield, J.F.; Allen, E.E. De novo Metagenomic Assembly Reveals Abundant Novel Major Lineage of Archaea in Hypersaline Microbial Communities. ISME J. 2012, 6, 81–93. [Google Scholar] [CrossRef] [PubMed] [Green Version]
  24. Filker, S.; Gimmler, A.; Dunthorn, M.; Mahé, F.; Stoeck, T. Deep Sequencing Uncovers Protistan Plankton Diversity in the Portuguese Ria Formosa Solar Saltern Ponds. Extremophiles 2015, 19, 283–295. [Google Scholar] [CrossRef] [PubMed]
  25. Demergasso, C.; Escudero, L.; Casamayor, E.O.; Chong, G.; Balagué, V.; Pedrós-Alió, C. Novelty and Spatio-Temporal Heterogeneity in the Bacterial Diversity of Hypersaline Lake Tebenquiche (Salar de Atacama). Extremophiles 2008, 12, 491–504. [Google Scholar] [CrossRef]
  26. Guglielmin, M.; Azzaro, M.; Buzzini, P.; Battistel, D.; Roman, M.; Ponti, S.; Turchetti, B.; Sannino, C.; Borruso, L.; Papale, M.; et al. A Possible Unique Ecosystem in the Endoglacial Hypersaline Brines in Antarctica. Sci. Rep. 2023, 13, 177. [Google Scholar] [CrossRef] [PubMed]
  27. Podell, S.; Ugalde, J.A.; Narasingarao, P.; Banfield, J.F.; Heidelberg, K.B.; Allen, E.E. Assembly-Driven Community Genomics of a Hypersaline Microbial Ecosystem. PLoS ONE 2013, 8, e61692. [Google Scholar] [CrossRef] [Green Version]
  28. Podell, S.; Emerson, J.B.; Jones, C.M.; Ugalde, J.A.; Welch, S.; Heidelberg, K.B.; Banfield, J.F.; Allen, E.E. Seasonal Fluctuations in Ionic Concentrations Drive Microbial Succession in a Hypersaline Lake Community. ISME J. 2014, 8, 979–990. [Google Scholar] [CrossRef] [Green Version]
  29. Naghoni, A.; Emtiazi, G.; Amoozegar, M.A.; Cretoiu, M.S.; Stal, L.J.; Etemadifar, Z.; Shahzadeh Fazeli, S.A.; Bolhuis, H. Microbial Diversity in the Hypersaline Lake Meyghan, Iran. Sci. Rep. 2017, 7, 11522. [Google Scholar] [CrossRef] [Green Version]
  30. Kheiri, R.; Mehrshad, M.; Pourbabaee, A.A.; Ventosa, A.; Amoozegar, M.A. Hypersaline Lake Urmia: A Potential Hotspot for Microbial Genomic Variation. Sci. Rep. 2023, 13, 374. [Google Scholar] [CrossRef]
  31. Fernández, A.B.; Ghai, R.; Martin-Cuadrado, A.-B.; Sánchez-Porro, C.; Rodriguez-Valera, F.; Ventosa, A. Prokaryotic Taxonomic and Metabolic Diversity of an Intermediate Salinity Hypersaline Habitat Assessed by Metagenomics. FEMS Microbiol. Ecol. 2014, 88, 623–635. [Google Scholar] [CrossRef] [Green Version]
  32. Ghai, R.; Pašić, L.; Fernández, A.B.; Martin-Cuadrado, A.-B.; Mizuno, C.M.; McMahon, K.D.; Papke, R.T.; Stepanauskas, R.; Rodriguez-Brito, B.; Rohwer, F.; et al. New Abundant Microbial Groups in Aquatic Hypersaline Environments. Sci. Rep. 2011, 1, 135. [Google Scholar] [CrossRef] [Green Version]
  33. DeMaere, M.Z.; Williams, T.J.; Allen, M.A.; Brown, M.V.; Gibson, J.A.E.; Rich, J.; Lauro, F.M.; Dyall-Smith, M.; Davenport, K.W.; Woyke, T.; et al. High Level of Intergenera Gene Exchange Shapes the Evolution of Haloarchaea in an Isolated Antarctic Lake. Proc. Natl. Acad. Sci. USA 2013, 110, 16939–16944. [Google Scholar] [CrossRef] [Green Version]
  34. Lozupone, C.A.; Knight, R. Global Patterns in Bacterial Diversity. Proc. Natl. Acad. Sci. USA 2007, 104, 11436–11440. [Google Scholar] [CrossRef] [Green Version]
  35. Auguet, J.-C.; Barberan, A.; Casamayor, E.O. Global Ecological Patterns in Uncultured Archaea. ISME J. 2010, 4, 182–190. [Google Scholar] [CrossRef] [Green Version]
  36. Nolte, V.; Pandey, R.V.; Jost, S.; Medinger, R.; Ottenwälder, B.; Boenigk, J.; Schlötterer, C. Contrasting Seasonal Niche Separation Between Rare and Abundant Taxa Conceals the Extent of Protist Diversity: High Seasonal Protist Abundance Turnover. Mol. Ecol. 2010, 19, 2908–2915. [Google Scholar] [CrossRef] [Green Version]
  37. Scheckenbach, F.; Hausmann, K.; Wylezich, C.; Weitere, M.; Arndt, H. Large-Scale Patterns in Biodiversity of Microbial Eukaryotes from the Abyssal Sea Floor. Proc. Natl. Acad. Sci. USA 2010, 107, 115–120. [Google Scholar] [CrossRef] [Green Version]
  38. Grey, E.K.; Bernatchez, L.; Cassey, P.; Deiner, K.; Deveney, M.; Howland, K.L.; Lacoursière-Roussel, A.; Leong, S.C.Y.; Li, Y.; Olds, B.; et al. Effects of Sampling Effort on Biodiversity Patterns Estimated from Environmental DNA Metabarcoding Surveys. Sci. Rep. 2018, 8, 8843. [Google Scholar] [CrossRef] [Green Version]
  39. Medinger, R.; Nolte, V.; Pandey, R.V.; Jost, S.; Ottenwälder, B.; Schlötterer, C.; Boenigk, J. Diversity in a Hidden World: Potential and Limitation of Next-Generation Sequencing for Surveys of Molecular Diversity of Eukaryotic Microorganisms. Mol. Ecol. 2010, 19, 32–40. [Google Scholar] [CrossRef] [Green Version]
  40. Pawlowski, J.; Christen, R.; Lecroq, B.; Bachar, D.; Shahbazkia, H.R.; Amaral-Zettler, L.; Guillou, L. Eukaryotic Richness in the Abyss: Insights from Pyrotag Sequencing. PLoS ONE 2011, 6, e18169. [Google Scholar] [CrossRef]
  41. Edgcomb, V.; Bernhard, J. Heterotrophic Protists in Hypersaline Microbial Mats and Deep Hypersaline Basin Water Columns. Life 2013, 3, 346–362. [Google Scholar] [CrossRef] [Green Version]
  42. Lee, H.B.; Jeong, D.H.; Cho, B.C.; Park, J.S. The Diversity Patterns of Rare to Abundant Microbial Eukaryotes Across a Broad Range of Salinities in a Solar Saltern. Microb. Ecol. 2022, 84, 1103–1121. [Google Scholar] [CrossRef]
  43. Alexander, E.; Stock, A.; Breiner, H.-W.; Behnke, A.; Bunge, J.; Yakimov, M.M.; Stoeck, T. Microbial Eukaryotes in the Hypersaline Anoxic L’Atalante Deep-Sea Basin. Environ. Microbiol. 2009, 11, 360–381. [Google Scholar] [CrossRef] [PubMed]
  44. Filker, S.; Forster, D.; Weinisch, L.; Mora-Ruiz, M.; González, B.; Farías, M.E.; Rosselló-Móra, R.; Stoeck, T. Transition Boundaries for Protistan Species Turnover in Hypersaline Waters of Different Biogeographic Regions. Environ. Microbiol. 2017, 19, 3186–3200. [Google Scholar] [CrossRef] [PubMed]
  45. Gerasimova, E.A.; Plotnikov, A.O.; Khlopko, Y.A.; Zlatogursky, V.V. Multiple Euryhaline Lineages of Centrohelids (Haptista: Centroplasthelida) in Inland Saline Waters Revealed with Metabarcoding. J. Eukaryot. Microbiol. 2020, 67, 223–231. [Google Scholar] [CrossRef] [PubMed]
  46. Weber, F.; del Campo, J.; Wylezich, C.; Massana, R.; Jürgens, K. Unveiling Trophic Functions of Uncultured Protist Taxa by Incubation Experiments in the Brackish Baltic Sea. PLoS ONE 2012, 7, e41970. [Google Scholar] [CrossRef] [PubMed] [Green Version]
  47. Petrischev, V.P. Salt dome morphostructures in the Southern Priuralye. Geomorfologiya 2010, 1, 86–94. [Google Scholar] [CrossRef]
  48. Martin, M. Cutadapt Removes Adapter Sequences from High-Throughput Sequencing Reads. EMBnet J. 2011, 17, 10. [Google Scholar] [CrossRef]
  49. Callahan, B.J.; McMurdie, P.J.; Rosen, M.J.; Han, A.W.; Johnson, A.J.A.; Holmes, S.P. DADA2: High-Resolution Sample Inference from Illumina Amplicon Data. Nat. Methods 2016, 13, 581–583. [Google Scholar] [CrossRef] [Green Version]
  50. Guillou, L.; Bachar, D.; Audic, S.; Bass, D.; Berney, C.; Bittner, L.; Boutte, C.; Burgaud, G.; de Vargas, C.; Decelle, J.; et al. The Protist Ribosomal Reference Database (PR2): A Catalog of Unicellular Eukaryote Small Sub-Unit RRNA Sequences with Curated Taxonomy. Nucleic Acids Res. 2012, 41, D597–D604. [Google Scholar] [CrossRef] [Green Version]
  51. Adl, S.M.; Bass, D.; Lane, C.E.; Lukes, J.; Schoch, C.L.; Smirnov, A.; Agatha, S.; Berney, C.; Brown, M.W.; Burki, F.; et al. Revisions to the Classification, Nomenclature, and Diversity of Eukaryotes. J. Eukaryot. Microbiol. 2019, 66, 4–119. [Google Scholar] [CrossRef] [Green Version]
  52. Burki, F.; Roger, A.J.; Brown, M.W.; Simpson, A.G.B. The New Tree of Eukaryotes. Trends Ecol. Evol. 2020, 35, 43–55. [Google Scholar] [CrossRef] [Green Version]
  53. Katoh, K.; Standley, D.M. MAFFT Multiple Sequence Alignment Software Version 7: Improvements in Performance and Usability. Mol. Biol. Evol. 2013, 30, 772–780. [Google Scholar] [CrossRef] [Green Version]
  54. Capella-Gutiérrez, S.; Silla-Martínez, J.M.; Gabaldón, T. TrimAl: A Tool for Automated Alignment Trimming in Large-Scale Phylogenetic Analyses. Bioinformatics 2009, 25, 1972–1973. [Google Scholar] [CrossRef] [Green Version]
  55. Nguyen, L.-T.; Schmidt, H.A.; von Haeseler, A.; Minh, B.Q. IQ-TREE: A Fast and Effective Stochastic Algorithm for Estimating Maximum-Likelihood Phylogenies. Mol. Biol. Evol. 2015, 32, 268–274. [Google Scholar] [CrossRef]
  56. McMurdie, P.J.; Holmes, S. Phyloseq: An R Package for Reproducible Interactive Analysis and Graphics of Microbiome Census Data. PLoS ONE 2013, 8, e61217. [Google Scholar] [CrossRef] [Green Version]
  57. Wickham, H. Ggplot2: Elegant Graphics for Data Analysis, 2nd ed.; Use R; Springer: Cham, Switzerland, 2016; ISBN 978-3-319-24277-4. [Google Scholar]
  58. Xu, S.; Zhan, L.; Tang, W.; Wang, Q.; Dai, Z.; Zhou, L.; Feng, T.; Chen, M.; Wu, T.; Hu, E.; et al. Microbiota Process: A Comprehensive R Package for Deep Mining Microbiome. Innovation 2023, 4, 100388. [Google Scholar] [CrossRef]
  59. Lahti, L.; Shetty, S. Microbiome R Package. Available online: http://microbiome.github.io (accessed on 18 May 2023).
  60. Oren, A. Life in Hypersaline Environments. In Their World: A Diversity of Microbial Environments; Hurst, C.J., Ed.; Advances in Environmental Microbiology; Springer: Cham, Switzerland, 2016; Volume 1, pp. 301–339. ISBN 978-3-319-28069-1. [Google Scholar]
  61. Mylnikov, A.P. A New Flagellate Percolomonas laustris sp. n. (Excavata, Percolozoa) from an Inland Saline Lake (Southeastern European Russia). Biol. Bull. Russ. Acad. Sci. 2016, 43, 587–594. [Google Scholar] [CrossRef]
  62. Dovgal, I.V.; Shadrin, N.V.; Gaponova, L.P. New Findings of Halobiont Ciliates (Ciliophora). Vestn. Zool. 2006, 40, 462. (In Russian) [Google Scholar]
  63. Pavlovskya, T.V.; Prazukin, A.V.; Shadrin, N.V. Seasonal Phenomena in Infusoria Community in Hypersaline Lake Khersonesskoye (Crimea). Mar. Ecol. J. 2009, 2, 53–63. (In Russian) [Google Scholar]
  64. Nevrova, E.L.; Shadrin, N.V. Bottom Diatom Algae of the Saline Lakes of Crimea. Mar. Ecol. J. 2005, 4, 61–71. (In Russian) [Google Scholar]
  65. Plotnikov, A.O.; Selivanova, E.A.; Nemtseva, N.V. Species Diversity of Heterotrophic Flagellates in Saline Sol’-Iletsk Lakes. Izv. PGU Im. V.G. Belinsky 2011, 25, 548–557. (In Russian) [Google Scholar]
  66. Senicheva, M.I.; Gubelit, Y.I.; Prazukhin, A.V.; Shadrin, N.V. Phytoplankton of Crimean Hypersaline Lakes. In Black Sea Microalgae: Problems of Biodiversity Conservation and Biotechnological Use; Tokarev, Y.N., Finenko, Z.Z., Shadrin, N.V., Eds.; EKOSI-Gidrofizika: Sevastopol, Russia, 2008; pp. 93–100. ISBN 978-966-02-5118-2. (In Russian) [Google Scholar]
  67. Zagorodnaya, Y.A.; Batogoeva, E.A.; Shadrin, N.V. Long-term Transformation of Zooplankton in the Hypersaline Lake Bakalskoe (Crimea) Under Salinity Fluctuations. Mar. Ecol. J. 2008, 7, 41–50. [Google Scholar]
  68. Prokina, K.I. Heterotrophic Flagellates from the Saline Lakes of the Crimean Peninsula. Ecosyst. Transform. 2020, 3, 3–10. [Google Scholar] [CrossRef]
  69. Plotnikov, A.O.; Ermolenko, E.A.; Nikiyan, H.N.; Vasilchenko, A.S. Study of centrohelid Heliozoa morphology by atomic force microscopy. Zool. J. 2013, 92, 955–961. [Google Scholar] [CrossRef]
  70. Anufriieva, E.V.; Shadrin, N.V.; Shadrina, S.N. History of Research on Biodiversity in Crimean Hypersaline Waters. Arid. Ecosyst. 2017, 7, 52–58. [Google Scholar] [CrossRef]
  71. Nemtseva, N.V.; Selivanova, E.A.; Yatsenko-Stepanova, T.N.; Ignatenko, M.E. The structure of algoplankton in the Sol-Iletsk lakes with different levels of salinity. Izv. PGU Im. V.G. Belinsky 2011, 25, 535–541. [Google Scholar]
  72. Nemtseva, N.V.; Selivanova, E.A.; Ignatenko, M.E.; Sharapova, N.V. Characterization of a new strain of Dunaliella salina (Chlorophyta) and assessment of its cultivation parameters. Physiol. Rast. 2013, 60, 561–568. [Google Scholar] [CrossRef]
  73. Plotnikov, A.O.; Ermolenko, E.A. Centrohelid Heliozoa (Chromista, Hacrobia) of Southern Cis-Ural Region. Biol. Bull. Russ. Acad. Sci. 2015, 42, 683–695. [Google Scholar] [CrossRef]
  74. Plotnikov, A.O.; Gerasimova, E.A. Heliozoa (Centrohelea, Haptista, Hacrobia) of saline and brackish water bodies and watercourses of Russia. Inland Water Biol. 2017, 10, 121–129. [Google Scholar] [CrossRef]
  75. El-Shabrawy, G.; Anufriieva, E.; Shadrin, N. Tintinnina (Ciliophora) and Foraminifera in plankton of hypersaline Lagoon Bardawil (Egypt): Spatial and temporal variability. Turk. J. Zool. 2018, 42, 218–229. [Google Scholar] [CrossRef] [Green Version]
  76. Zhao, W.; Zhao, Y.; Wang, Q.; Zheng, M.; Wei, J.; Wang, S. The community structure and seasonal dynamics of plankton in Bange Lake, northern Tibet, China. Chin. J. Ocean. Limnol. 2016, 34, 1143–1157. [Google Scholar] [CrossRef]
  77. Zhao, W.; Zhao, Y.Y.; Wang, Q.H.; Zheng, M.P.; Zhang, P.; He, Z.H. Spatial and temporal patterns of plankton assemblage structure in a high altitude saline lake, Namuka Co in Northern Tibet, China. Clean Soil Air Water 2010, 38, 960–968. [Google Scholar] [CrossRef]
  78. Sonntag, B.; Posch, T.; Klammer, S.; Teubner, K.; Psenner, R. Phagotrophic ciliates and flagellates in an oligotrophic, deep, alpine lake: Contrasting variability with seasons and depths. Aquat. Microb. Ecol. 2006, 43, 193–207. [Google Scholar] [CrossRef]
  79. Gran-Stadniczeñko, S.; Egge, E.; Hostyeva, V.; Logares, R.; Eikrem, W.; Edvardsen, B. Protist diversity and seasonal dynamics in skagerrak plankton communities as revealed by metabarcoding and microscopy. J. Eukaryot. Microbiol. 2019, 66, 494–513. [Google Scholar] [CrossRef] [Green Version]
  80. Khromechek, E.B.; Barkhatov, Y.V.; Rogozin, D.Y. Community structure and vertical distribution of planktonic ciliates in the saline meromictic lake Shira during breakdown of meromixis. Ecohydrol. Hydrobiol. 2021, 21, 142–152. [Google Scholar] [CrossRef]
  81. Lepère, C.; Domaizon, I.; Hugoni, M.; Vellet, A.; Debroas, D. Diversity and Dynamics of Active Small Microbial Eukaryotes in the Anoxic Zone of a Freshwater Meromictic Lake (Pavin, France). Front. Microbiol. 2016, 7, 130. [Google Scholar] [CrossRef] [Green Version]
  82. Edgcomb, V.P.; Pachiadaki, M. Ciliates along oxyclines of permanently stratified marine water columns. J. Eukaryot. Microbiol. 2014, 61, 434–445. [Google Scholar] [CrossRef] [Green Version]
  83. Fermani, P.; Metz, S.; Balagué, V.; Descy, J.P.; Morana, C.; Logares, R.; Massana, R.; Sarmento, H. Microbial eukaryote assemblages and potential novel diversity in four tropical East African Great Lakes. FEMS Microbiol. Ecol. 2021, 97, fiab114. [Google Scholar] [CrossRef]
  84. Khromechek, E.B.; Barkhatov, Y.V.; Rogozin, D.Y. Densities and distribution of flagellates and ciliates in the chemocline of saline, meromictic Lake Shunet (Siberia, Russia). Aquat. Ecol. 2010, 44, 497–511. [Google Scholar] [CrossRef]
  85. Zlatogursky, V.V.; Gerasimova, E.A.; Drachko, D.; Klimov, V.I.; Shɨshkin, Y.; Plotnikov, A.O. Pinjata ruminata gen. et sp. n.—A new member of centrohelid family Yogsothothidae (Haptista: Centroplasthelida) from the brackish river. J. Eukaryot. Microbiol. 2019, 66, 862–868. [Google Scholar] [CrossRef]
  86. Gerasimova, E.A. Morphology and species composition of centrohelid heliozoans (Centroplasthelida) from the continental lowland river with salinity gradient. Inland Water Biol. 2021, 14, 652–661. [Google Scholar] [CrossRef]
  87. Gerasimova, E.A. Two new brackish-water species of centrohelid heliozoans (Haptista: Centroplasthelida), Choanocystis mylnikovi sp. n. and C. punctata sp. n., from Russia. Protistology 2022, 16, 10–20. [Google Scholar] [CrossRef]
  88. Gerasimova, E.A.; Radaykina, L.V.; Zagumyonnyi, D.G.; Tikhonenkov, D.V.; Drachko, D.; Zlatogursky, V.V. Morphology and spicules elemental composition of Marophrys nikolaevi spec. nov. (Haptista: Centroplasthelida). Eur. J. Protistol. 2022, 84, 125888. [Google Scholar] [CrossRef] [PubMed]
  89. Heidelberg, K.B.; Nelson, W.C.; Holm, J.B.; Eisenkolb, N.; Andrade, K.; Emerson, J.B. Characterization of Eukaryotic Microbial Diversity in Hypersaline Lake Tyrrell, Australia. Front. Microbiol. 2013, 4, 115. [Google Scholar] [CrossRef] [PubMed] [Green Version]
  90. Casamayor, E.O.; Massana, R.; Benlloch, S.; Øvreås, L.; Díez, B.; Goddard, V.J.; Gasol, J.M.; Joint, I.; Rodríguez-Valera, F.; Pedrós-Alió, C. Changes in Archaeal, Bacterial and Eukaryal Assemblages Along a Salinity Gradient by Comparison of Genetic Fingerprinting Methods in a Multipond Solar Saltern. Environ. Microbiol. 2002, 4, 338–348. [Google Scholar] [CrossRef]
  91. Pedrós-Alió, C.; Calderón-Paz, J.I.; MacLean, M.H.; Medina, G.; Marrasé, C.; Gasol, J.M.; Guixa-Boixereu, N. The Microbial Food Web Along Salinity Gradients. FEMS Microbiol. Ecol. 2000, 32, 143–155. [Google Scholar] [CrossRef]
  92. Elloumi, J.; Carrias, J.-F.; Ayadi, H.; Sime-Ngando, T.; Bouaïn, A. Communities Structure of the Planktonic Halophiles in the Solar Saltern of Sfax, Tunisia. Estuar. Coast. Shelf Sci. 2009, 81, 19–26. [Google Scholar] [CrossRef]
  93. Oren, A. The Ecology of Dunaliella in High-Salt Environments. J. Biol. Res. Thessalon. 2014, 21, 23. [Google Scholar] [CrossRef] [Green Version]
  94. Oren, A. A Hundred Years of Dunaliella Research: 1905–2005. Aquat. Biosyst. 2005, 1, 2. [Google Scholar] [CrossRef] [Green Version]
  95. Oren, A. Glycerol Metabolism in Hypersaline Environments: Glycerol Metabolism. Environ. Microbiol. 2017, 19, 851–863. [Google Scholar] [CrossRef]
  96. Mikrjukov, K.A. Heliozoa as a Component of Marine Microbenthos. In Proceedings of the 3rd The European Congress of Protistology, Helsingor, Denmark, 25–30 July 1999; p. 49. [Google Scholar]
  97. Mikrjukov, K.A. Heliozoa As a Component of Marine Microbenthos: A Study of Heliozoa of the White Sea. Ophelia 2001, 54, 51–73. [Google Scholar] [CrossRef]
  98. Cavalier-Smith, T.; von der Heyden, S. Molecular Phylogeny, Scale Evolution and Taxonomy of Centrohelid Heliozoa. Mol. Phylogenet. Evol. 2007, 44, 1186–1203. [Google Scholar] [CrossRef]
  99. Cavalier-Smith, T.; Chao, E.E.-Y. Oxnerella micra sp. n. (Oxnerellidae fam. n.), a Tiny Naked Centrohelid, and the Diversity and Evolution of Heliozoa. Protist 2012, 163, 574–601. [Google Scholar] [CrossRef]
  100. Shɨshkin, Y.; Drachko, D.; Klimov, V.I.; Zlatogursky, V.V. Yogsothoth knorrus gen. n., sp. n. and Y. carteri sp. n. (Yogsothothidae fam. n., Haptista, Centroplasthelida), with Notes on Evolution and Systematics of Centrohelids. Protist 2018, 169, 682–696. [Google Scholar] [CrossRef]
  101. Shɨshkin-Skarð, Y.; Drachko, D.; Zlatogursky, V.V. Shedding Light on the Origin of Acanthocystidae: Ricksol blepharistes gen. n., sp. n. (Ricksolidae fam. n., Panacanthocystida, Centroplasthelida), with Notes on the Evolution of the Genera Acanthocystis, Ozanamia gen. n. (Ozanamiidae fam. n.), and “Heterophrys-like Organisms”. Org. Diver. Evol. 2023, 23, 263–274. [Google Scholar] [CrossRef]
  102. Zlatogursky, V.V.; Shishkin, Y.; Drachko, D.; Burki, F. The Long-Time Orphan Protist Meringosphaera mediterranea Lohmann, 1902 [1903] is a Centrohelid Heliozoan. J. Eukaryot. Microbiol. 2021, 68, e12860. [Google Scholar] [CrossRef]
  103. Gerasimova, E.A.; Plotnikov, A.O. New Freshwater Species of Centrohelids Acanthocystis lyra sp. nov. and Acanthocystis siemensmae sp. nov. (Haptista, Heliozoa, Centrohelea) from the South Urals, Russia. Acta Protozool. 2016, 55, 231–237. [Google Scholar] [CrossRef]
  104. Zlatogursky, V.V.; Gerasimova, E.A.; Plotnikov, A.O. A New Species of Centrohelid Heliozoan Acanthocystis amura n. sp. Isolated from Two Remote Locations in Russia. J. Eukaryot. Microbiol. 2017, 64, 434–439. [Google Scholar] [CrossRef]
  105. Zagumyonnyi, D.G.; Radaykina, L.V.; Tikhonenkov, D.V. Triangulopteris lacunata gen. et sp. nov. (Centroplasthelida), a New Centrohelid Heliozoan from Soil. Diversity 2021, 13, 658. [Google Scholar] [CrossRef]
  106. Zagumyonnyi, D.G.; Radaykina, L.V.; Keeling, P.J.; Tikhonenkov, D.V. Centrohelid Heliozoans of Ukraine with a Description of a New Genus and Species (Haptista: Centroplasthelida). Eur. J. Protistol. 2022, 86, 125916. [Google Scholar] [CrossRef]
  107. Ponizovsky, A.M. Salt Resources of the Crimea; Krym: Simferopol, Crimea, 1965; 163p. [Google Scholar]
  108. Selivanova, E.A.; Poshvina, D.V.; Khlopko, Y.A.; Gogoleva, N.E.; Plotnikov, A.O. Diversity of Prokaryotes in Planktonic Communities of Saline Sol-Iletsk Lakes (Orenburg Oblast, Russia). Microbiology 2018, 87, 569–582. [Google Scholar] [CrossRef]
Figure 1. Map of sampling sites of the South Urals and the Crimea.
Water 15 02008 g001
Figure 2. Rarefaction curves of sequenced libraries plotted between the total number of reads (x-axis) and the number of amplicon sequence variants (y-axis). The color-coded curves correspond to the sampling sites.
Water 15 02008 g002
Figure 3. Protist community composition at different taxonomic levels. Only relative abundances greater than 1% are shown. Colors correspond to the taxa from each taxonomic level.
Water 15 02008 g003
Figure 4. The relative abundance of the protist supergroups of the investigated areas. Colors correspond to the supergroup names.
Water 15 02008 g004
Figure 5. The relative abundance of the 12 most dominant protists phyla of the investigated areas. The category ‘Others’ represents the sum of all other taxonomic groups. Colors correspond to the phyla names.
Water 15 02008 g005
Figure 6. The relative abundance of the 22 most dominant genera of protists of the investigated areas. The category ‘Others’ represents the sum of all other taxonomic groups. Colors correspond to the genera names.
Water 15 02008 g006
Figure 7. The taxon composition of protist communities within the different salinity classes. Relative abundances of the protist supergroups are presented. Colors correspond to the supergroup names.
Water 15 02008 g007
Figure 8. The composition of protist communities within the different salinity classes. Relative abundances of the 18 dominant phyla of protists are presented. The category ‘Others’ represents the sum of all other taxonomic groups. Colors correspond to the phyla names.
Water 15 02008 g008
Figure 9. The composition of protist communities within the different salinity classes. Relative abundances of the 22 most dominant genera of protists are presented. The category ‘Others’ represents the sum of all other taxonomic groups. Colors correspond to the genera names.
Water 15 02008 g009
Figure 10. Alpha-diversity of the protist communities. (A) Chao Index of protist richness. (B) Shannon Index of protist community evenness. Samples were ranked and colored according to salinity and are displayed in ascending order of salinity. The black line shows the regression of species richness and diversity depending on salinity.
Water 15 02008 g010
Figure 11. Non-metric multidimensional scaling (NMDS) analysis based on Bray–Curtis dissimilarities of the protist communities composition (ASVs) colored by the salinity. Gradient scale represents a salinity value.
Water 15 02008 g011
Figure 12. The results of principal coordinates analysis (PCoA) of the protist communities based on the Bray–Curtis dissimilarities, labeled by geographical location (left) and pH (right). PCo1 (Axis 1) and PCo2 (Axis 2) explained 9.38% and 5.79% of the variance of the protist community at the ASV level, respectively.
Water 15 02008 g012
Figure 13. Alpha-diversity indexes of the protist community. (A) Chao Index of protist richness. (B) Shannon Index of protist community evenness. Samples were ranked and colored according to different salinities and are displayed by salinity increase.
Water 15 02008 g013
Figure 14. Maximum likelihood tree for 18S rDNA of 300 centrohelids and 11 outgroup sequences (816 sites; TN+F+R5 model; 1000 bootstrap iterations). Bootstrap values ≥ 50 are shown. The sequences obtained in this research are marked in red. The symbols “//” and “2×” indicate that the branch is shortened by two times to improve visualization. Outgroup: AF534711; GQ365770; GQ365840; GQ365798; AJ278035; KM057843; AB847973; AB983344; X77478; AB330051 and GQ365769.
Water 15 02008 g014
Disclaimer/Publisher’s Note: The statements, opinions and data contained in all publications are solely those of the individual author(s) and contributor(s) and not of MDPI and/or the editor(s). MDPI and/or the editor(s) disclaim responsibility for any injury to people or property resulting from any ideas, methods, instructions or products referred to in the content.

