Article

Assessment and Comparison of Satellite-Based Rainfall Products: Validation by Hydrological Modeling Using ANN in a Semi-Arid Zone

1
Laboratory of Analysis Systems, Processing Information, and Industrial Management Ecole Supérieure de Technologie de Salé, Mohammed V University in Rabat, Rabat 15062, Morocco
2
CISIEV FST, FSJES Cadi Ayyad University, Marrakech 40000, Morocco
3
Faculty of Sciences El Jadida, Chouaïb Doukkali University, El Jadida 24000, Morocco
4
Hydraulique Basin Agency of Tensift, Marrakesh 40000, Morocco
5
ProcEDE/AgroBiotech center, Faculty of Sciences and Technologies, Cadi Ayyad University, Marrakech, 40000, Morocco
6
Center for Remote Sensing Applications (CRSA), Mohammed VI Polytechnic University (UM6P), Ben Guerir 43150, Morocco
*
Author to whom correspondence should be addressed.
Water 2023, 15(11), 1997; https://doi.org/10.3390/w15111997
Submission received: 31 March 2023 / Revised: 19 May 2023 / Accepted: 22 May 2023 / Published: 24 May 2023

Abstract

:
Several satellite precipitation estimates are becoming available globally, offering new possibilities for modeling water resources, especially in regions where data are scarce. This work provides the first validation of four satellite precipitation products, CHIRPS v2, Tamsat, Persiann CDR and TerraClimate data, in a semi-arid region of Essaouira city (Morocco). The precipitation data from different satellites are first compared with the ground observations from 4 rain gauges measurement stations using the different comparison methods, namely: Pearson correlation coefficient (r), Bias, mean square error (RMSE), Nash-Sutcliffe efficiency coefficient and mean absolute error (MAE). Secondly, a rainfall-runoff modeling for a basin of the study area (Ksob Basin S = 1483 km2) was carried out based on artificial neural networks type MLP (Multi Layers Perceptron). This model was -then used to evaluate the best satellite products for estimating the discharge. The results indicate that TerraClimate is the most appropriate product for estimating precipitation (R2 = 0.77 and 0.62 for the training and validation phase, respectively). By using this product in combination with hydrological modeling based on ANN (Artificial Neural Network) approach, the simulations of the monthly flow in the watershed were not very satisfactory. However, a clear improvement of the flow estimations occurred when the ESA-CCI (European Space Agency’s (ESA) Climate Change Initiative (CCI)) soil moisture was added (training phase: R2 = 0.88, validation phase: R2 = 0.69 and Nash ≥ 92%). The results offer interesting prospects for modeling the water resources of the coastal zone watersheds with this data.

1. Introduction

Rainfall, one of the most critical variables, is the result of several complex processes in the atmosphere that vary in both space and time [1]. A significant climatic problem confronting society today is associated with global warming, changing rainfall patterns, and their impact on surface water resources.
A rainfall network is generally defined as collecting rainfall stations in a region. This network generates rainfall point measurements that, if dense enough, can represent the entire region, and it considers rainfall spatial variability. This is accomplished by computing the average rainfall measured by each station using one of three methods: the Thiessen method, the arithmetic average, or the use of isohyets.
However, if the study area does not contain a sufficient number of stations, the rainfall estimation will not be effective if based on the abovementioned methods. To overcome this difficulty, the use of satellite products can be a good alternative but needs to be evaluated first to choose the most appropriate product.
Recent developments in remote sensing have shown promise in addressing the inadequacies of traditional methods [1,2,3,4,5,6,7]. In particular, satellite remote sensing datasets are increasingly being used as an auxiliary source of critical hydrologic measurements, helping understand and model hydrologic fluxes. Due to the lack of sufficient rain gauge data for much of the Earth’s surface, satellite precipitation data from various sensors, missions, and algorithms have become more prevalent. This approach is preferred due to its higher accuracy resulting from algorithm advancements.
Several precipitation datasets have been developed using remote sensing data to monitor global rainfall variations over time and space and provide precipitation estimates [8]. Among the models used to estimate rainfall from infrared satellite imagery is PERSIANN (Precipitation Estimation from Remote Sensing Information Using Artificial Neural Network, [9]). CHIRPS (Climate Hazards Group InfraRed Precipitation with Station data), another commonly used satellite product in Africa, utilizes infrared Cold Cloud Duration (CCD) observations to estimate rainfall. TAMSAT (Tropical Application of Meteorology using SATellite Data and Ground-Based Observations) is another algorithm popularly used for Africa, which utilizes thermal imagery to produce 10-day precipitation totals by calculating the duration of cloud tops below a specific temperature and relating it to precipitation using simple linear regression.
Several validation studies of these and other products have been conducted in different world regions, especially in scarce data regions like the eastern and center of Africa, which suffer from a lack of surface monitoring water resources [10,11,12,13,14,15,16,17,18]. These studies have highlighted the potential of this new data source. However, only a small number of investigations have explored the application of satellite rainfall data in Morocco [19,20,21,22,23] and demonstrated that CHIRPS and TRMM 3B43 v7 are capable of accurately reproducing the monthly precipitation patterns. Still, these studies have mainly focused on continental areas. Little attention has been given to the coastal zone characterized by a climate influenced by the Atlantic Ocean and the cold Canary currents.
In this work, an inter-comparison between four sources of rainfall data, TAMSAT, PERSIANN, CHIRPS and TerraClimate dataset, by evaluating them against observed data, the validation of the best product is done by a hydrological model combined with neural networks with all the advantages that present the ANNs for an area lacking a network of hydrometric measurements, climatological and monitoring of physical parameters of the watersheds.
The TerraClimate product, never tested or validated in Morocco and in our study area in particular, is a monthly climate and climate water balance dataset for worldwide land surfaces from 1958 to 2021 and will therefore be tested and exploited in this work in our study region. These data offer crucial information for ecological and hydrological investigations that call for time-varying data and high spatial resolution on a global scale. All data have a 4 km (1/24th degree) spatial resolution and a monthly temporal resolution [10].
The objective of this study is twofold: (1) to assess the accuracy of the four satellite precipitation products listed below through a comparison with the ground measurements over an Atlantic area of Essaouira city (Morocco), and (2) to test the best precipitation product for simulations of the monthly flow in the watershed by using the hydrological modelling combined with artificial neural networks.

2. Materials and Methods
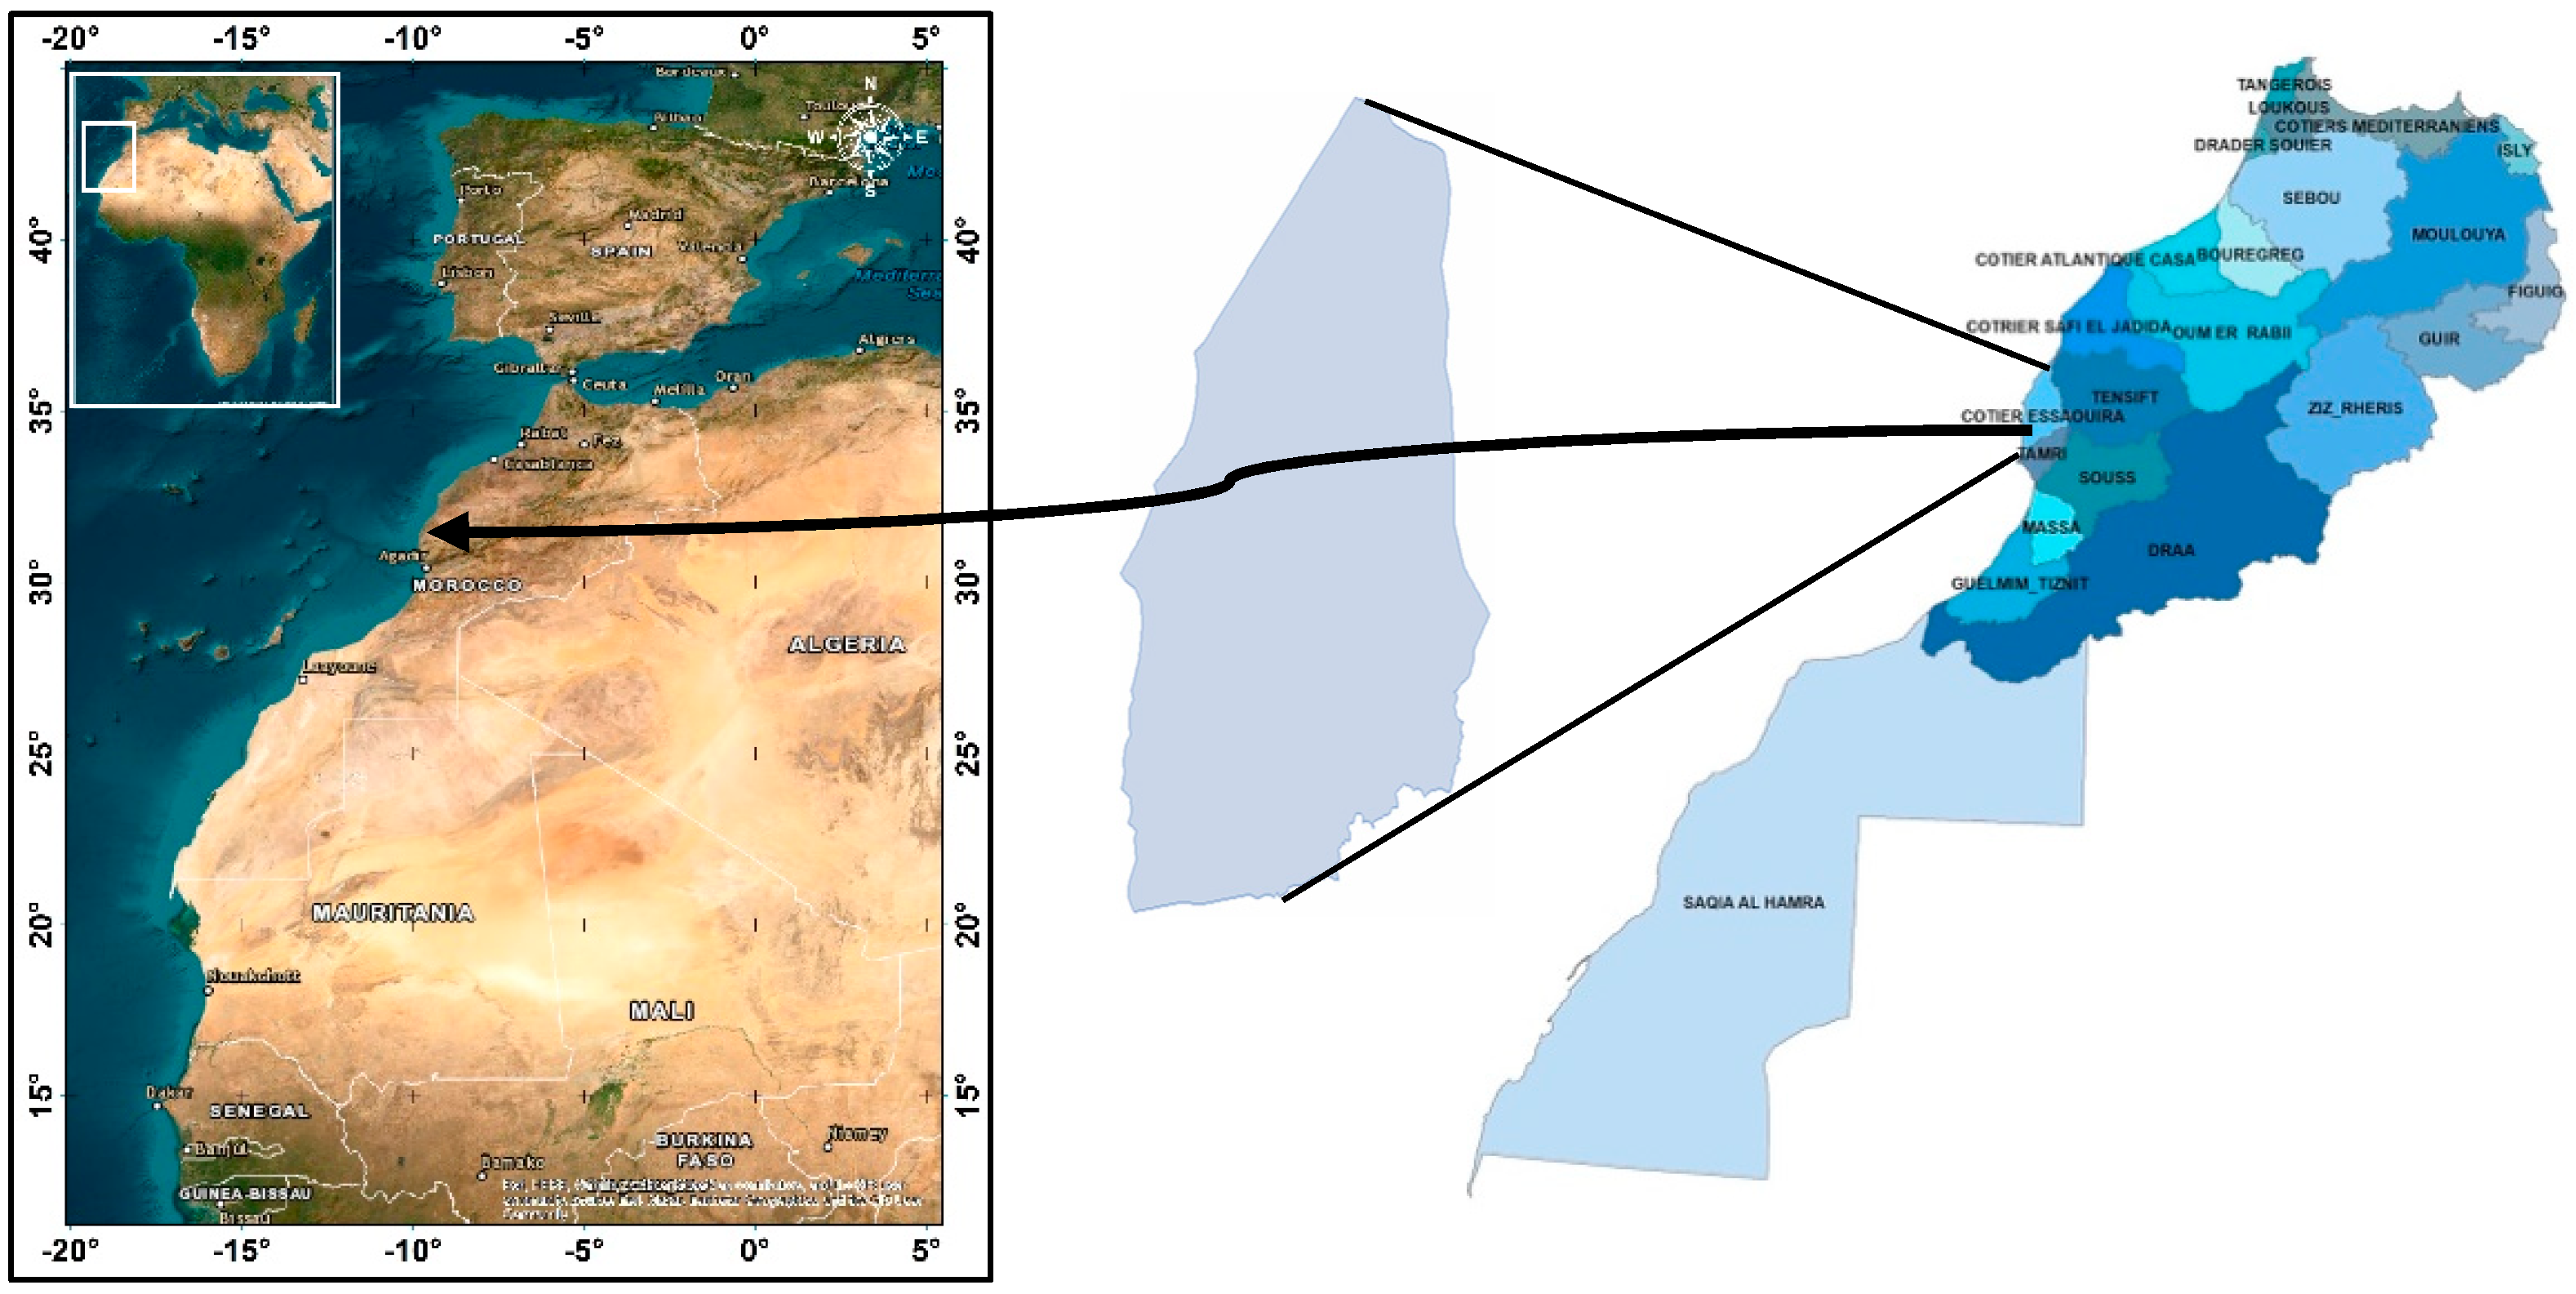
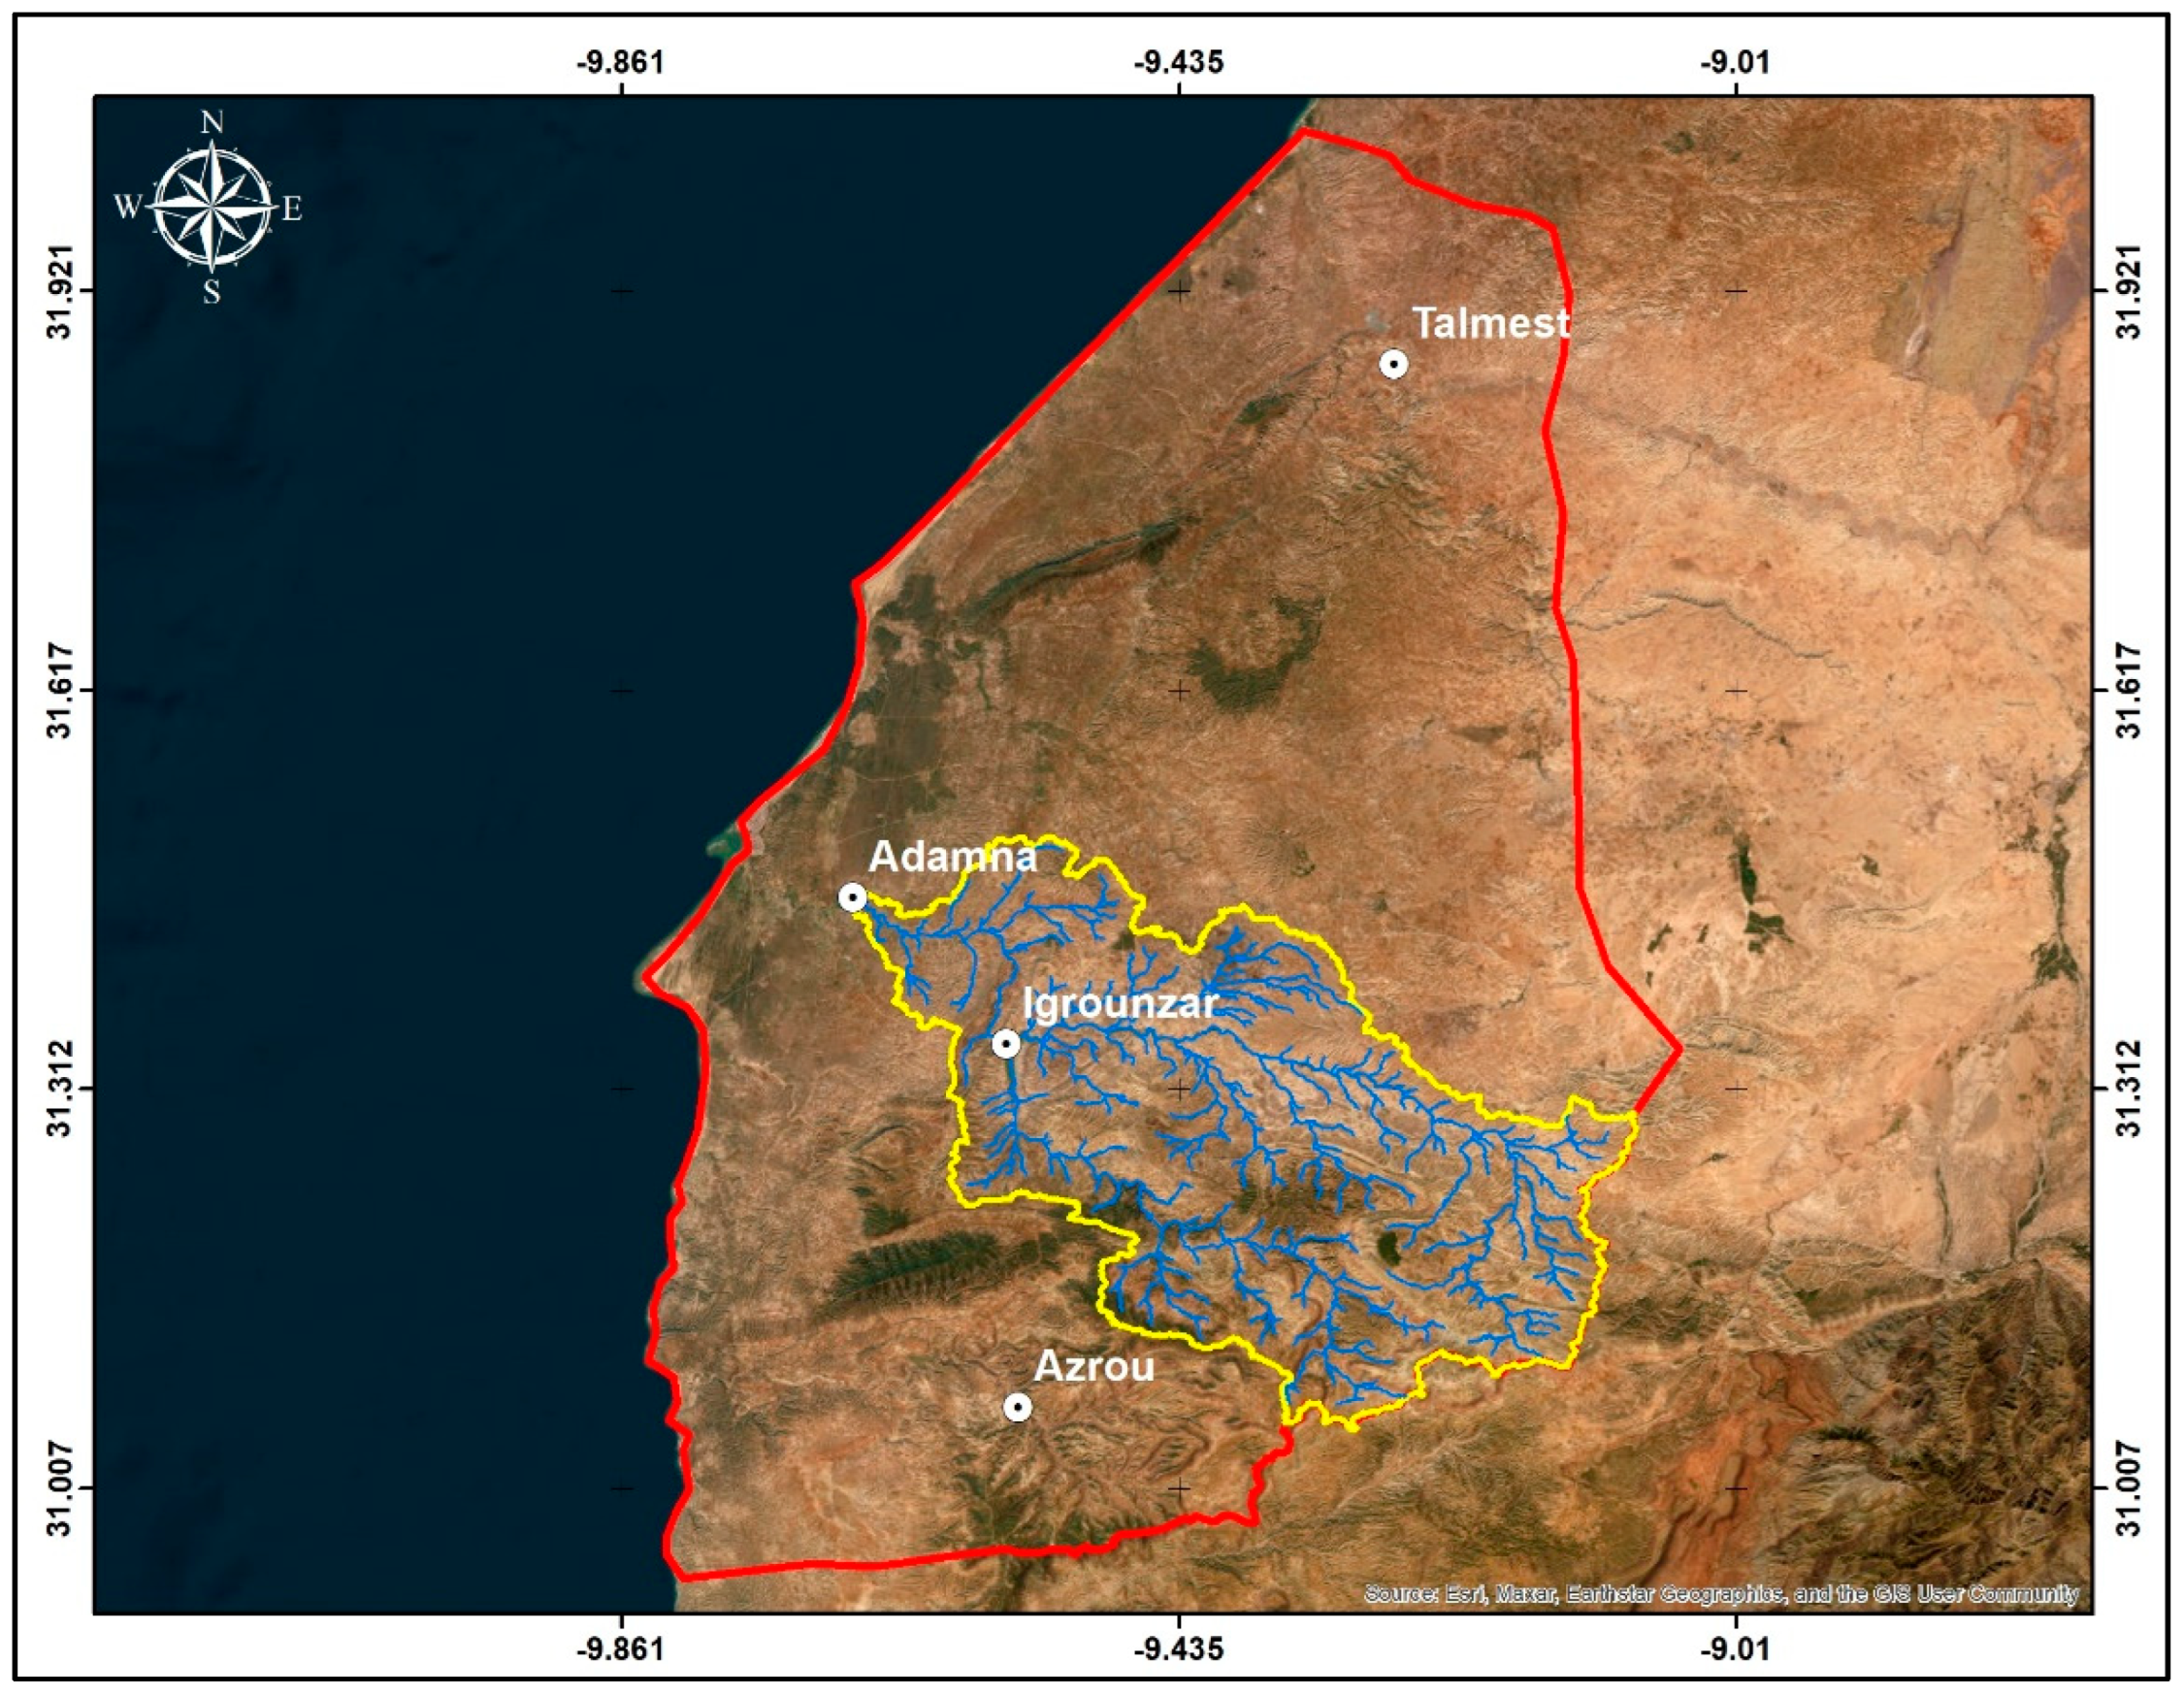
2.1. Study Area

The study area is part of the Essaouira coastal basin (Figure 1), located on the Atlantic coast of central Morocco, at the western end of the High Atlas range.
The study area has a semi-arid climate that transitions to an oceanic climate in Essaouira. It is characterized by low and irregular rainfall, with an annual average of less than 300 mm and high temperatures that can reach 45 °C in the summer.
The hydrological modeling for validating the precipitation product deemed most appropriate for the study area by statistical approaches will be carried out on the Ksob catchment area, which accounts for 24% of the study area (Figure 2).
This region has a significant water deficit, which might be in jeopardy due to the lack of rainfall and a high evaporation rate. Therefore, four-rain gauge stations (Adamna, Azrou, Igrounzar, and Talmest) located throughout the study area (Figure 2) are used to evaluate the different satellite precipitation products. The description and the analysis of the rainfall data recorded by the four stations are described in the following section.

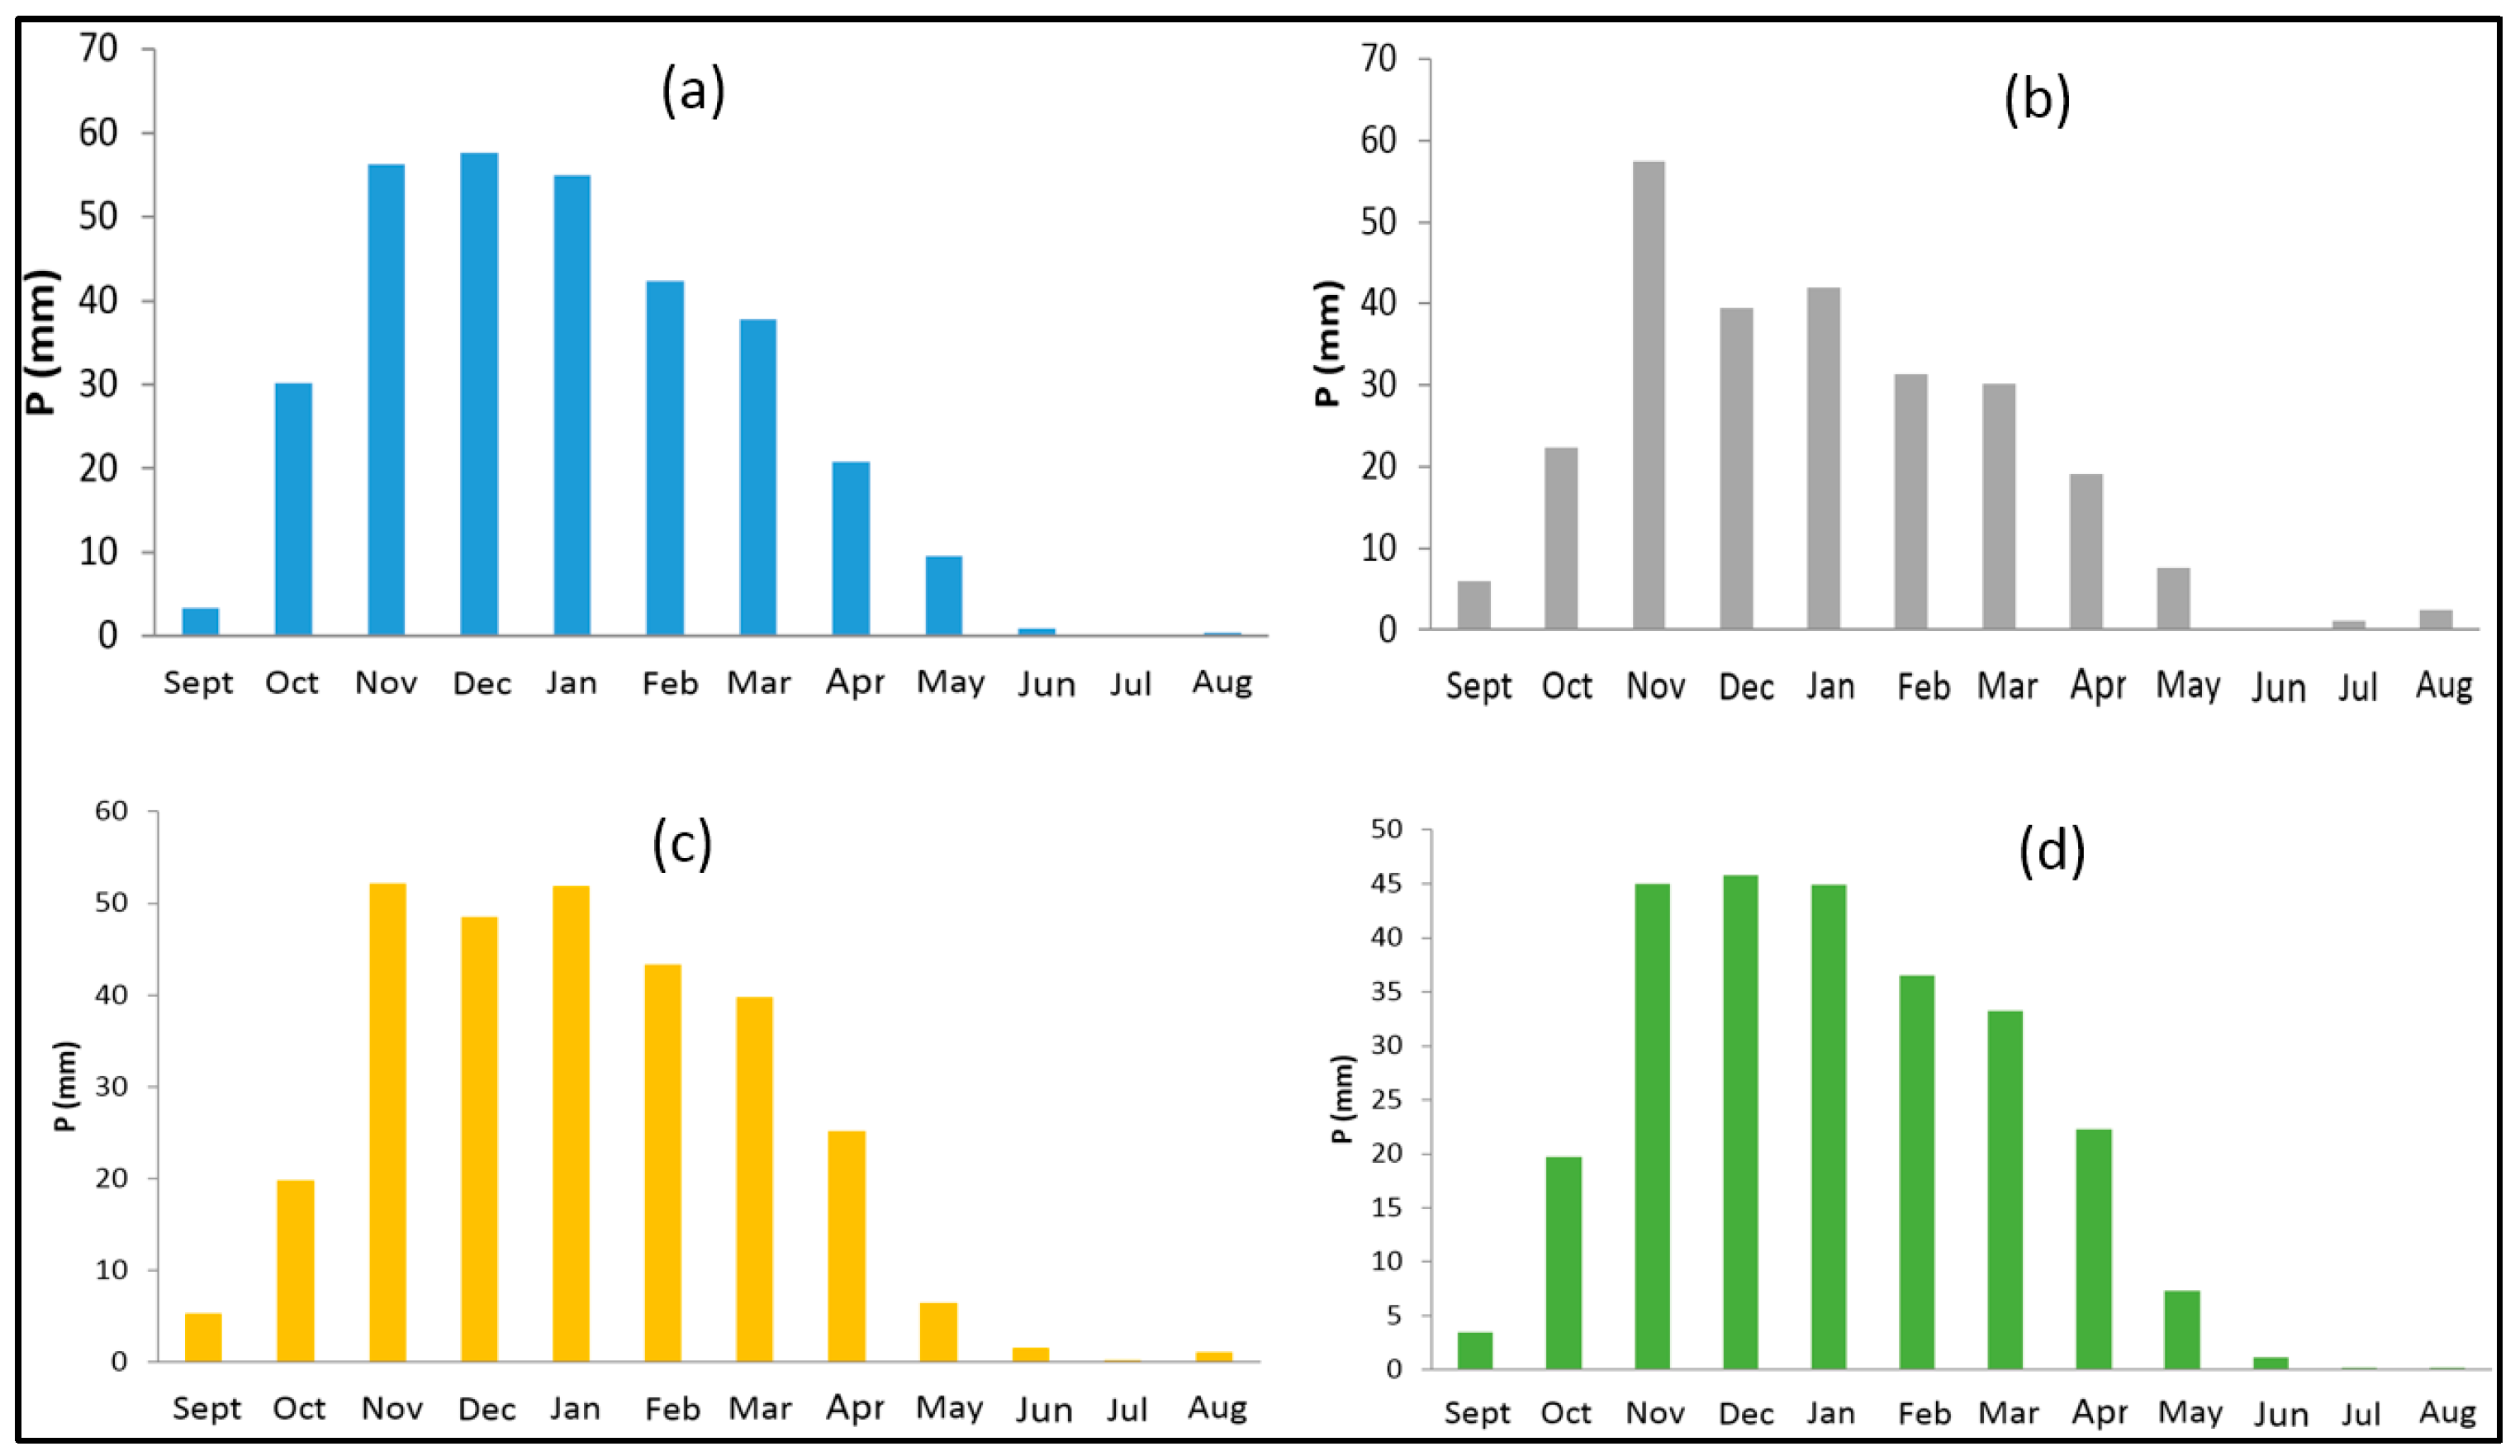
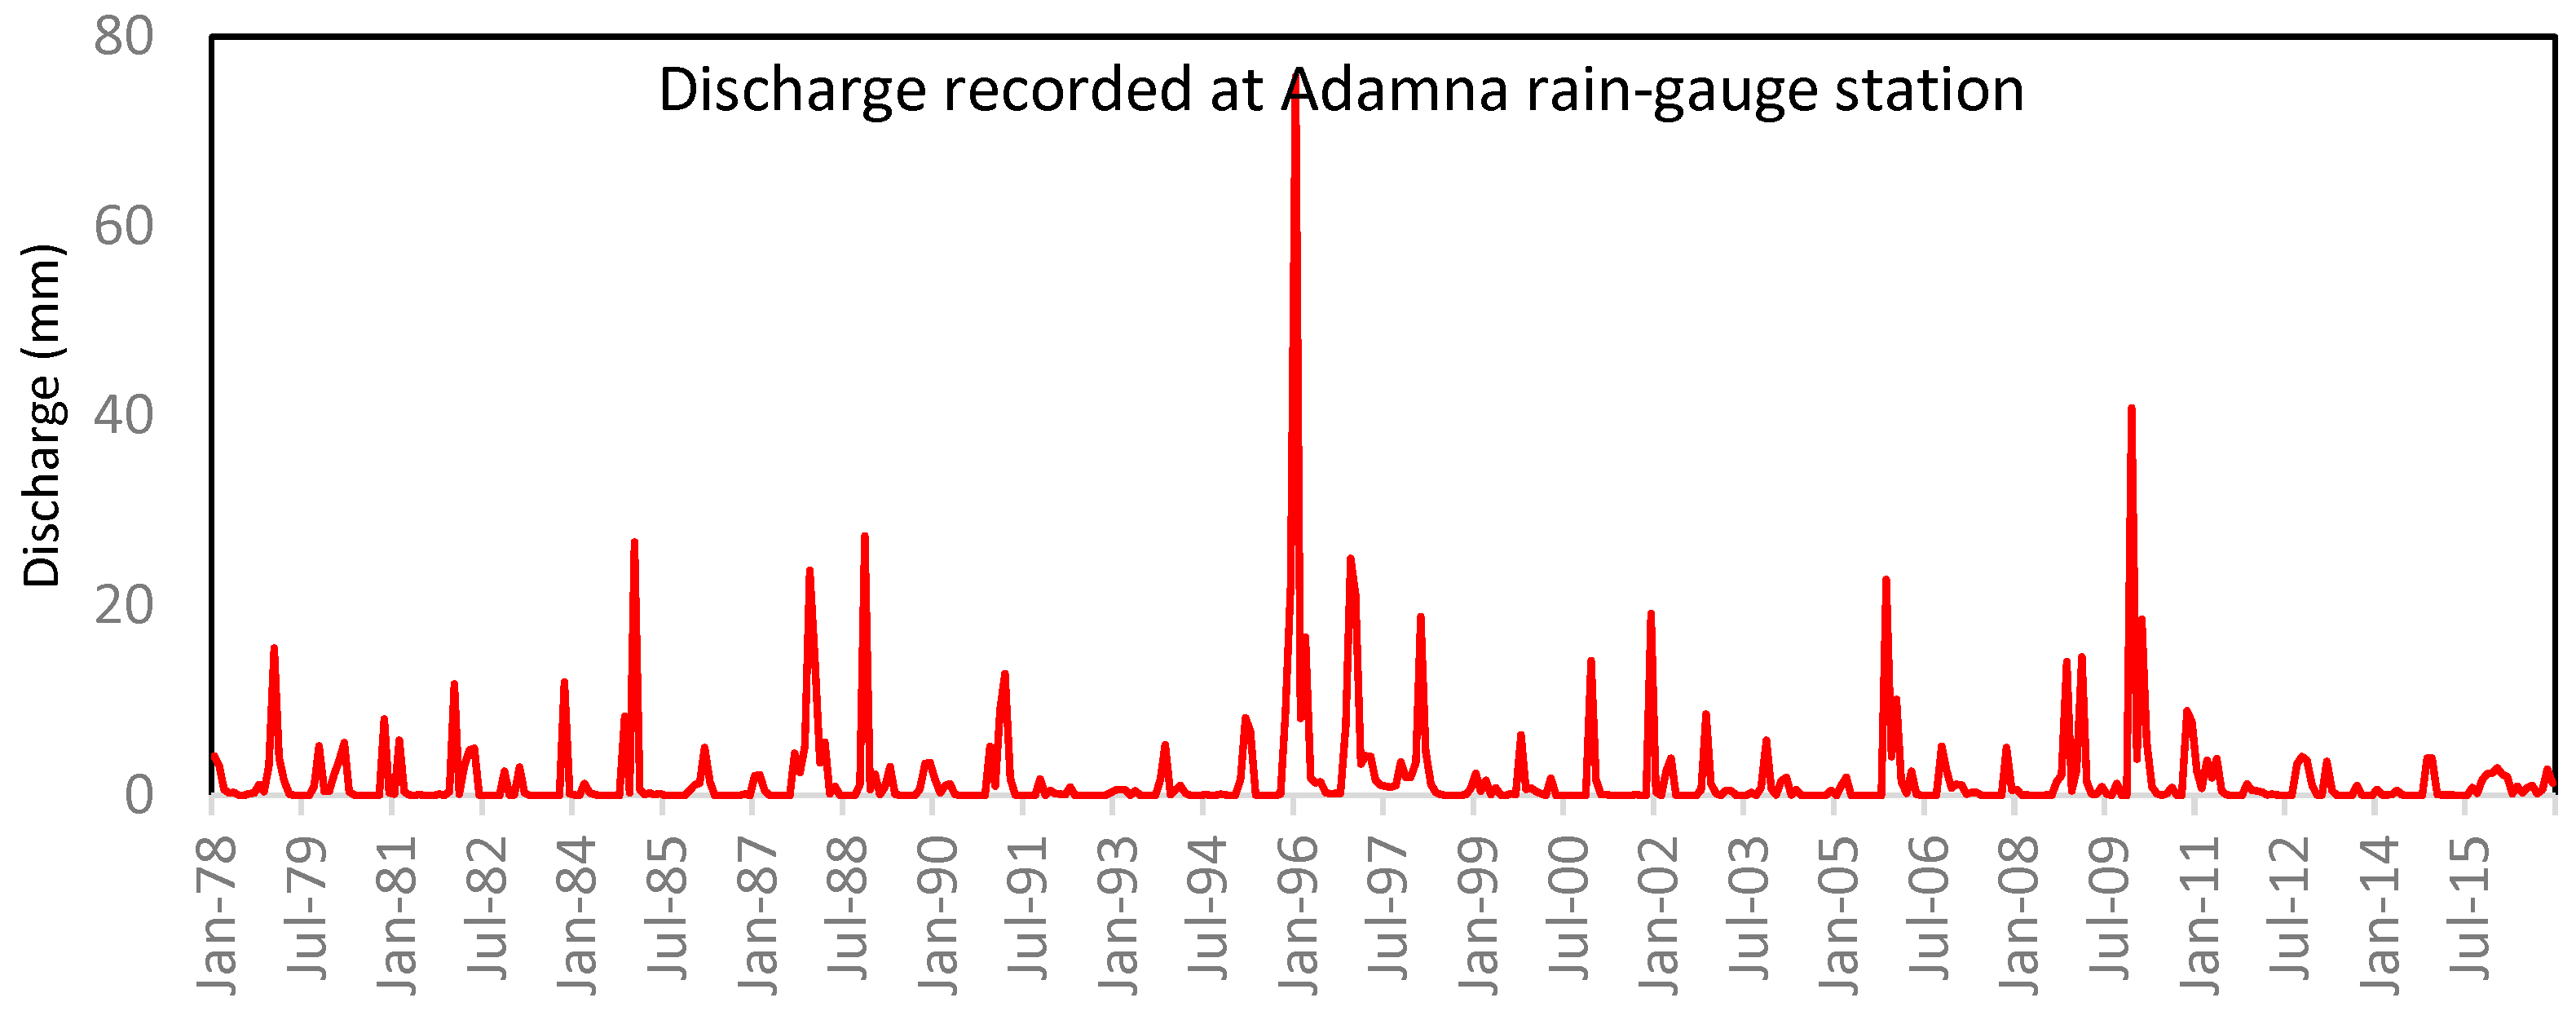
2.2. Weather Station Datal

The monthly rainfall data recorded at the rain gauge stations, provided by the Tensift Hydraulic Basin Agency of Tensift (ABHT), cover a period ranging from 19 to 44 years (Table 1). Due to the unavailability of other measuring stations in the study area or nearby, we will only use data from four precipitation measuring stations managed by the ABHT. These stations have a representative history of measurements and can be considered reliable. This low spatial coverage of measurement stations is a constraint of the study area and a motivation for exploring satellite precipitation products.
According to the rainfall data recorded at the four stations, it can be seen that rainfall is very irregular in time. We can observe that the period is divided into two well-marked seasons: a rainy season extended from October to May and a dry season spread from June to September (Figure 3).
The cumulative annual rainfall is about 314 mm, 261 mm, 276 mm, 245 mm, 288 mm and 254 mm at the Adamna, Azrou, Igrounzar and Talmest stations.

2.3. Satellite Precipitation Products

In this study, four satellite precipitation products were collected over the period 1983 to 2021:
CHIRPS: The climate hazards group at the University of California, Santa Barbara, in collaboration with the United States Geological Survey (USGS), has developed the CHIRPS products that spans over 40 years, from 1981 to the present, as a quasi-global rainfall dataset. The CHIRPS utilizes 0.05-resolution satellite imagery and in-situ station data to generate gridded rainfall time series for analyzing trends and monitoring seasonal drought. The CHIRPS rainfall product is derived from various data sources, including:
i.
Monthly-accumulated climatological precipitation (CHPClim).
ii.
Geostationary satellite observations in the infrared (IR) channel from the NOAA data sources.
iii.
Product of the Climate Prediction Centre (CPC) and the B1 IR of the National Climatic Data Centre (NCDC);
iv.
Precipitation estimated by the TRMM 3B42 product from NASA.
v.
Rainfall field of the NOAA atmospheric model, Climate Forecast System version 2 (CFSv2);
vi.
And in-situ observations of precipitation acquired from national and regional meteorological services.
The CHIRPS uses satellite data in three ways: (i) to produce high-resolution precipitation climatology (CHPclim), (ii) to estimate monthly and pentad precipitation anomalies using CCD fields, and (iii) to estimate local distance decay functions using satellite precipitation fields [24,25,26,27]
TerraClimate: are a global high-resolution (1/24°, 4 km) monthly climate and climatic water balance dataset covering the period from 1958 to 2021. To produce this dataset, TerraClimate uses climatically aided interpolation, which combines high-spatial resolution climatological normals from the WorldClim dataset with monthly data from other coarser resolution sources. This results in monthly precipitation estimates, maximum and minimum temperature, wind speed, vapor pressure, and solar radiation. In addition to this, TerraClimate generates monthly surface water balance datasets by incorporating reference evapotranspiration, precipitation, temperature, and interpolated plant extractable soil water capacity into a water balance model. This dataset is a crucial input for global ecological and hydrological studies that require high spatial resolution and time-varying climate and climatic water balance data [10].
TAMSAT: is a rainfall estimation method developed by the University of Reading based on the Meteosat TIR channel. The method assumes that convective clouds with cold cloud tops produce rainfall that is linearly correlated with CCD. Local gauge records are used to calibrate the retrieval algorithm. TAMSAT products have been available at a spatial resolution of 0.0375° (equivalent to 4 km) and dekadal, monthly, and seasonal temporal resolution, starting from 1983 [28].
PERSIANN-CDR: is a daily global precipitation estimation product developed by the Center for Hydrometeorology and Remote Sensing (CHRS) at the University of California, Irvine (UCI). It covers almost the entire world from 1983 to the present, with a spatial resolution of 0.25° × 0.25°. The algorithm uses an artificial neural network (ANN) model that inputs gridded satellite infrared data (Grid-Sat-BI) to determine rainfall rates. To create non-linear regression parameters for the ANN model, the National Centers for Environmental Prediction (NCEP) Stage IV hourly precipitation data is utilized. The PERSIANN-CDR estimates are then adjusted for bias using the Global Precipitation Climatology Project (GPCP) monthly product. The dataset is available through the NOAA National Centers for Environmental Information (NCEI) Program and the CHRS Data Portal [29].

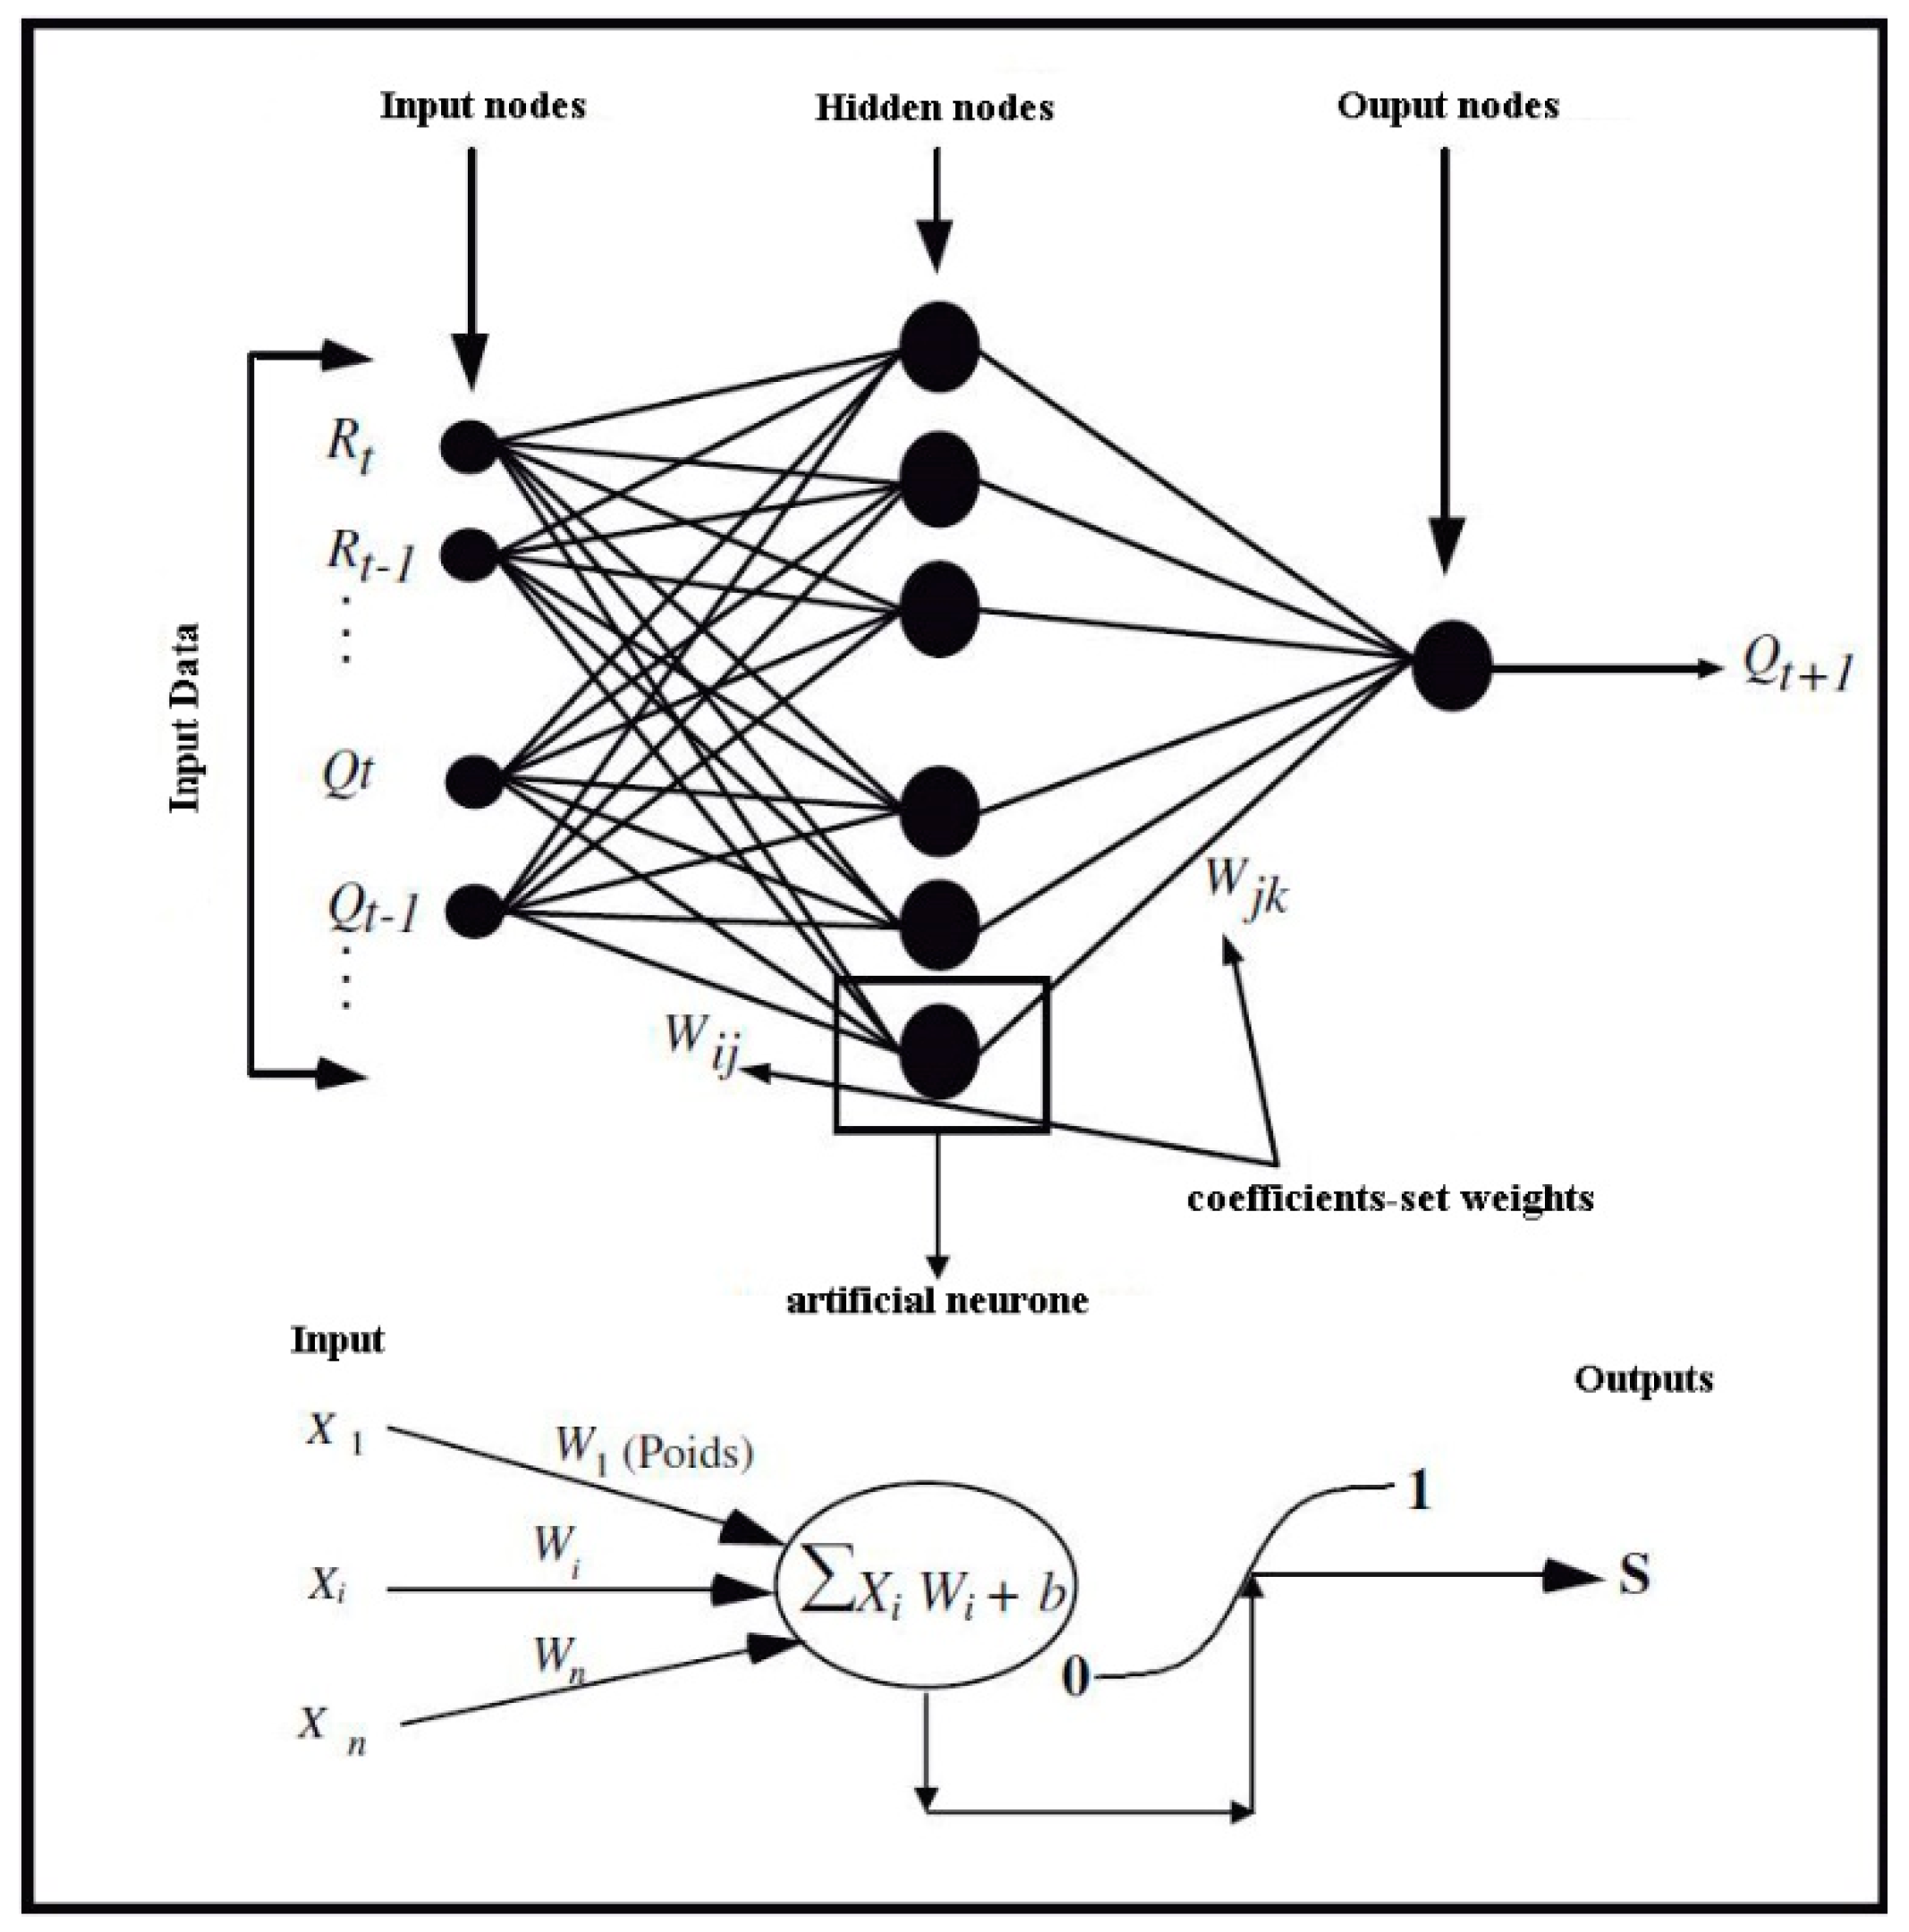
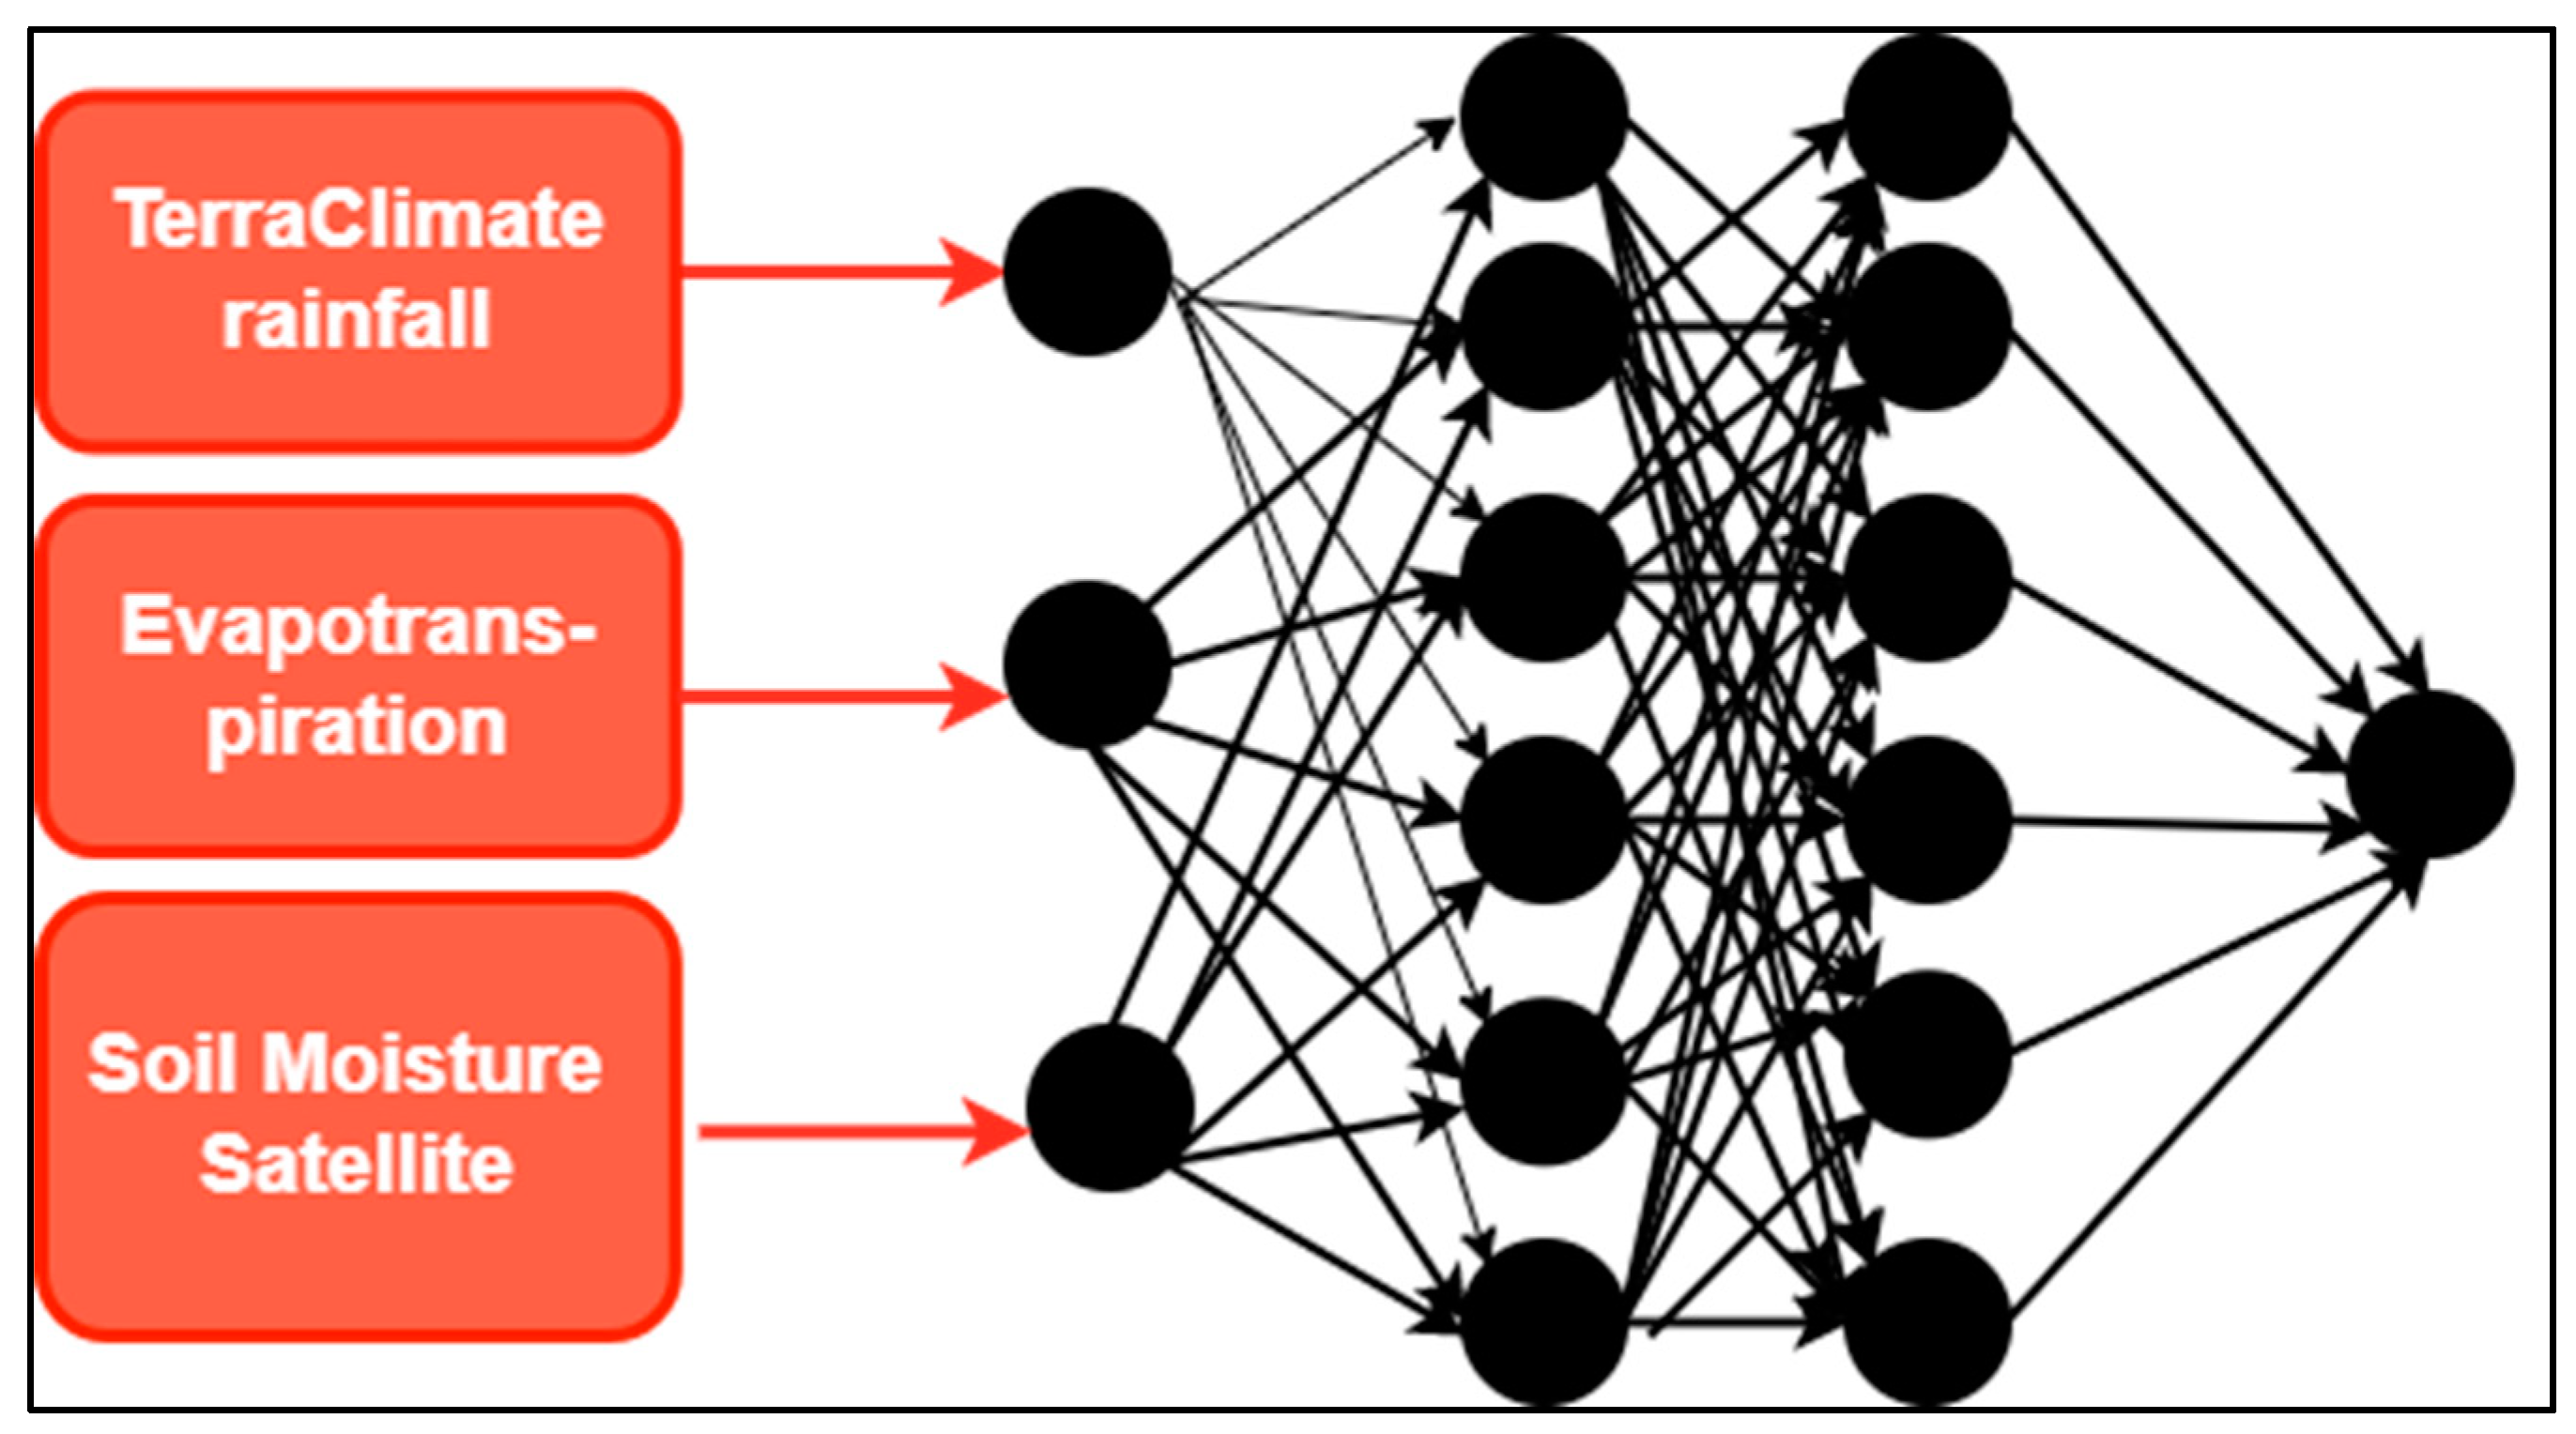
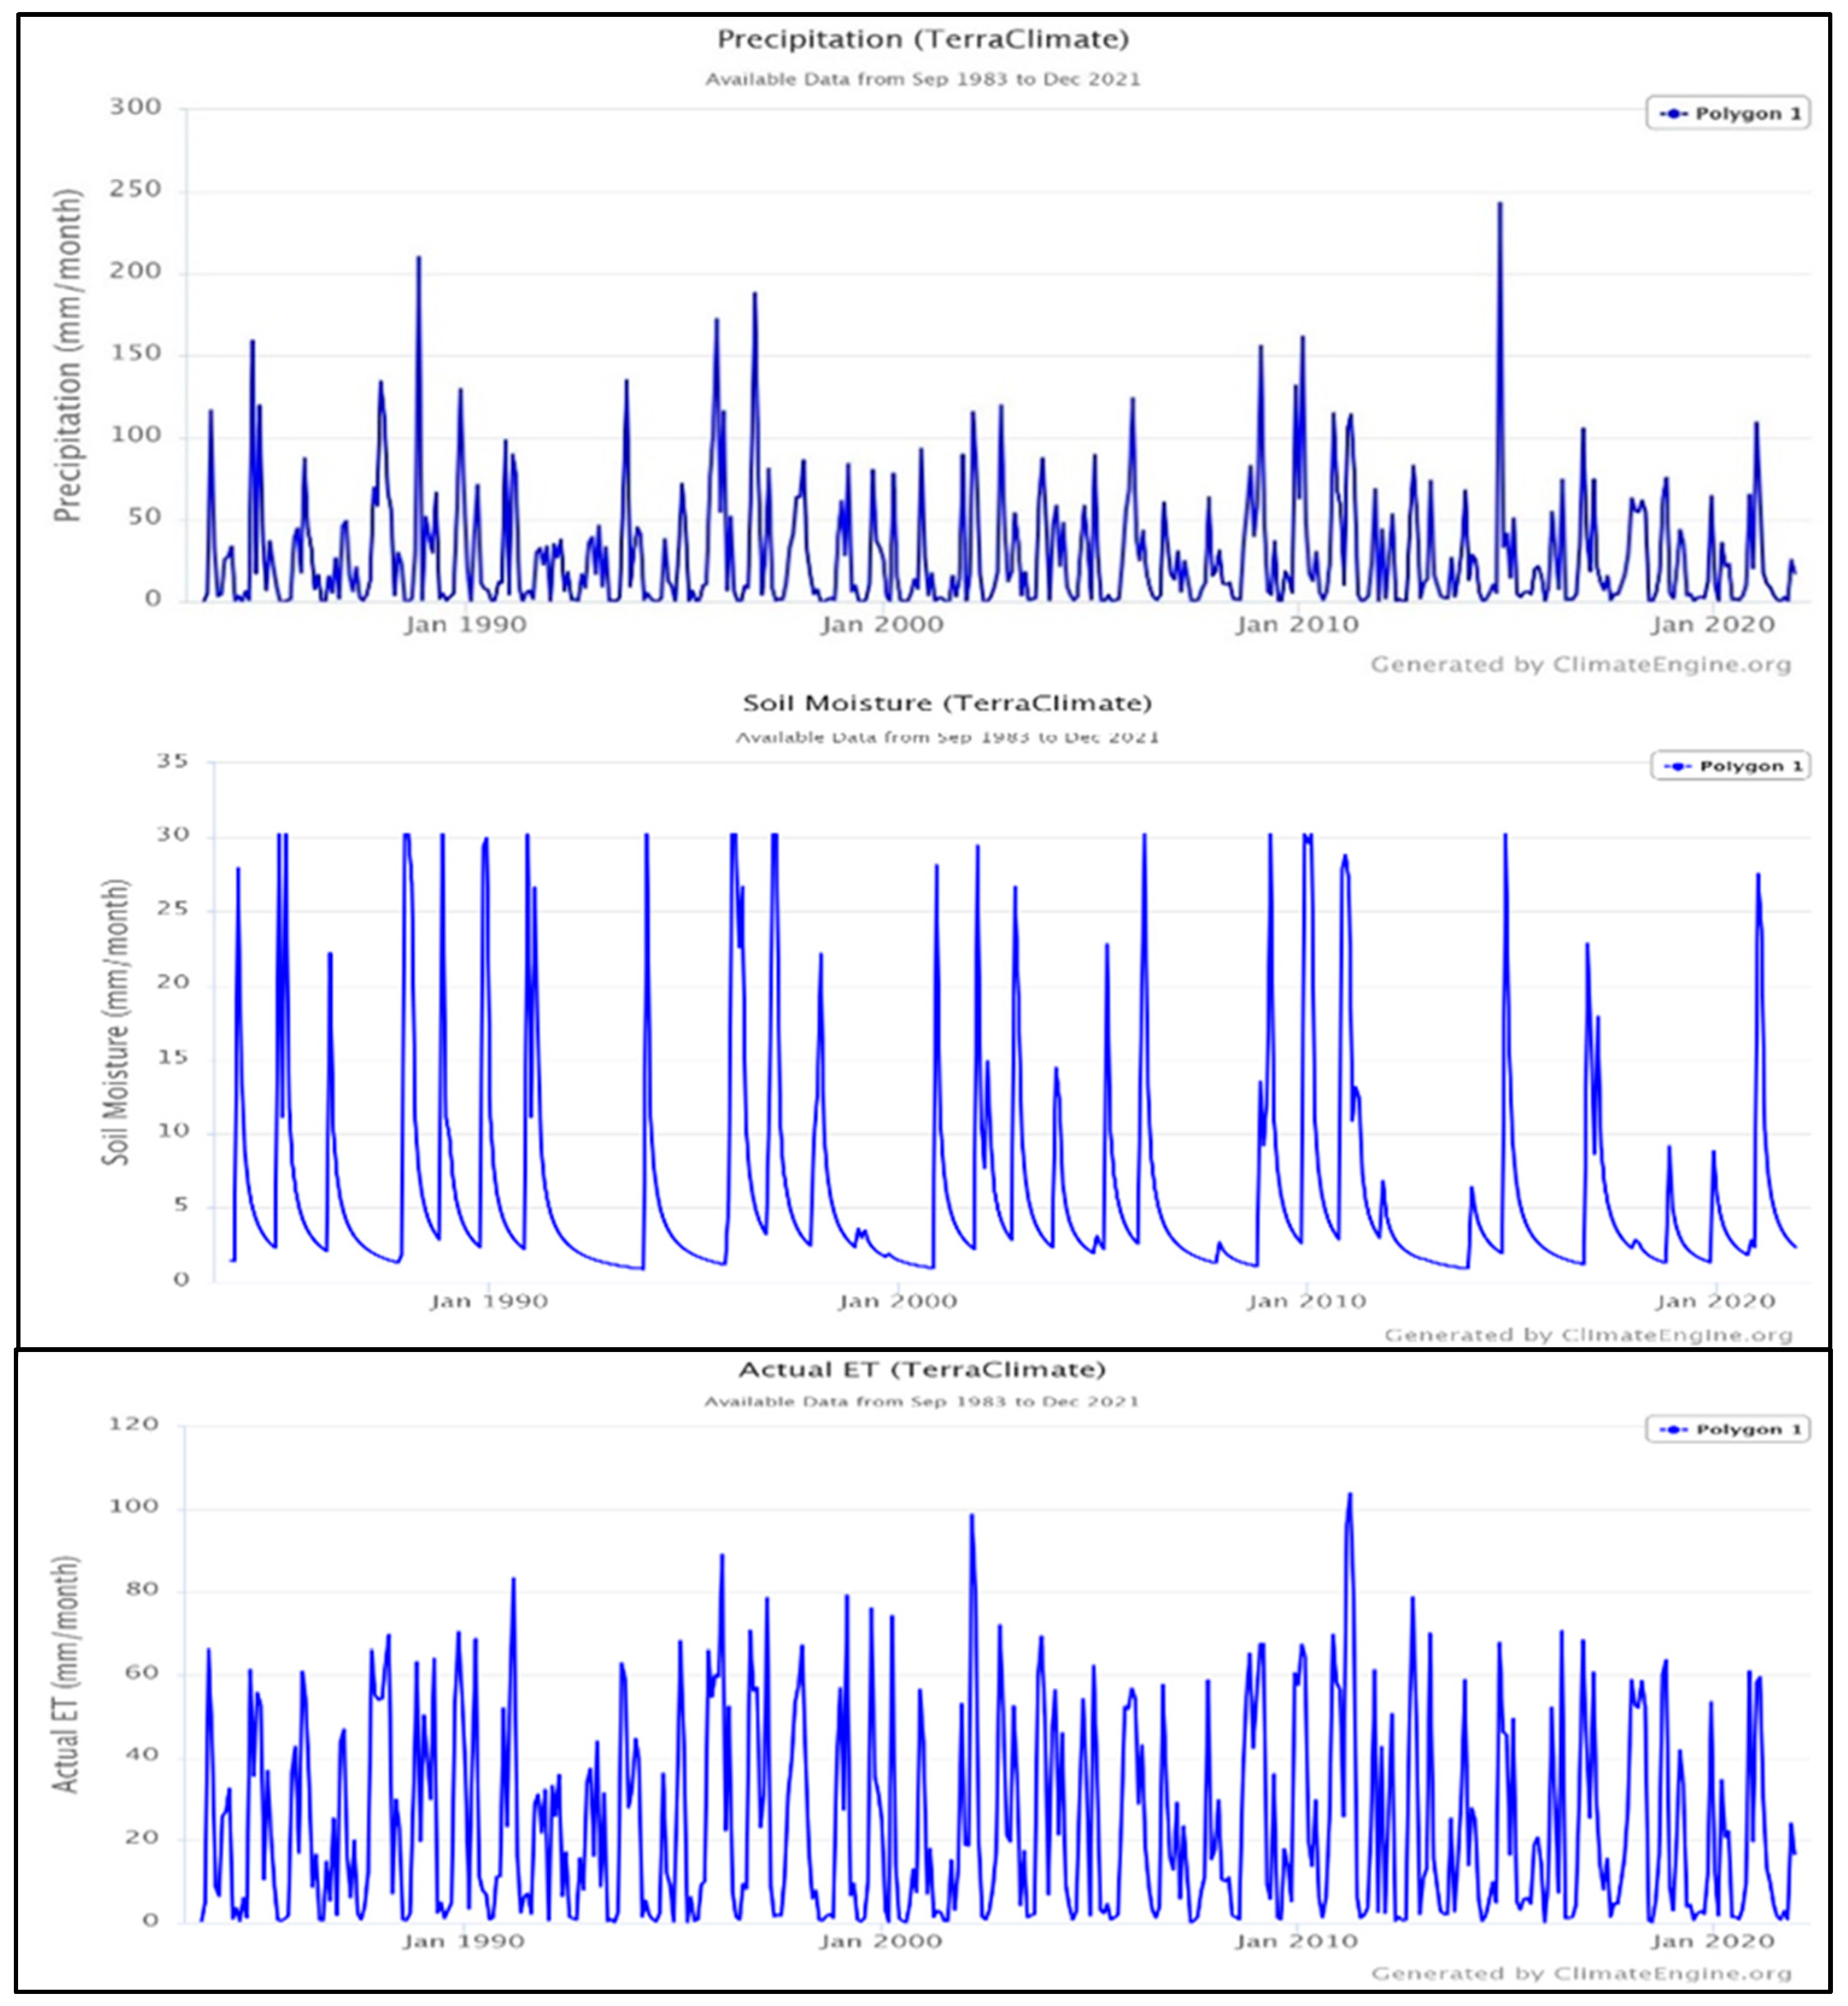
2.4. Hydrological Modeling Based on ANN

The advantages of ANR modeling, such as its capacity to represent any nonlinear function given the sufficient complexity of the trained networks, have motivated its selection for this project. Hydrological process modeling increasingly uses Artificial Neural Networks (ANN), including applications such as rainfall prediction, rainfall-runoff modeling, flood forecasting, water quality modeling, groundwater modeling, water management policy development, and reservoir operation studies [30].
Artificial neural networks have emerged as a promising method for modeling complex systems, particularly in cases where traditional statistical approaches are inadequate. These networks were developed based on the biological neural network found in the human brain, which comprises billions of interconnected neurons [31]. With advances in information processing technology, artificial neural networks (ANNs) have been able to simulate the brain’s massively parallel processing and distributed storage properties. ANNs are mathematical structures capable of representing arbitrary, complex, and nonlinear processes that correlate input and output in any system. For example, in surface hydrology, neural networks have been employed to model nonlinear phenomena, such as rainfall-runoff [2,7,32,33], reservoir inflow forecasting [34], stream flow prediction [35,36,37,38], sea level fluctuations [5,39], as well as rainfall forecasting [3,40,41,42,43,44,45]. Given the nonlinear and random nature of hydrological phenomena and the advantages listed above, ANNs may be an appropriate method for simulation and forecasting.
There are many ways to arrange artificial neurons, but the Perceptron Multilayer Network is the most commonly used for forecasting hydrological phenomena (PMC). This network consists of an input layer of artificial neurons, one or more hidden layers (MLP or Multilayers Perceptron), and an output layer of artificial neurons [46]. Each layer contains computing units (neurons) linked to other neurons via weights.
The transfer function used in this context can have multiple forms. Typically, it is a continuous, differentiable, non-decreasing, and bounded function, with a weighted sum of the sigmoid type being the most frequently utilized form.
For the rainfall-runoff model, the artificial neural network was constructed using the Visual Gene Developer environment, a freely available program designed for artificial neural network prediction in various applications, created by the Department of Chemical Engineering and Materials Science at the University of California-Davis. The neural network used in this study has three layers: an input layer that retrieves the source data we want to analyze, one hidden layer composed of the neurons outputs from the input layer, and an output layer that displays the results after the network has combined the data entering the first layer (Figure 4).

2.5. Data Analysis Methodology

Satellite precipitation products can be directly evaluated through a comparison with the weather stations using different statistical parameters described below. In addition, an indirect assessment of the satellite precipitation products can be performed by comparing a hydrological model’s observed and simulated flow.

Statistical Approaches

The statistical validation of rainfall estimates can be summarized in four methodologies:
i.
by visual comparison of variables;
ii.
by quantitative comparison;
iii.
by qualitative comparison;
iv.
by comparison of spatial structures of precipitation fields.
Several authors have constructed statistical criteria for the verification and validation of satellite precipitation products [47,48,49,50]. The performance of the various satellite products was assessed monthly using a wide range of statistical metrics, including the Pearson Correlation Coefficient (PCC), Nash-Sutcliffe Efficiency Coefficient (NSE), Root Mean Square Error (RMSE), and Bias (BIAS).
The proportional size of the residual difference compared to the difference in the measured data is compared using the Nash-Sutcliffe efficiency (NSE) [51]. The NSE value measures how well the plot of observed versus estimated data matches the 1:1 line and is based on the dispersion of variants around the line of equal values. NSE values may be between −∞ (poor fit) to 1.0. (perfect fit). Other sources [52] provide a more thorough performance rating breakdown for the NSE values. Equation (1) displays the NSE expression:
N S E = 1 i = 1 n ( S i G i ) 2 i = 1 n ( S i G ) 2
Si represents gauge-based precipitation measurements, G i represents satellite-based measurements, and G represents the average of gauge-based precipitation measures.
The Pearson Correlation Coefficient (PCC) is the average of the products of the standard deviations of the two variables divided by the variances from their respective means. The correlation coefficient’s equation is as follows:
P C C = i = 1 n ( G i G ) ( S i S ) i = 1 n ( G i G ) 2 i = 1 n ( S i S ) 2
RMSE, or root-mean-square error, is a metric used to describe the discrepancies between observed and anticipated values. The RMSE integrates the sizes of prediction mistakes for different times into a single indicator of predictive capacity. The following equation is used to compute the RMS error:
R M S E = i = 1 n ( S i G i ) 2 n
Bias measures how the average magnitude of satellite rainfall compares to ground rainfall observations. A score of one is the highest possible. A bias value greater than or less than one indicates an aggregate satellite overestimation (underestimation) of ground precipitation amounts. G stands for gauge rainfall observations, Si stands for satellite rainfall estimates, Gi stands for average gauge rainfall observations, S stands for average satellite rainfall estimates, and n stands for the number of data pairs.
B i a s = i = 1 n S i i = 1 n G i
In order to evaluate the performance of different satellite rainfall products, four statistical indicators [53], described below, have been considered using the contingency table (Table 2).
-
The POD (the Probability Of Detection), which represents the fraction of observed events that were correctly estimated, is also referred to as the success rate;
-
The FAR (the False Alarm Ratio) is the estimated proportion of events that tend to be falsely detected.
-
The critical success index (CSI) measures the ratio of satellite events that are correctly detected to the total number of observed or detected events.
-
The Heidke skill score (HSS) measures the accuracy of the estimates accounting for matches due to random chance.
Below is a summary table (Table 3) of the statistical indexes used to quantify the performance of the satellite Rainfall products:

3. Results and Discussions

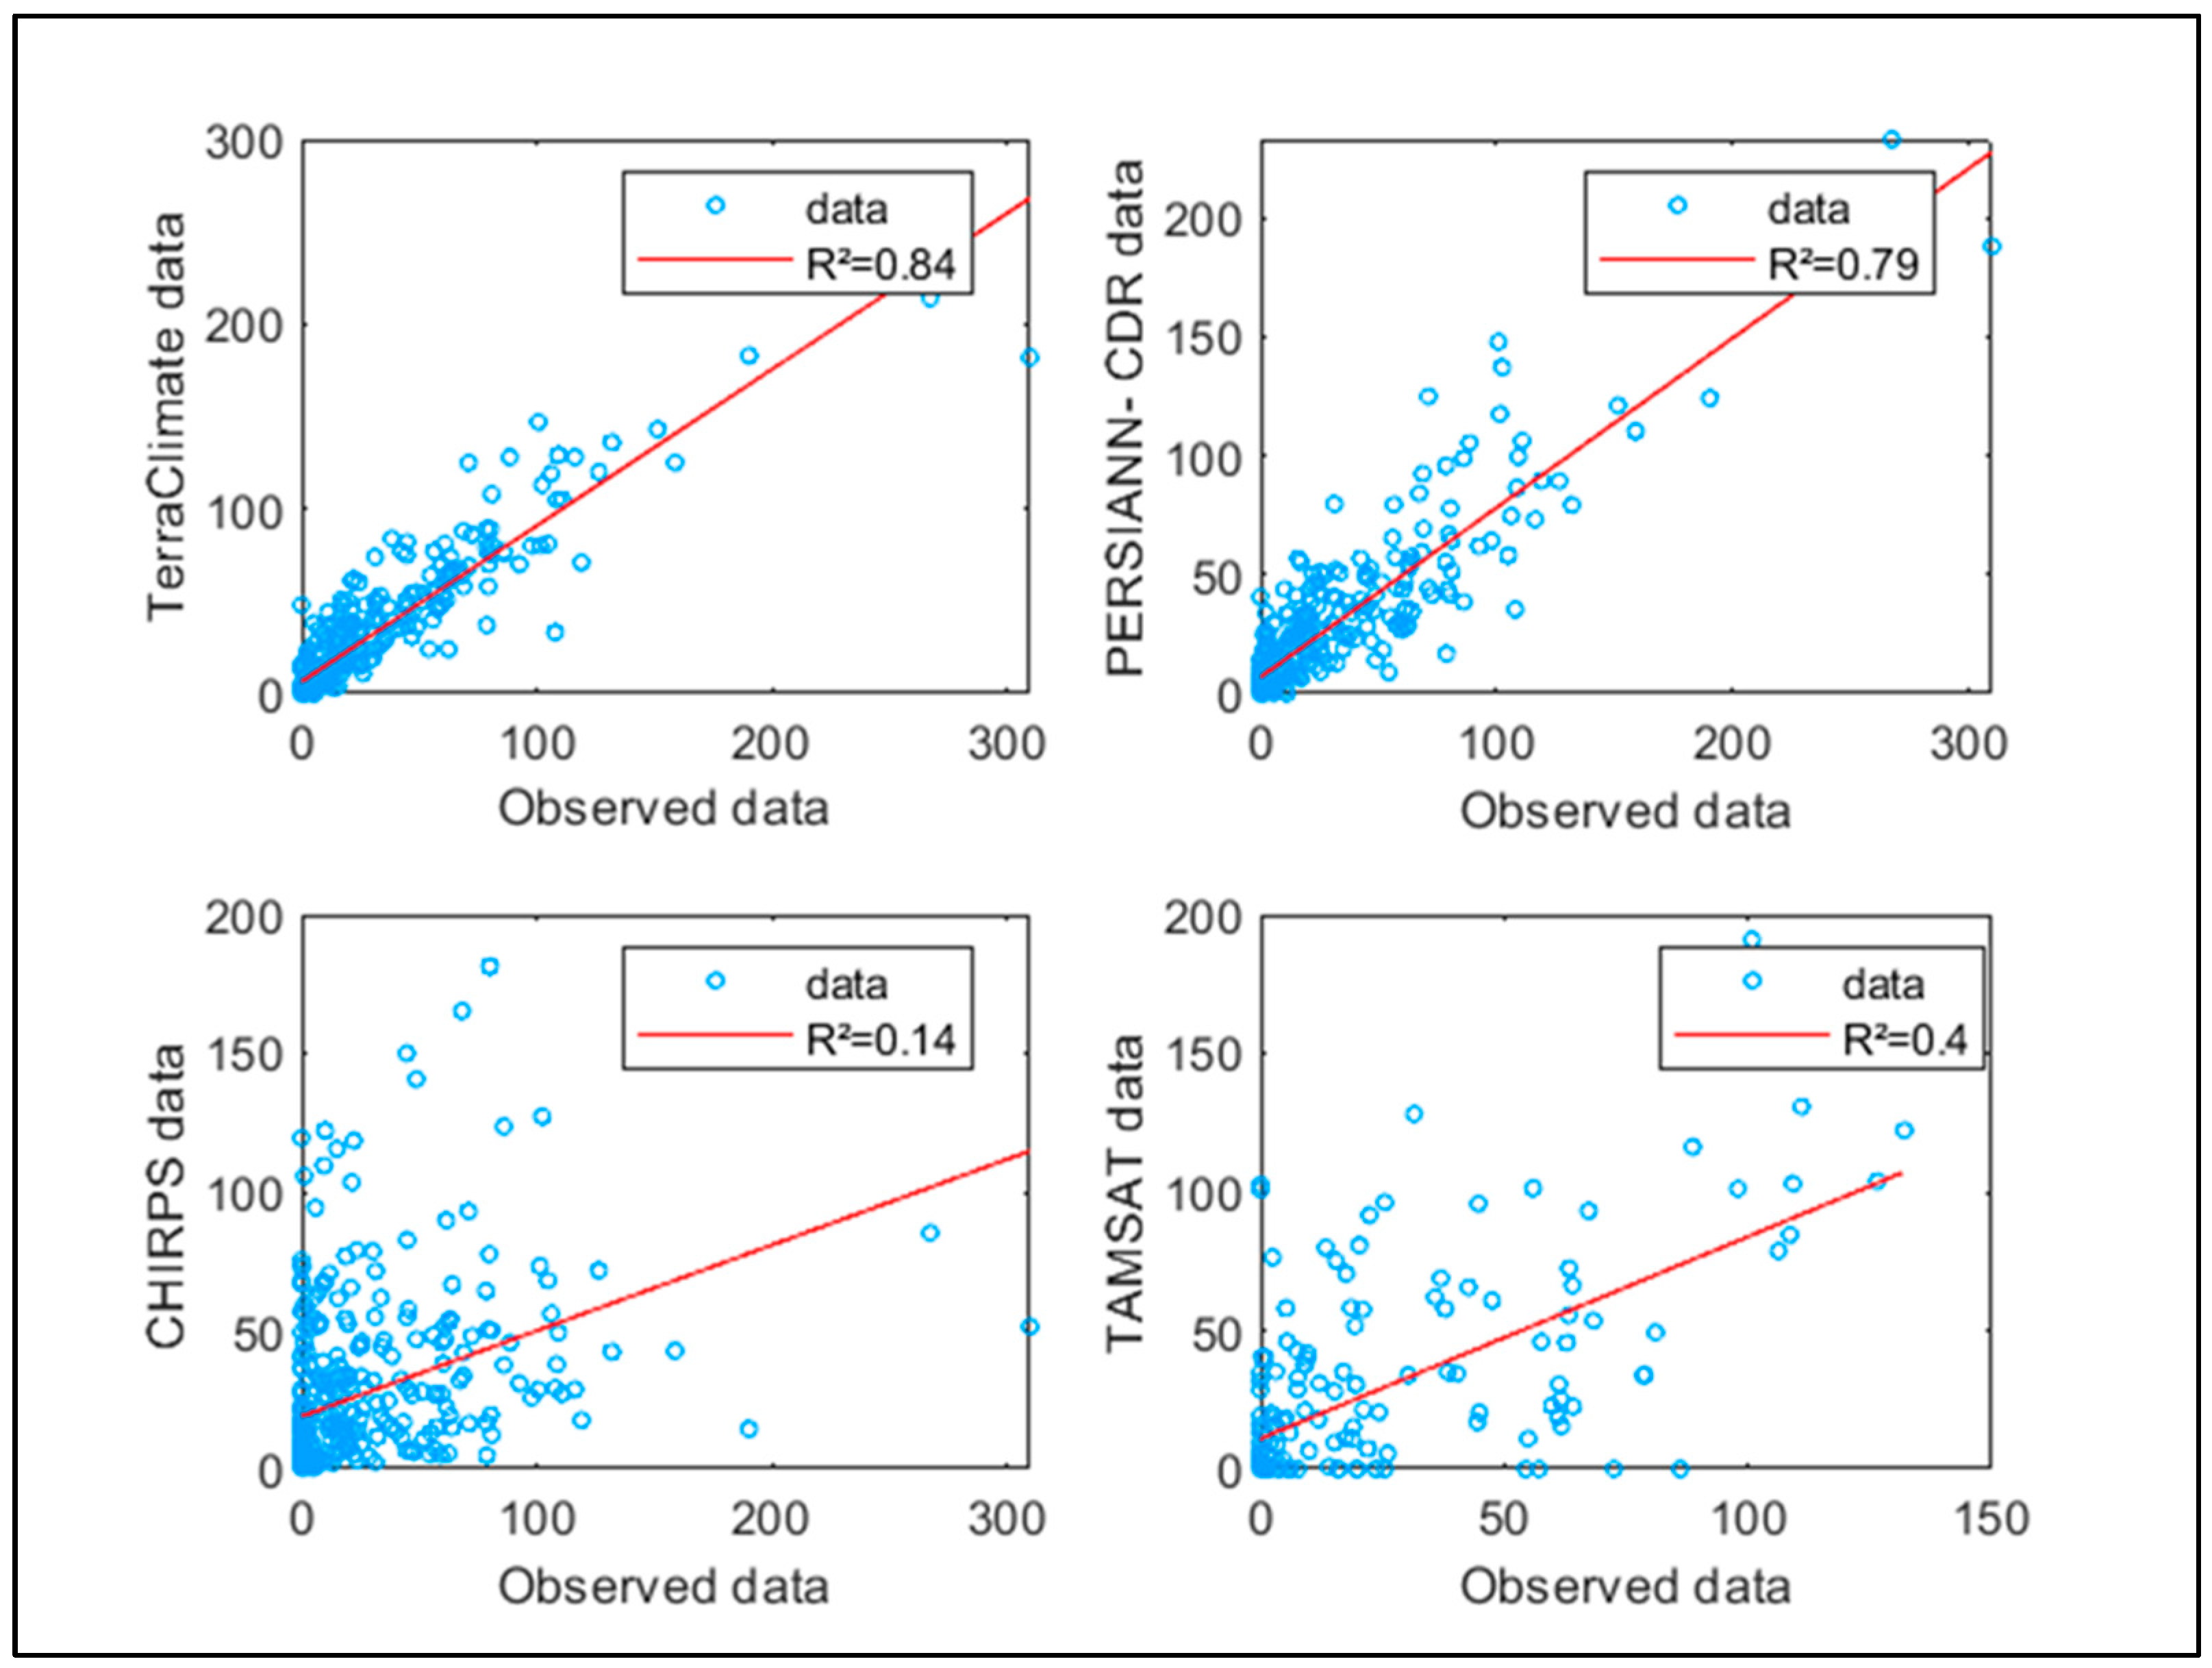
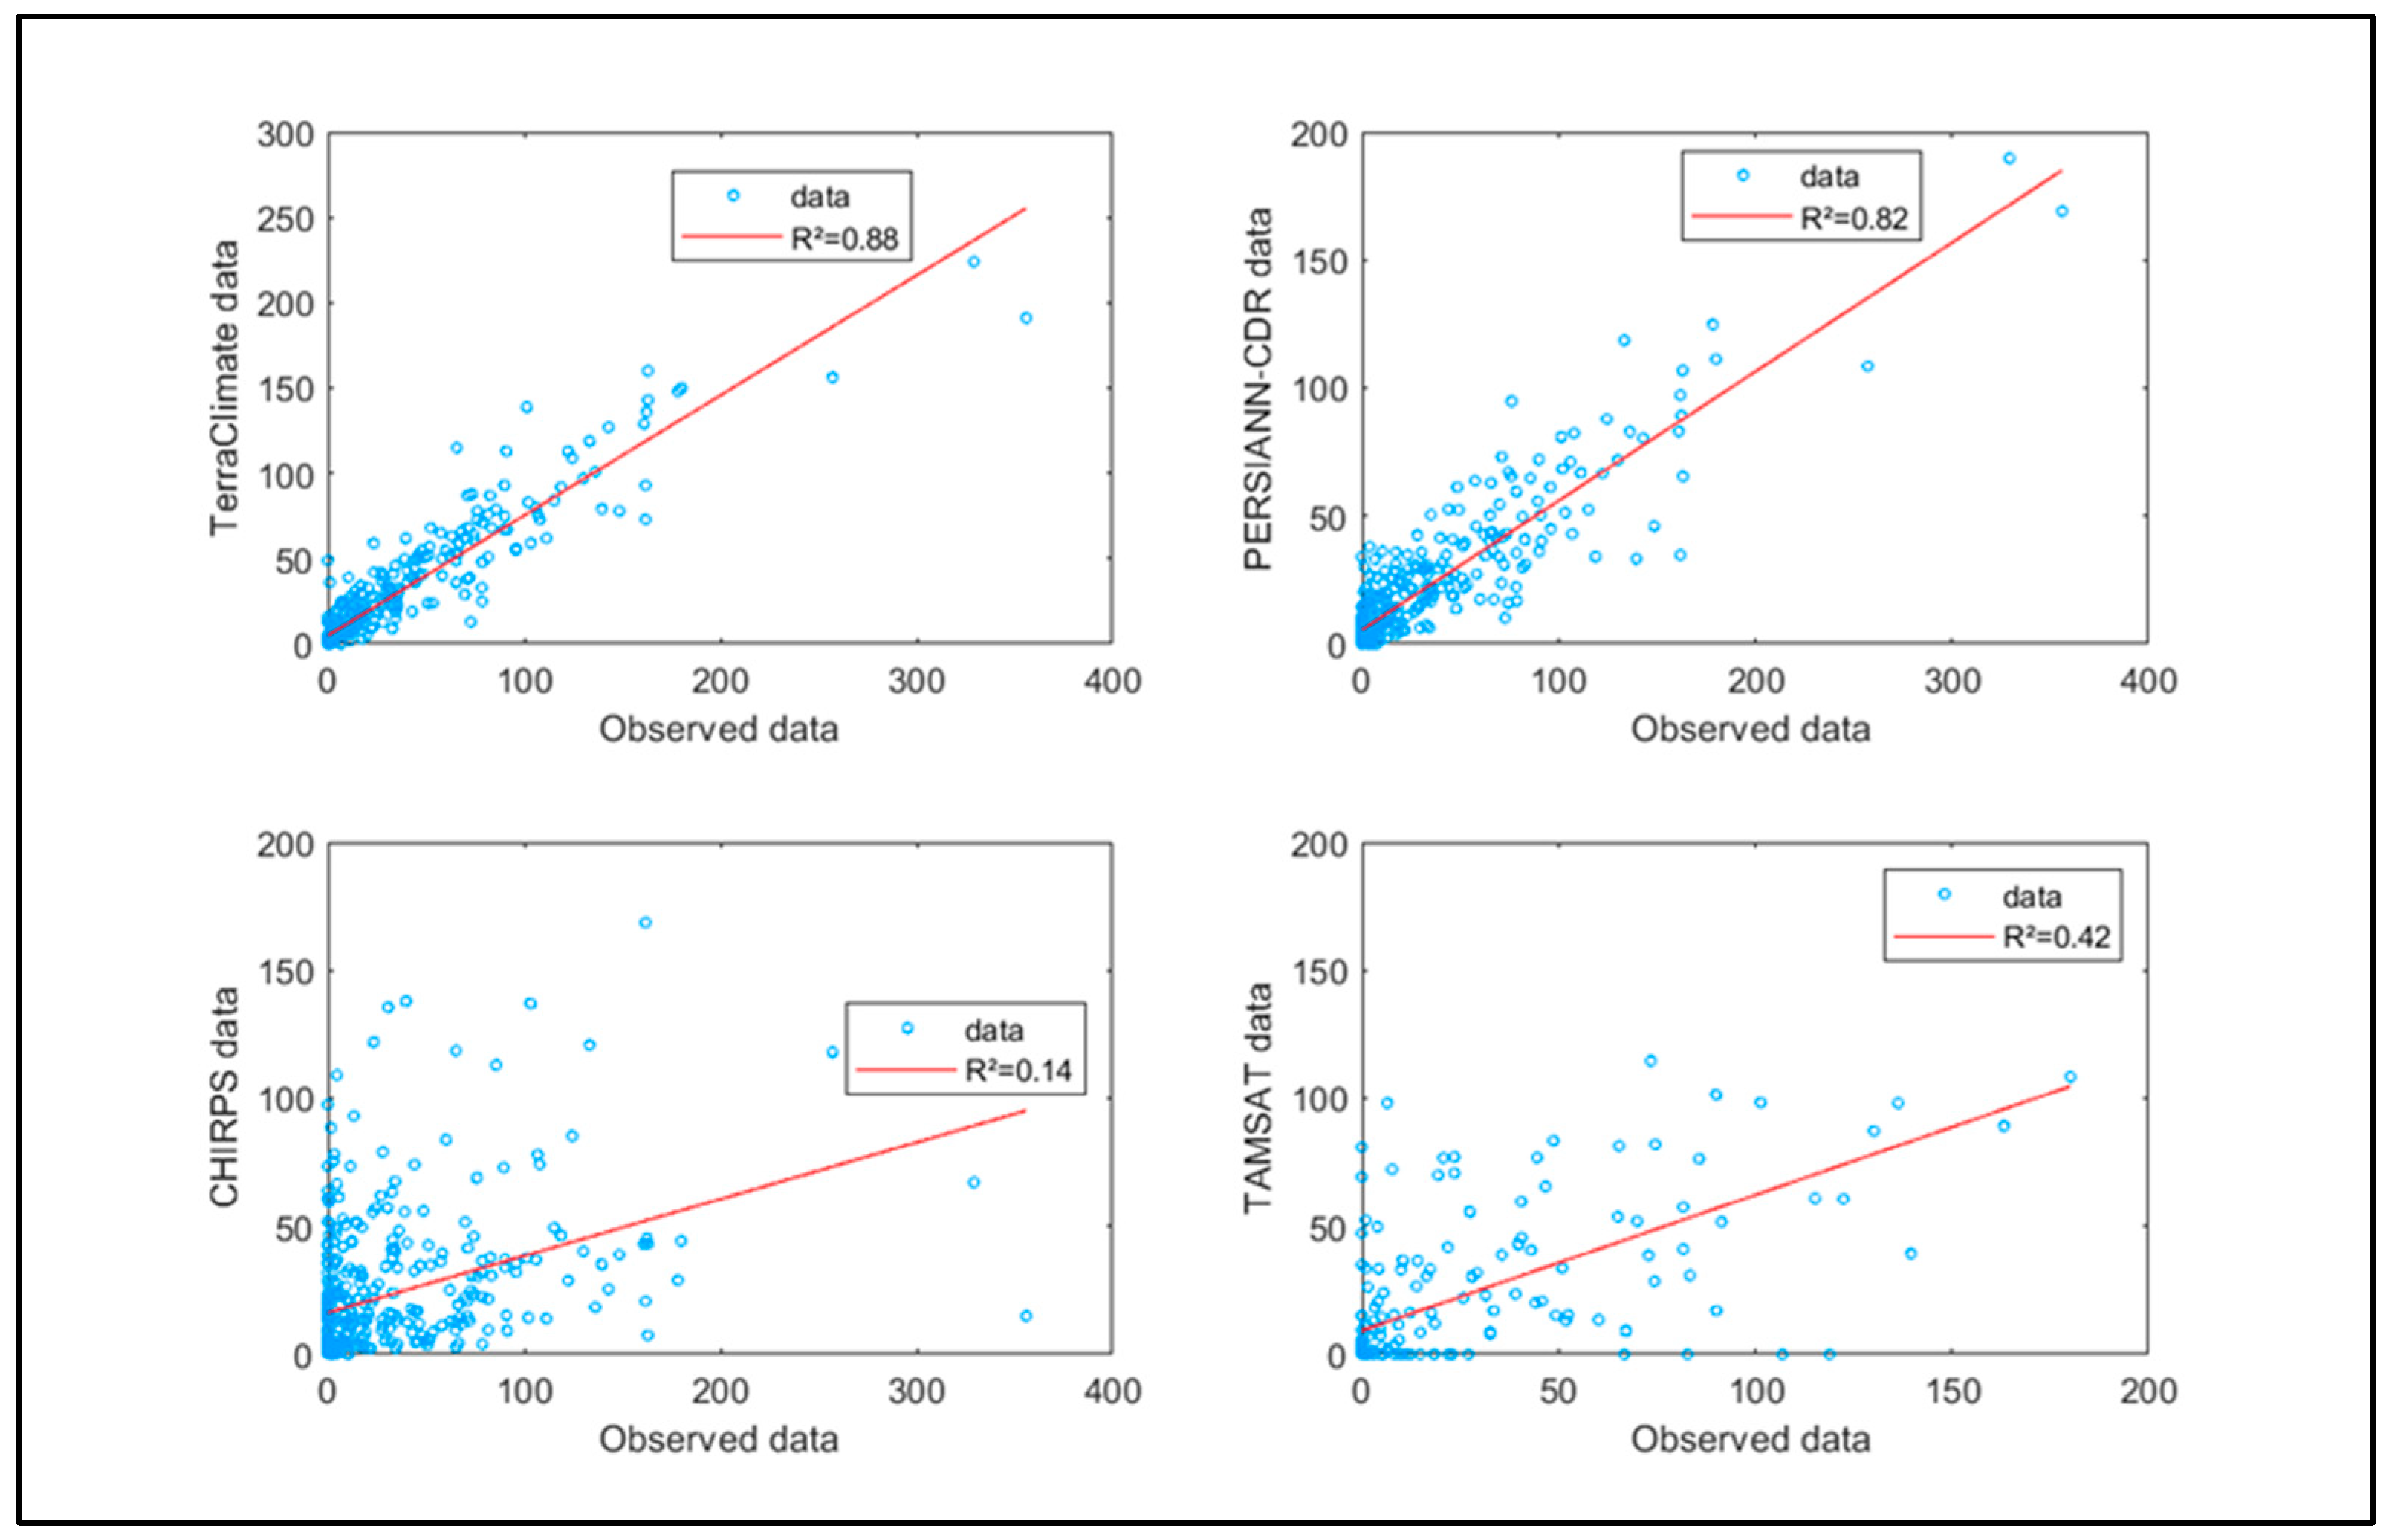
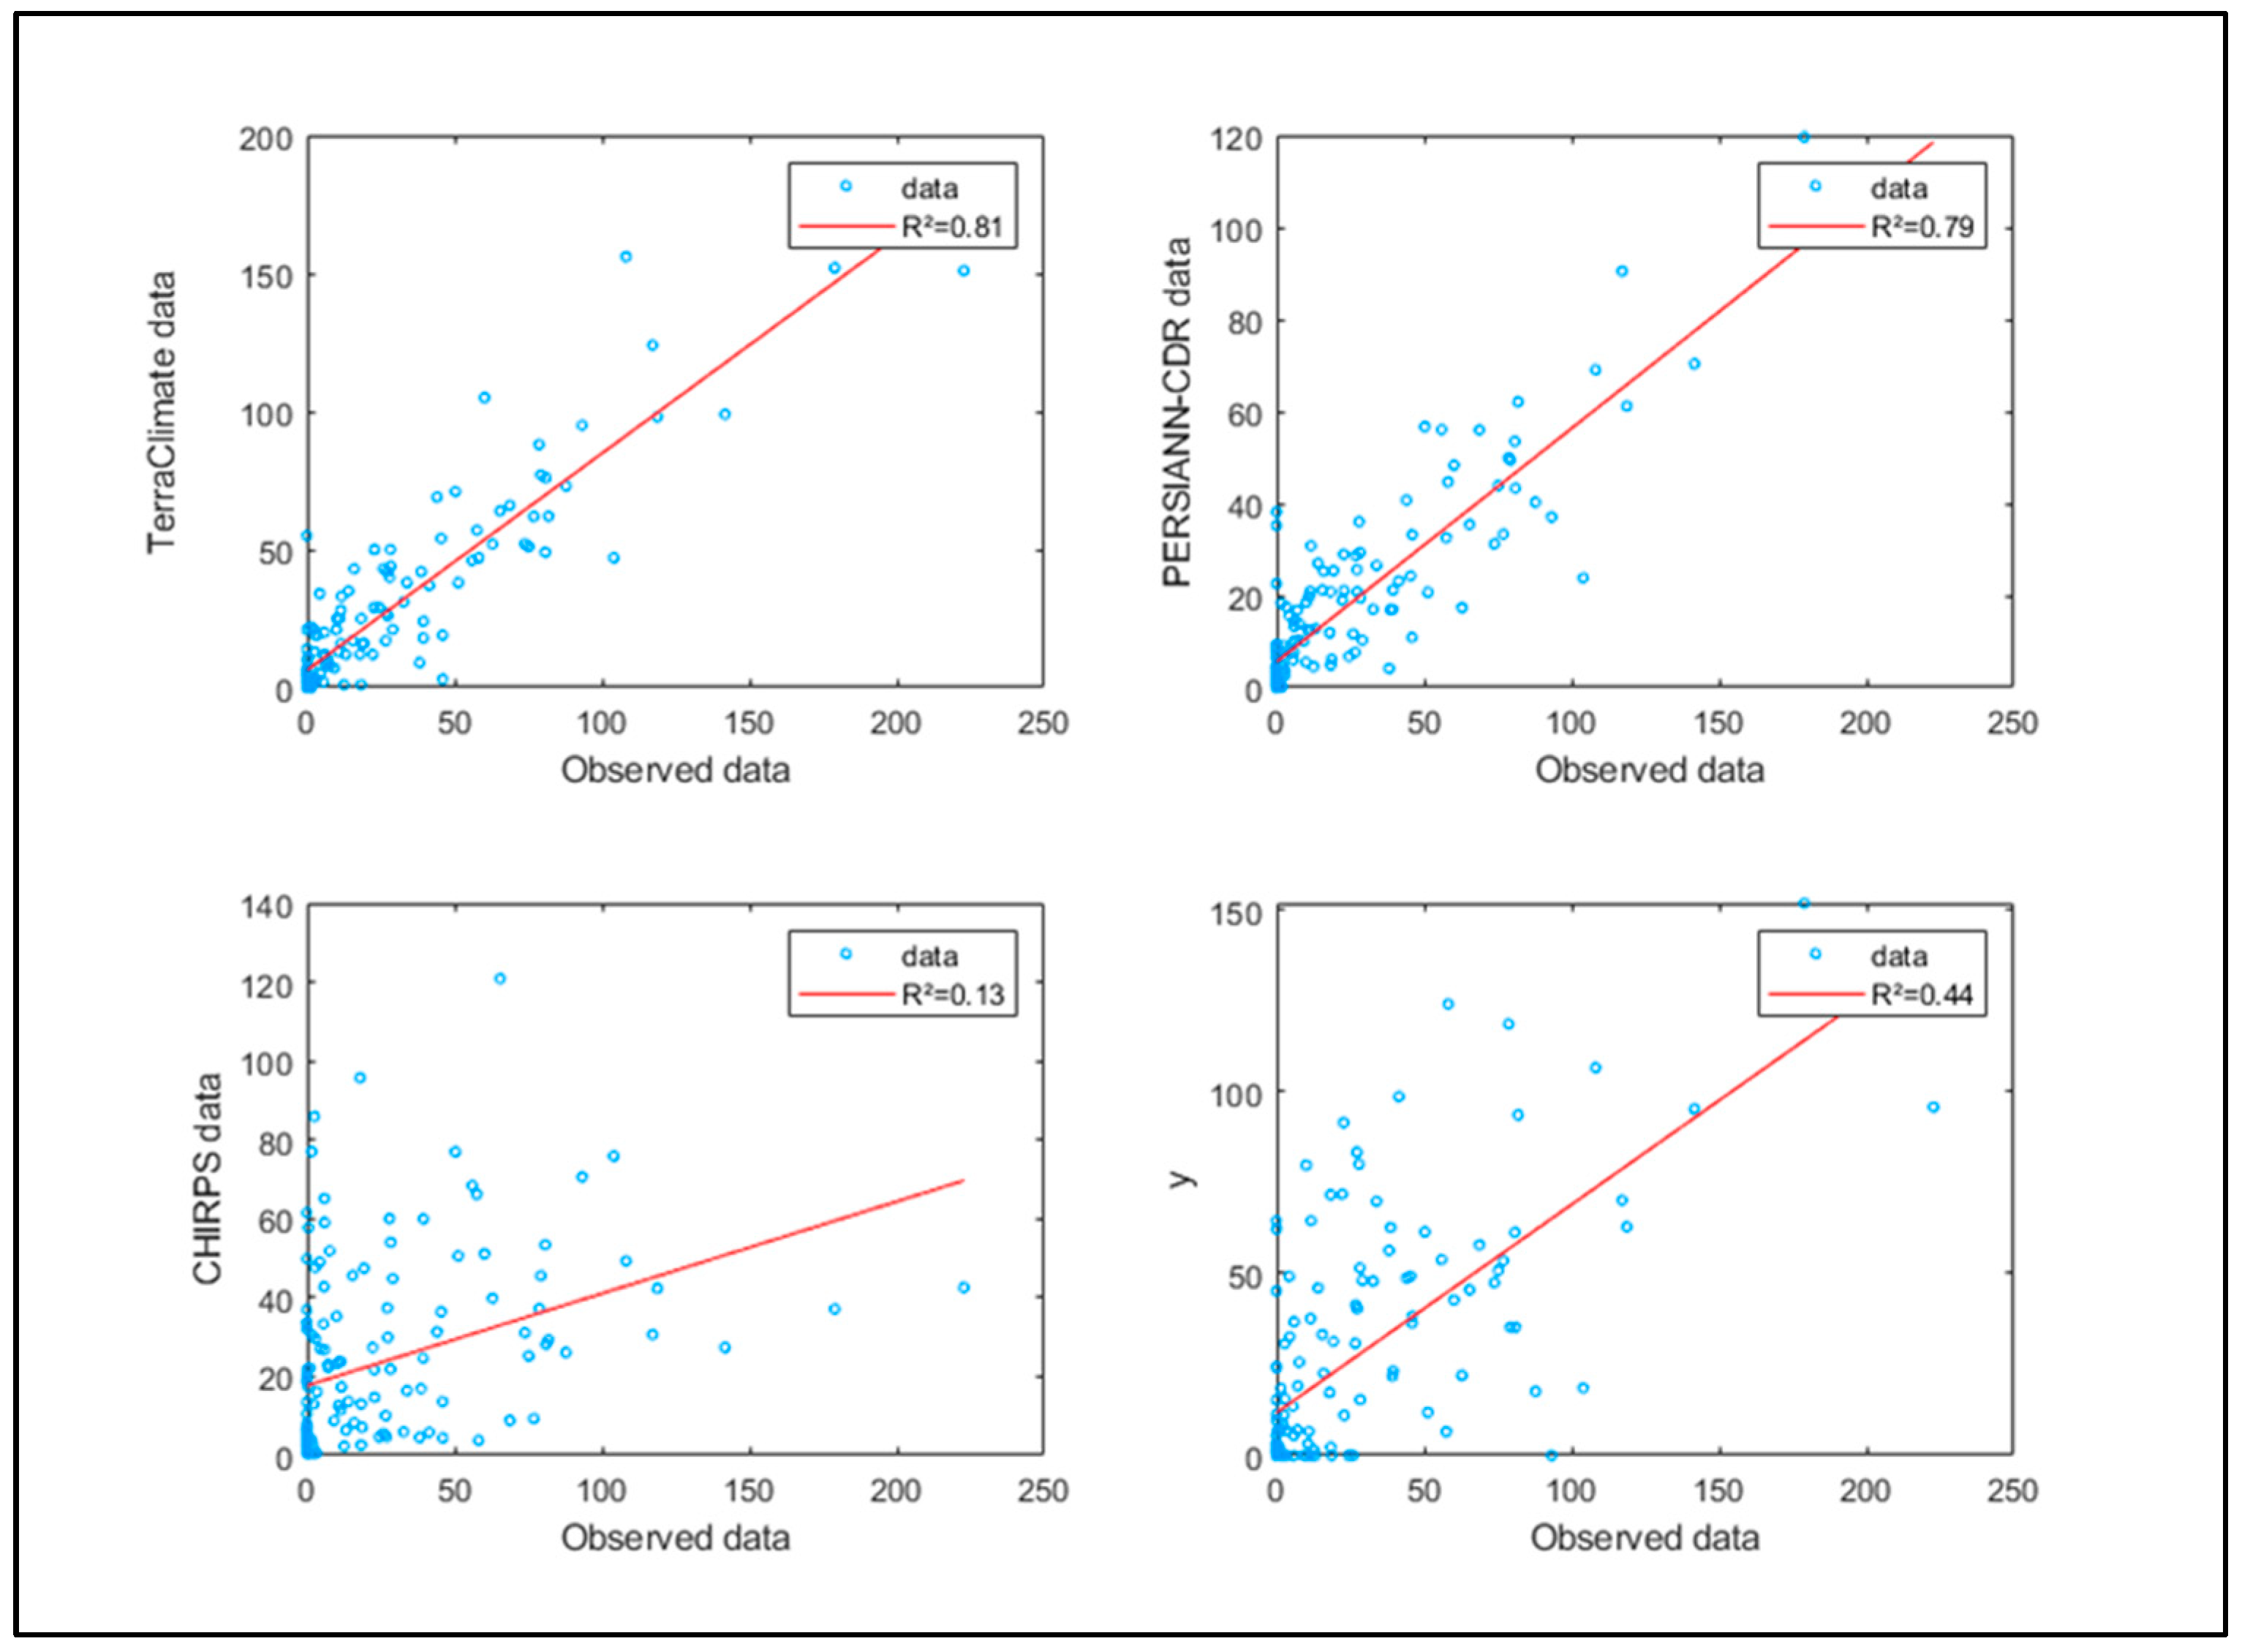
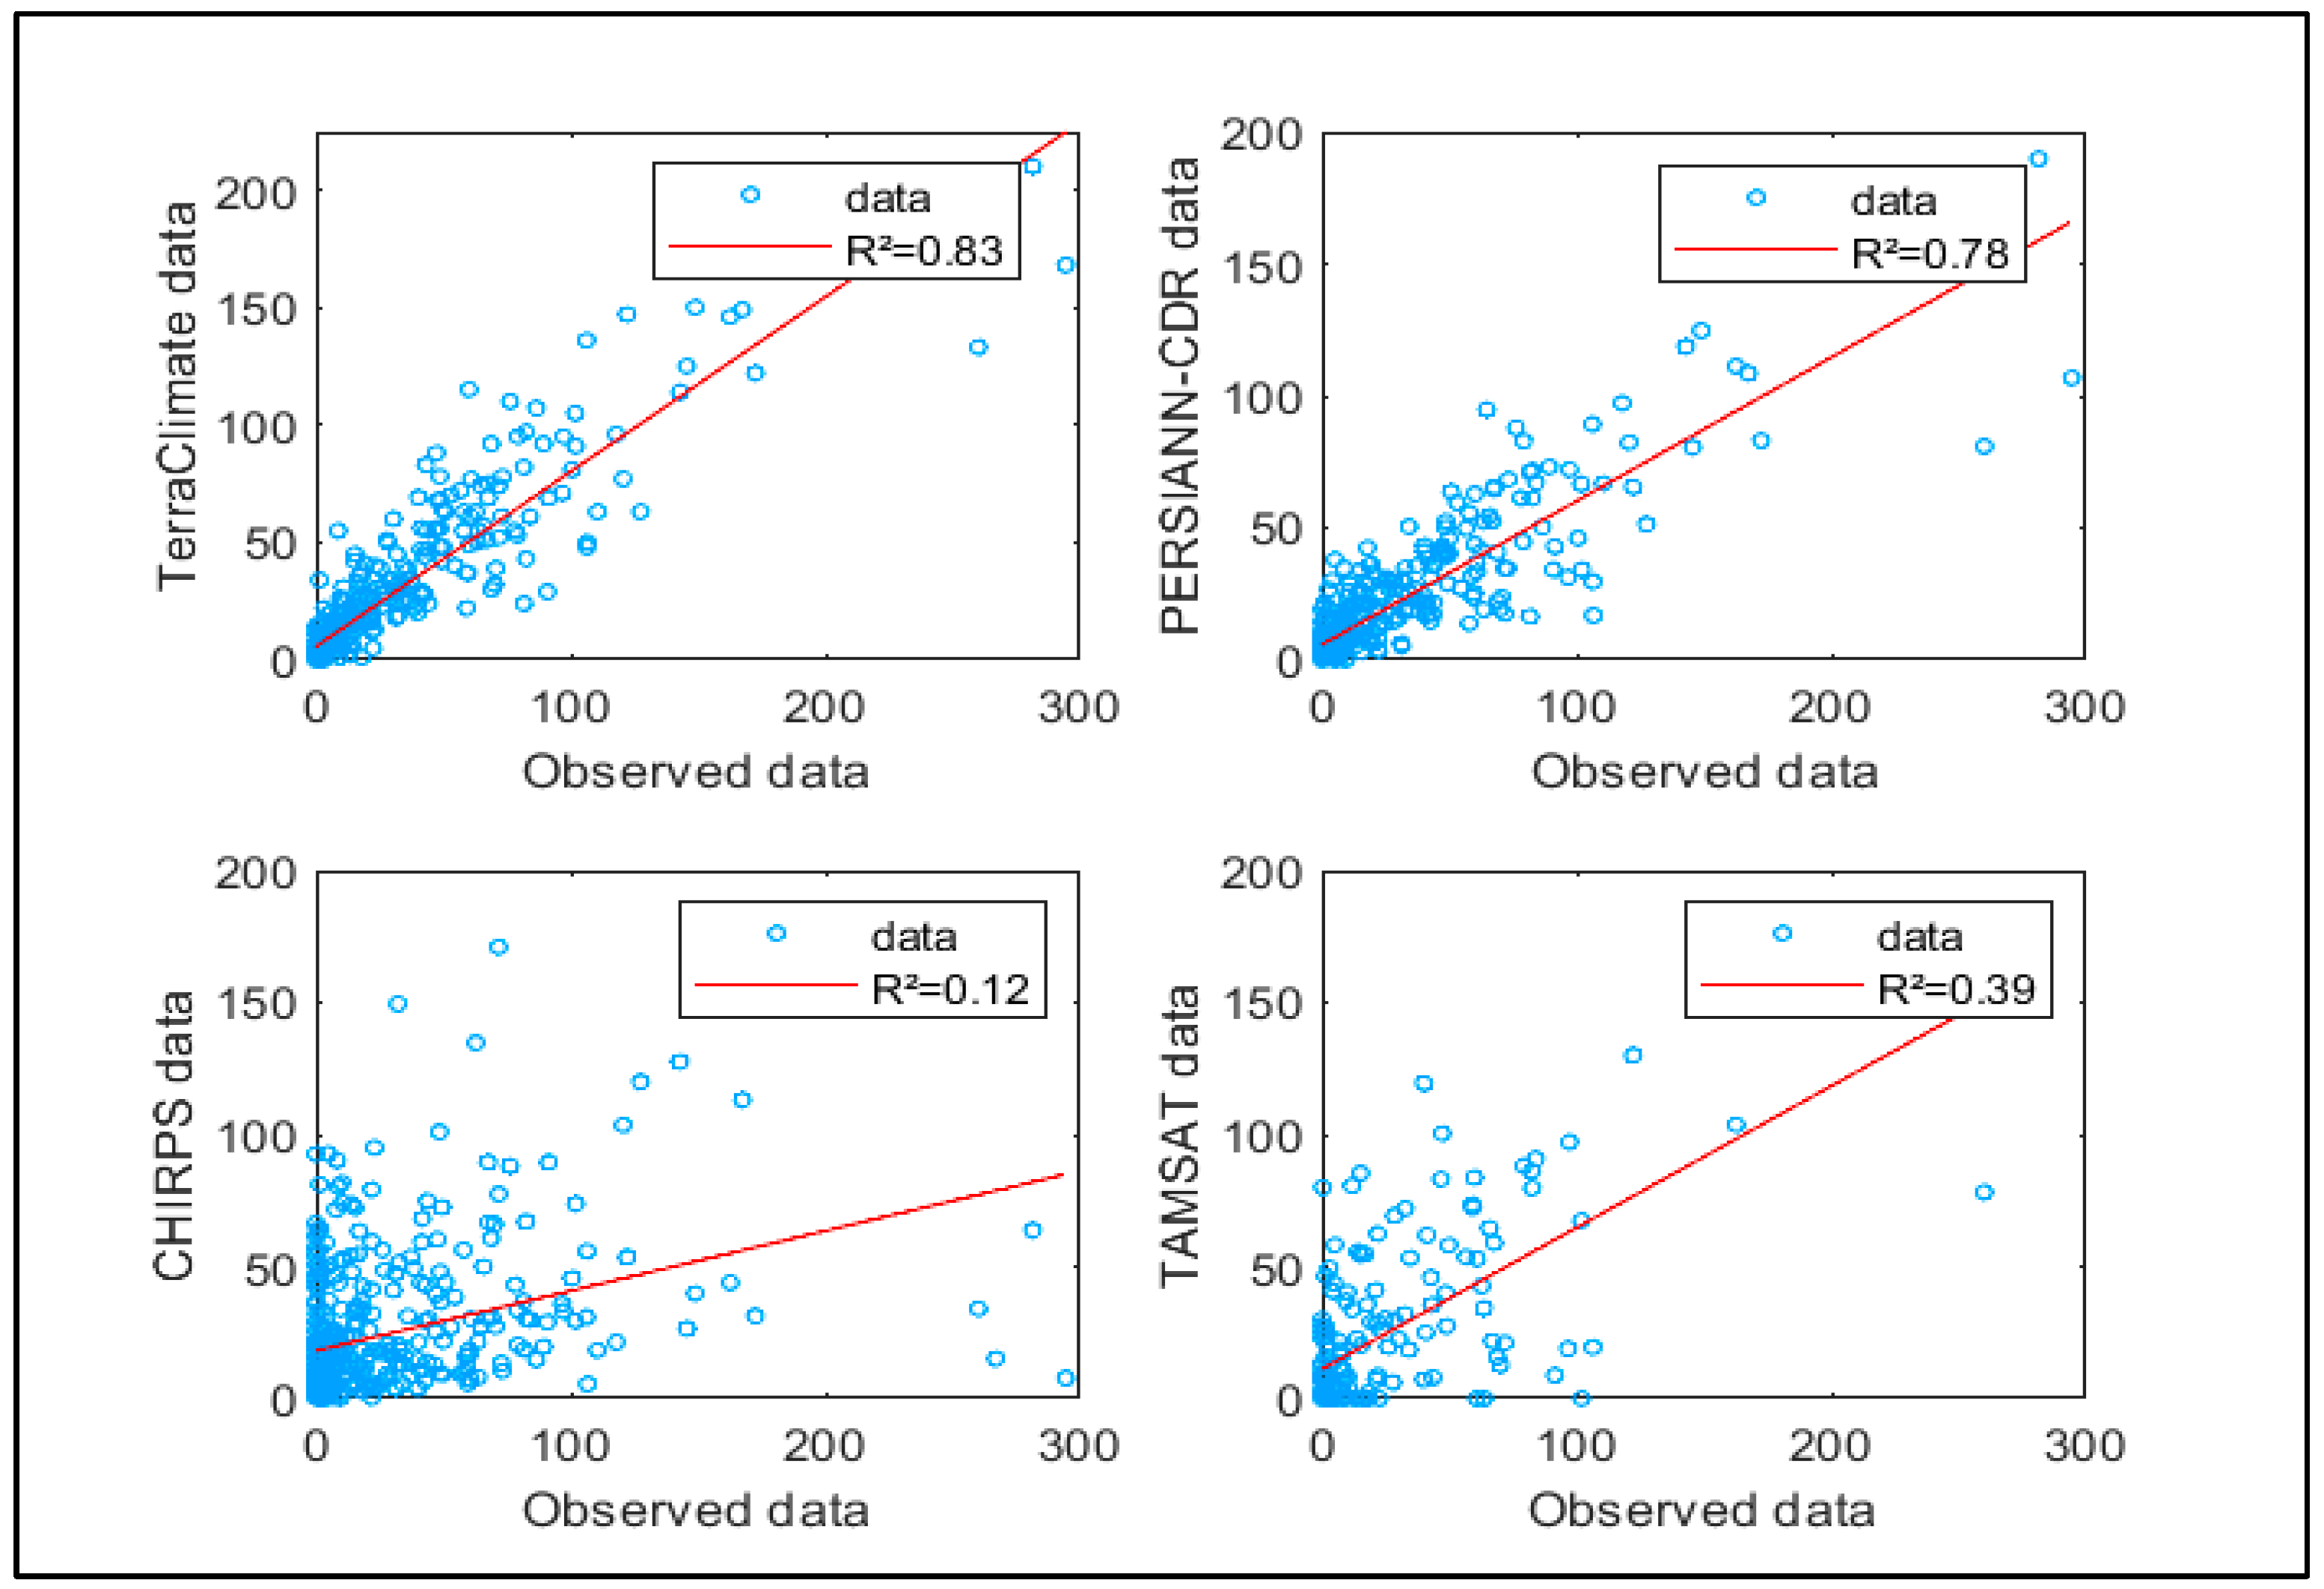
3.1. Evaluation of Satellites Precipitation Products through Comparison with Rain Gouges

Figure 5, Figure 6, Figure 7 and Figure 8 present the scatterplot between the satellite rainfall products and the rain gauges at Talmest, Adamna, Azrou and Igrounzar Stations, respectively. Table 4 presents the different statistical parameters related to this evaluation. The linear relationship between the rain gauges and the data from the four products is good for the TerraClimate data, with correlation coefficients ranging from 0.83 to 0.88 and an overall average of 0.85, and secondly for the Persainn-CDR data, with an average correlation coefficient of 0.8. CHIRPS, on the other hand, has a poor correlation with ground measurements in our study area. Regarding the RMSE, which measures sensitivity to accumulated rainfall, we discovered that it is less than 18 mm for TerraClimate data but 40 mm for CHIRPS data. The arithmetic averages of the biases of the four stations for each product, TerraCllimate, PERSIANN CDR, TAMSAT and CHIRPS, are respectively 1, 1.27, 0.92 and 1.065, which confirms that the TerraClimate data remains the most representative of the rainfall of the study area compared to the other products which are either underestimating the rain; PERSIANN CDR and CHIRPS (27% and 6.5%) or overestimating the case of TAMSAT (8%). According to POD, more than 78% of the rain gauge records have been adequately detected by the four satellite products, with perfect detection of rainfall events by CHIRPS and PERSIANN. According to FAR, the latter two gave false alarms for 29 to 34% of measurements.
The TerraClimate product, however, has the lowest average magnitude of error between satellite data and observed precipitation data. In addition, the ratio of satellite events that are correctly detected to the total number of observed or detected events (CSI) remains comparable for all four satellite products, with a slight improvement for PERSIANN CDR. Table 4 displays the results for the various statistical parameters listed earlier.

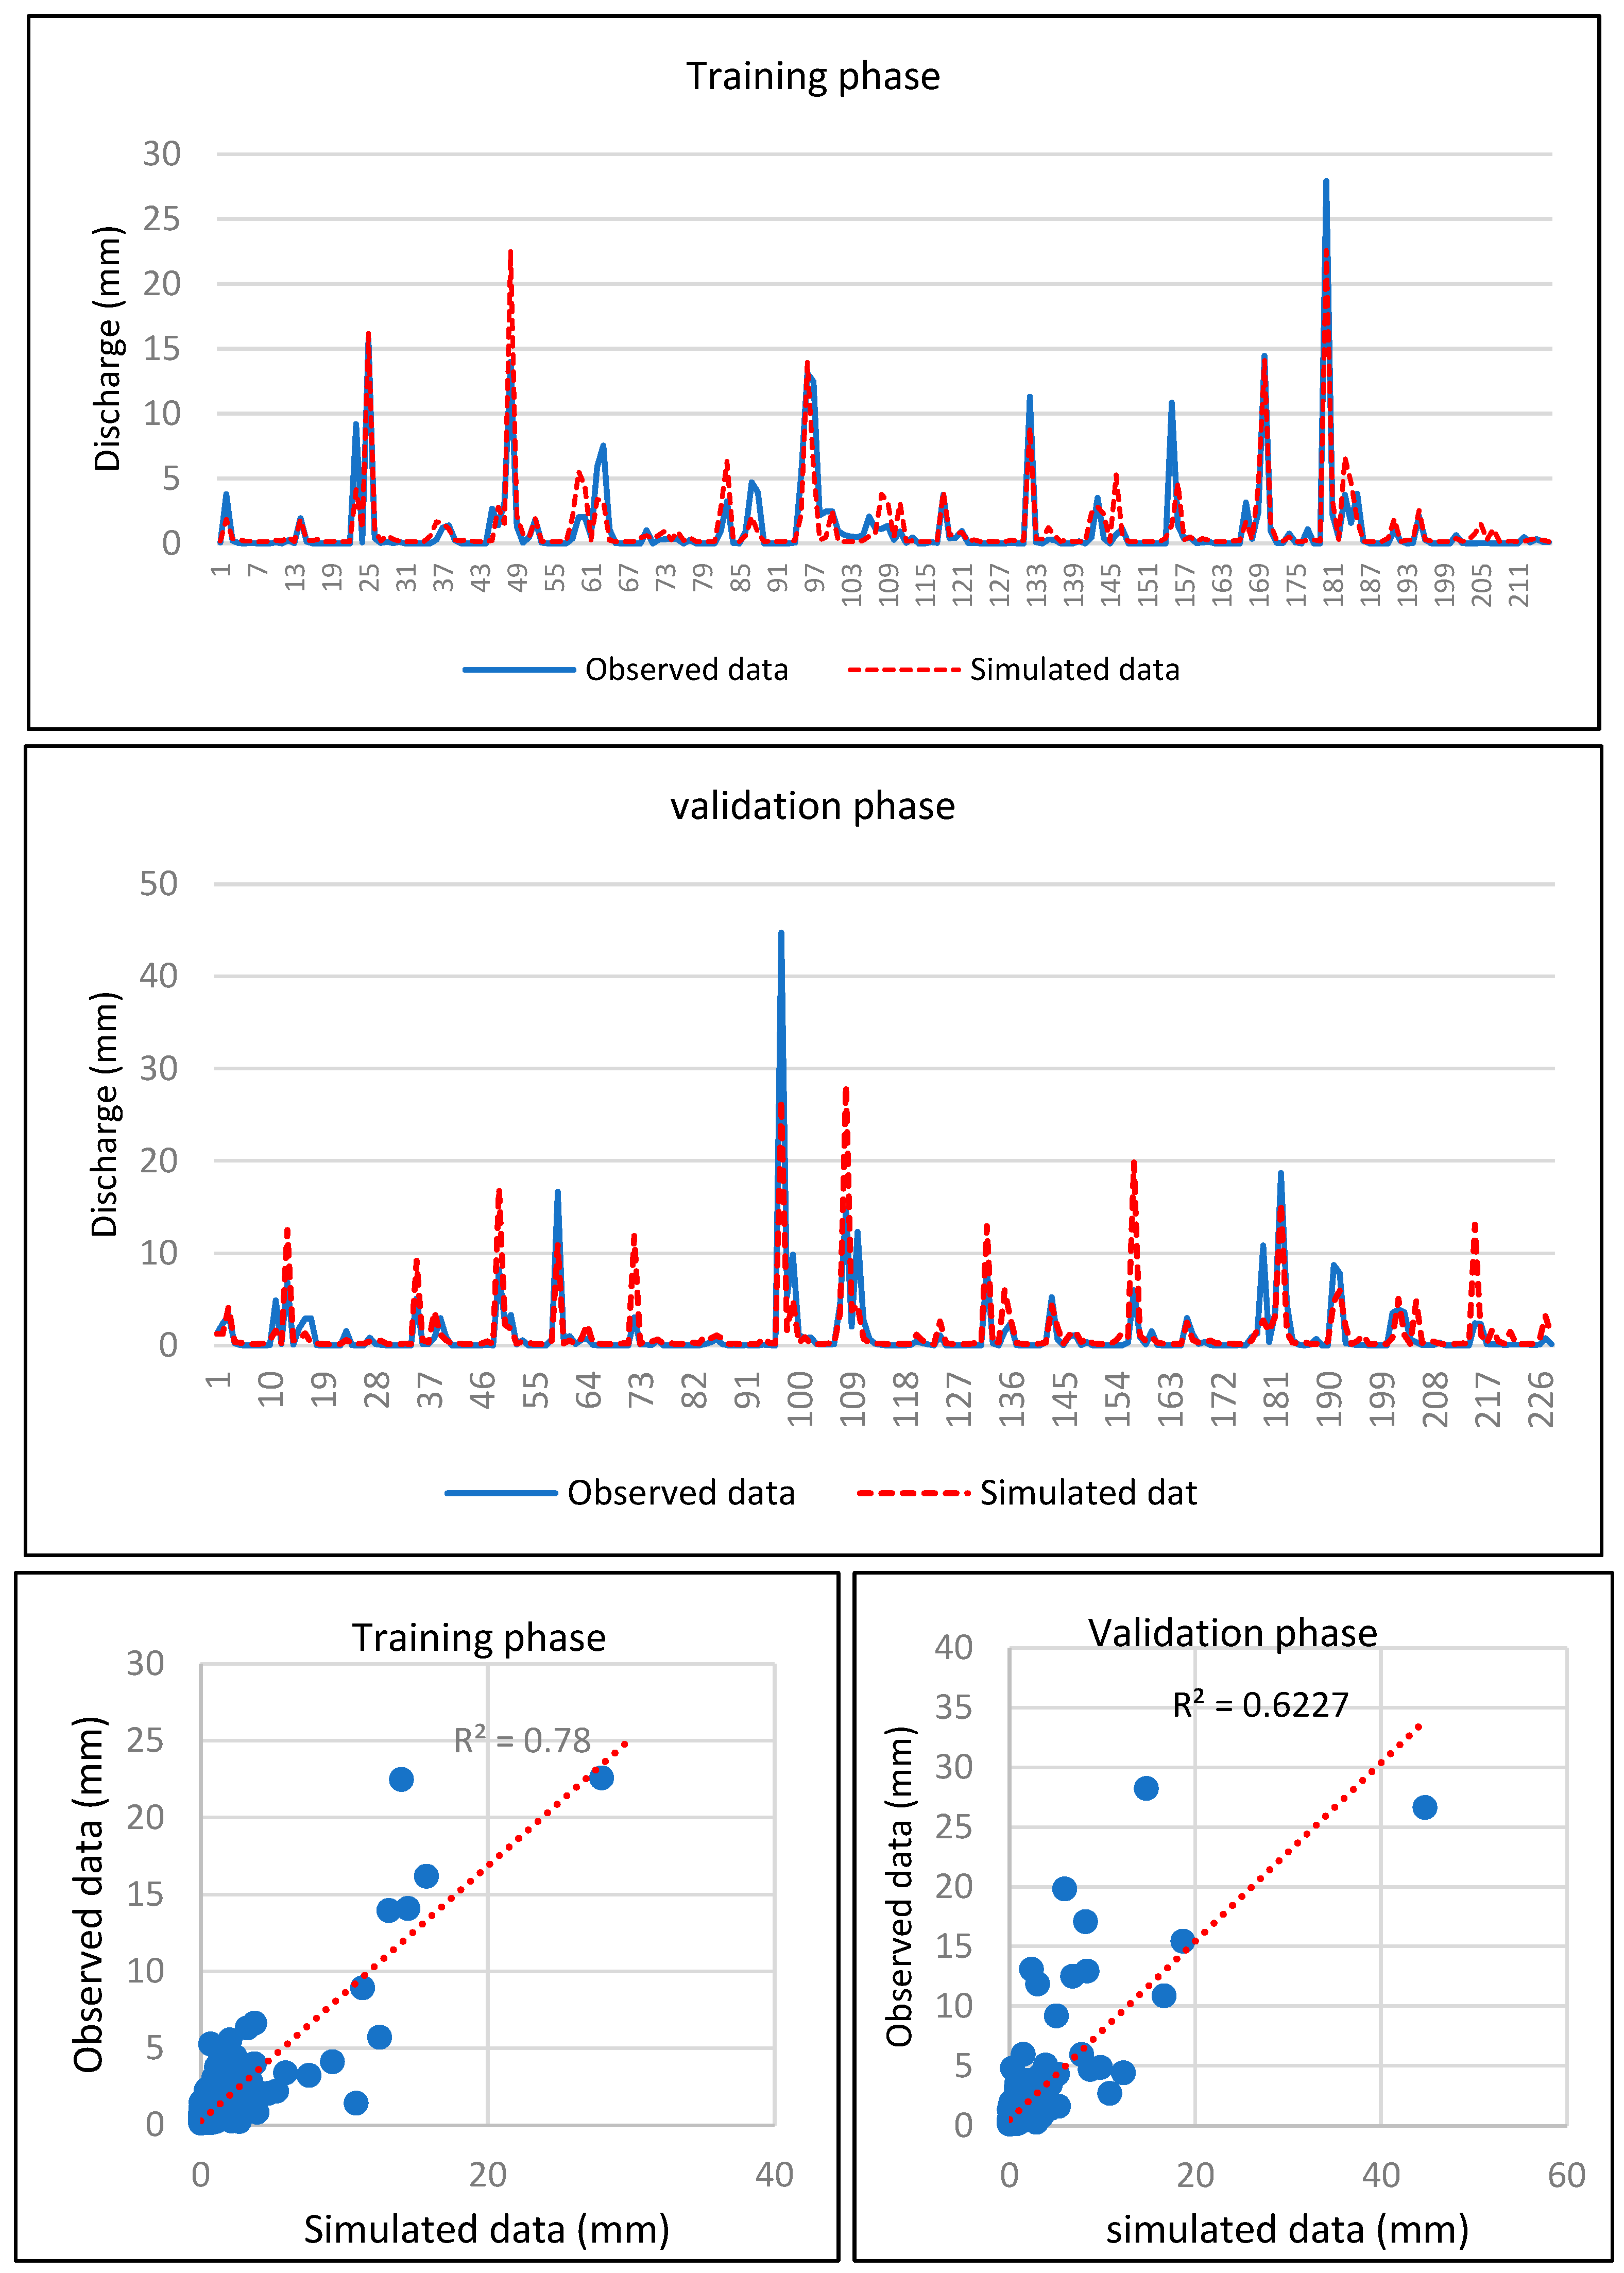
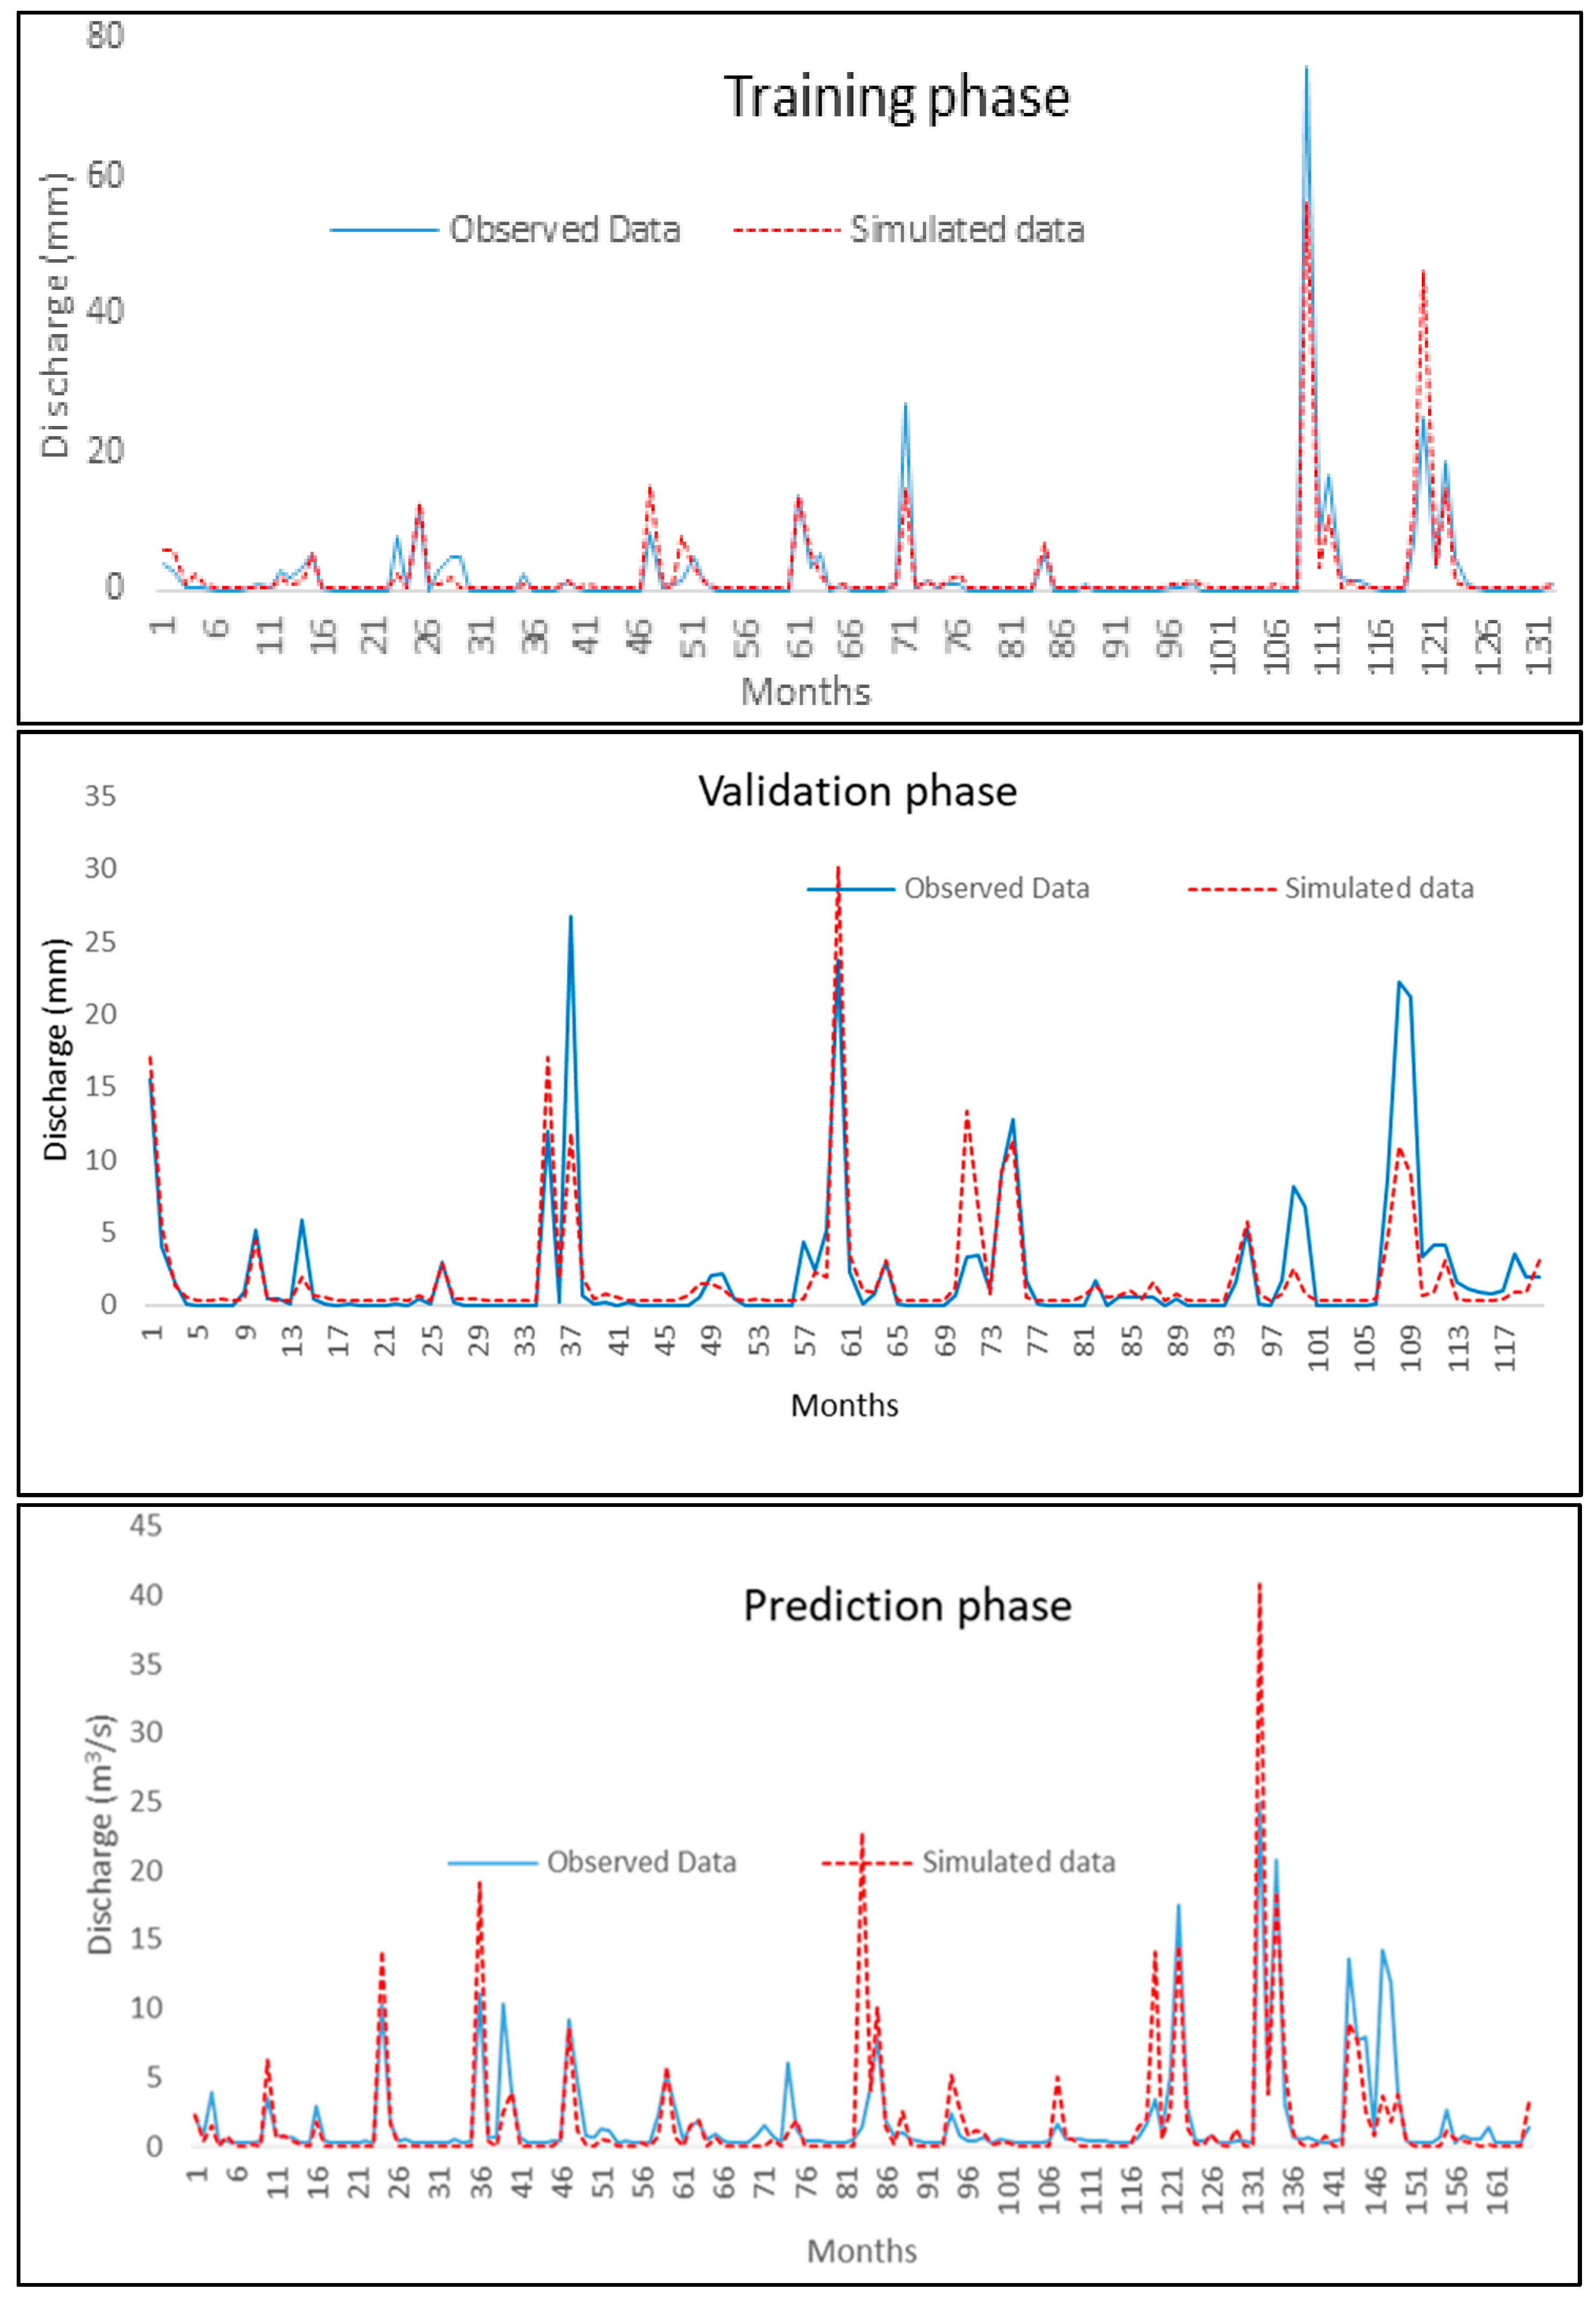
3.2. Validation of the TerraClimate Precipitation Products by Comparison between the Observed and Simulated Flow of a Hydrological Model

Based on the above results, it can be concluded that the TerraClimate precipitation data appears to be the most representative of the monthly rainfall of the study area among the other satellite products. To confirm this observation, we will validate the TerraClimate product by hydrological modelling (rainfall-runoff), taking the Ksob catchment area, which is part of the study area.
Let’s recall that in this study, we used an artificial neural network, and we considered for the first time two inputs to the model: monthly precipitation and evapotranspiration. The following figures (Figure 9) show the linear regression line between observed and simulated flow for the training and validation phases.
To improve the results, we have added soil moisture from the TerraClimate dataset as supplemental input to the model in addition to the monthly precipitation and evapotranspiration, as shown in Figure 10. For the simulation of the flow by using this approach, the temporal evolution of three input data acquired from TerraClimate data sets is presented in Figure 11. Finally, the simulated discharge by ANN is presented in Figure 12.
For calibration and validation of hydrological models, there are several data sampling methods in the literature: There is split sampling or split-sample test (SST) where the length of the data sets is divided in 2: 50% of the sample is used for calibration and 50% for validation, the second technique is differential split-sample (DSST) which consists in separating the available period in 2 independent sub-periods and presenting different climatic characteristics from one period to the other (wet years and dry years), to calibrate the model on the 1st period and to validate it on the 2nd one and conversely. Finally, a third method used in our case is stratified sampling. This method consists of splitting the time series into even years (Running1) and odd years (Running2), which allows the possible existence of a trend in the data to be considered in the sampling.
The simulations were performed between January 1978 and December 2016 (Figure 13). The DSST has been used to calibrate (the even years) and validate (the odd years) the period from January 1978 to December 1998, with the remaining data being used for prediction from January 1999 to December 2016.
The results of the three phases are satisfactory, with a Nash of over 92%, and the correlation coefficient for training, validation and prediction are 0.83, 0.69 and 0.62, respectively. The values of the model performance criteria for training, validation and prediction are presented in the table (Table 5).
The ANN is a black box model that does not allow for an understanding of the physics of the process. However, it is very practical and can provide solutions simply and cost-effectively. For example, if the ANN model developed in this study could be applied to predict runoff in another region or the same watersheds subjected to climate and/or land use changes, the network would need to be restructured, recalibrated, and tested again. While this may seem like a drawback of the ANN, it is not a significant disadvantage. Restructuring, retraining, and retesting can be done quickly, provided the available data. We find that even for physics-based models, recalibration and revalidation procedures must be performed, as in the case of the ANN, when applied to different regions and climates. Calibration and validation of physics-based models, compared to ANN models, would be timely and costly.
The study shows that incorporating soil moisture in the ANN model enhances predictions. This finding can be helpful to researchers in other regions who are developing neural network models. With satellite soil moisture data readily available on a global scale and with daily temporal and in situ networks, it is feasible to integrate soil moisture data into rainfall-runoff modeling using neural network models. This highlights the wider applicability and potential impact of this study.

4. Conclusions

In this study, satellite rainfall products represented by TerraClimate, Tamsat, CHIRPS and Persiann CDR were evaluated for the quality of their monthly time-step rainfall estimates based on data from rainfall stations located in the semi-arid Atlantic coastal zone of Essaouira, Morocco, and the best product was validated by hydrological modelling using neural networks.
By adopting both quantitative and qualitative comparison approaches, the results showed that the TerraClimate data performs better than the other satellite products tested in the study area and on the monthly time scale. A validation of this product was done by rainfall-flow modeling using Multi Perceptron neural networks. This model was chosen because it does not require detailed knowledge of catchment characteristics; it simply establishes a relationship between the input (rainfall) and output (runoff) based on learning through training the neural network. The modeling results gave a Nash coefficient of 97% in the training phase and 92% for the validation and prediction phases. Hydraulic Basin Agency of Tensift is currently identifying potential dam sites in the region and will be needed to assess the surface water input at these locations. The results acquired are of considerable value to the regional water resources manager.
This study improves our understanding of the accuracy of four satellite products (TerraClimate, Persiann CDR, Tamsat and CHIRPS). In summary, the results allow us to distinguish between these products regarding the applications required for regions with little or no rainfall coverage. However, errors, uncertainties, potential and limitations must be considered. Despite the differences between satellite and ground-based rainfall data, this work emphasizes the importance of using remotely sensed data. Also, this study employed soil moisture and rainfall data from the TerraClimate dataset in Essaouira coastal Atlantic area, which is subject to the ocean Atlantic impact climate. Hence, the conclusions drawn in this study should be considered within this context. For different regions under different climate conditions, the TerraClimat rainfall product and ANN model need to be recalibrated and validated. The assessment of the capability of soil moisture data to give helpful information to predict runoff at different scales will also be analyzed to determine up to which spatial scale point soil moisture information can be employed.

Author Contributions

Conceptualization, S.R., J.E.A. and E.H.E.M.; methodology, S.R., J.E.A., E.H.E.M. and S.E.-R.; software, S.R. and M.J.; validation, S.R., J.E.A., E.H.E.M., M.J. and S.E.-R.; formal analysis, S.R., J.E.A., E.H.E.M. and S.E.-R.; investigation, S.R., J.E.A., E.H.E.M. and S.E.-R.; data curation, S.R. and M.J.; writing—original draft preparation S.R.; writing—review and editing, S.R., J.E.A., E.H.E.M. and S.E.-R.; visualization, J.E.A. and E.H.E.M.; supervision, J.E.A. and E.H.E.M.; project administration, J.E.A. and E.H.E.M. All authors have read and agreed to the published version of the manuscript.

Funding

This research received no external funding.

Data Availability Statement

The data presented in this study are available on request from the first author.

Acknowledgments

The authors thank ABHT (‘Hydraulic Basin Agency of Tensift’, Marrakech, Morocco) for its technical help in collecting field data.

Conflicts of Interest

The authors declare no conflict of interest, and the funders had no role in the study’s design; in the collection, analyses, or interpretation of data; in the writing of the manuscript; or in the decision to publish the results.

References

  1. Baratta, D.; Cicioni, G.; Masulli, F.; Studer, L. Application of an ensemble technique based on singular spectrum analysis to daily rainfall forecasting. Neural Netw. 2003, 16, 375–387. [Google Scholar] [CrossRef] [PubMed]
  2. Abrahart, R.J. Neural network rainfall–runoff forecasting based on continuous resampling. J. Hydroinf. 2003, 5, 51–61. [Google Scholar] [CrossRef]
  3. Afshin, S.; Fahmi, H.; Alizadeh, A.; Sedghi, H.; Kaveh, F. Long term rainfall forecasting by integrated artificial neural network-fuzzy logic-wavelet modeling Karoon basin. Sci. Res. Essays 2011, 6, 1200–1208. [Google Scholar]
  4. Aksoy, H.; Dahamsheh, A. Artificial neural network models for forecasting monthly precipitation in Jordan. Stoch. Environ. Res. Risk Assess. 2009, 23, 917–931. [Google Scholar] [CrossRef]
  5. Altunkaynak, A. Forecasting surface water level fluctuations of lake van by artificial neural networks. Water Resour. Manage. 2007, 21, 399–408. [Google Scholar] [CrossRef]
  6. Asati, S.R.; Rathore, S.S. Comparative study of stream flow prediction models. Int. J. Life Sci. Biotecnol. Pharm. Res. 2012, 1, 139–151. [Google Scholar]
  7. Bhadra, A.; Bandyopadhyay, A.; Singh, R.; Raghuwanshi, N.S. Rainfall–runoff modeling: Comparison of two approaches with different data requirements. Water Resour. Manage. 2010, 24, 37–62. [Google Scholar] [CrossRef]
  8. Huffman, G.J.; Adler, R.F.; Morrissey, M.M.; Bolvin, D.T.; Curtis, S.; Joyce, R.; McGavock, B.; Susskind, J. Global precipitation at one-degree daily resolution from multisatellite observations. J. Hydrometeorol. 2001, 2, 36–50. [Google Scholar] [CrossRef]
  9. Hsu, K.; Gao, X.; Sorooshian, S.; Gupta, H.V. Precipitation estimation from remotely sensed information using artificial neural networks. J. Appl. Meteorol. 1997, 36, 1176–1190. [Google Scholar] [CrossRef]
  10. Abatzoglou, J.T.; Dobrowski, S.Z.; Parks, S.A.; Hegewisch, K.C. TerraClimate, a high-resolution global dataset of monthly climate and climatic water balance from 1958–2015. Sci. Data 2018, 5, 170191. [Google Scholar] [CrossRef]
  11. Liu, C.-Y.; Aryastana, P.; Liu, G.-R.; Huang, W.-R. Assessment of satellite precipitation product estimates over Bali Island. Atmos. Res. 2020, 244, 105032. [Google Scholar] [CrossRef]
  12. Qin, Y.; Chen, Z.; Shen, Y.; Zhang, S.; Shi, R. Evaluation of Satellite Rainfall Estimates over the Chinese Mainland. Remote Sens. 2014, 6, 11649–11672. [Google Scholar] [CrossRef]
  13. Amorim, J.D.S.; Viola, M.R.; Junqueira, R.; Oliveira, V.A.D.; Mello, C.R.D. Evaluation of Satellite Precipitation Products for Hydrological Modeling in the Brazilian Cerrado Biome. Water 2020, 12, 2571. [Google Scholar] [CrossRef]
  14. Abdelmoneim, H.; Soliman, M.R.; Moghazy, H.M. Evaluation of TRMM 3B42V7 and CHIRPS Satellite Precipitation Products as an Input for Hydrological Model over Eastern Nile Basin. Earth Syst. Environ. 2020, 4, 685–698. [Google Scholar] [CrossRef]
  15. Camberlin, P.; Barraud, G.; Bigot, S.; Dewitte, O.; Makanzu Imwangana, F.; Maki Mateso, J.C.; Samba, G. Evaluation of remotely sensed rainfall products over Central Africa. Q. J. R. Meteorol. Soc. 2019, 145, 2115–2138. [Google Scholar] [CrossRef]
  16. Kimani, M.W.; Hoedjes, J.C.B.; Su, Z. An Assessment of Satellite-Derived Rainfall Products Relative to Ground Observations over East Africa. Remote. Sens. 2017, 9, 430. [Google Scholar] [CrossRef]
  17. Dinku, T.; Funk, C.; Peterson, P.; Maidment, R.; Tadesse, T.; Gadain, H.; Ceccato, P. Validation of the CHIRPS satellite rainfall estimates over eastern Africa. Q. J. R. Meteorol. Soc. 2018, 144, 292–312. [Google Scholar] [CrossRef]
  18. Stampoulis, D.; Anagnostou, E.N. Evaluation of global satellite rainfall products over continental Europe. J. Hydrometeorol. 2012, 13, 588–603. [Google Scholar] [CrossRef]
  19. Bouizrou, I.; Bouadila, A.; Aqnouy, M.; Gourfi, A. Assessment of remotely sensed precipitation products for climatic and hydrological studies in arid to semi-arid data-scarce region, central-western Morocco. Remote Sens. Appl. Soc. Environ. 2023, 30, 100976. [Google Scholar] [CrossRef]
  20. Habitou, N.; Morabbi, A.; Ouazar, D.; Bouziane, A.; Hasnaoui, M.D.; Sabri, H. CHIRPS precipitation open data for drought monitoring: Application to the Tensift basin, Morocco. J. Appl. Remote Sens. 2020, 14, 034526. [Google Scholar]
  21. Tramblay, Y.; Thiemig, V.; Dezetter, A.; Hanich, L. Evaluation of satellite-based rainfall products for hydrological modelling in Morocco. Hydrol. Sci. J. 2016, 61, 2509–2519. [Google Scholar] [CrossRef]
  22. Salih, W.; Chehbouni, A.; Epule, T.E. Evaluation of the Performance of Multi-Source Satellite Products in Simulating Observed Precipitation over the Tensift Basin in Morocco. Remote Sens. 2022, 14, 1171. [Google Scholar] [CrossRef]
  23. Ouatiki, H.; Boudhar, A.; Tramblay, Y.; Jarlan, L.; Benabdelouhab, T.; Hanich, L.; El Meslouhi, M.R.; Chehbouni, A. Evaluation of TRMM 3B42 V7 rainfall product over the Oum Er Rbia watershed in Morocco. Climate 2017, 5, 1. [Google Scholar] [CrossRef]
  24. Funk, C.C.; Peterson, P.J.; Landsfeld, M.F.; Pedreros, D.H.; Verdin, J.P.; Rowland, J.D.; Romero, B.E.; Husak, G.J.; Michaelsen, J.C.; Verdin, A.P. A quasi-global precipitation time series for drought monitoring. US Geol. Surv. Data Ser. 2014, 832, 1–12. [Google Scholar]
  25. Funk, C.; Peterson, P.; Landsfeld, M.; Pedreros, D.; Verdin, J.; Shukla, S.; Husak, G.; Rowland, J.; Harrison, L.; Hoell, A.; et al. The climate hazards infrared precipitation with stations—A new environmental record for monitoring extremes. Sci. Data 2015, 2, 1–21. [Google Scholar] [CrossRef]
  26. Hessels, T.M. Comparison and Validation of Several Open Access Remotely Sensed Rainfall Products for the Nile Basin; Delft University of Technology: Delft, The Netherlands, 2015; Available online: https://repository.tudelft.nl/islandora/object/uuid:3566f883-16fd-4465-be43-6b2037baa6ff (accessed on 30 March 2023).
  27. Nogueira, S.M.; Moreiro, M.A.; Volpato, M.M. Evaluating precipitation estimates from Eta, TRMM and CHIRPS data in the South-Southeast Region of Minas Gerais State—Brazil. Remote Sens. 2018, 10, 313. [Google Scholar] [CrossRef]
  28. Ayehu, G.T.; Tadesse, T.; Gessesse, B.; Dinku, T. Validation of new satellite rainfall products over the Upper Blue Nile Basin, Ethiopia. Atmos. Meas. Tech. 2018, 11, 1921–1936. [Google Scholar] [CrossRef]
  29. Mosaffa, H.; Sadeghi, M.; Hayatbini, N.; Afzali Gorooh, V.; Akbari Asanjan, A.; Nguyen, P.; Sorooshian, S. Spatiotemporal Variations of Precipitation over Iran Using the High-Resolution and Nearly Four Decades Satellite-Based PERSIANN-CDR Dataset. Remote Sens. 2020, 12, 1584. [Google Scholar] [CrossRef]
  30. Raman, H.; Chandramauli, V. Deriving a general operating policy for reservoirs using neural network. J. Water Resour. Plan Manag. ASCE 1996, 122, 342–347. [Google Scholar] [CrossRef]
  31. Cybenko, G. Approximation by superposition of sigmoidal functions. Math. Control. Signals Syst. 1989, 2, 303–314. [Google Scholar] [CrossRef]
  32. Cheleng, A.A. Rainfall–runoff modeling based on artificial neural networks (ANNs). Eur. J. Sci. Res. 2011, 65, 490–506. [Google Scholar]
  33. Nourani, V.; Komasi, M.; Mano, A. A multivariate ANN-wavelet approach for rainfall–runoff modeling. Water Resour. Manage. 2009, 23, 2877–2894. [Google Scholar] [CrossRef]
  34. Mohammadi, K.; Eslami, H.R.; Dayyani Dardashti, S. Comparison of regression, ARIMA and ANN models for reservoir in flow forecasting using Snow melt equivalent (a case study of Karaj). J. Agric. Sci. Technol. 2005, 7, 17–30. [Google Scholar]
  35. Can, İ.; Tosunoğlu, F.; Kahya, E. Daily stream flow modelling using autoregressive moving average and artificial neural networksmodels: Case study of Çoruh basin, Turkey. Water Environ. J. 2012, 26, 567–576. [Google Scholar] [CrossRef]
  36. Liu, F.; Zhou, J.Z.; Qiu, F.-P.; Yang, J.-J. Biased Wavelet Neural network and its application to stream flow forecast. In Advances in Neural Networks—ISNN 2006; Wang, J., Yi, Z., Zurada, J., Lu, B.-L., Yin, H., Eds.; Springer: Berlin/Heidelberg, Germany, 2006. [Google Scholar]
  37. Nagesh Kumar, D.; Srinivasa Raju, K.; Sathish, T. River flow forecasting using recurrent neural networks. Water Resour. Manage. 2004, 18, 143–161. [Google Scholar] [CrossRef]
  38. Singh, S.M.; Maiti, P.R.; Shaiwalini, S. Statistical modeling of climate parameters. Asian J. Curr. Eng. Maths 2012, 1, 29–33. [Google Scholar]
  39. Imani, M.; You, R.J.; Kuo, C.Y. Caspian Sea level prediction using satellite altimetry by artificial neural net works. Int. J. Environ. Sci. Technol. 2014, 11, 1035–1042. [Google Scholar] [CrossRef]
  40. Wang, J.; Sui, J.; Guo, L.; Karney, B.W.; Jüpner, R. Forecast of water level and ice jam thickness using the back propagation neural network and support vector machine methods. Int. J. Environ. Sci. Technol. 2010, 7, 215–224. [Google Scholar] [CrossRef]
  41. El-Shafie, A.; Noureldin, A.; Taha, M.; Hussain, A.; Mukhlisin, M. Dynamic versus static neural network model for rainfall forecasting at Klang River Basin, Malaysia. Hydrol. Earth Syst. Sci. 2012, 16, 1151–1169. [Google Scholar] [CrossRef]
  42. El-Shafie, A.H.; El-Shafie, A.; El Mazoghi, H.G.; Shehata, A.; Taha, M.R. Artificial neural network technique for rainfall forecasting applied to Alexandria, Egypt. Int. J. Phys. Sci. 2011, 6, 1306–1316. [Google Scholar]
  43. Gholizadeh, M.H.; Darand, M. Forecasting precipitation with artificial neural networks (case study: Tehran). J. Appl. Sci. 2009, 9, 1786–1790. [Google Scholar] [CrossRef]
  44. Mandal, T.; Jothiprakash, V. Short-term rainfall prediction using ANN and MT techniques. ISHJ. Hydraul. Eng. 2012, 18, 20–26. [Google Scholar] [CrossRef]
  45. Ramírez, M.C.V.; Ferreira, N.J.; Velho, H.F.D.C. Linear and nonlinear statistical down scaling for rainfall forecasting over Southeastern Brazil. Weather. Forecast. 2006, 21, 969–989. [Google Scholar] [CrossRef]
  46. Lin, J.Y.; Cheng, C.T.; Chau, K.W. Using support vector machines for long-term discharge prediction. Hydrol. Sci. J. 2006, 51, 599–612. [Google Scholar] [CrossRef]
  47. Ebert, E. Methods for verifying satellite precipitation estimates. In Measuring Precipitation from Space: EURAINSAT and the Future; Levizzani, V., Bauer, P., Turk, F.J., Eds.; Springer: Berlin/Heidelberg, Germany, 2007; pp. 345–356. [Google Scholar]
  48. Jobard, I.; Chopin, F.; Bergrès, J.; Roca, R. An intercomparison of 10-day precipitation satellite products during west African monsoon. Int. J. Remote Sens. 2011, 32, 2353–2376. [Google Scholar] [CrossRef]
  49. Laurent, H.; Jobard, I.; Toma, A. Validation of satellite and ground-based estimates of precipitation over the Sahel. Atmos. Res. 1998, 4748, 651–670. [Google Scholar] [CrossRef]
  50. Lettenmaier, D.P.; Wood, E.F. Hydrological Forecating. In Handbook of Hydrology; Maodment, D., Ed.; Mc Graw-Hill: New York, NY, USA, 1993. [Google Scholar]
  51. Nash, J.E.; Sutcliffe, J.V. River flow forecasting through conceptual models part I—A discussion of principles. J. Hydrol. 1970, 10, 282–290. [Google Scholar] [CrossRef]
  52. Moriasi, D.N.; Arnold, J.G.; van Liew, M.W.; Bingner, R.L.; Harmel, R.D.; Veith, T.L. Model evaluation guidelines for systematic quantification of accuracy in watershed simulations. Trans. ASABE 2007, 50, 885–900. [Google Scholar] [CrossRef]
  53. Seyyedi, H.; Anagnostou, E.; Beighley, E.; McCollum, J. Satellite-driven downscaling of global reanalysis precipitation products for hydrological applications. Hydrol. Earth Syst. Sci. 2014, 18, 5077–5091. [Google Scholar] [CrossRef]
Figure 1. Geographical location of the Study area.
Water 15 01997 g001
Figure 2. Geographical location of the Ksob basin (surrounded by the yellow line) in the study area.
Water 15 01997 g002
Figure 3. Average monthly precipitation was recorded respectively at the Adamna (a), Azrou (b), Igrounzar (c) and Talmest (d) stations (Source: ABHT).
Water 15 01997 g003
Figure 4. Three-layer ANN model architecture was used in this study.
Water 15 01997 g004
Figure 5. Scatterplot between monthly TerraClimate, Pesiann-CDR, Tamsat and CHIRPS products and the rain gauges at Talmest Station.
Water 15 01997 g005
Figure 6. Same as Figure 5, but for the rain gauges at Adamna Station.
Water 15 01997 g006
Figure 7. Same as Figure 5, but for the rain gauges at Azrou Station.
Water 15 01997 g007
Figure 8. Same as Figure 5, but for the rain gauges at Igrounzar Station.
Water 15 01997 g008
Figure 9. Regression line between the observed and simulated flow.
Water 15 01997 g009
Figure 10. Artificial neural network model.
Water 15 01997 g010
Figure 11. The inputs of the ANN model for simulating the flow.
Water 15 01997 g011
Figure 12. The output to the ANN model.
Water 15 01997 g012
Figure 13. Calibration (figure up) and validation (figure middle) of the ANN hydrological model by using the DSST technique to predict (figure below) the discharge from January 1978 to December 2016.
Water 15 01997 g013
Table 1. Monthly precipitation series are available at the rain gauge stations in the study area.
Rainfall StationAltitude (m)Period of Monthly Available
Precipitations
Adamna 701977–2021
Azrou 3502002–2021
Igrounzar1581977–2021
Talmest531984–2021
Note(s): Source: ABHT.
Table 2. Contingency table.
Rain Gauge
Rain ≥ ThresholdRain < Threshold
SatelliteRain ≥ Thresholdab
Rain < Thresholdcd
Table 3. List of Statistical indexes used to validate the Satellite precipitation products.
IndicatorsEquationPossible ValuesOptimal Value
Pearson Correlation Coefficient P C C = i = 1 n ( G i G ) ( S i S ) i = 1 n ( G i G ) 2 i = 1 n ( S i S ) 2 −1 to 11
BiaisBiais = i = 1 n S i i = 1 n G i 0 to +∞1
Root-Mean-Square Error R M S E = 1 n i = 1 n ( S i G i ) 2 0 to +∞0
Nash-Sutcliffe efficiency N S E = 1 i = 1 n ( S i G i ) 2 i = 1 n ( G i G ) 2 −∞ to 11
Mean Absolute Error M A E = 1 n i = 1 n S i G i 0 to +∞0
Probability of detection (POD) P O D = a a + c 1
False alarm ratio (FAR) F A R = b a + b 0
Critical success index (CSI) C S I = a a + b + c 1
Heidke skill score (HSS) H S S = 2 ( a . b b . c ) a + b . b + d + a + c . ( c + d ) 1
Table 4. Statistical parameters for evaluation of different satellite-based rainfall products.
ProductsTerraClimatePersiann CDRTamsatCHIRPS
StationsAdamnaIgrounzarTalmestAzrouAdamnaIgrounzarTalmestAzrouAdamnaIgrounzarTalmestAzrouAdamnaIgrounzarTalmestAzrou
PPC0.940.910.920.900.900.880.910.890.830.760.620.660.380.350.370.37
Biais1.131.030.900.951.421.291.021.351.110.980.950.661.231.050.951.03
RMSE18.6617.5315.3216.0226.7723.3414.8121.5229.7829.5014.420.6644.3241.3133.8135.86
NSE0.710.740.810.75−0.070.190.69−0.040.080.100.250.66−1.65−1.30−0.78−1.32
MAE8.948.838.349.8814.0411.557.2512.3417.8816.864.800.6625.5423.7115.7422.78
POD0.780.800.800.860.990.990.990.990.780.800.800.861.001.001.001.00
FAR0.190.190.250.250.300.290.310.330.190.190.250.250.330.320.330.34
HSS0.370.390.270.340.170.190.110.070.370.390.270.340.000.000.000.00
CSI0.650.670.630.670.700.710.690.670.650.670.630.670.670.680.670.66
Table 5. Performance criteria values.
CriteriaTraining PhaseValidation PhasePrediction Phase
NSE0.973234950.927057220.928024483
MAE1.257606511.120242641.251618283
RMSE3.170084242.560400843.428991402
Disclaimer/Publisher’s Note: The statements, opinions and data contained in all publications are solely those of the individual author(s) and contributor(s) and not of MDPI and/or the editor(s). MDPI and/or the editor(s) disclaim responsibility for any injury to people or property resulting from any ideas, methods, instructions or products referred to in the content.

