
Flood Simulation and Flood Risk Reduction Strategy in Irrigated Areas

Abstract
:1. Introduction
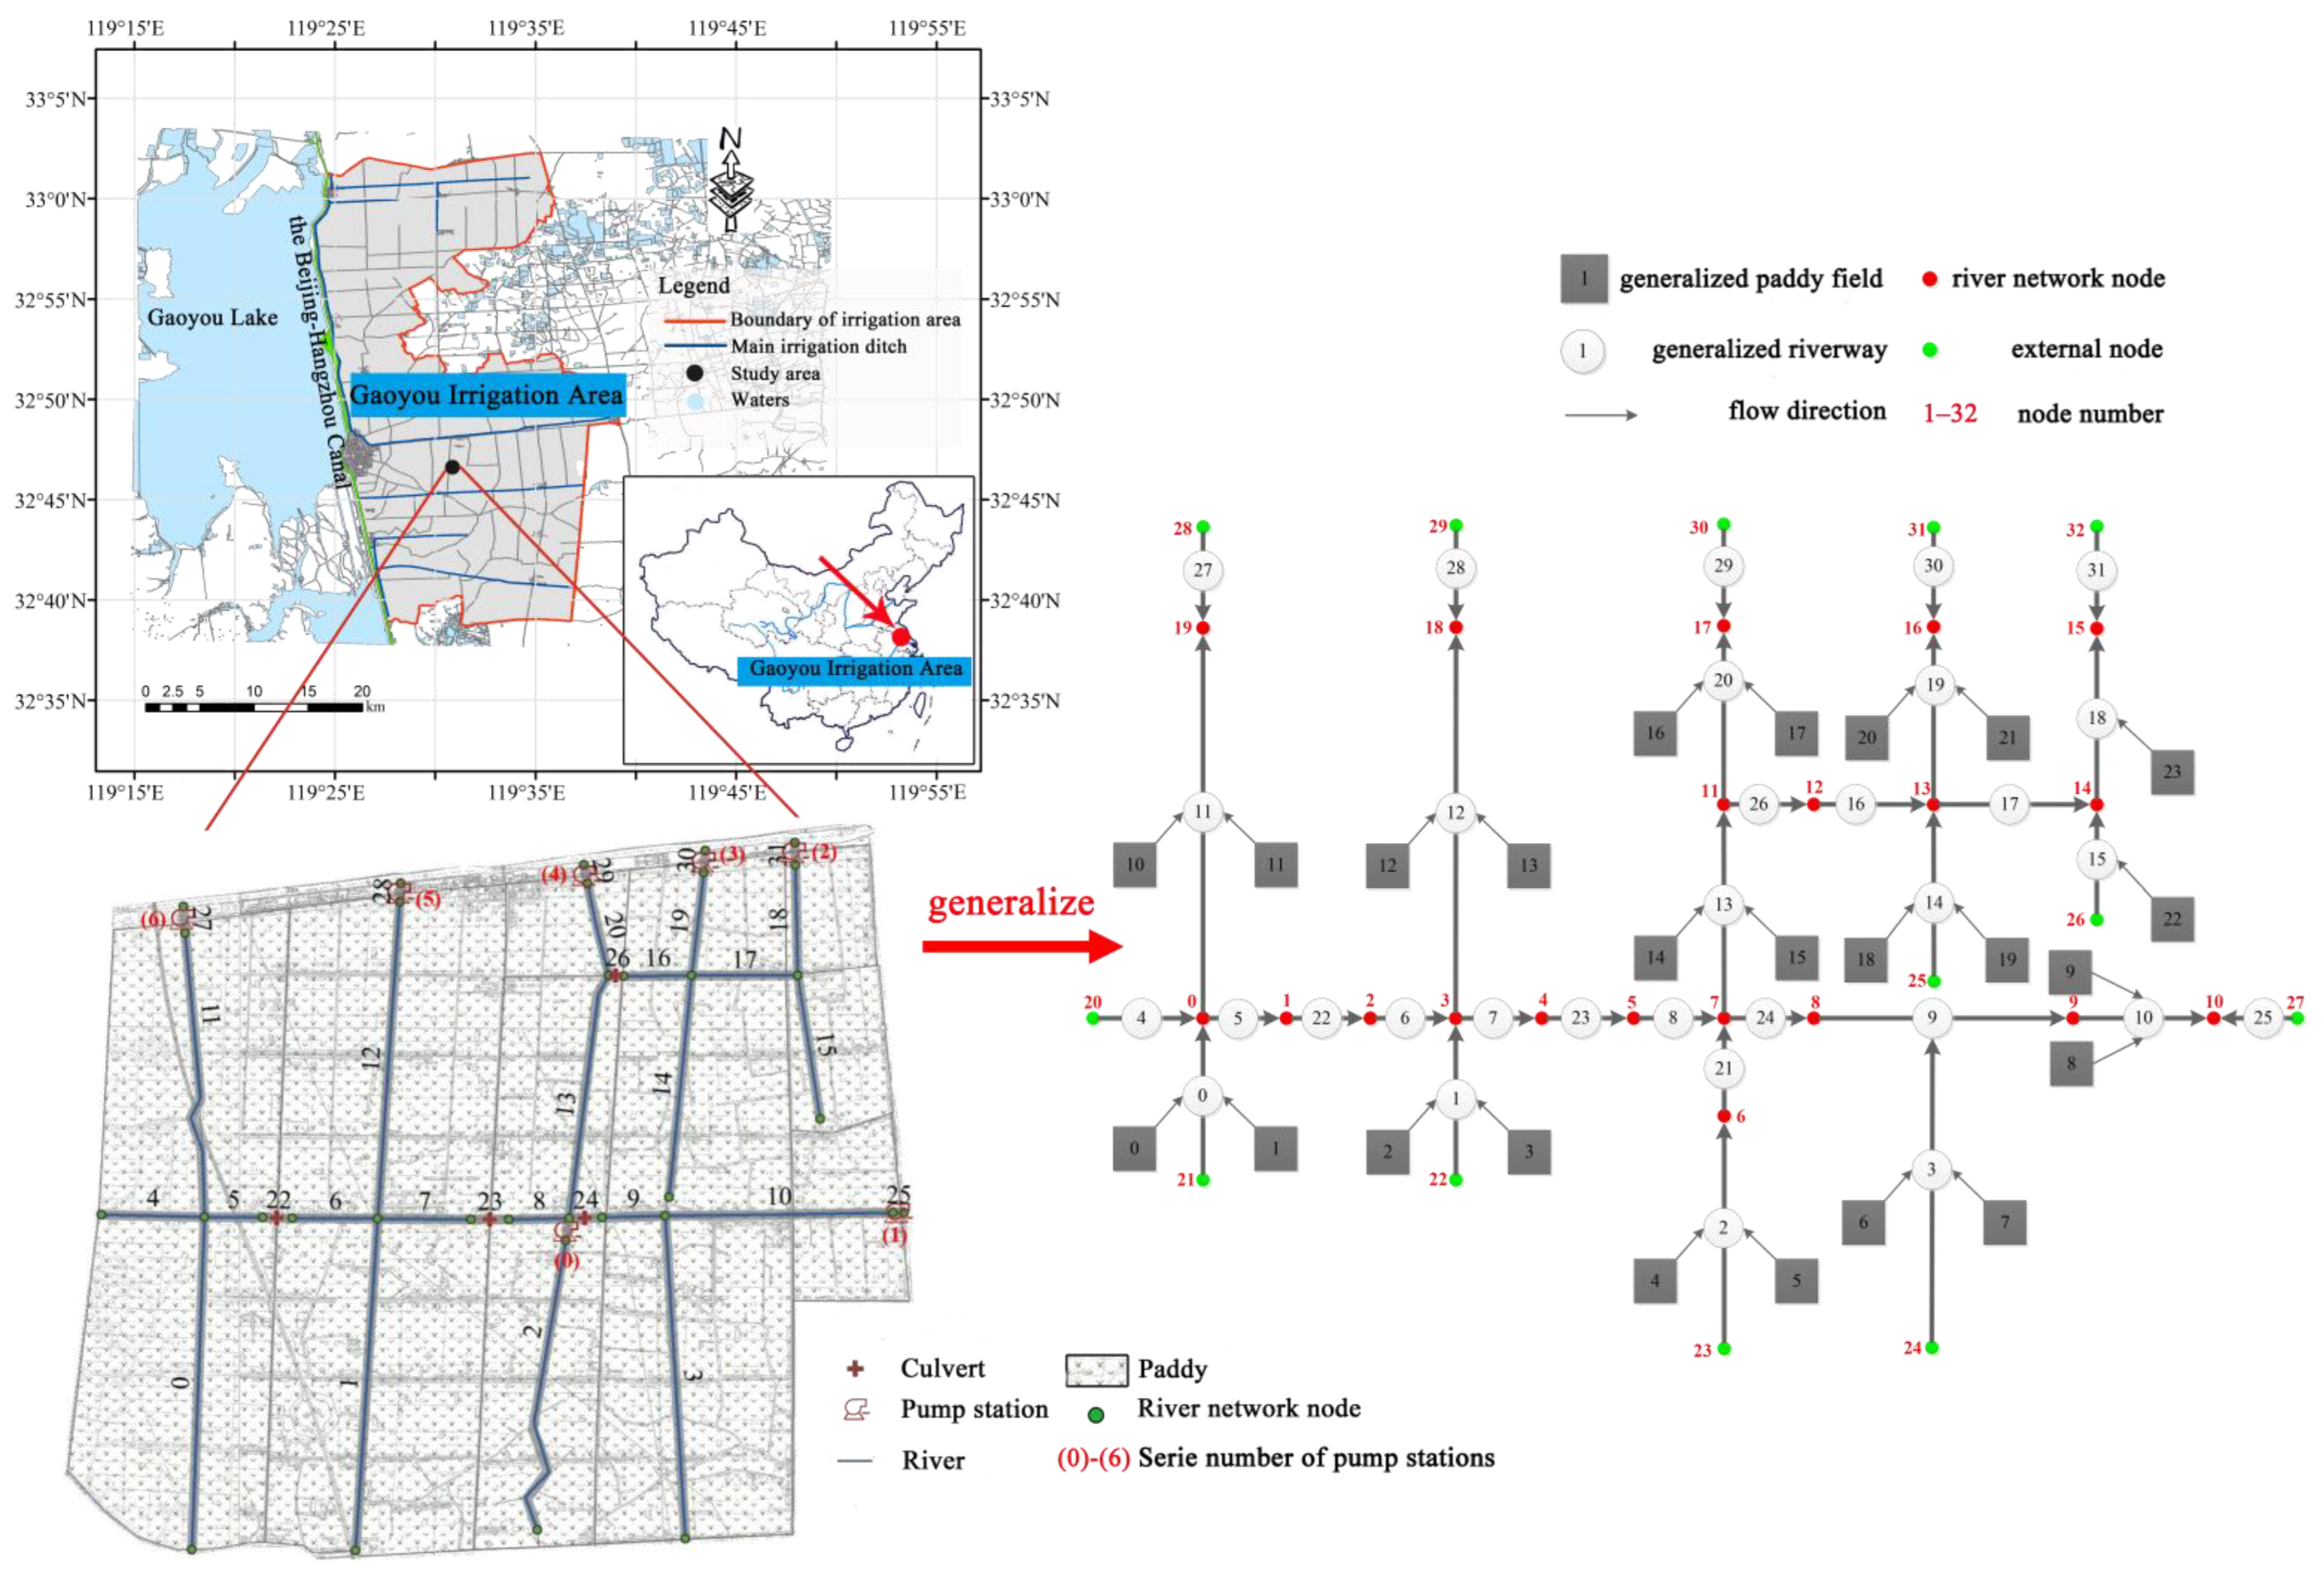
2. Study Areas
3. Methodology and Data
3.1. Waterlogging Process Model for the Paddy Fields
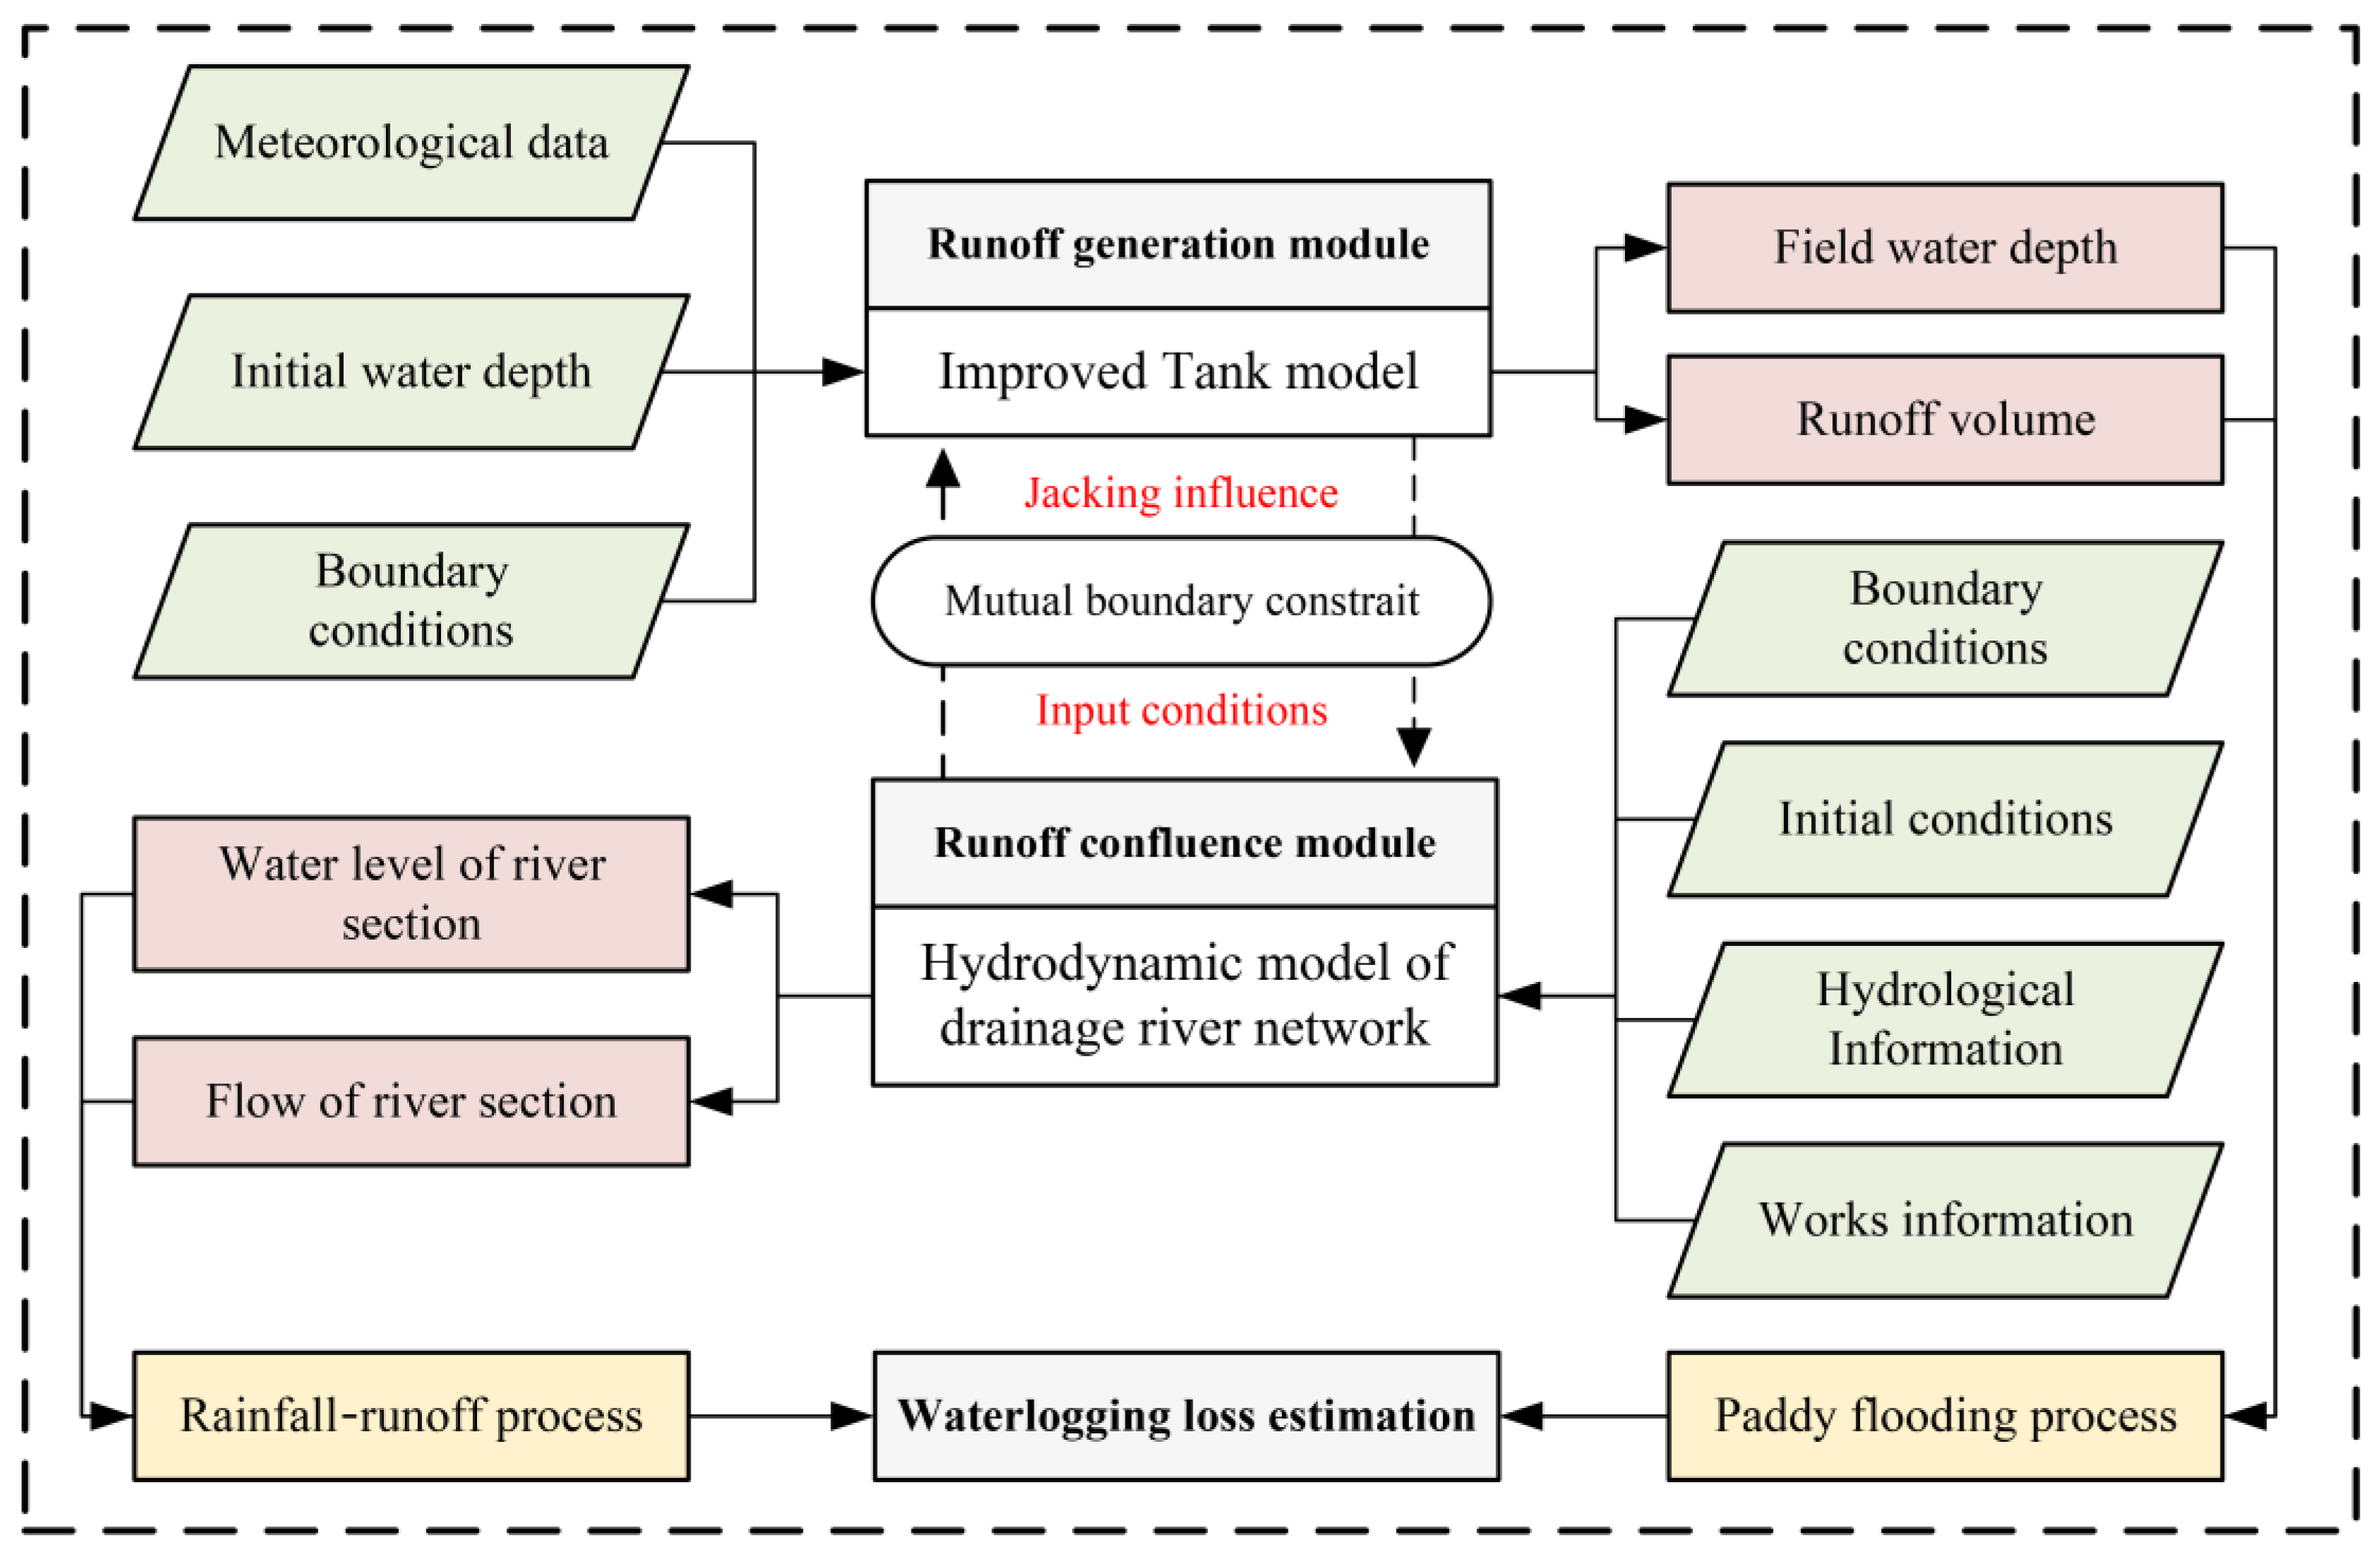
3.1.1. Framework and Assumptions of the Model
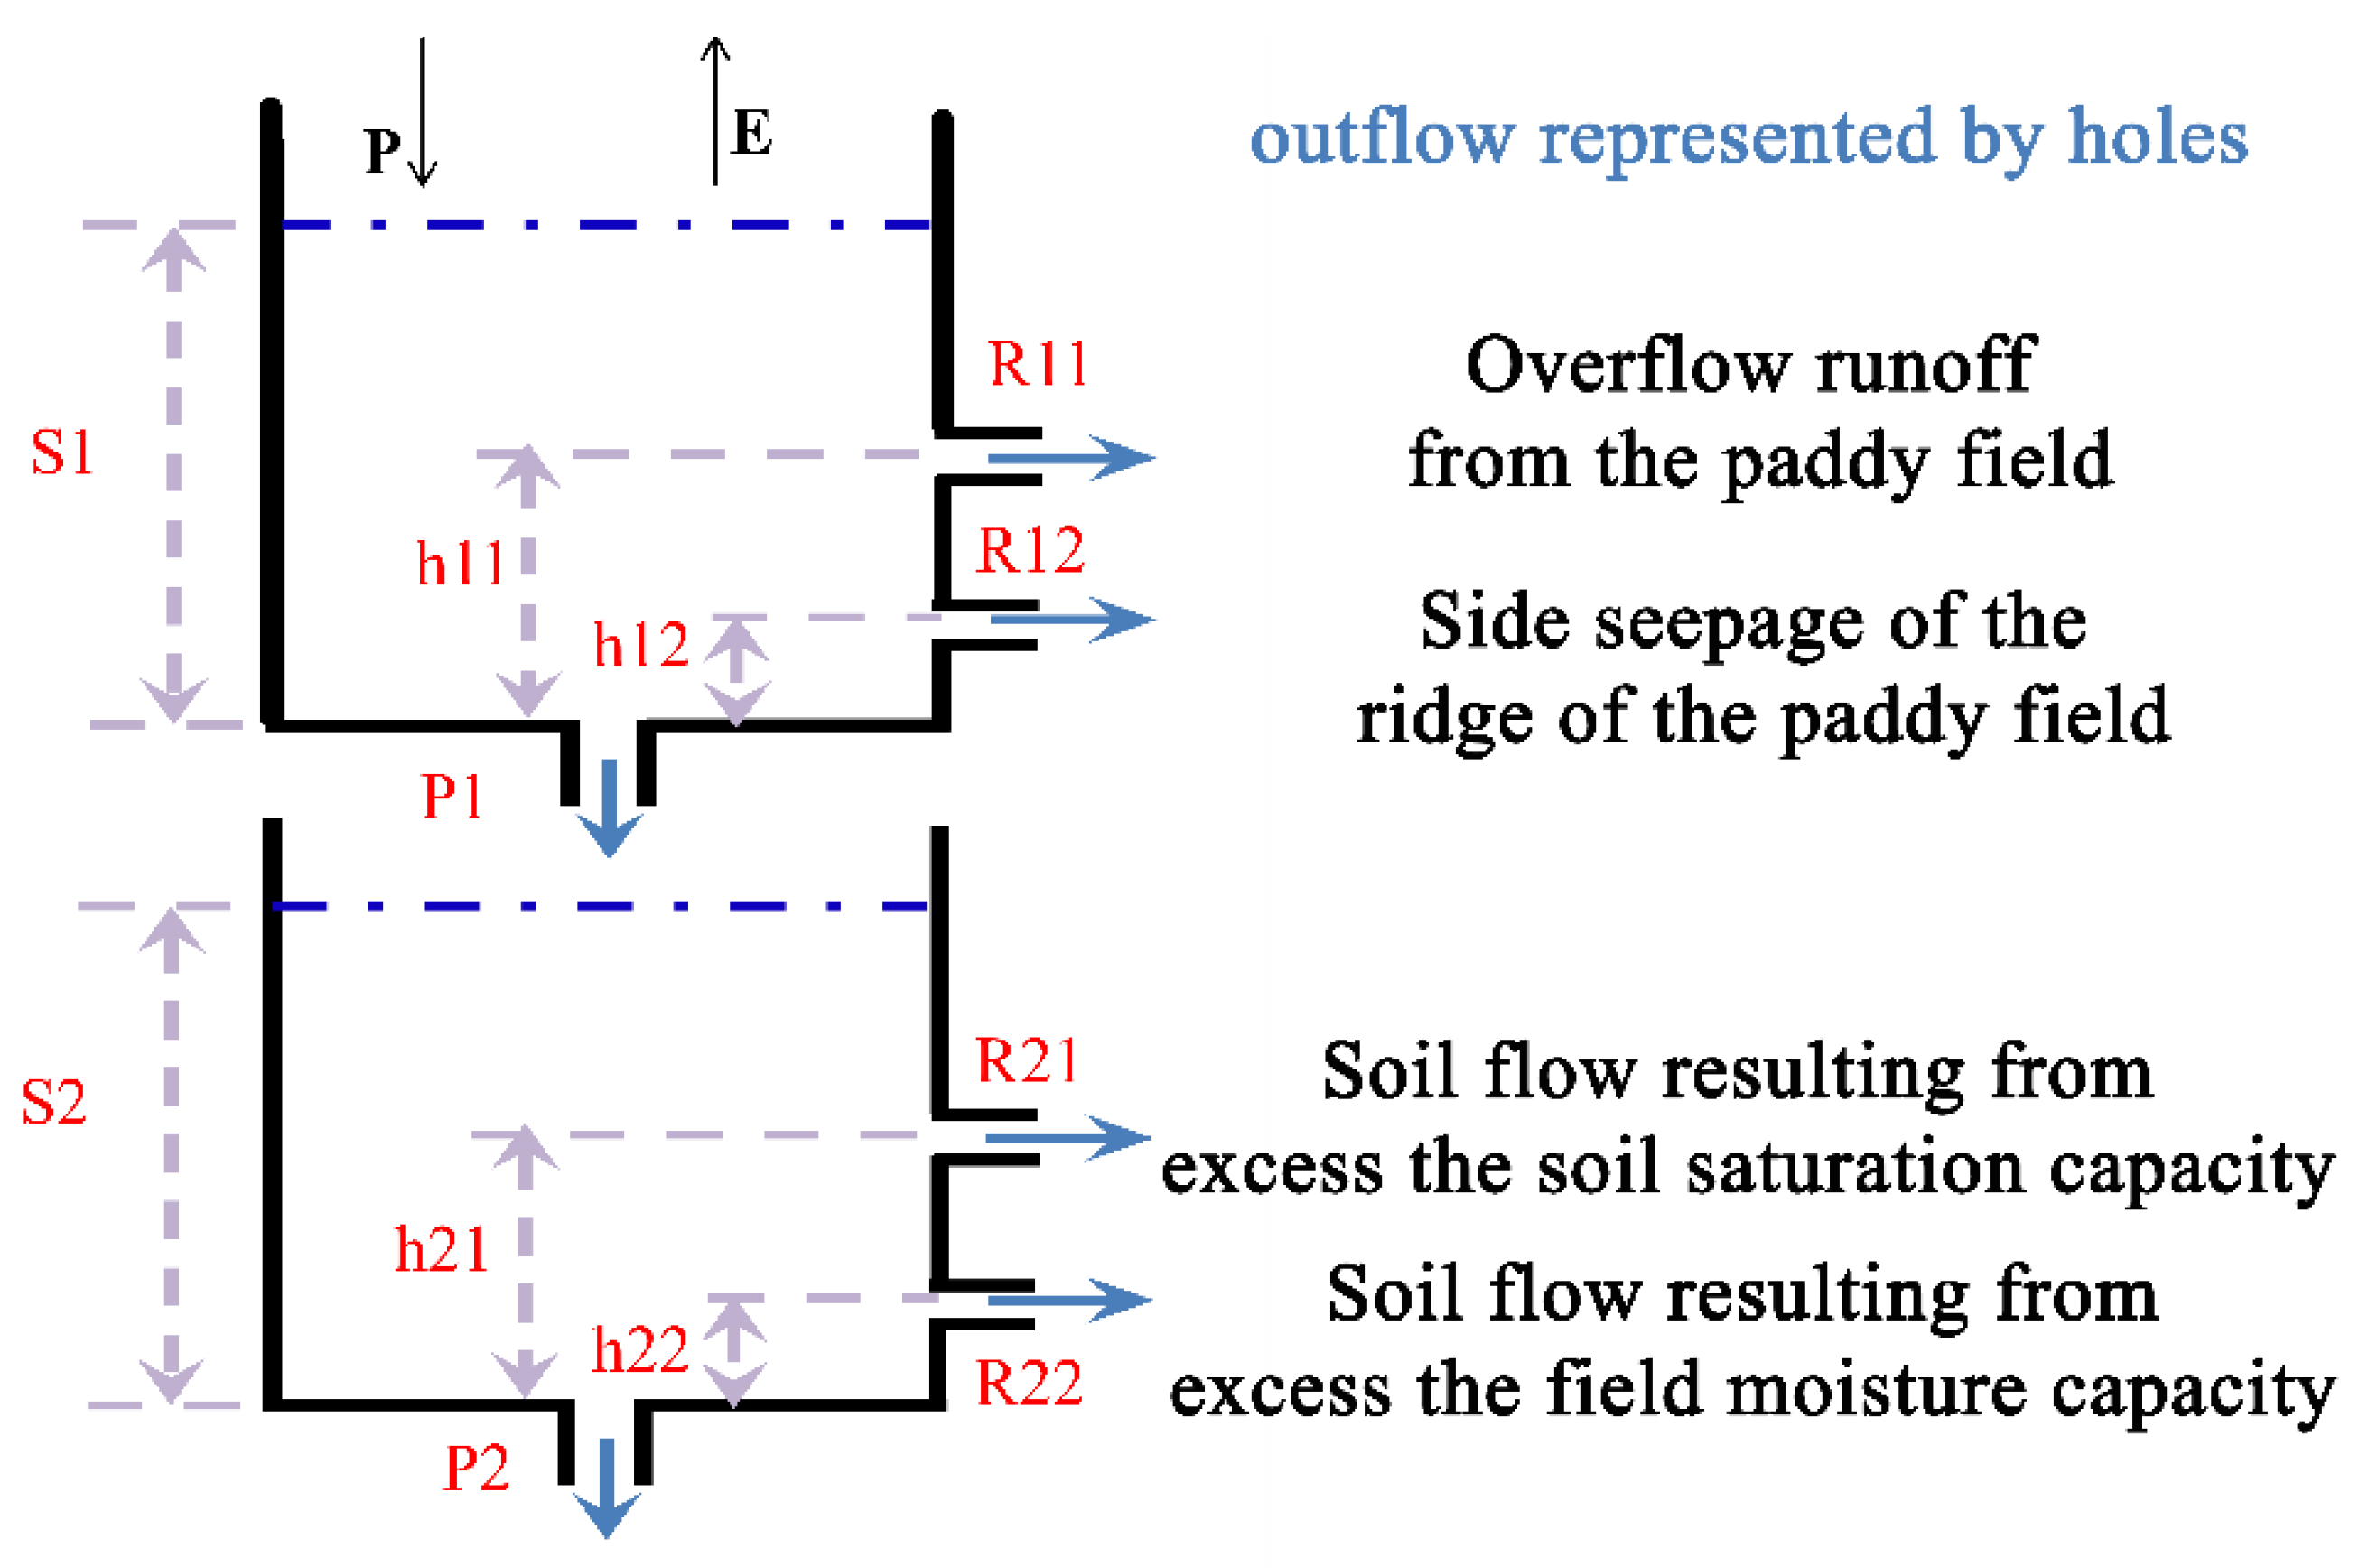
3.1.2. Waterlogging Process Simulation
3.1.3. Waterlogging Loss Estimation
3.1.4. Rules for Optimization of Drainage System Operation
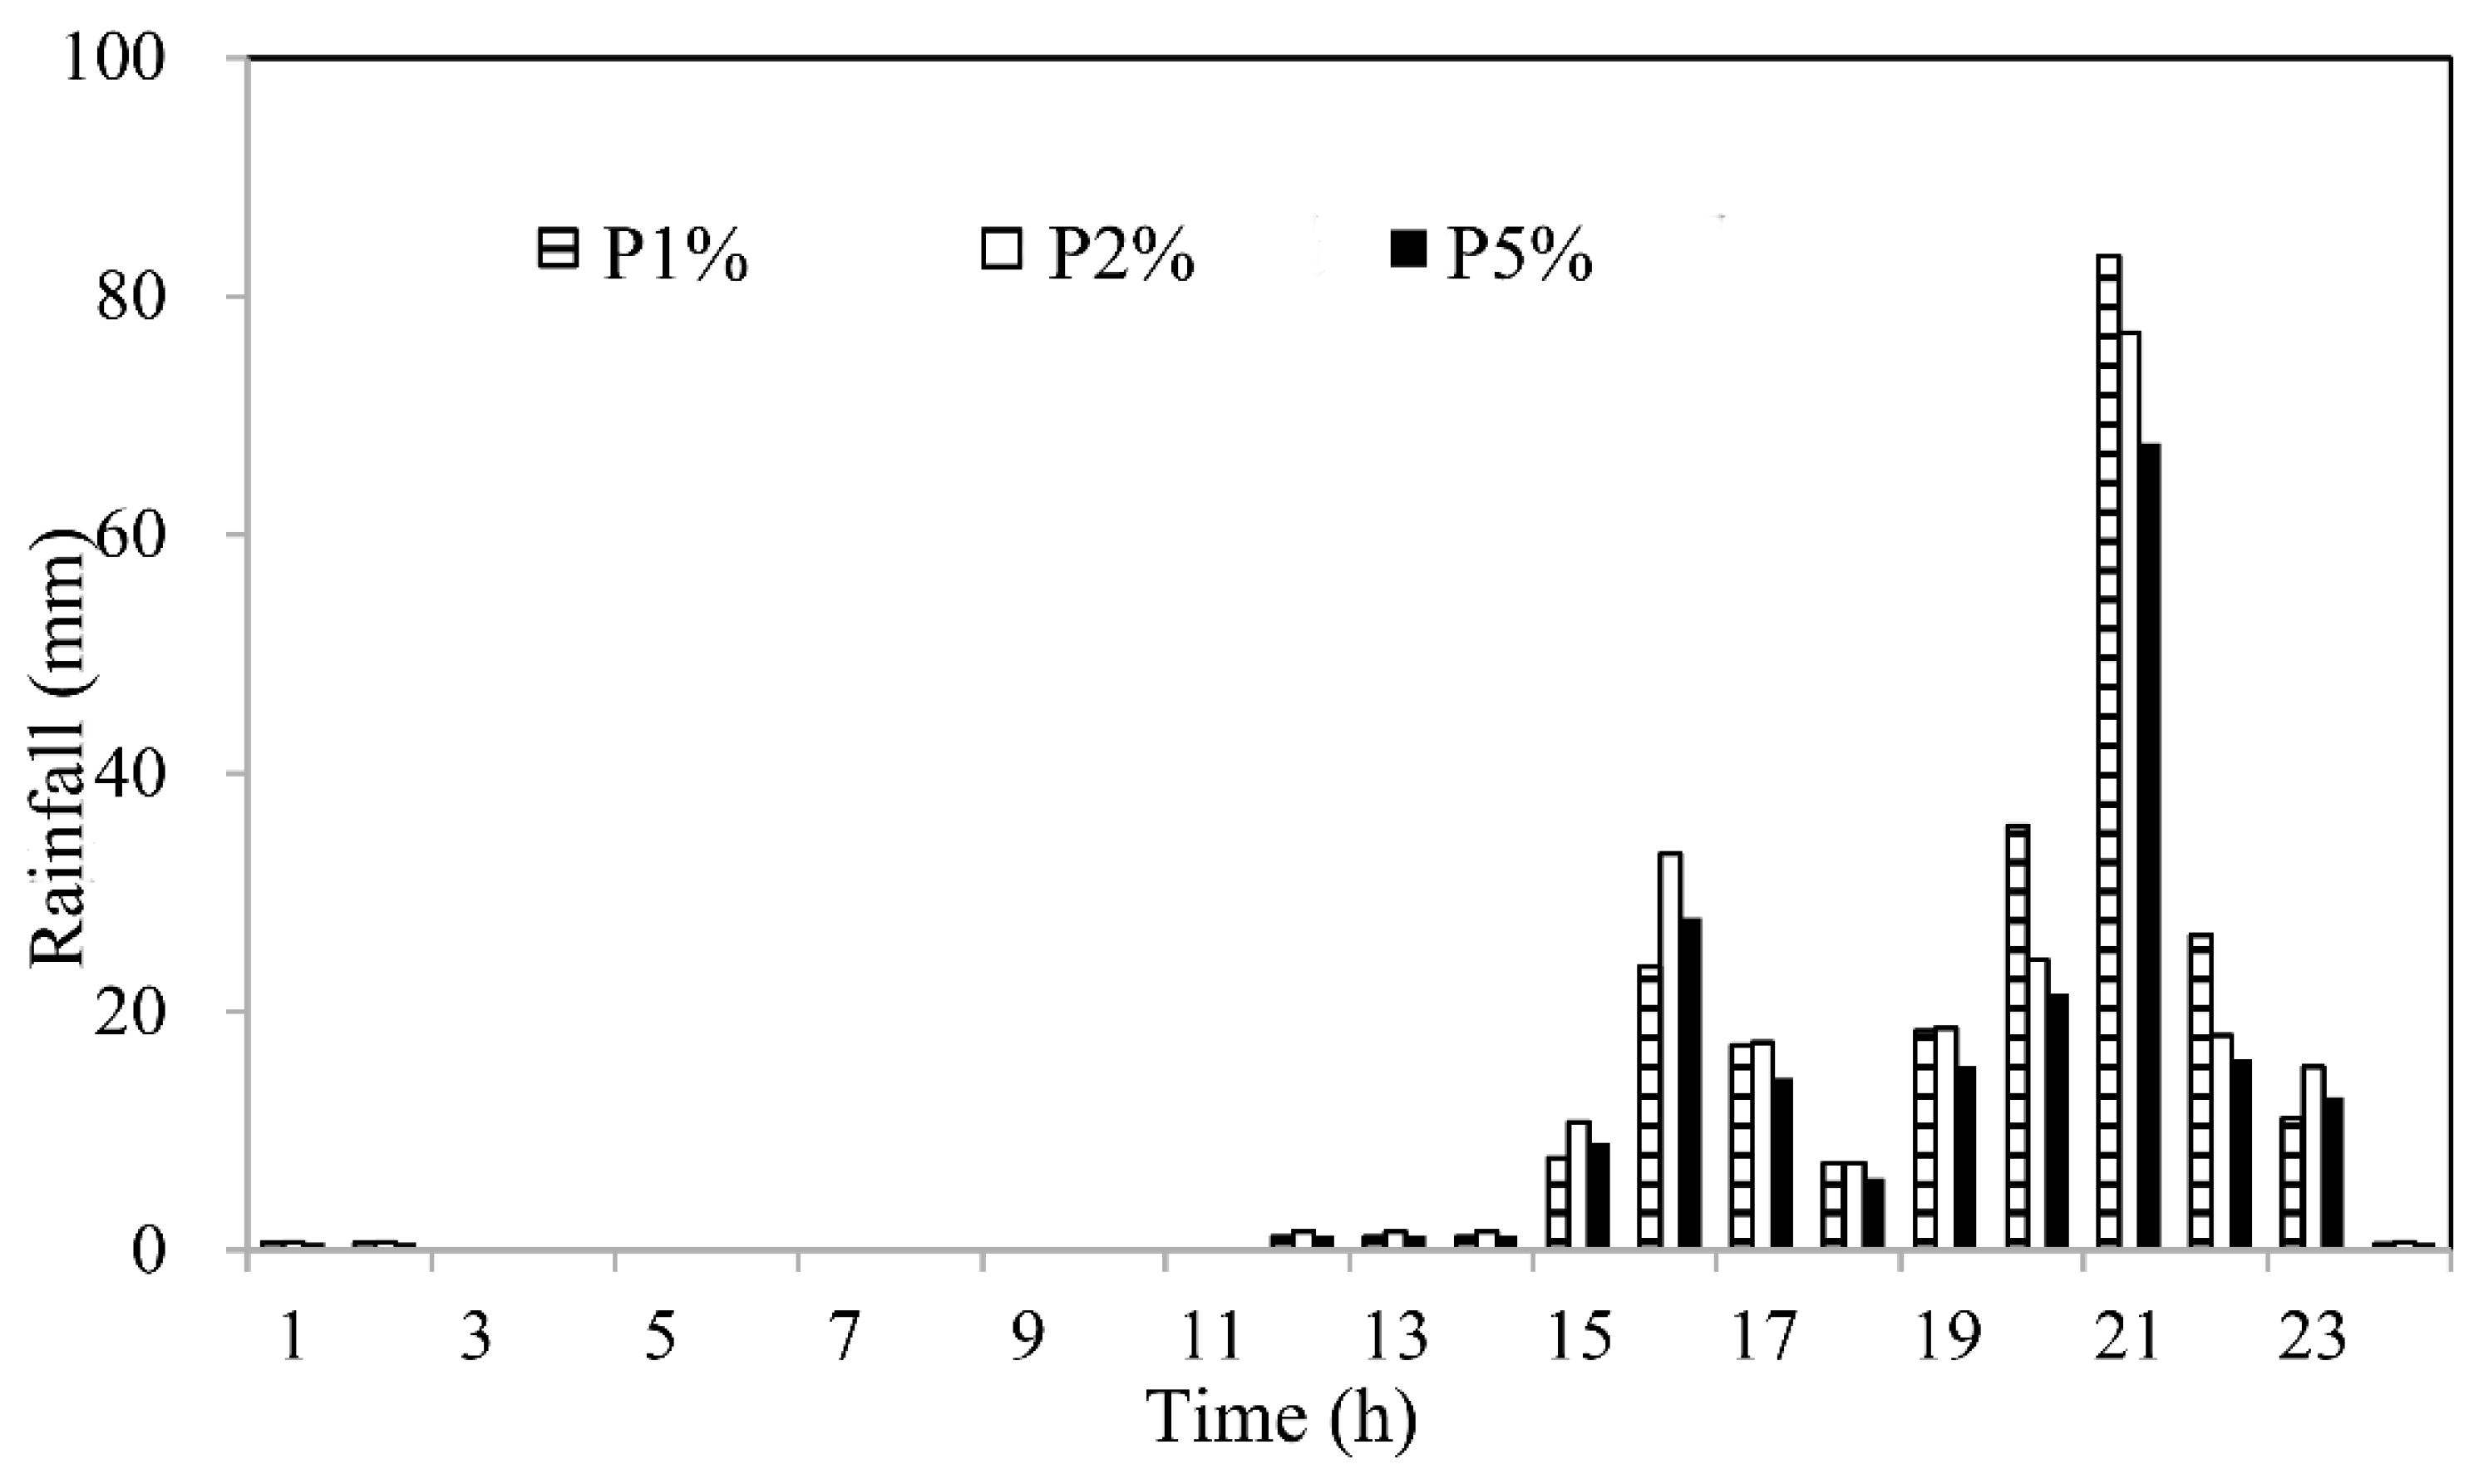
3.2. Scenario Setting
4. Results and Discussion
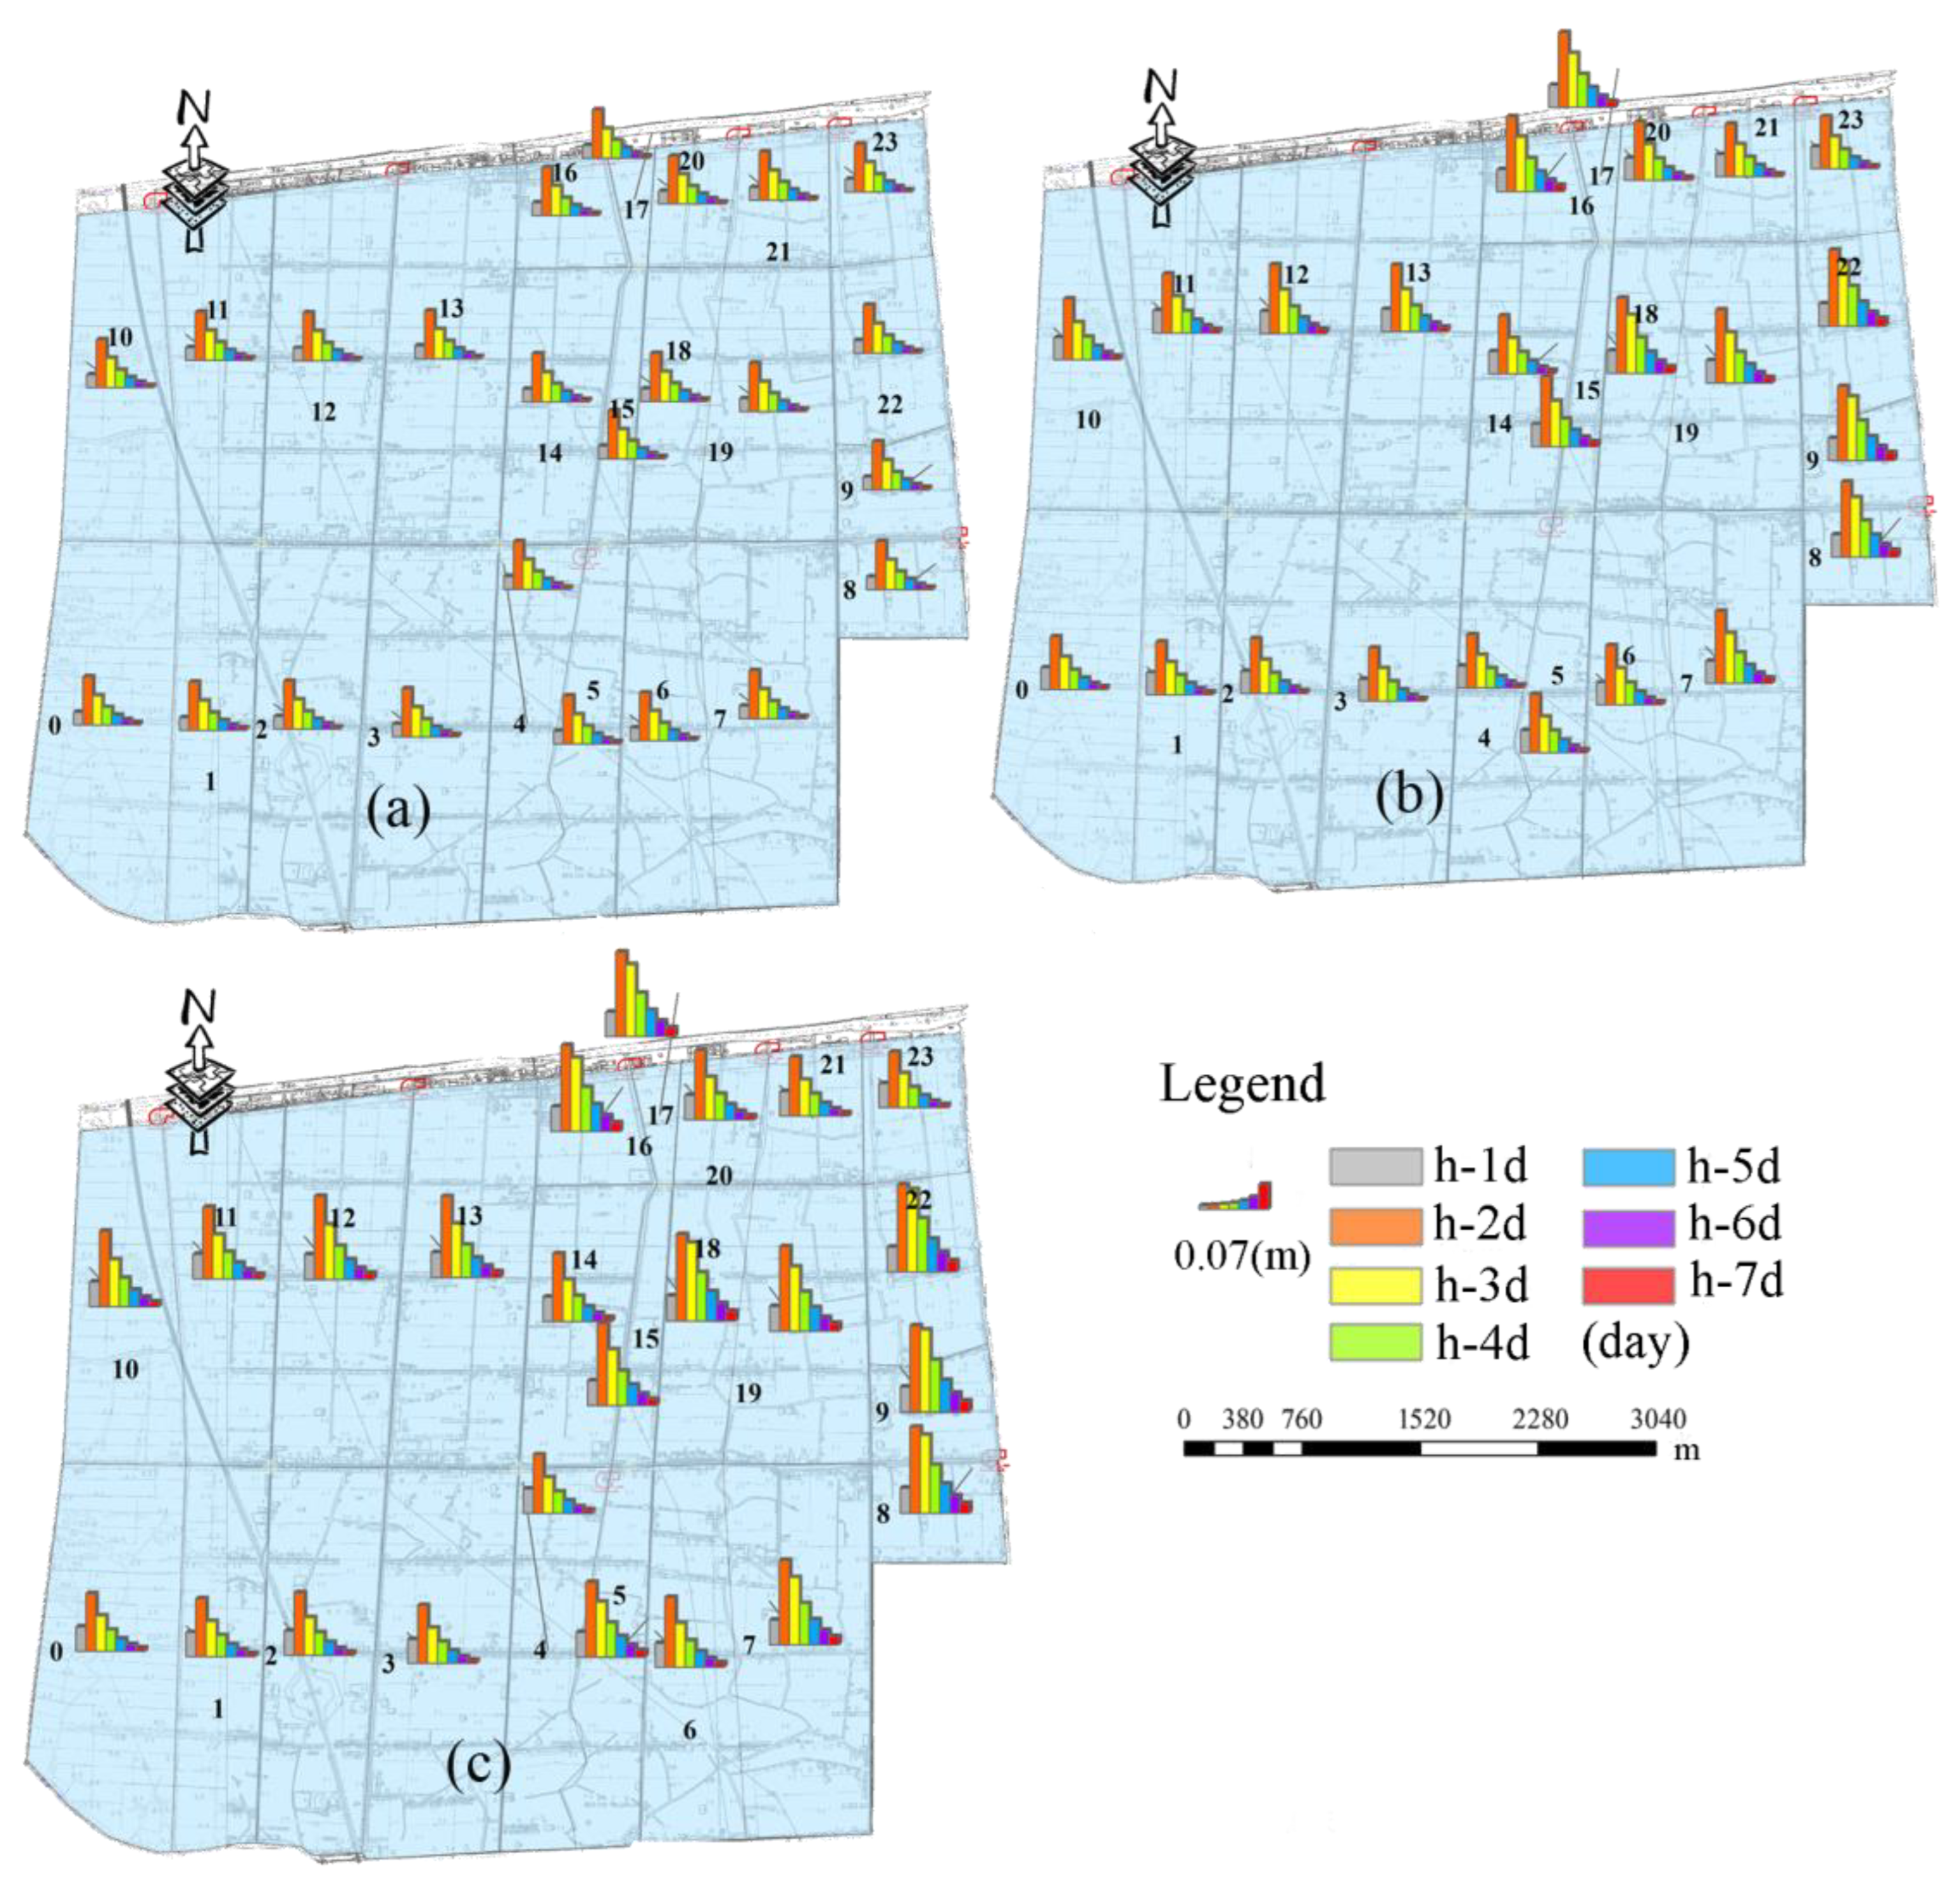
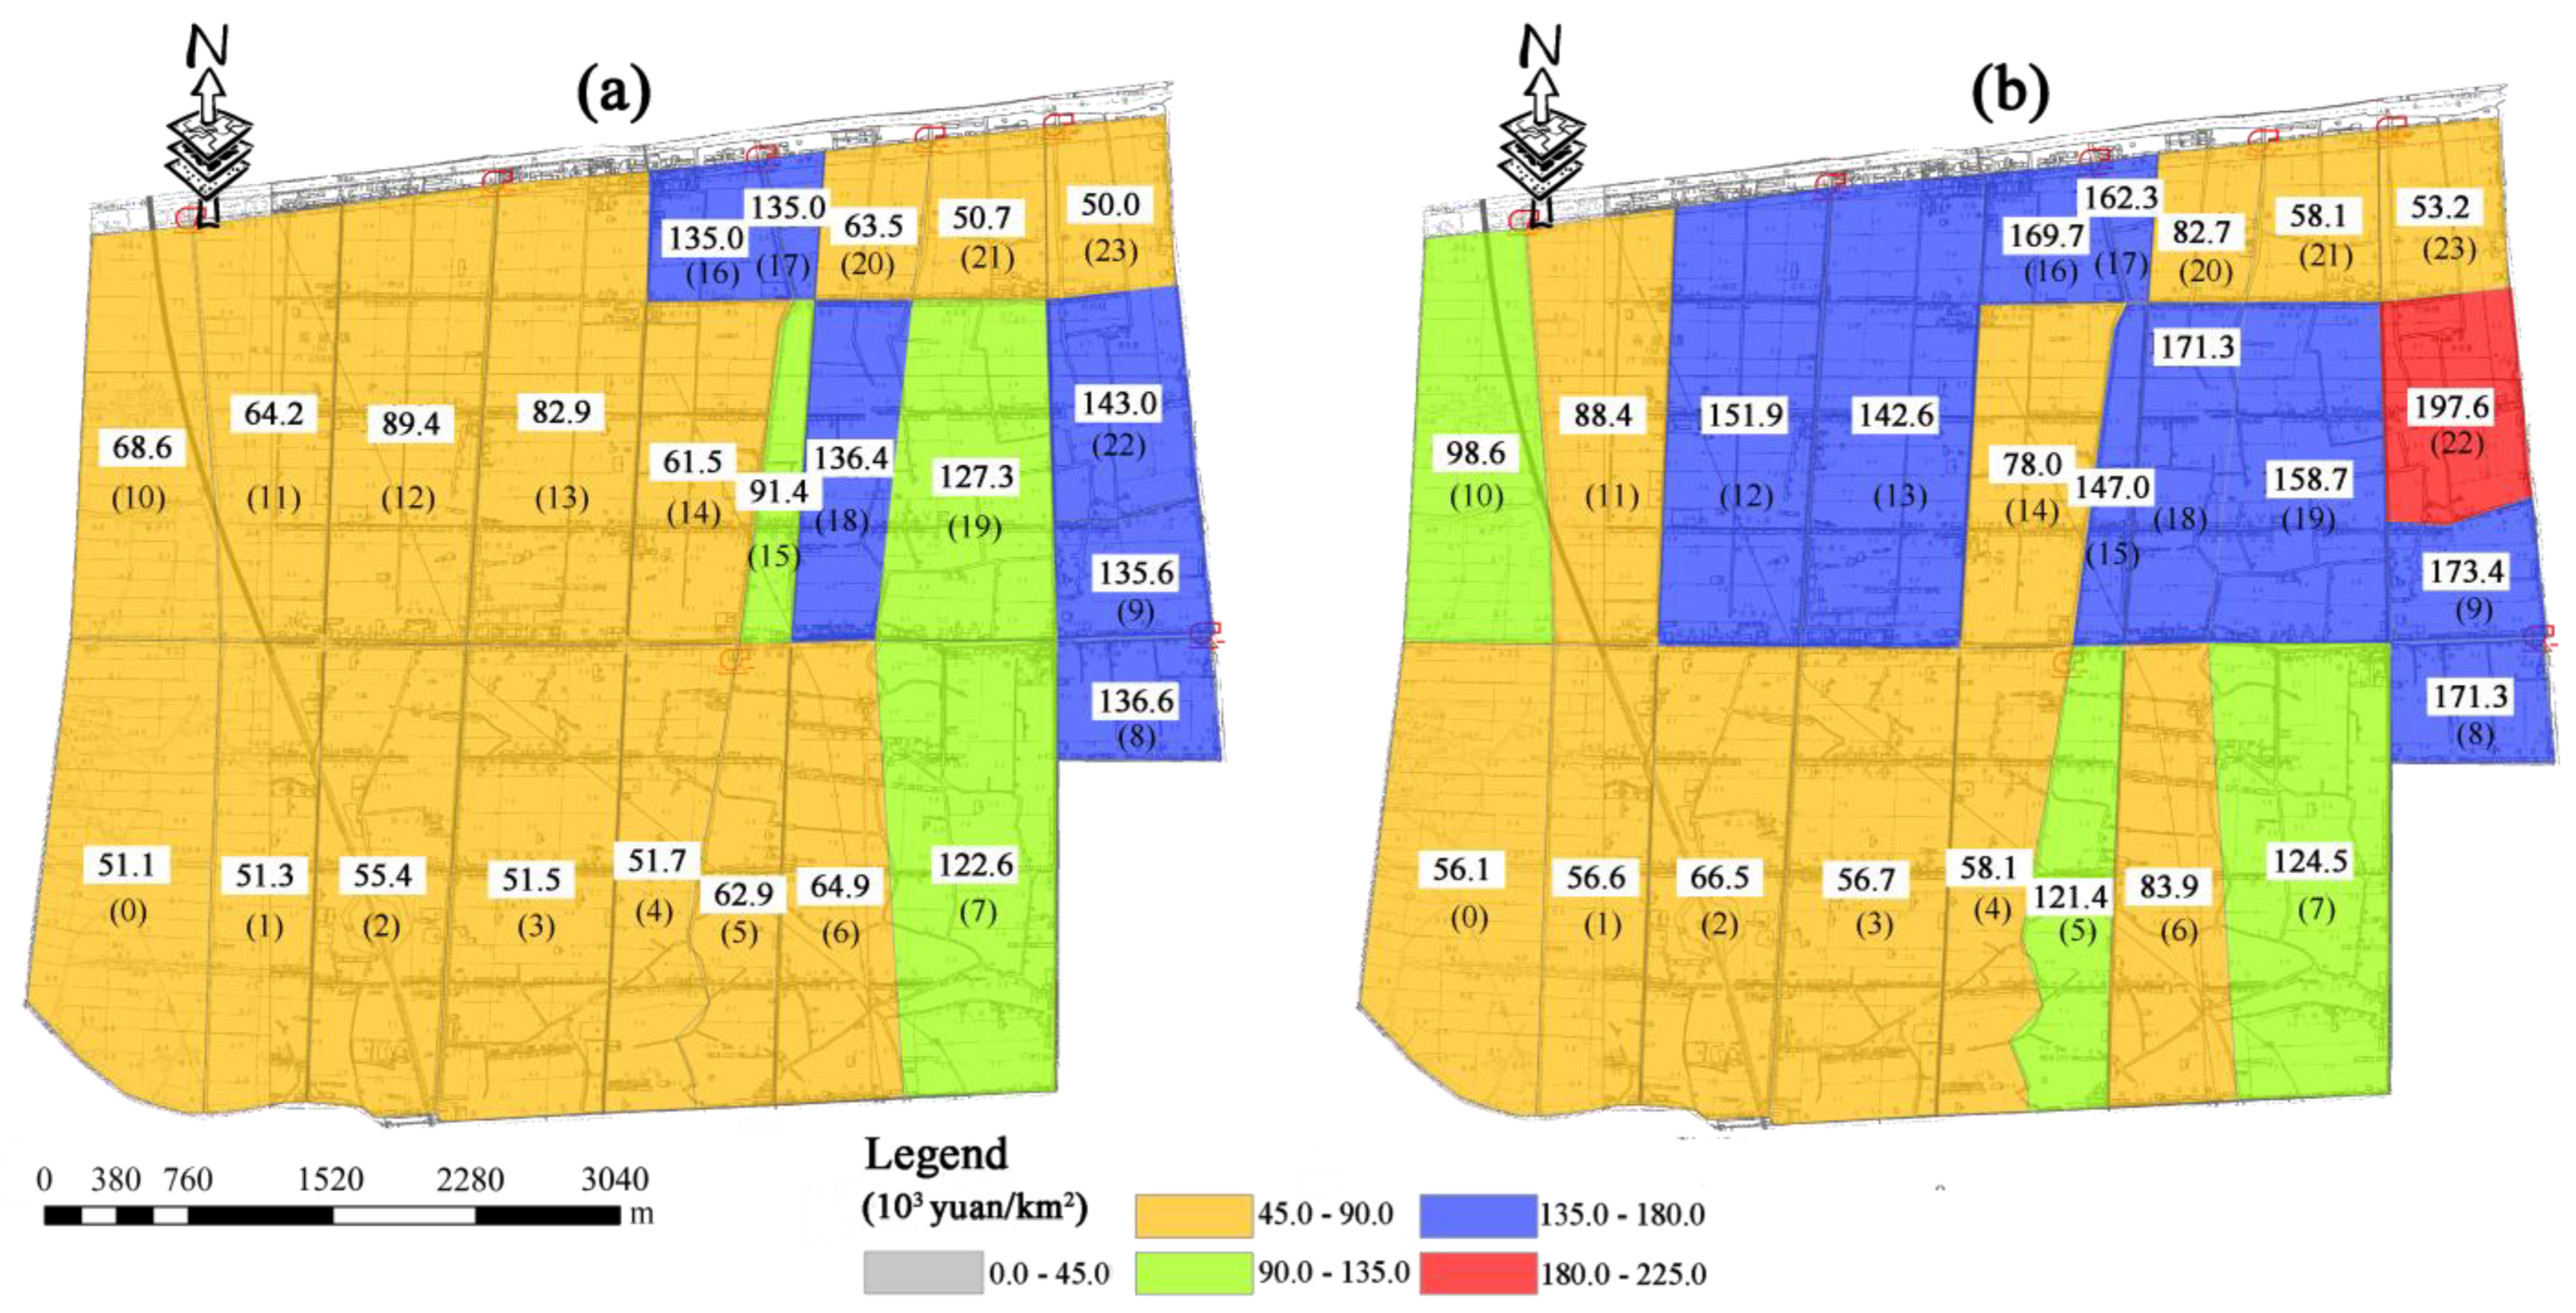
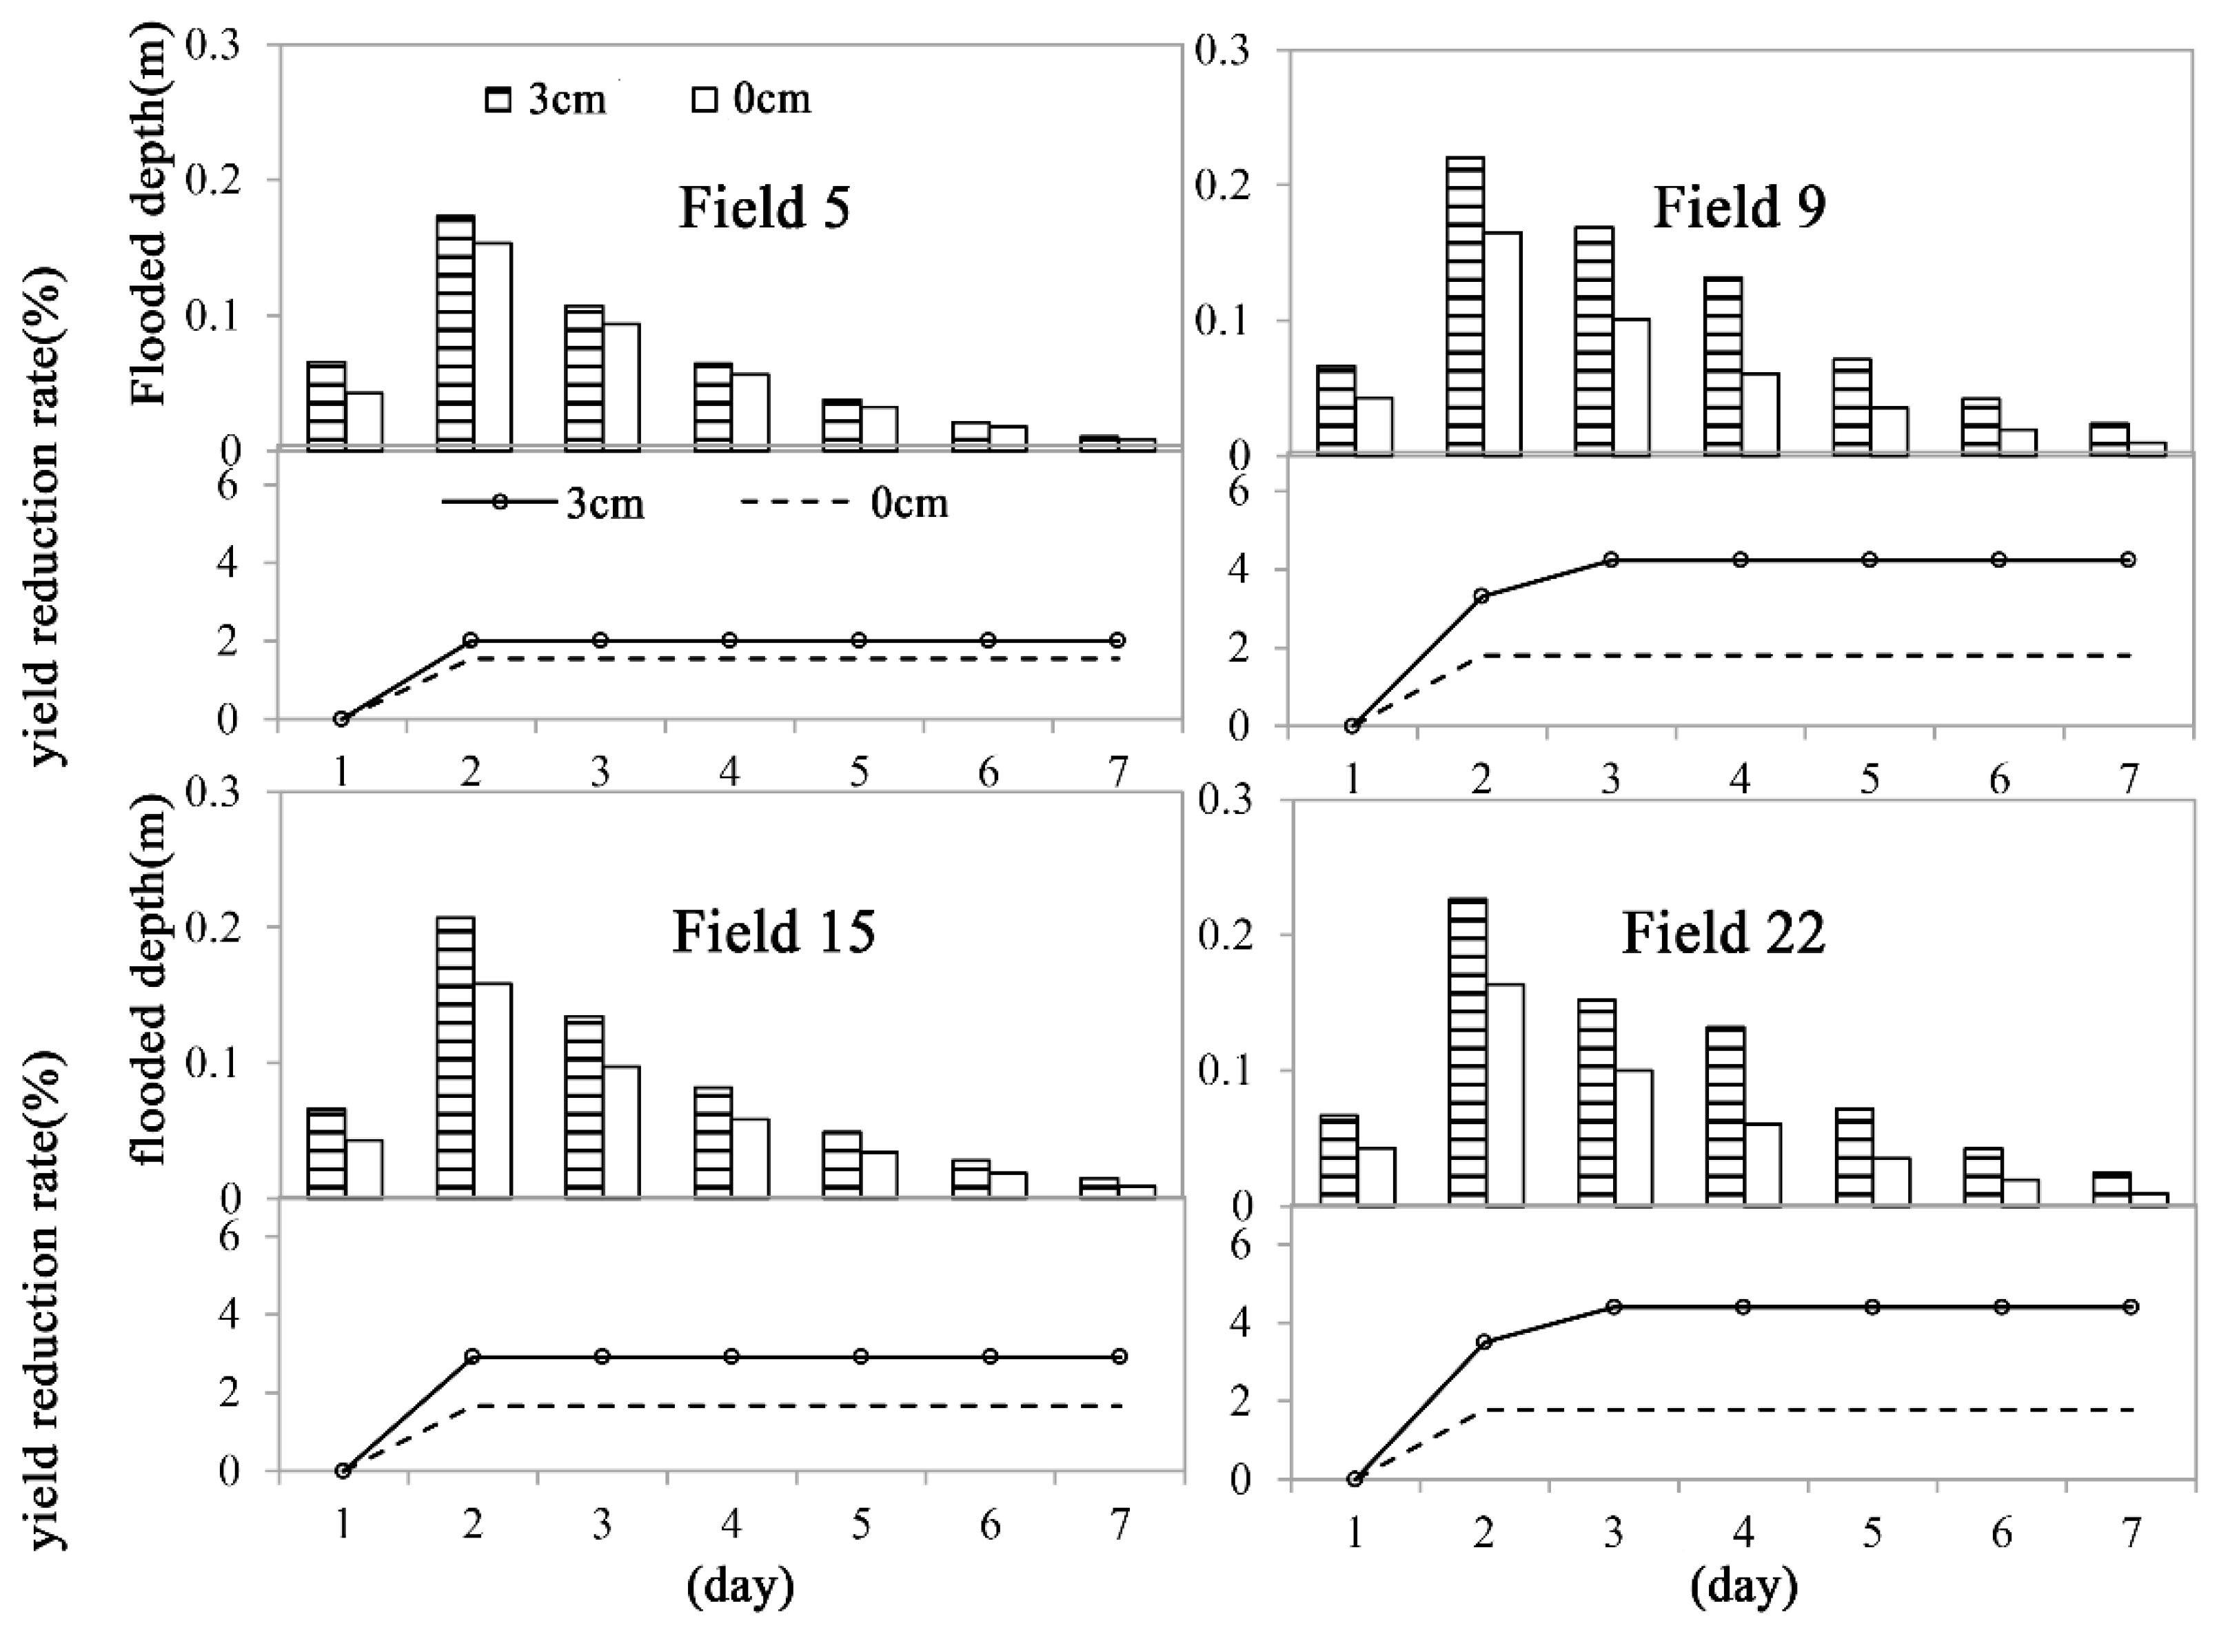
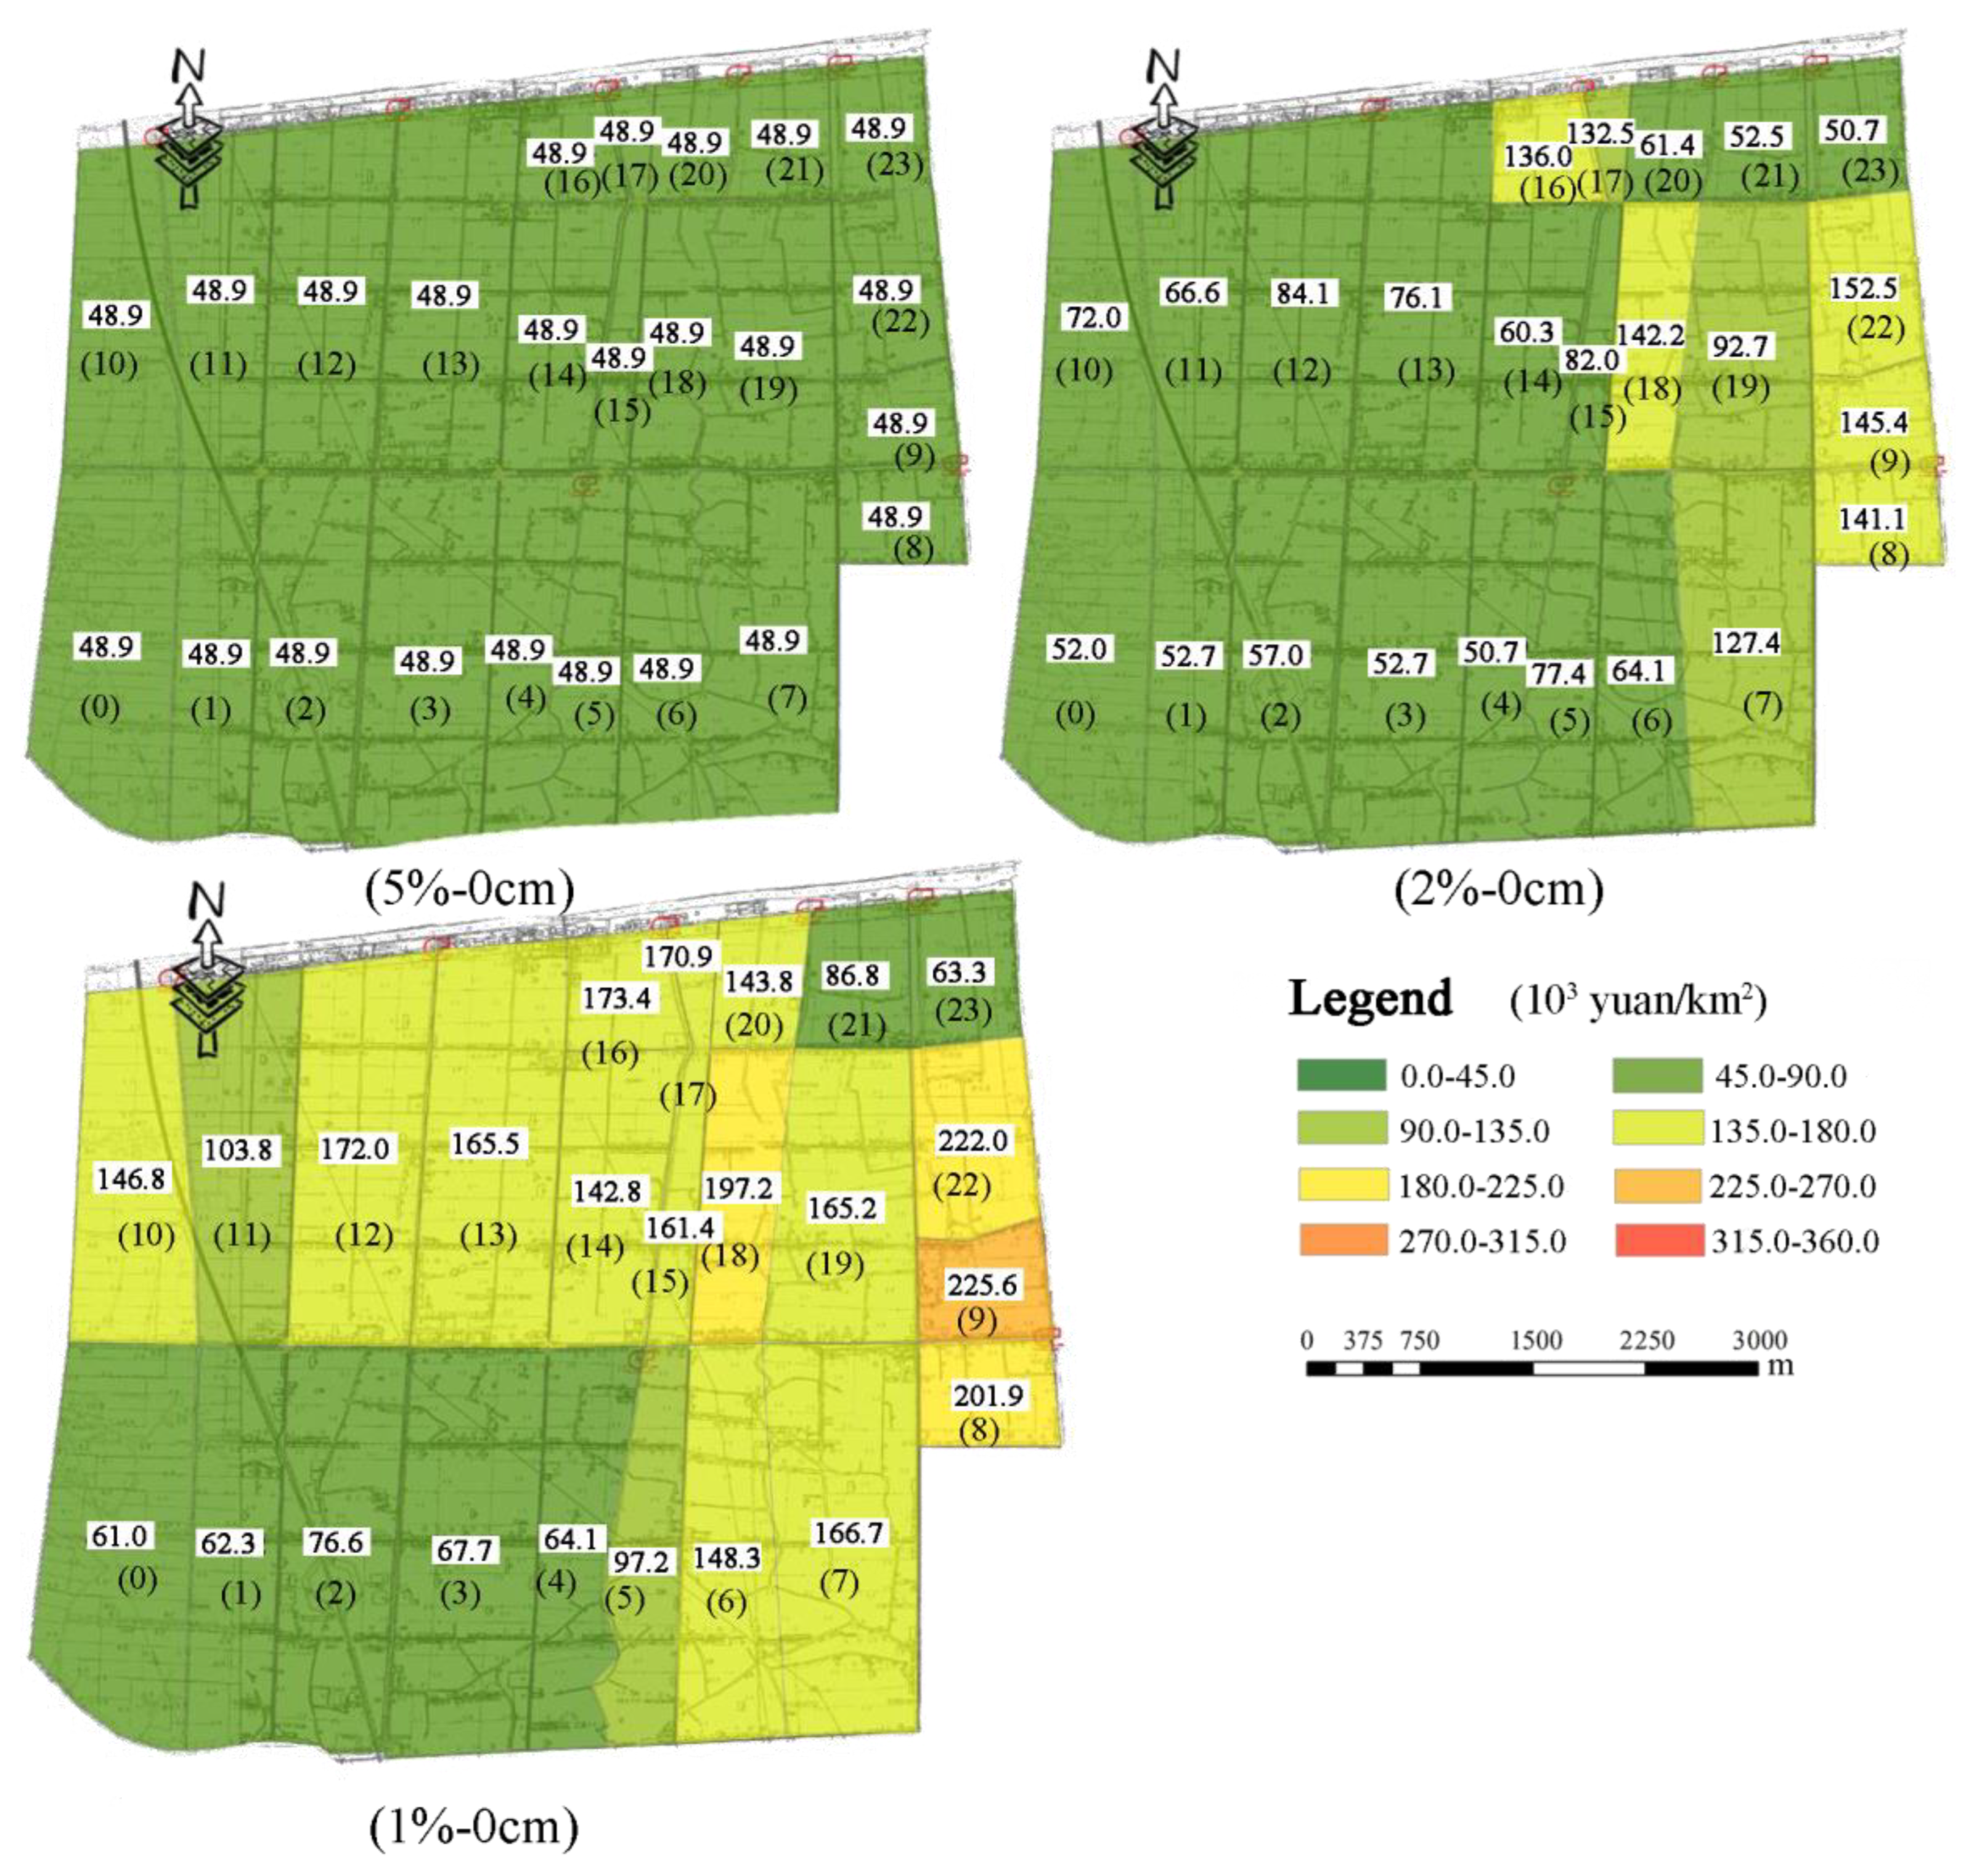
4.1. Paddy Loss under Current and Extreme Rainfall
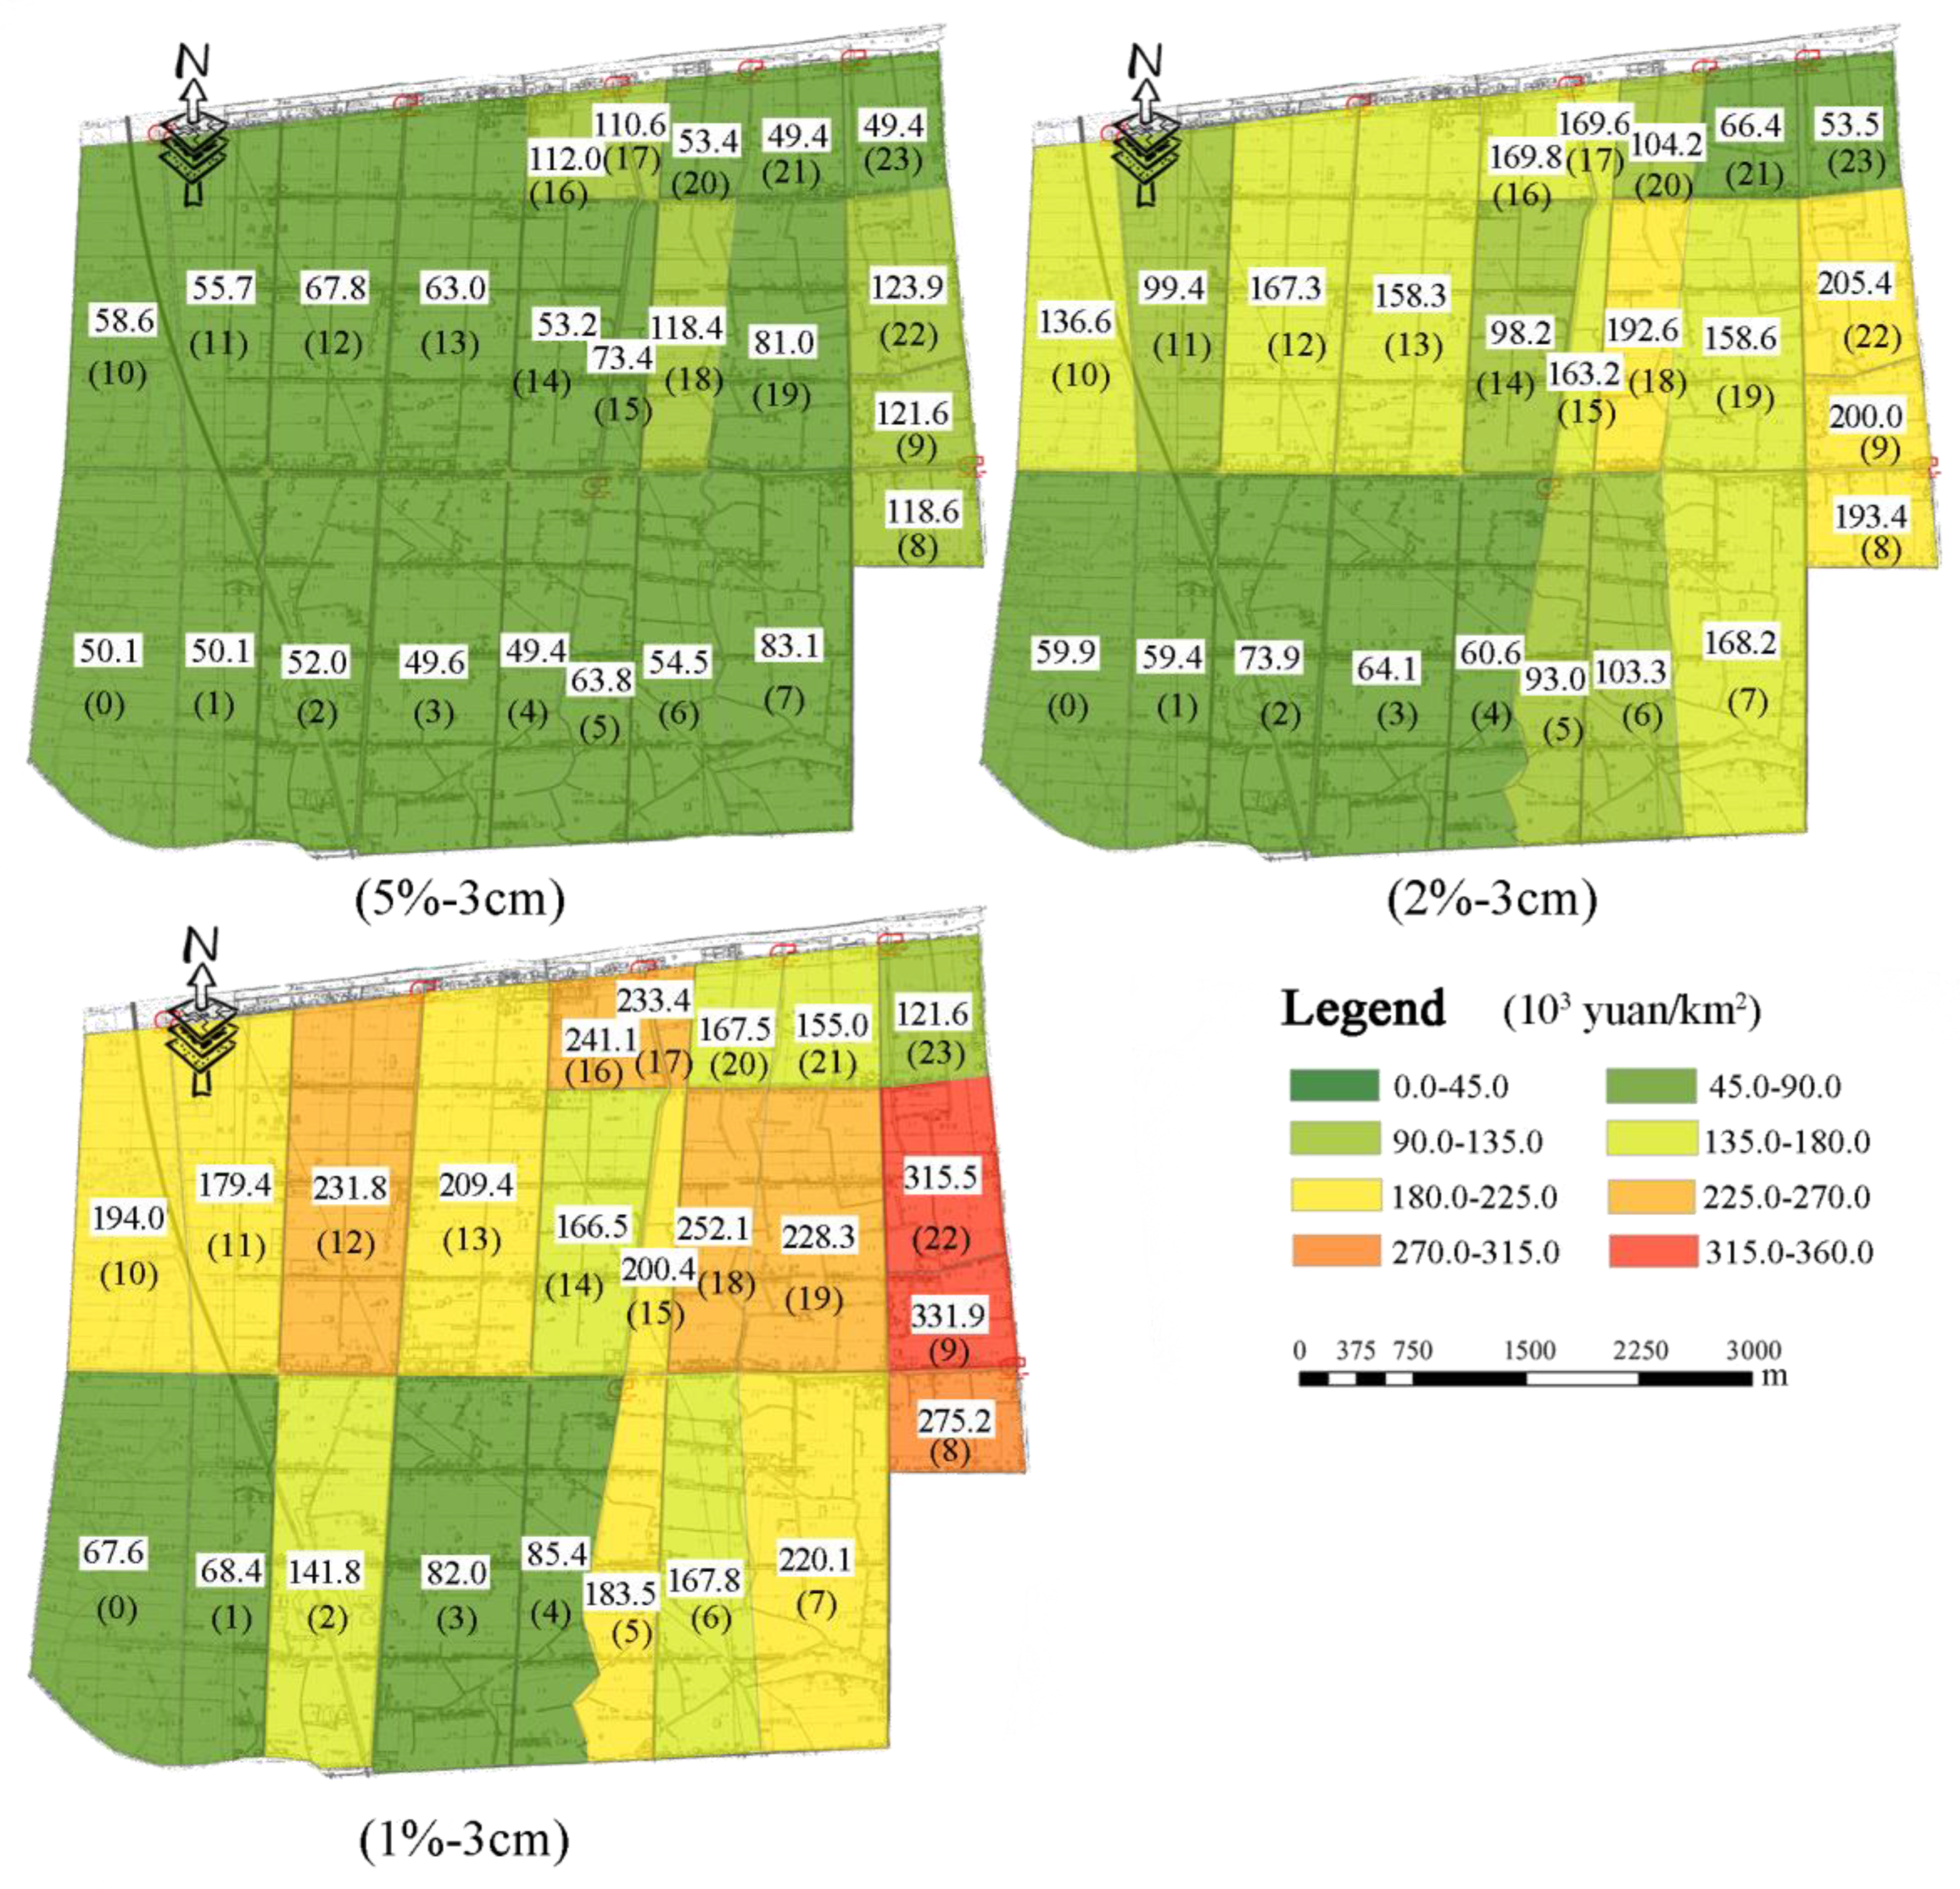
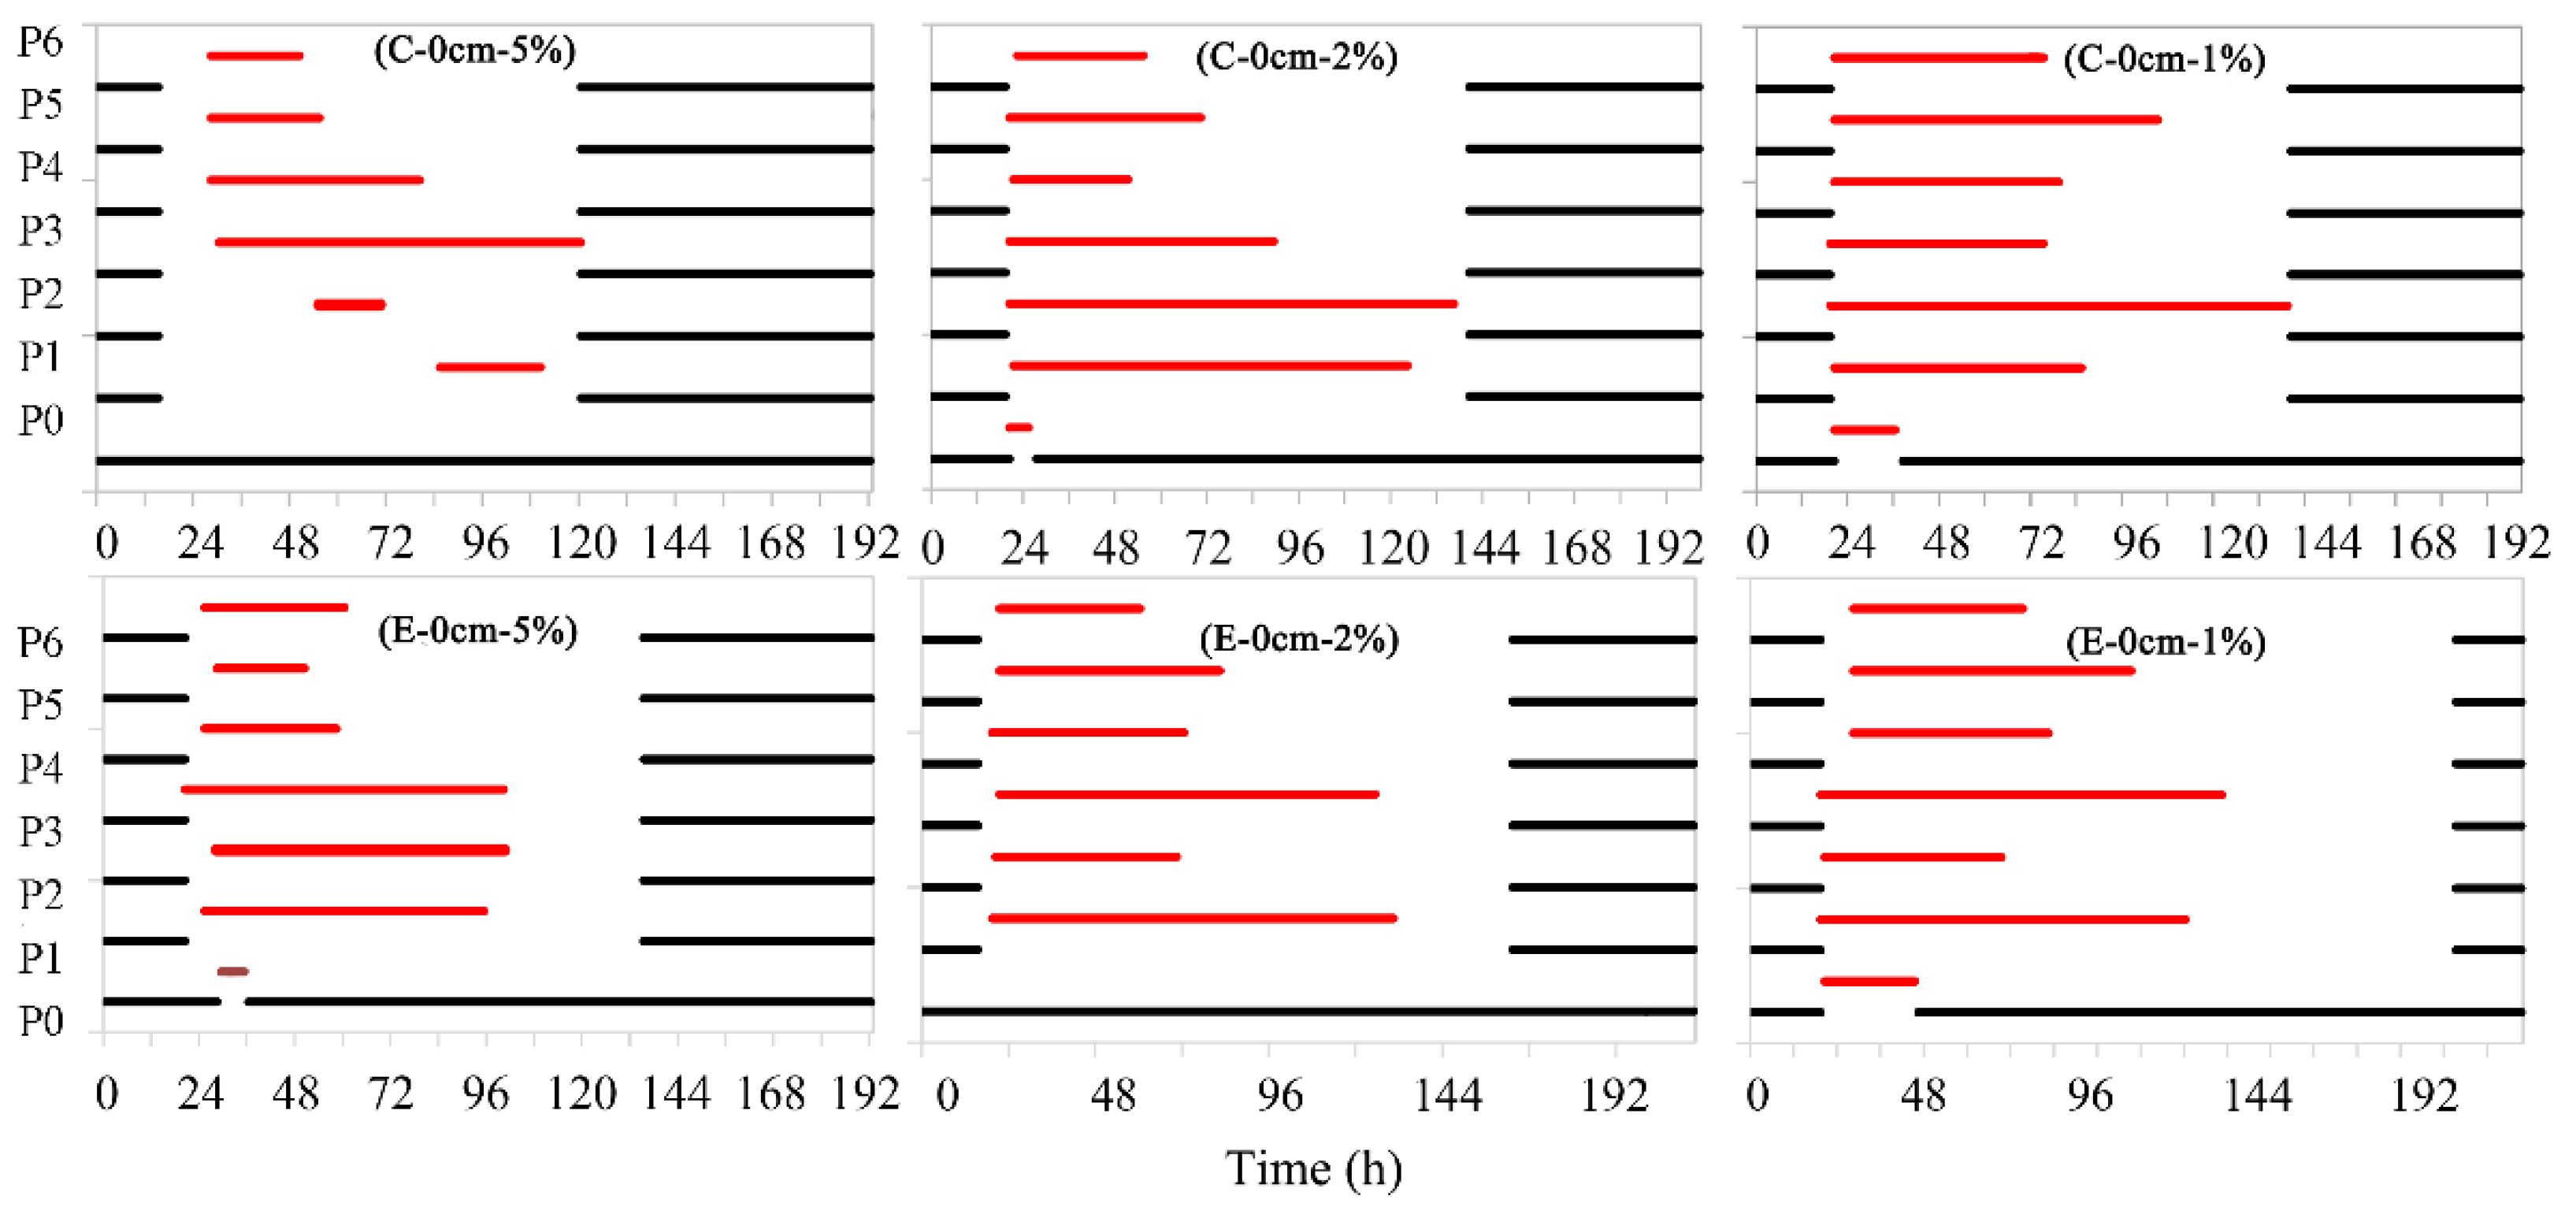
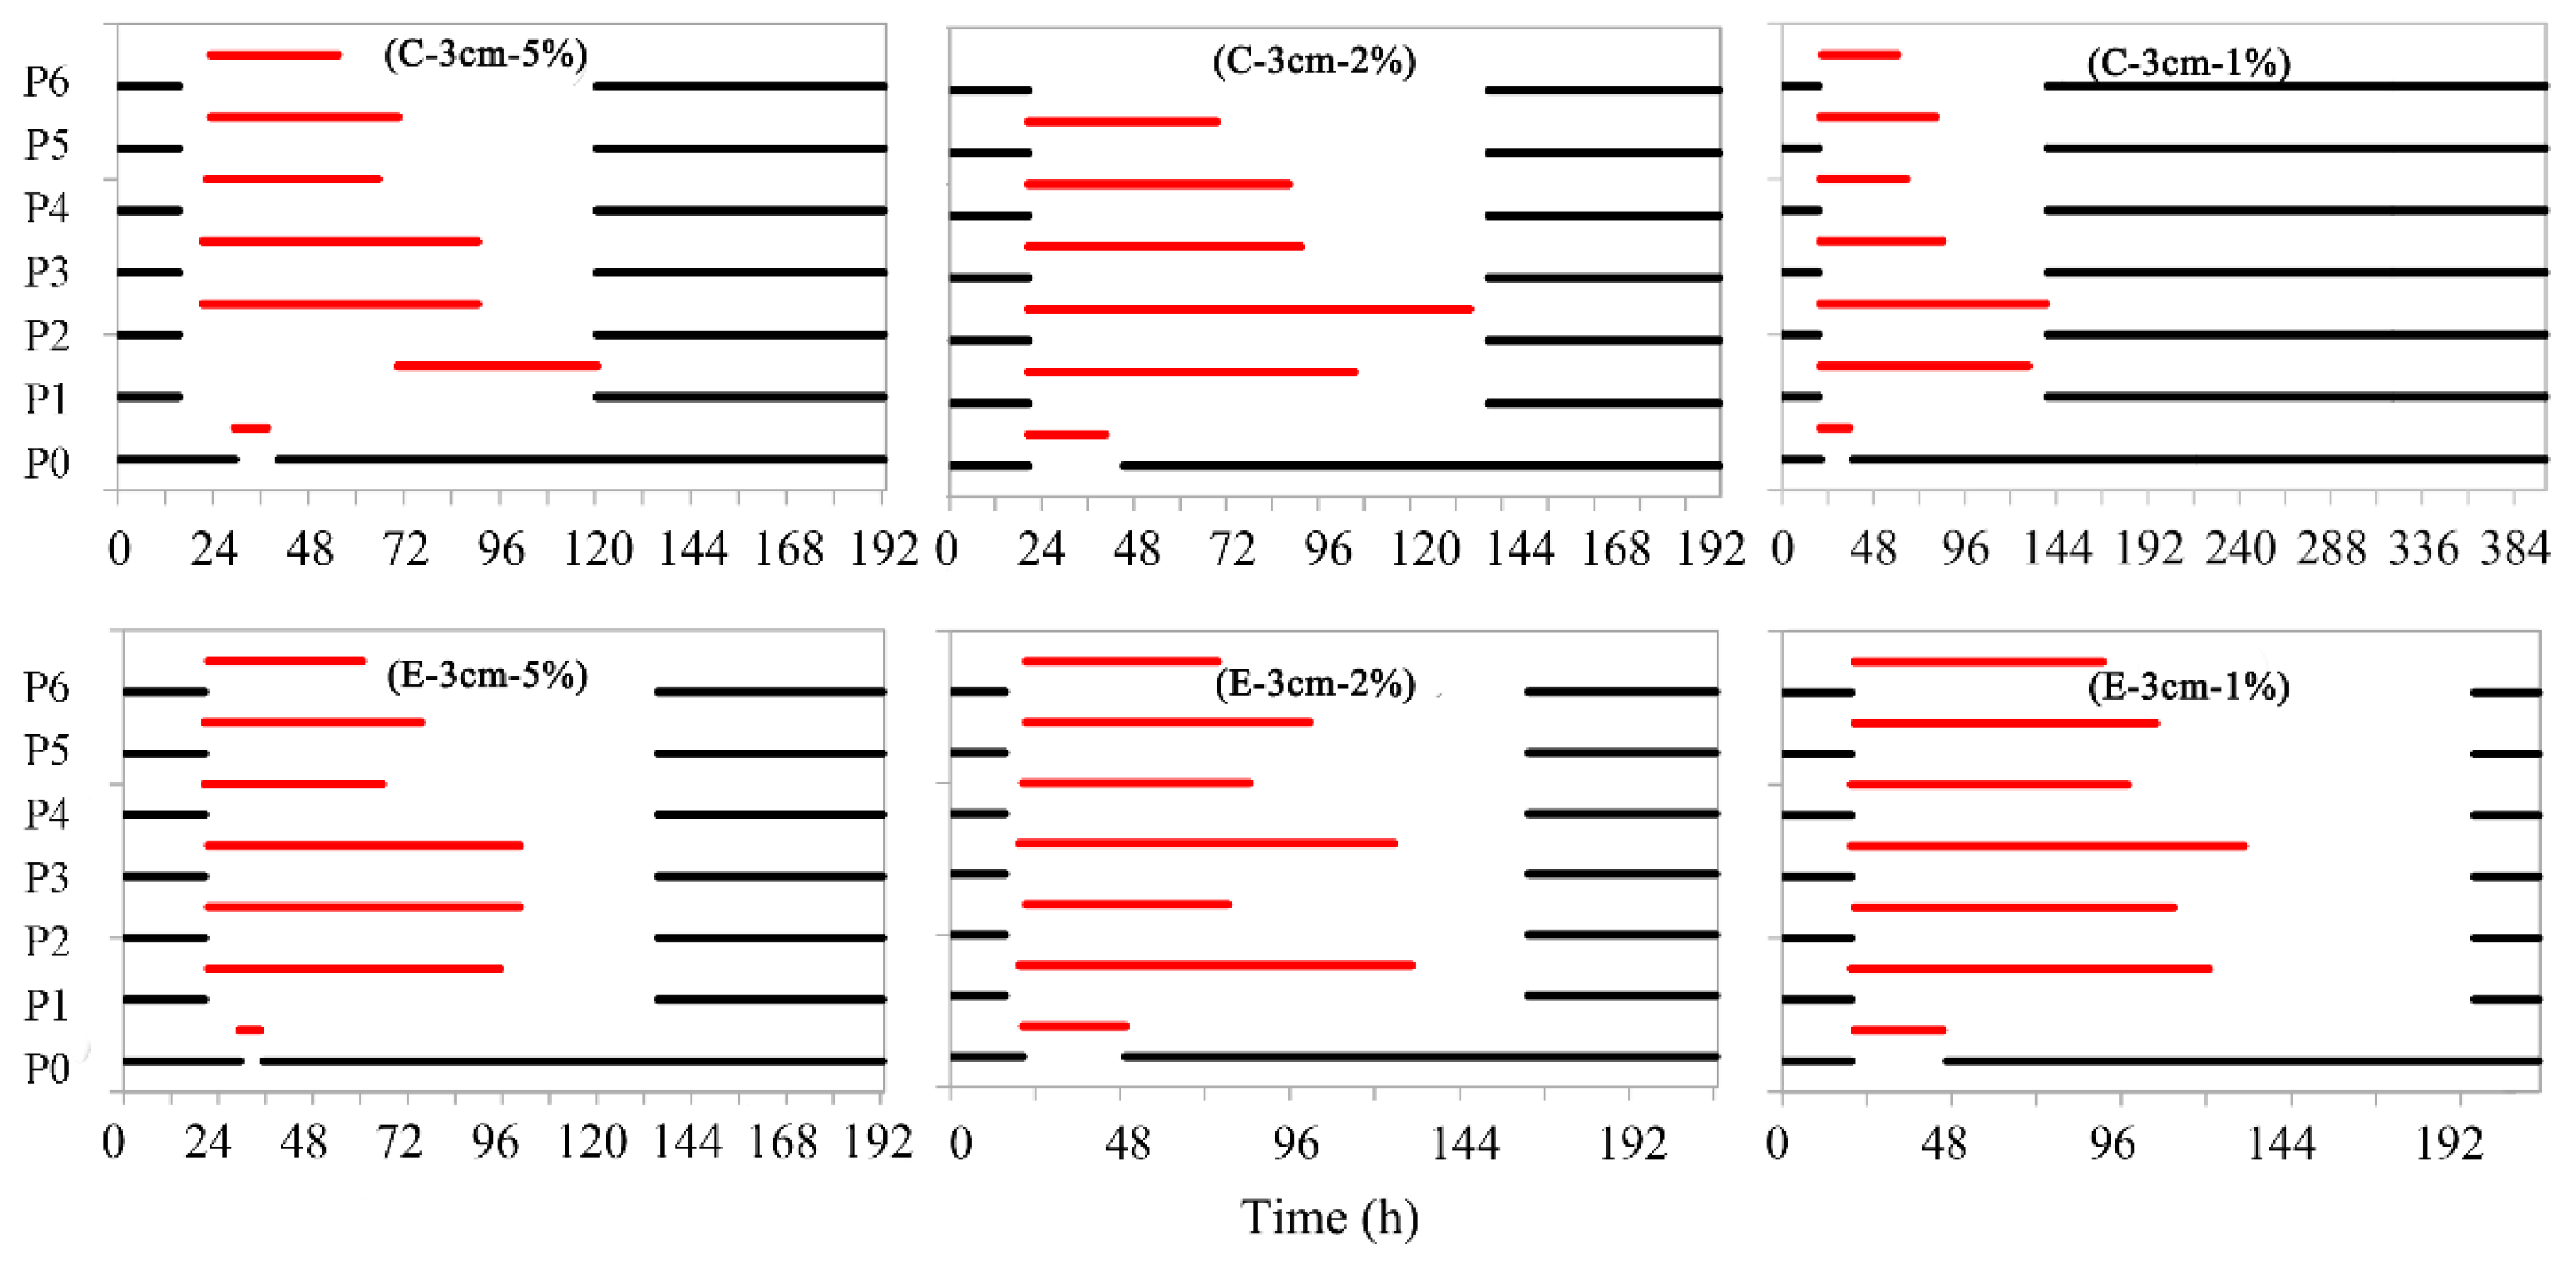
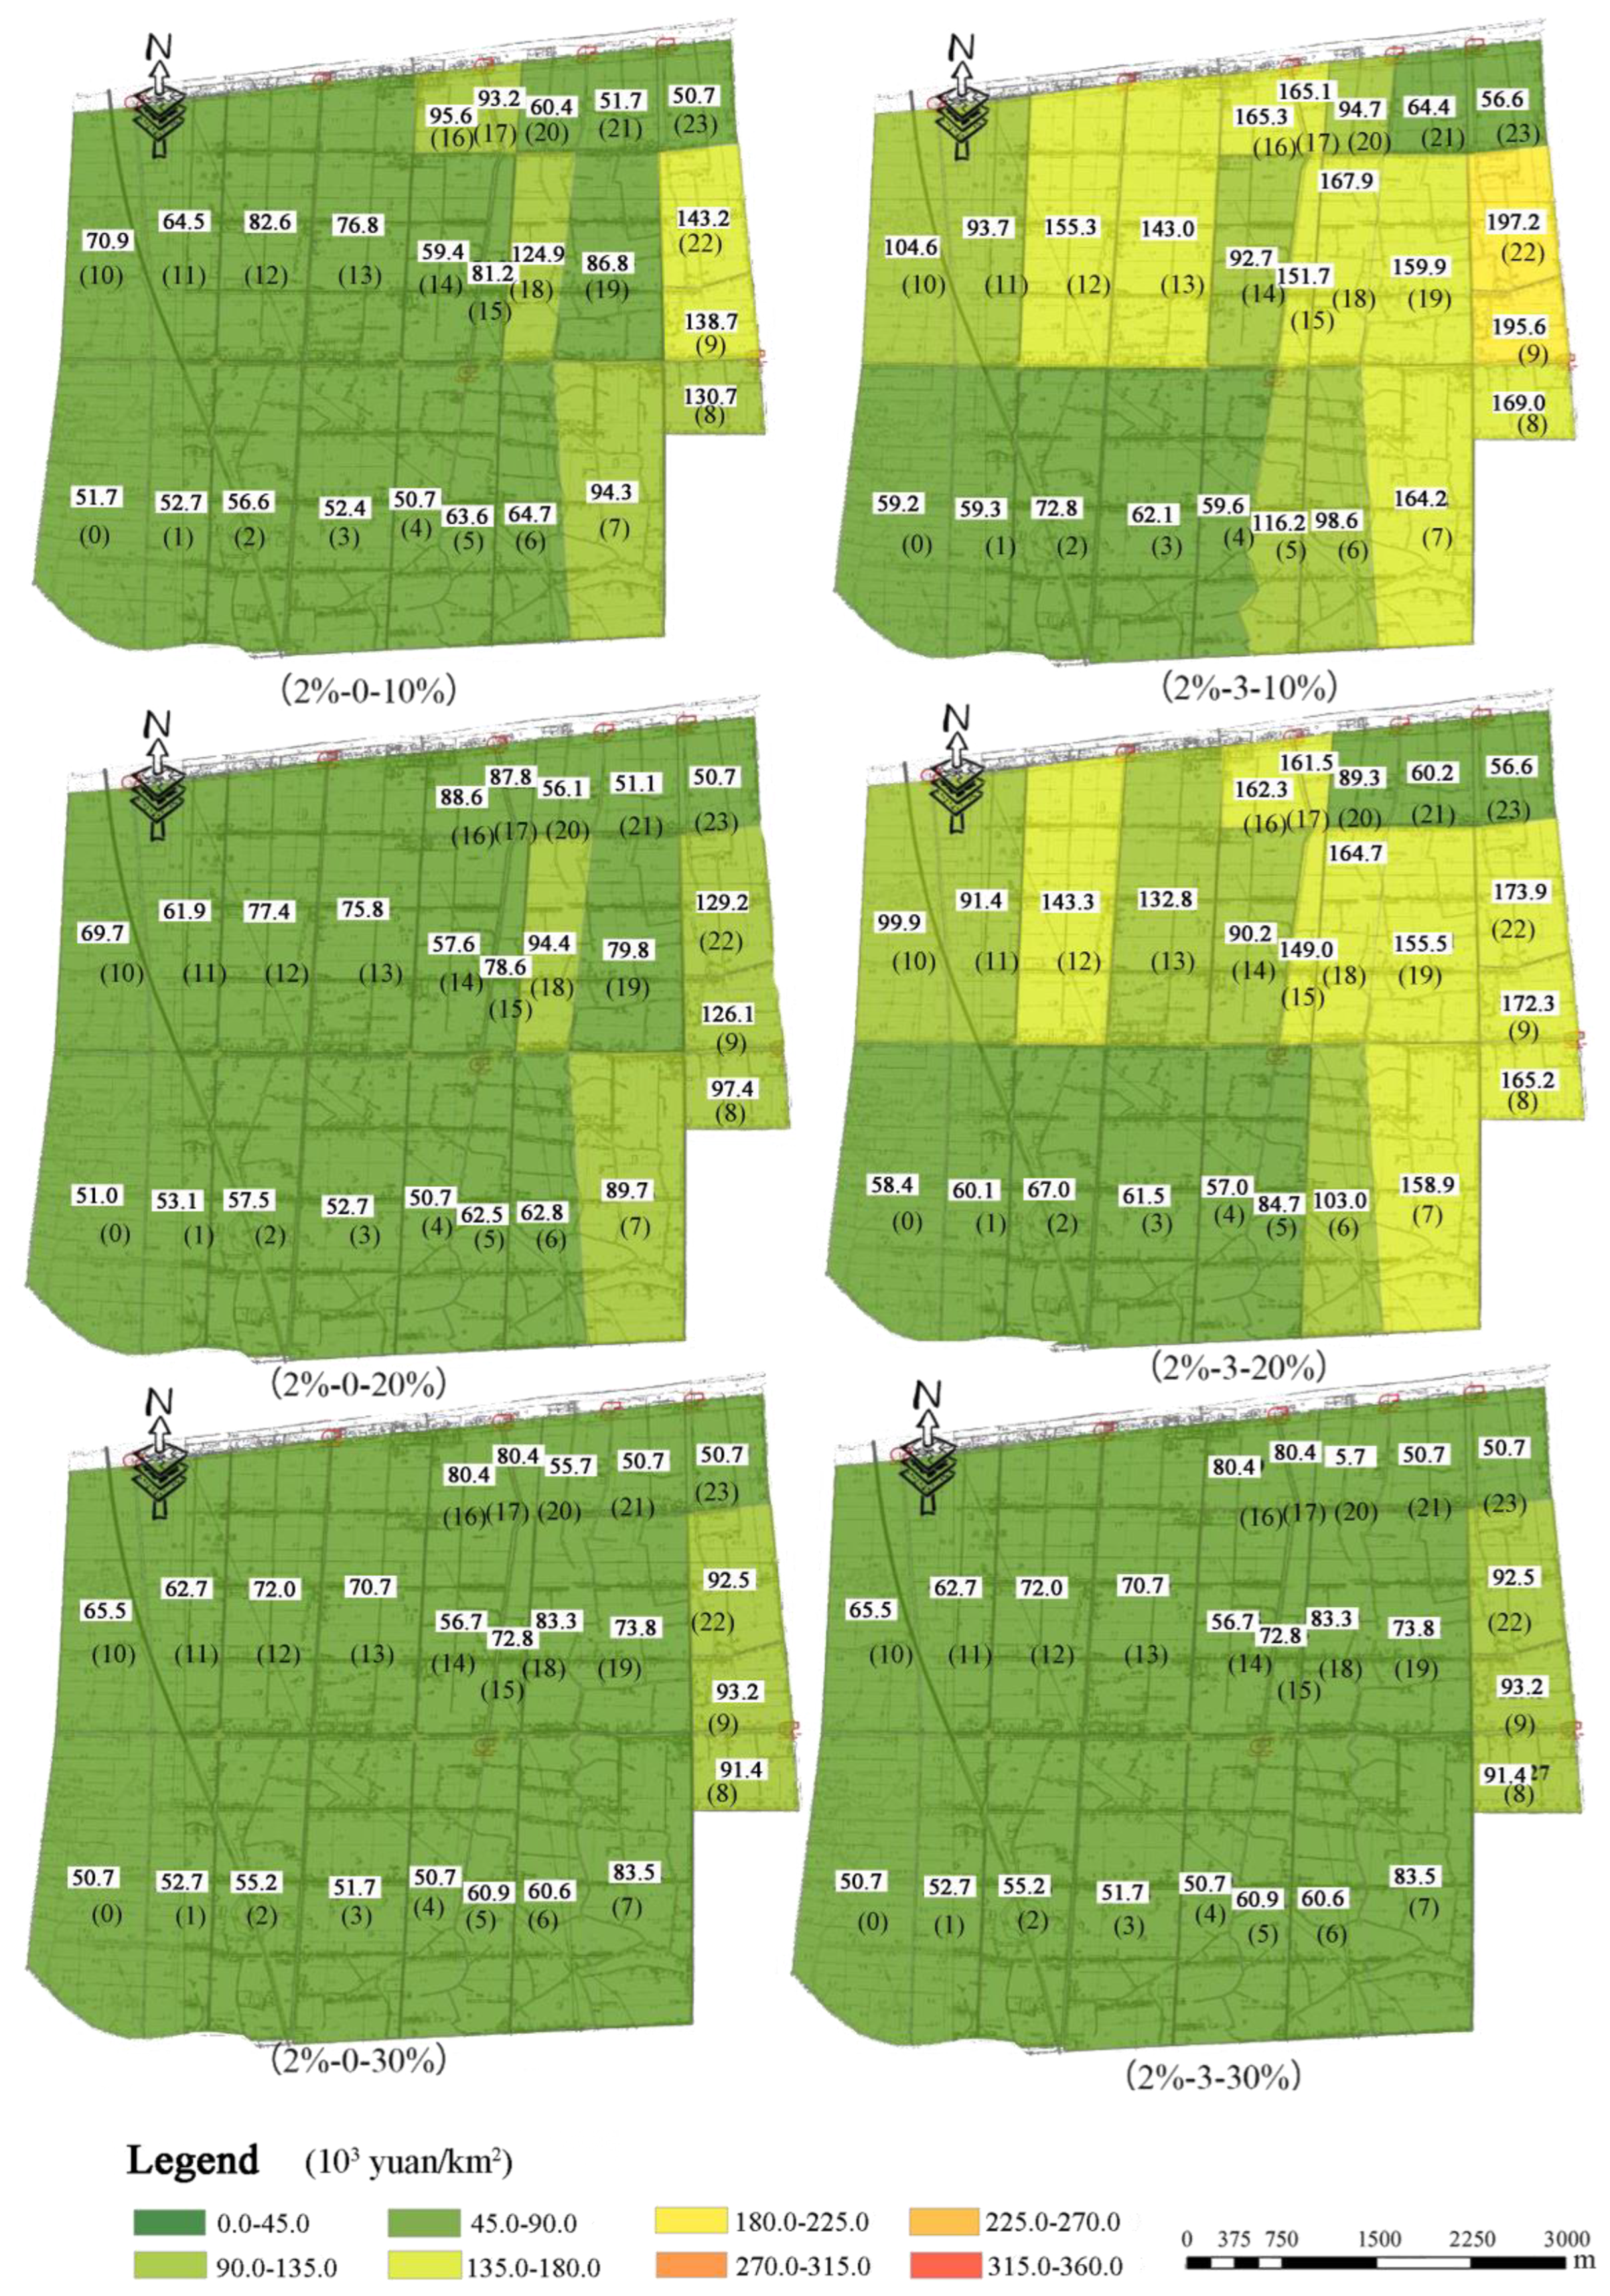
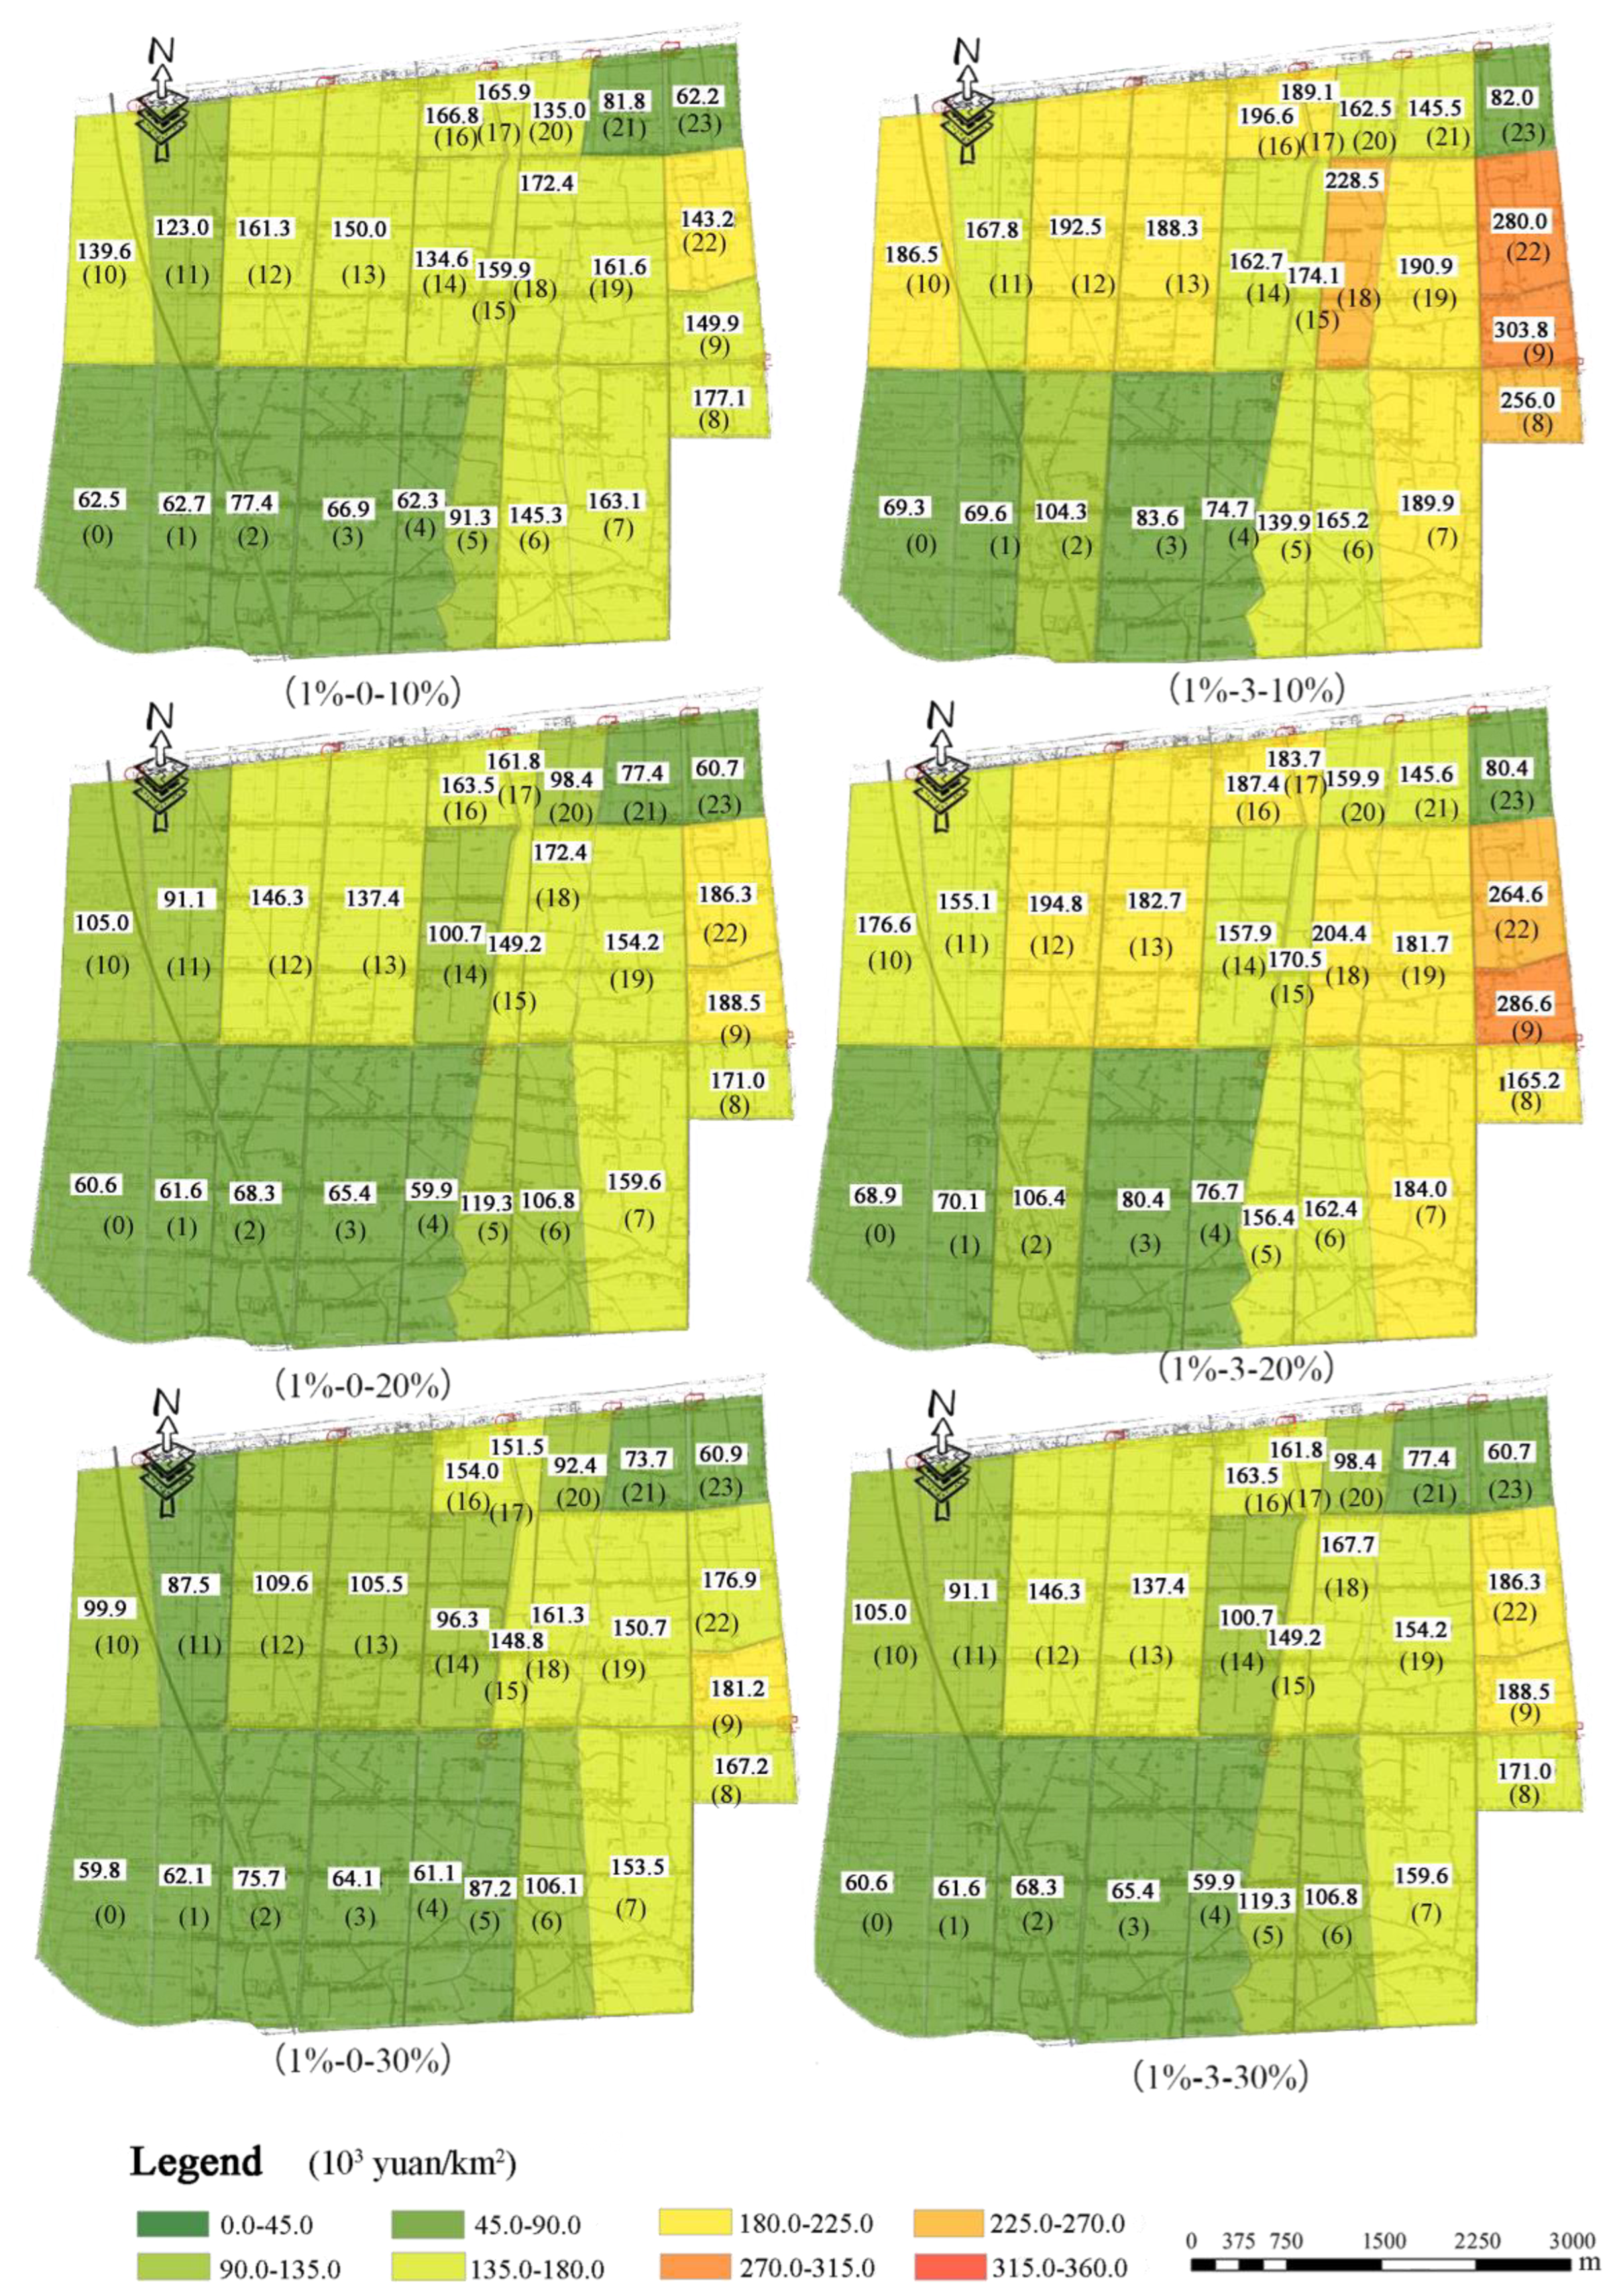
4.2. Effects of Initial Storage Depths on Flood Removal
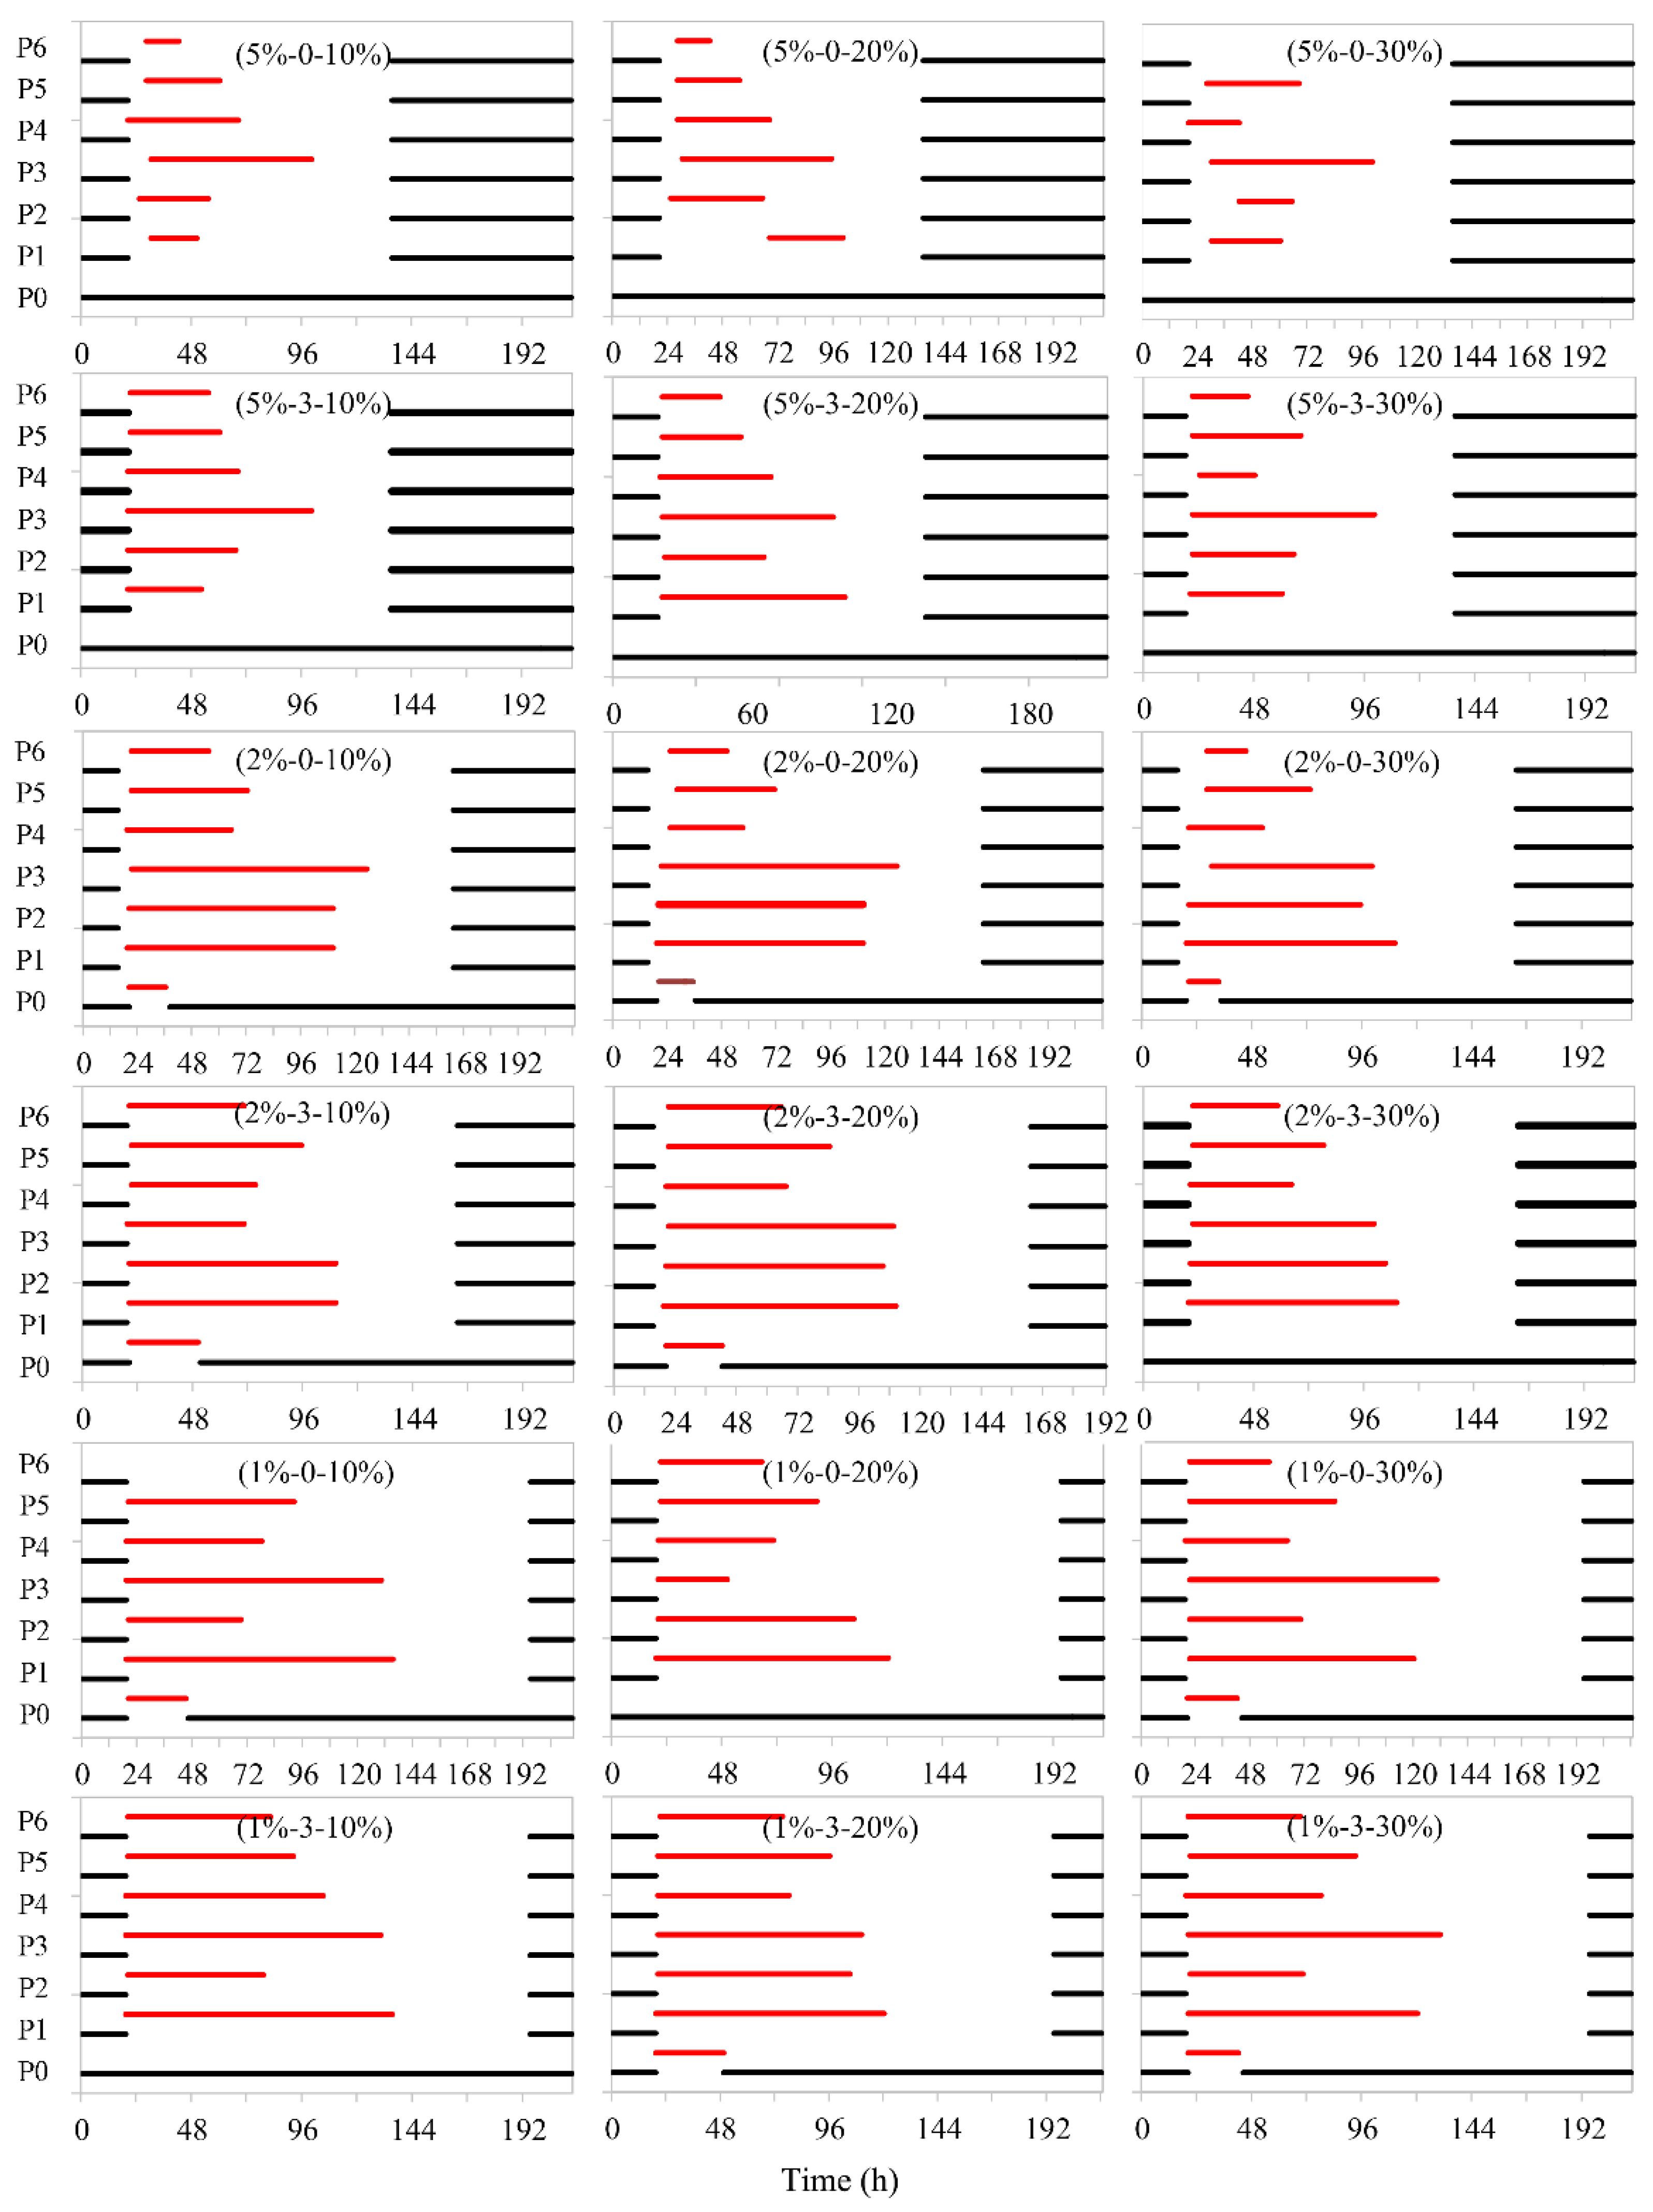
4.3. Effects of Drainage Capacity on Flood Removal
5. Conclusions
Author Contributions
Funding
Institutional Review Board Statement
Informed Consent Statement
Data Availability Statement
Acknowledgments
Conflicts of Interest
References
- Wijayanti, P.; Zhu, X.Q.; Hellegers, P.; Budiyono, Y.; van Ierland, E.C. Estimation of river flood damages in Jakarta, Indonesia. Nat. Hazards 2017, 86, 1059–1079. [Google Scholar] [CrossRef] [Green Version]
- Dellapenna, T.M.; Hoelscher, C.; Hill, L.; Critides, L.; Salgado, V.; Bell, M.; Al Mukaimi, M.E.; Du, J.B.; Park, K.; Knap, A.H. Hurricane Harvey Delivered a Massive Load of Mercury-Rich Sediment to Galveston Bay, TX, USA. Estuaries Coasts 2022, 45, 428–444. [Google Scholar] [CrossRef]
- Siegel, H.; Gerth, M. Satellite-based studies of the 1997 Oder flood event in the southern Baltic Sea. Remote Sens. Environ. 2000, 73, 207–217. [Google Scholar] [CrossRef]
- IPCC. 2021: Climate Change 2021: The Physical Science Basis. Contribution of Working Group I to the Sixth Assessment Report of the Intergovernmental Panel on Climate Change; Masson-Delmotte, V., Zhai, P., Pirani, A., Connors, S., Péan, C., Berger, S., Caud, N., Chen, Y., Goldfarb, L., Gomis, M., et al., Eds.; Cambridge University Press: Cambridge, UK; New York, NY, USA; 2391p. [CrossRef]
- Risser, M.D.; Wehner, M.F. Attributable Human-Induced Changes in the Likelihood and Magnitude of the Observed Extreme Precipitation during Hurricane Harvey. Geophys. Res. Lett. 2017, 44, 12457–12464. [Google Scholar] [CrossRef] [Green Version]
- Kong, F.; Shi, P.; Fang, J.; Lu, L.; Fang, J.; Guo, J. Advances and Prospects of Spatiotemporal Pattern Variation of Extreme Precipitation and its Affecting Factors under the Background of Global Climate Change. J. Catastrophology 2017, 32, 165–174. [Google Scholar]
- Prein, A.F.; Rasmussen, R.M.; Ikeda, K.; Liu, C.H.; Clark, M.P.; Holland, G.J. The future intensification of hourly precipitation extremes. Nat. Clim. Change 2017, 7, 48–52. [Google Scholar] [CrossRef]
- Westra, S.; Fowler, H.J.; Evans, J.P.; Alexander, L.V.; Berg, P.; Johnson, F.; Kendon, E.J.; Lenderink, G.; Roberts, N.M. Future changes to the intensity and frequency of short-duration extreme rainfall. Rev. Geophys. 2014, 52, 522–555. [Google Scholar] [CrossRef] [Green Version]
- Moustakis, Y.; Papalexiou, S.M.; Onof, C.J.; Paschalis, A. Seasonality, Intensity, and Duration of Rainfall Extremes Change in a Warmer Climate. Earth Future 2021, 9, 15. [Google Scholar] [CrossRef]
- Swain, D.L.; Wing, O.E.J.; Bates, P.D.; Done, J.M.; Johnson, K.A.; Cameron, D.R. Increased Flood Exposure Due to Climate Change and Population Growth in the United States. Earth Future 2020, 8, 17. [Google Scholar] [CrossRef]
- Reynard, N.S.; Kay, A.L.; Anderson, M.; Donovan, B.; Duckworth, C. The evolution of climate change guidance for fluvial flood risk management in England. Prog. Phys. Geogr. 2017, 41, 222–237. [Google Scholar] [CrossRef]
- Chen, L.-n.; Zhao, Z.-l.; Guo, G.-m.; Li, J.; Wu, W.-b.; Zhang, F.-x.; Zhang, X. Effects of muddy water irrigation with different sediment gradations on nitrogen transformation in agricultural soil of Yellow River Basin. Water Sci. Eng. 2022, 15, 228–236. [Google Scholar] [CrossRef]
- Stefanidis, S.; Alexandridis, V.; Theodoridou, T. Flood Exposure of Residential Areas and Infrastructure in Greece. Hydrology 2022, 9, 145. [Google Scholar] [CrossRef]
- Qiang, Y. Flood exposure of critical infrastructures in the United States. Int. J. Disaster Risk Reduct. 2019, 39, 101240. [Google Scholar] [CrossRef]
- Shrestha, B.B.; Okazumi, T.; Miyamoto, M.; Sawano, H. Flood damage assessment in the Pampanga river basin of the Philippines. J. Flood Risk Manag. 2016, 9, 355–369. [Google Scholar] [CrossRef]
- Piao, S.L.; Ciais, P.; Huang, Y.; Shen, Z.H.; Peng, S.S.; Li, J.S.; Zhou, L.P.; Liu, H.Y.; Ma, Y.C.; Ding, Y.H.; et al. The impacts of climate change on water resources and agriculture in China. Nature 2010, 467, 43–51. [Google Scholar] [CrossRef]
- Ministry of Water Resources of the People’s Republic of China. 2020 Bulletin on Flood and Drought Disaster Prevention in China; 27 September 2021; Ministry of Water Resources of the People’s Republic of China: Beijing, China, 2021. [Google Scholar]
- Kundzewicz, Z.W.; Su, B.D.; Wang, Y.J.; Xia, J.; Huang, J.L.; Jiang, T. Flood risk and its reduction in China. Adv. Water Resour. 2019, 130, 37–45. [Google Scholar] [CrossRef]
- Han, L.F.; Xu, Y.P.; Pan, G.B.; Deng, X.J.; Hu, C.S.; Xu, H.L.; Shi, H.Y. Changing properties of precipitation extremes in the urban areas, Yangtze River Delta, China, during 1957-2013. Nat. Hazards 2015, 79, 437–454. [Google Scholar] [CrossRef]
- Samantaray, D.; Chatterjee, C.; Singh, R.; Gupta, P.K.; Panigrahy, S. Flood risk modeling for optimal rice planning for delta region of Mahanadi river basin in India. Nat. Hazards 2015, 76, 347–372. [Google Scholar] [CrossRef]
- Li, W.J.; Xu, B.; Wen, J.H. Scenario-based community flood risk assessment: A case study of Taining county town, Fujian province, China. Nat. Hazards 2016, 82, 193–208. [Google Scholar] [CrossRef]
- Knebl, M.R.; Yang, Z.L.; Hutchison, K.; Maidment, D.R. Regional scale flood modeling using NEXRAD rainfall, GIS, and HEC-HMS/RAS: A case study for the San Antonio River Basin Summer 2002 storm event. J. Environ. Manag. 2005, 75, 325–336. [Google Scholar] [CrossRef]
- Farooq, M.; Shafique, M.; Khattak, M.S. Flood hazard assessment and mapping of River Swat using HEC-RAS 2D model and high-resolution 12-m TanDEM-X DEM (WorldDEM). Nat. Hazards 2019, 97, 477–492. [Google Scholar] [CrossRef]
- Horritt, M.S.; Bates, P.D. Evaluation of 1D and 2D numerical models for predicting river flood inundation. J. Hydrol. 2002, 268, 87–99. [Google Scholar] [CrossRef]
- Hu, C.H.; Guo, S.L.; Xiong, L.H.; Peng, D.Z. A modified Xinanjiang model and its application in northern China. Nord. Hydrol. 2005, 36, 175–192. [Google Scholar] [CrossRef]
- Patro, S.; Chatterjee, C.; Mohanty, S.; Singh, R.; Raghuwanshi, N.S. Flood Inundation Modeling using MIKE FLOOD and Remote Sensing Data. J. Indian Soc. Remote Sens. 2009, 37, 107–118. [Google Scholar] [CrossRef]
- Hashino, M.; Yao, H.; Yoshida, H. Studies and evaluations on interception processes during rainfall based on a tank model. J. Hydrol. 2002, 255, 1–11. [Google Scholar] [CrossRef]
- Chen, R.S.; Pi, L.C.; Huang, Y.H. Analysis of rainfall-runoff relation in paddy fields by diffusive tank model. Hydrol. Process. 2003, 17, 2541–2553. [Google Scholar] [CrossRef]
- Uniyal, B.; Dietrich, J. Simulation of Irrigation Demand and Control in Catchments—A Review of Methods and Case Studies. Water Resour. Res. 2021, 57, 21. [Google Scholar] [CrossRef]
- Xiu, H.; Wu, L. Hydrodynamic Research of Flood Routing in the Plain River Network Based on MIKE II. South-North Water Divers. Water Sci. Technol. 2012, 10, 151–154. [Google Scholar]
- Ruiju, L.; Wcnhui, C.; Wenxiang, C.; Xieyao, M. Hydrological system model for Taihu lake drainage basin. Lake Sci. 1993, 5, 99–107. [Google Scholar] [CrossRef] [Green Version]
- Patel, D.P.; Ramirez, J.A.; Srivastava, P.K.; Bray, M.; Han, D.W. Assessment of flood inundation mapping of Surat city by coupled 1D/2D hydrodynamic modeling: A case application of the new HEC-RAS 5. Nat. Hazards 2017, 89, 93–130. [Google Scholar] [CrossRef] [Green Version]
- Chen, G.; Wang, C.H.; Fang, X.; Li, X.N.; Zhang, P.N.; Hua, W.J. Distributed-Framework Basin Modeling System: IV. Application in Taihu Basin. Water 2021, 13, 611. [Google Scholar] [CrossRef]
- Hu, Z.J.; Wang, L.L.; Tang, H.W.; Qi, X.M. Prediction of the future flood severity in plain river network region based on numerical model: A case study. J. Hydrodyn. 2017, 29, 586–595. [Google Scholar] [CrossRef]
- Shikasho, S.; Tanaka, K. Runoff Analysis of Low-Lying Drainage Basins in Japan. J. Irrig. Eng. Rural Plan. 1985, 1985, 5–17. [Google Scholar] [CrossRef]
- Chen, R.S.; Pi, L.C. Application of diffusive tank model in drainage analysis of paddy fields. J. Am. Water Resour. Assoc. 2004, 40, 33–41. [Google Scholar] [CrossRef]
- Xiong, Y.; Liu, Z.; Liu, F.; Yuan, N.; Fu, H. The Waterlogging Process Model in the Paddy Fields of Flat Irrigation Districts. Water 2021, 13, 2668. [Google Scholar] [CrossRef]
- Sampson, J.R. Adaptation in natural and artificial systems (John H. Holland). SIAM Rev. 1976, 18, 529–530. [Google Scholar] [CrossRef]
- Liu, Z.; Xiong, Y.; Xu, J.; Yang, S.; Jiang, Z.; Liu, F. Optimal Operation Model of Drainage Works for Minimizing Waterlogging Loss in Paddy Fields. Water 2021, 13, 2811. [Google Scholar] [CrossRef]
- Zeng, L.H.; Lesch, S.M.; Grieve, C.M. Rice growth and yield respond to changes in water depth and salinity stress. Agric. Water Manag. 2003, 59, 67–75. [Google Scholar] [CrossRef]
- Liu, Z.; Xiong, Y.; Fan, L.; Xu, J. Waterlogging Loss Evaluation Model for Waterlogging Process at Flat Irrigation District. Water Sav. Irrig. 2021, 11, 20–24. [Google Scholar] [CrossRef]
- Moriasi, D.N.; Arnold, J.G.; Van Liew, M.W.; Bingner, R.L.; Harmel, R.D.; Veith, T.L. Model evaluation guidelines for systematic quantification of accuracy in watershed simulations. Trans. ASABE 2007, 50, 885–900. [Google Scholar] [CrossRef]
- Schaefli, B.; Gupta, H.V. Do Nash values have value? Hydrol. Process. 2007, 21, 2075–2080. [Google Scholar] [CrossRef]
- Xiong, Y.; Xu, J.; Li, Y.; Li, J.a.; Sun, Y. Modeling waterlogging process of paddy field at flat irrigation district in south China. J. Drain. Irrig. Mach. Eng. 2018, 36, 725–731. [Google Scholar]
- Yan, D.H.; Wu, D.; Huang, R.; Wang, L.N.; Yang, G.Y. Drought evolution characteristics and precipitation intensity changes during alternating dry-wet changes in the Huang-Huai-Hai River basin. Hydrol. Earth Syst. Sci. 2013, 17, 2859–2871. [Google Scholar] [CrossRef] [Green Version]
- Gu, X.Z.; Ye, L.; Xin, Q.; Zhang, C.; Zeng, F.Z.; Nerantzaki, S.D.; Papalexiou, S.M. Extreme Precipitation in China: A Review on Statistical Methods and Applications. Adv. Water Resour. 2022, 163, 20. [Google Scholar] [CrossRef]
- SL 44-2006; Regulation for Calculating Design Flood of Water Resources and Hydropower Projects. Ministry of Water Resources of the People’s Republic of China: Beijing, China, 2006.
- Wen, X.; Fang, G.H.; Qi, H.S.; Zhou, L.; Gao, Y.Q. Changes of temperature and precipitation extremes in China: Past and future. Theor. Appl. Climatol. 2016, 126, 369–383. [Google Scholar] [CrossRef]
- Yuan, Z.; Yang, Z.Y.; Yan, D.H.; Yin, J. Historical changes and future projection of extreme precipitation in China. Theor. Appl. Climatol. 2017, 127, 393–407. [Google Scholar] [CrossRef]
- Xu, J.Z.; Peng, S.Z.; Yang, S.H.; Wang, W.G. Ammonia volatilization losses from a rice paddy with different irrigation and nitrogen managements. Agric. Water Manag. 2012, 104, 184–192. [Google Scholar] [CrossRef]
- Shao, C.; Pan, X.; Li, J.; Wei, P.; Zhang, X.; Hu, Q.; Ren, J. Effects of flooding duration in different growth stages on growth and yield component of rice. Trans. Chin. Soc. Agric. Eng. 2019, 35, 125–133. [Google Scholar]
- Wu, Q.; Yang, W.; Zhu, J.; Wang, Z.; Ye, H. Response of hybrid rice to flooding and establishment of drainage index. Resour. Environ. Yangtze Basin 2014, 23, 875–882. [Google Scholar]


| Module | Parameters | Value | Source |
|---|---|---|---|
| Waterlogging process | h11, Height of upper hole in 1st layer | 0.047 m | Calibration by measured rainfall data and water level data of the paddy field |
| b1, b2, Weir width per unit area in 1st layer | b1:0.000014 m−1; b2: 0.00076 m−1 | ||
| β1, Infiltration coefficient in1st layer | 0.008 | ||
| α21, α22, Outflow coefficient in 2nd layer | α21: 0.41 α22: 0.019 | ||
| h21, h22, Height of upper hole in 2nd layer | h21: 0.50 m. h22: 0.40 m | ||
| β2, Infiltration coefficient in 2nd layer | 0.032 | ||
| Waterlogging loss estimation | 1.05 kg/m2 | Collected from Agricultural Bureau, Gaoyou, China | |
| 3 yuan/kg | |||
| , H is the percentage of flooded water depth to plant height, %; T is flooded duration, day; a, b and c are parameters of the model. | a = 36.909, b = 2.084, c = 0.437 | calibrated by data collected from Jiangsu Province, and the model was verified by Xiong [44] | |
| Optimal operation | Generation Number | 200 | The parameter of the genetic algorithm refers to the research |
| Individual Number | 50 | ||
| Chromosome Number | 16 | ||
| Mutation Rate | 0.1 | ||
| Crossover rate | 0.6 |
| Scenario | Frequency | Crop Loss | Pump Fee | Total Loss |
|---|---|---|---|---|
| Extreme | 5% | 1881.2 | 69.6 | 1950.8 |
| 2% | 3039.3 | 97.7 | 3137 | |
| 1% | 4709.2 | 109.0 | 4818.2 | |
| Current | 5% | 0 | 56.5 | 56.5 |
| 2% | 2261.7 | 69.2 | 2330.9 | |
| 1% | 2772.7 | 88.2 | 2860.9 |
| Scenario (a-b 1) | Crop Loss | Pump Fee | Total Loss |
|---|---|---|---|
| 5%-0 | 0.0 | 43.3 | 43.3 |
| 5%-3 | 0.0 | 56.5 | 56.5 |
| 2%-0 | 1447.2 | 67.0 | 1514.1 |
| 2%-3 | 2261.7 | 69.2 | 2330.9 |
| 1%-0 | 1801.8 | 86.6 | 1888.4 |
| 1%-3 | 2772.7 | 88.2 | 2860.9 |
| Scenario | Waterlogging Loss (103 Yuan) | ||||
|---|---|---|---|---|---|
| Work Scale | Initial Storage Depth | Rainfall Frequency | Pump Fee | Crop Loss | Total Loss |
| current | 3 cm | 5% | 69.6 | 1881.2 | 1950.8 |
| 2% | 97.7 | 3339.3 | 3437.0 | ||
| 1% | 109.0 | 4909.2 | 5018.2 | ||
| 0 cm | 5% | 52.4 | 1377.5 | 1429.8 | |
| 2% | 77.4 | 2234.4 | 2311.8 | ||
| 1% | 90.6 | 3610.5 | 3701.1 | ||
| Increased by 10% | 3 cm | 5% | 59.3 | 1837.8 | 1897.1 |
| 2% | 95.5 | 3168.1 | 3263.6 | ||
| 1% | 108.4 | 4373.1 | 4481.5 | ||
| 0 cm | 5% | 45.9 | 1307.5 | 1353.4 | |
| 2% | 82.2 | 2081.2 | 2163.4 | ||
| 1% | 100.9 | 3451.2 | 3552.1 | ||
| Increased by 20% | 3 cm | 5% | 65.6 | 1748.9 | 1814.5 |
| 2% | 97.4 | 3007.9 | 3105.3 | ||
| 1% | 113.3 | 4241.4 | 4354.7 | ||
| 0 cm | 5% | 47.8 | 1271.5 | 1319.2 | |
| 2% | 79.6 | 1968.1 | 2047.6 | ||
| 1% | 90.1 | 3144.4 | 3234.5 | ||
| Increased by 30% | 3 cm | 5% | 62.7 | 1628.1 | 1690.8 |
| 2% | 92.5 | 2810.2 | 2902.7 | ||
| 1% | 115.6 | 3144.4 | 3260.0 | ||
| 0 cm | 5% | 48.4 | 1209.6 | 1257.9 | |
| 2% | 77.6 | 1837.8 | 1915.4 | ||
| 1% | 101.8 | 2920.3 | 3022.1 | ||
Disclaimer/Publisher’s Note: The statements, opinions and data contained in all publications are solely those of the individual author(s) and contributor(s) and not of MDPI and/or the editor(s). MDPI and/or the editor(s) disclaim responsibility for any injury to people or property resulting from any ideas, methods, instructions or products referred to in the content. |
© 2023 by the authors. Licensee MDPI, Basel, Switzerland. This article is an open access article distributed under the terms and conditions of the Creative Commons Attribution (CC BY) license (https://creativecommons.org/licenses/by/4.0/).
Share and Cite
Liu, Z.; Xiong, Y.; Xu, J. Flood Simulation and Flood Risk Reduction Strategy in Irrigated Areas. Water 2023, 15, 192. https://doi.org/10.3390/w15010192
Liu Z, Xiong Y, Xu J. Flood Simulation and Flood Risk Reduction Strategy in Irrigated Areas. Water. 2023; 15(1):192. https://doi.org/10.3390/w15010192
Chicago/Turabian StyleLiu, Zhenyang, Yujiang Xiong, and Junzeng Xu. 2023. "Flood Simulation and Flood Risk Reduction Strategy in Irrigated Areas" Water 15, no. 1: 192. https://doi.org/10.3390/w15010192